
Water Resource Management and Sustainability: A Case Study in Faafu Atoll in the Republic of Maldives
by
 ,
,
Maurizio Filippo Acciarri
1,* ,
,
Silvia Checola
2,
Paolo Galli
3, 
Giacomo Magatti
4 and
Silvana Stefani
5 1
Department of Materials Science, Università degli Studi di Milano Bicocca, 20126 Milan, Italy
2
REF-E S.R.L., 20123 Milan, Italy
3
MaRHE Center, Università degli Studi di Milano-Bicocca, 20126 Milan, Italy
4
Department of Earth and Environmental Sciences, Università degli Studi di Milano Bicocca, 20126 Milan, Italy
5
Department of Statistics and Quantitative Methods, Università degli Studi di Milano Bicocca, 20126 Milan, Italy
*
Author to whom correspondence should be addressed.
Sustainability 2021, 13(6), 3484; https://doi.org/10.3390/su13063484
Submission received: 11 February 2021
/
Revised: 14 March 2021
/
Accepted: 15 March 2021
/
Published: 22 March 2021
(This article belongs to the Special Issue Risk-Informed Sustainable Development in the Rural Tropics)
Abstract
:This paper contributes to the existing literature in proposing an integrated approach to water management and energy renewable production in a fragile environment. After the 2004 tsunami, in many outer islands in The Republic of Maldives, the lens freshwater natural reservoir was deeply damaged. Currently, the populations of rural atolls use rainwater and water in plastic bottles imported from the mainland for drinking. To provide safe and sustainable drinking water, we analyze the feasibility of two different actions: a desalination system fed by a diesel plant or by a photovoltaic (PV) plant with batteries. The current situation (business as usual, (BAU)) is also evaluated and taken as a benchmark. After illustrating the technical and economic features of desalination and PV plants, a financial and environmental analysis is conducted on the two alternatives plus BAU, showing that the desalination fed by the PV plant results in optimization both on the financial and the environmental side. The levelized cost of water (LCOW) and the CO2 levelized emissions of water (LEOW) are calculated for each alternative. The case study is developed in Magoodhoo Island, Faafu Atoll and can be extended to other islands in The Republic of Maldives and in general to small island developing states (SIDS).
1. Introduction
Most of the small island developing states (SIDS), to which The Republic of Maldives (in short, The Maldives) belongs, share similar sustainable development challenges: a small but increasing population, vulnerability to external shocks, strong dependence on import trade, and a fragile environment [1]. Development is a need and many SIDS now recognize, as a primary objective, the move towards low carbon sustainable economies [1], while at the same time improving the standard of living of the local population.
Moreover, islands enjoy generally beautiful sceneries, fishing resources and unique natural settings that must be preserved and guaranteed for future generations.
As reported by the Asian Development Bank [2] in November 2020, the tourism industry comprises around 25% of the national gross domestic product (GDP) in SIDS. In [3], a road map establishes the guidelines to transition from a fossil-fuel- based energy sector to a cost-effective, business-competitive, affordable, and sustainable renewable energy. This scenario forecasts a continuous and sustained moderate transformation of the energy matrix that will result in 29% of fossil fuels being reduced compared to a business-as-usual situation. As recently reported by IEA [4], the share of renewables in global world electricity generation is nearly 28% in 2020, but there are important differences among countries.
Even though it is almost universally recognized that renewable energies must gradually substitute fossil fuels [5], the use of renewables on small islands is still quite low based on high transaction costs and poor knowledge of the market potential [6].
Electricity is also dependent on imported fuel, and the level of CO2 emissions is quite high [7]. Taking the Magoodhoo island in The Maldives as a case study, our aim is to analyze an important issue: the coupled nexus water/energy, and to show that feasible solutions are possible, from the financial and environmental point of view.
Scarcity of energy and water are among the major drawbacks for SIDS [8]. This is particularly the case of many outer islands in The Maldives, where, since the 2004 tsunami, the lens freshwater natural reservoir has been damaged, leading to a significant increase in costs as well as an increase in the scarcity of drinking water.
In [9], an extensive review of the recent situation of SIDS is illustrated. Like many SIDS all over the world, The Maldives depends upon imported conventional sources of energy, and scarcity of water severely restricts economic and social development. As far as energy is concerned, the dependence on fossil fuels makes SIDS vulnerable to oil price rises with a significant impact on the local economy. Energy systems and water supply are closely coupled, and the nexus is particularly relevant in SIDS. The ultimate goal is to make SIDS independent from the mainland in energy and water. A desalination system, combined with renewable energy, can definitely be the solution for solving the scarcity of water and contributing to the reduction of pollution from fossil fuels.
In [10], 1087 islands are classified with the use of a cluster analysis according to climatic as well as physical and socio-economic parameters. The conjecture is that an energy supply system proven to be successful on one island could also be successfully implemented on another island.
From the literature analysis, it is quite evident that in SIDS, an energy transition to more sustainable energy sources is desirable and different studies state that the transition should take place in the next few years [11,12,13,14,15,16,17,18,19,20,21,22,23,24,25].
In The Maldives, energy sources are traditionally based on imported conventional supply, of which the most common fuel is diesel which fuels small power plants, often with low efficiency and heavy polluting. Due to the diesel production, emissions of CO2 into the environment are large and in the medium term may cause damages to the environment. Renewable resources are scarcely used. While solar water heaters are quite widespread, photovoltaic (PV) panels and wind plants are rare. In 2016, the total power generation from renewable energy was 6 MW. In the medium term, the government has planned to install renewable energy systems for up to 30% of the daytime peak load in all inhabited islands [26]. Thus, the efforts of the Maldivian government and local authorities are on implementing renewable systems. The aim is to transit from energy dependence to independence from the mainland.
Studies on energy, applied or theoretical, for the assessment and feasibility of renewable projects in SIDS are quite numerous; less numerous are studies and experiences in desalination combined with renewables.
An extensive study is carried on a reverse osmosis (RO) desalination plant, located in the Sinai Peninsula in Egypt, fed by conventional and unconventional energy sources in [27].
A project for a desalination plant of 1000 m3/day is proposed in the Tyra Island in Greece [28]. The report illustrates two case scenarios: solar and wind power, compared to diesel generators, feed a desalination plant. Diesel generators are used as back up in both cases.
In [29] the feasibility of desalination systems fed by PV or high concentration solar plants of medium and large size in Saudi Arabia is discussed as opposed to diesel as the source of energy. The cost of solar is still high given the heavy subsidizing of diesel in Saudi Arabia.
In Kaya et al. (2019) [30] an analysis based on the levelized cost of water indicates that the current thermal desalination methods used in Abu Dhabi should be substituted by solar PV systems and reverse osmosis (RO) technology for desalination.
Helal [31] explores the economic feasibility of three alternative configurations of an autonomous seawater reverse osmosis (SWRO) unit in remote areas of the UAE. Three different scenarios are proposed here for the powering system where the unit is driven either by a diesel generator, a PV-diesel hybrid system, or solely driven by solar panels without battery backup. This paper can be considered an interesting benchmark, as the low desalination plant dimension [20 m3/day] is comparable with our scenario.
The global average levelized cost of water (LCOW) from desalination plants could decline from around $2.86/m3 in 2015 to $1.25 by 2050 if solar, storage systems and other renewable energies are used to decarbonize the sector [32]. The researchers forecast that in specific regions of China, India, Australia, and the U.S., drinking water may cost less than a dollar.
An extensive report from IRENA [33] gives useful information on systems already functioning. Different renewable energy sources are proposed to reduce the environmental impact.
Mainly, studies are based on the use of wind turbines or solar plants, but there are also proposals where other renewable sources, such as sea currents, are used [34]. This application could be interesting particularly for some islands where the scarcity of drinking water is more severe.
A recent paper published in 2020 [35] reports a study about the economic, technical, and environmental impacts of different desalination system configurations (centralized or decentralized, components, and technologies) on transition plans to achieve a higher share of renewable energy and desalination supplies for regions facing water scarcity. The analysis forecasts a reduction of LCOW from the current value of $2.19–2.46/m3 to $0.79–1.01/m3 in 2040.
In The Maldives, scarcity and quality of water are relevant issues. Traditionally, Maldivians used lens freshwater from household wells for both potable and non-potable purposes. The elevation of the highest point in most islands is less than 2 m above sea level, so the freshwater lens thickness of each island is low. The use of rainwater for drinking began in 1978 due to a cholera outbreak. In 1995, the first municipal water supply project began its services. It started from the capital Malé and extended to other population centers, including all touristic resorts. A public water system became available to 49% of the local population and was fully operative by the end of 2017 [36].
However, many outer island populations still depend on collecting rainwater for domestic use, as in the study case illustrated in the present paper. Furthermore, recently and with increased frequency, the collected rainwater stores run out during the dry season, causing expensive emergency water supply from the mainland. Moreover, after the 2004 tsunami, the lens freshwater deposit was deeply damaged, and freshwater is now brackish. While tourist resorts and the city of Malé are all equipped with (thermal) desalination plants, in many outer islands, people use rainwater and a supply of bottled water imported from the mainland for drinking, rainwater for cooking and a small amount of lens water for washing, flushing and other purposes [26].
However, even though The Maldives shows a wide deficit in energy and freshwater resources, they have unique advantages in term of renewable energy (sun) with excellent radiation and seawater potential. An integrated approach to water management and renewable energy production can definitely improve the living in rural atolls and substantially reduce CO2 emissions.
In this paper, we also carried out a life cycle assessment (LCA) for the different solutions proposed. In the literature, different studies on LCA for water systems of different dimensions can be found [37,38]: in integrated urban water systems or for the specific analysis of plastic bottle impact [39].
A synthesis of the literature discussed here, for water desalination and energy source solution adopted, is reported in the discussion section. The data will be used as a comparison with our results.
This paper contributes to the gradual road to energy/water independence from the mainland by proposing a financial and environmental evaluation for the installation and maintenance of a desalination plant. The off-grid energy to the desalination system is provided by diesel or by a PV plant. Results in this paper show that a desalination system plus a PV plant with batteries is the optimal choice, as opposed to the use of diesel, and more feasible than the current scenario, both from the financial and the environmental point of view.
The project is carried out in Magoodhoo Island, in Faafu Atoll in The Maldives. The project is jointly financed by the Marine Research and High Education Center (MaRHE Center). MaRHE Center, officially inaugurated on January 28, 2009, is in Magoodhoo Island. Purpose of the Center is to carry out research and teaching activities in the fields of environmental sciences and marine biology, science of tourism and human geography, to teach how to protect a fragile environment and its biodiversity, how to use and manage its resources in a responsible way. https://marhe.unimib.it/ accessed on 1 March 2021) and by the University Milano Bicocca (Italy) and the Italian Ministry of Environment.
2. Materials and Methods
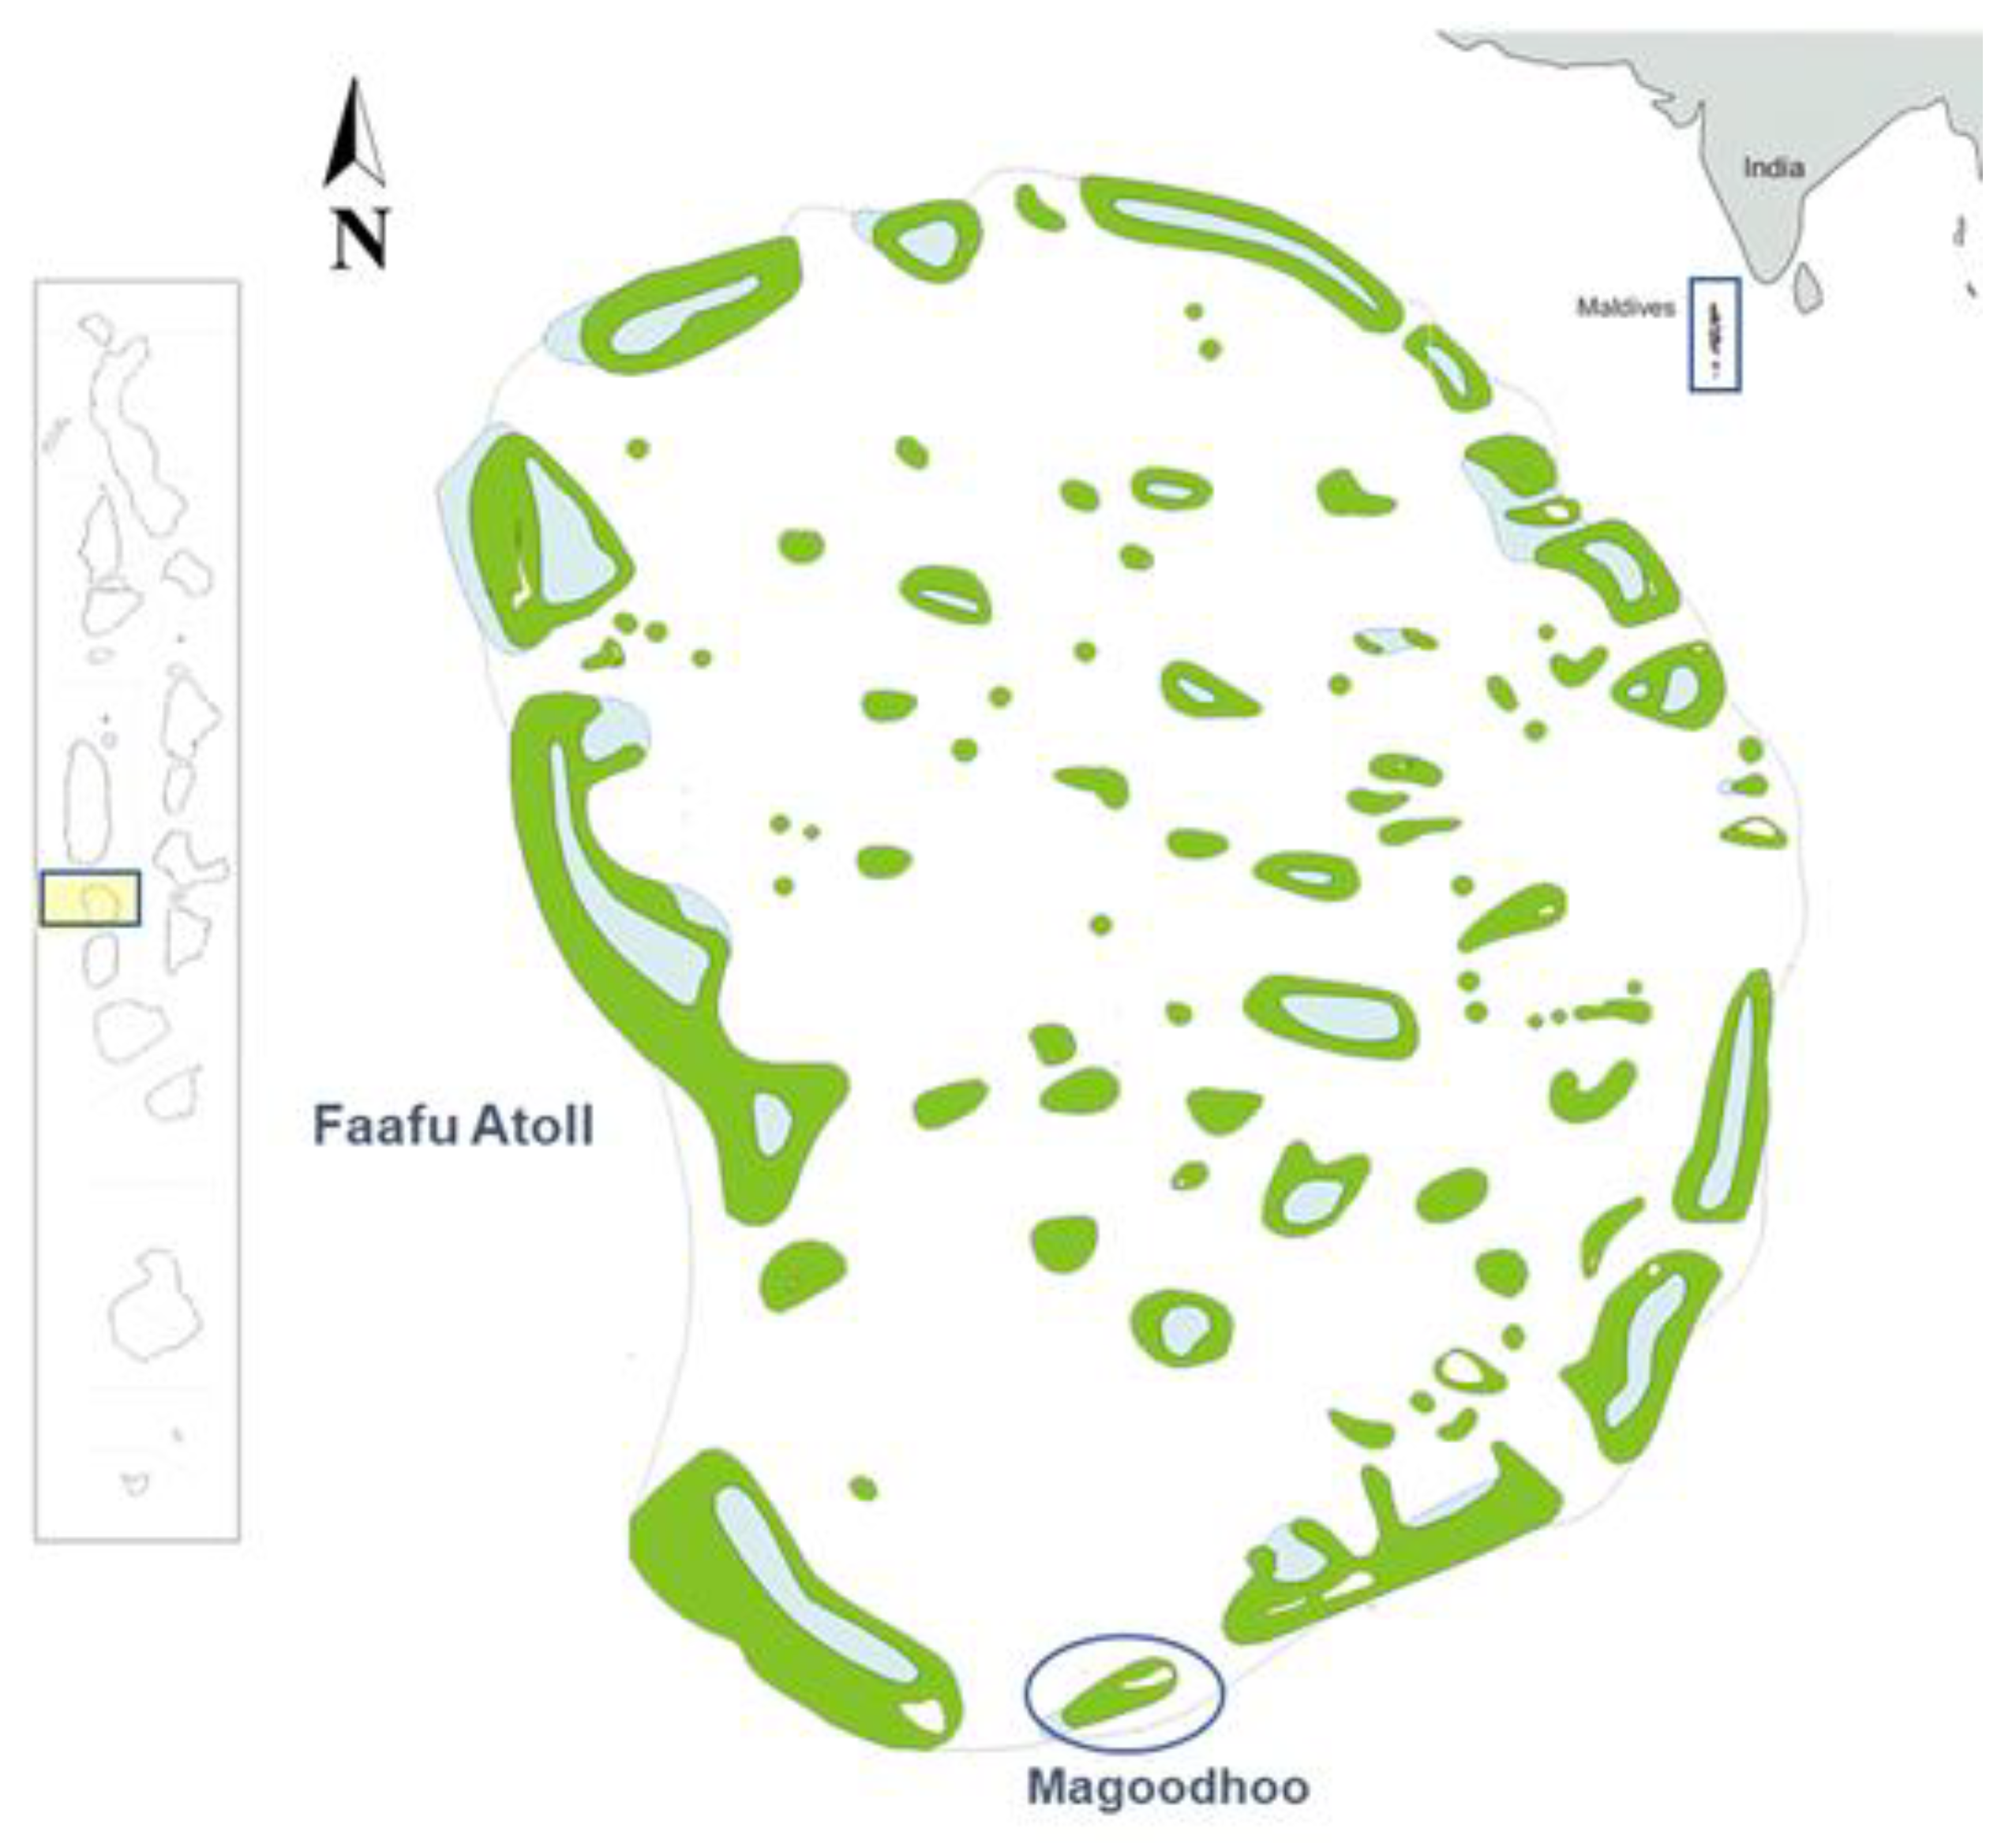
The Faafu Atoll is located 137 km from Malé and covers an area of 30 km long and 27 km wide, in the Indian Ocean (Figure 1). The Faafu Atoll is made of 23 islands, covering 1.6 km2 of land, of which five are inhabited by locals and one is an island-resort in Filitheyo. The capital is Nilandhoo and the population of the atoll is about 4200 inhabitants who live mainly from tourism and fishing.
Magoodhoo Island is in the Faafu Atoll (3°4′26′′ N, 72°57′15′′ E), with a population of 800 inhabitants including the MaRHE Center personnel (35 researchers approx.). In total, there are 133 families of 6 members each on average.
In this project, we have sized a desalination plant on the water needs of the local population. Data collection has been brought forward by two co-authors of the present paper with interviews of local people, inspections of water tanks, and delivery checks of bottled water to the island.
The project involves four main steps: Section 2.1. Understanding the community water demand. Section 2.2. Choice of a desalination technology. Section 2.3. Technological and economic analysis of two alternative actions. Section 2.4. Choice of the best alternative among ACTION 1, ACTION 2 and the current situation (business as usual) based on financial and environmental criteria.
2.1. Understanding the Community Water Demand
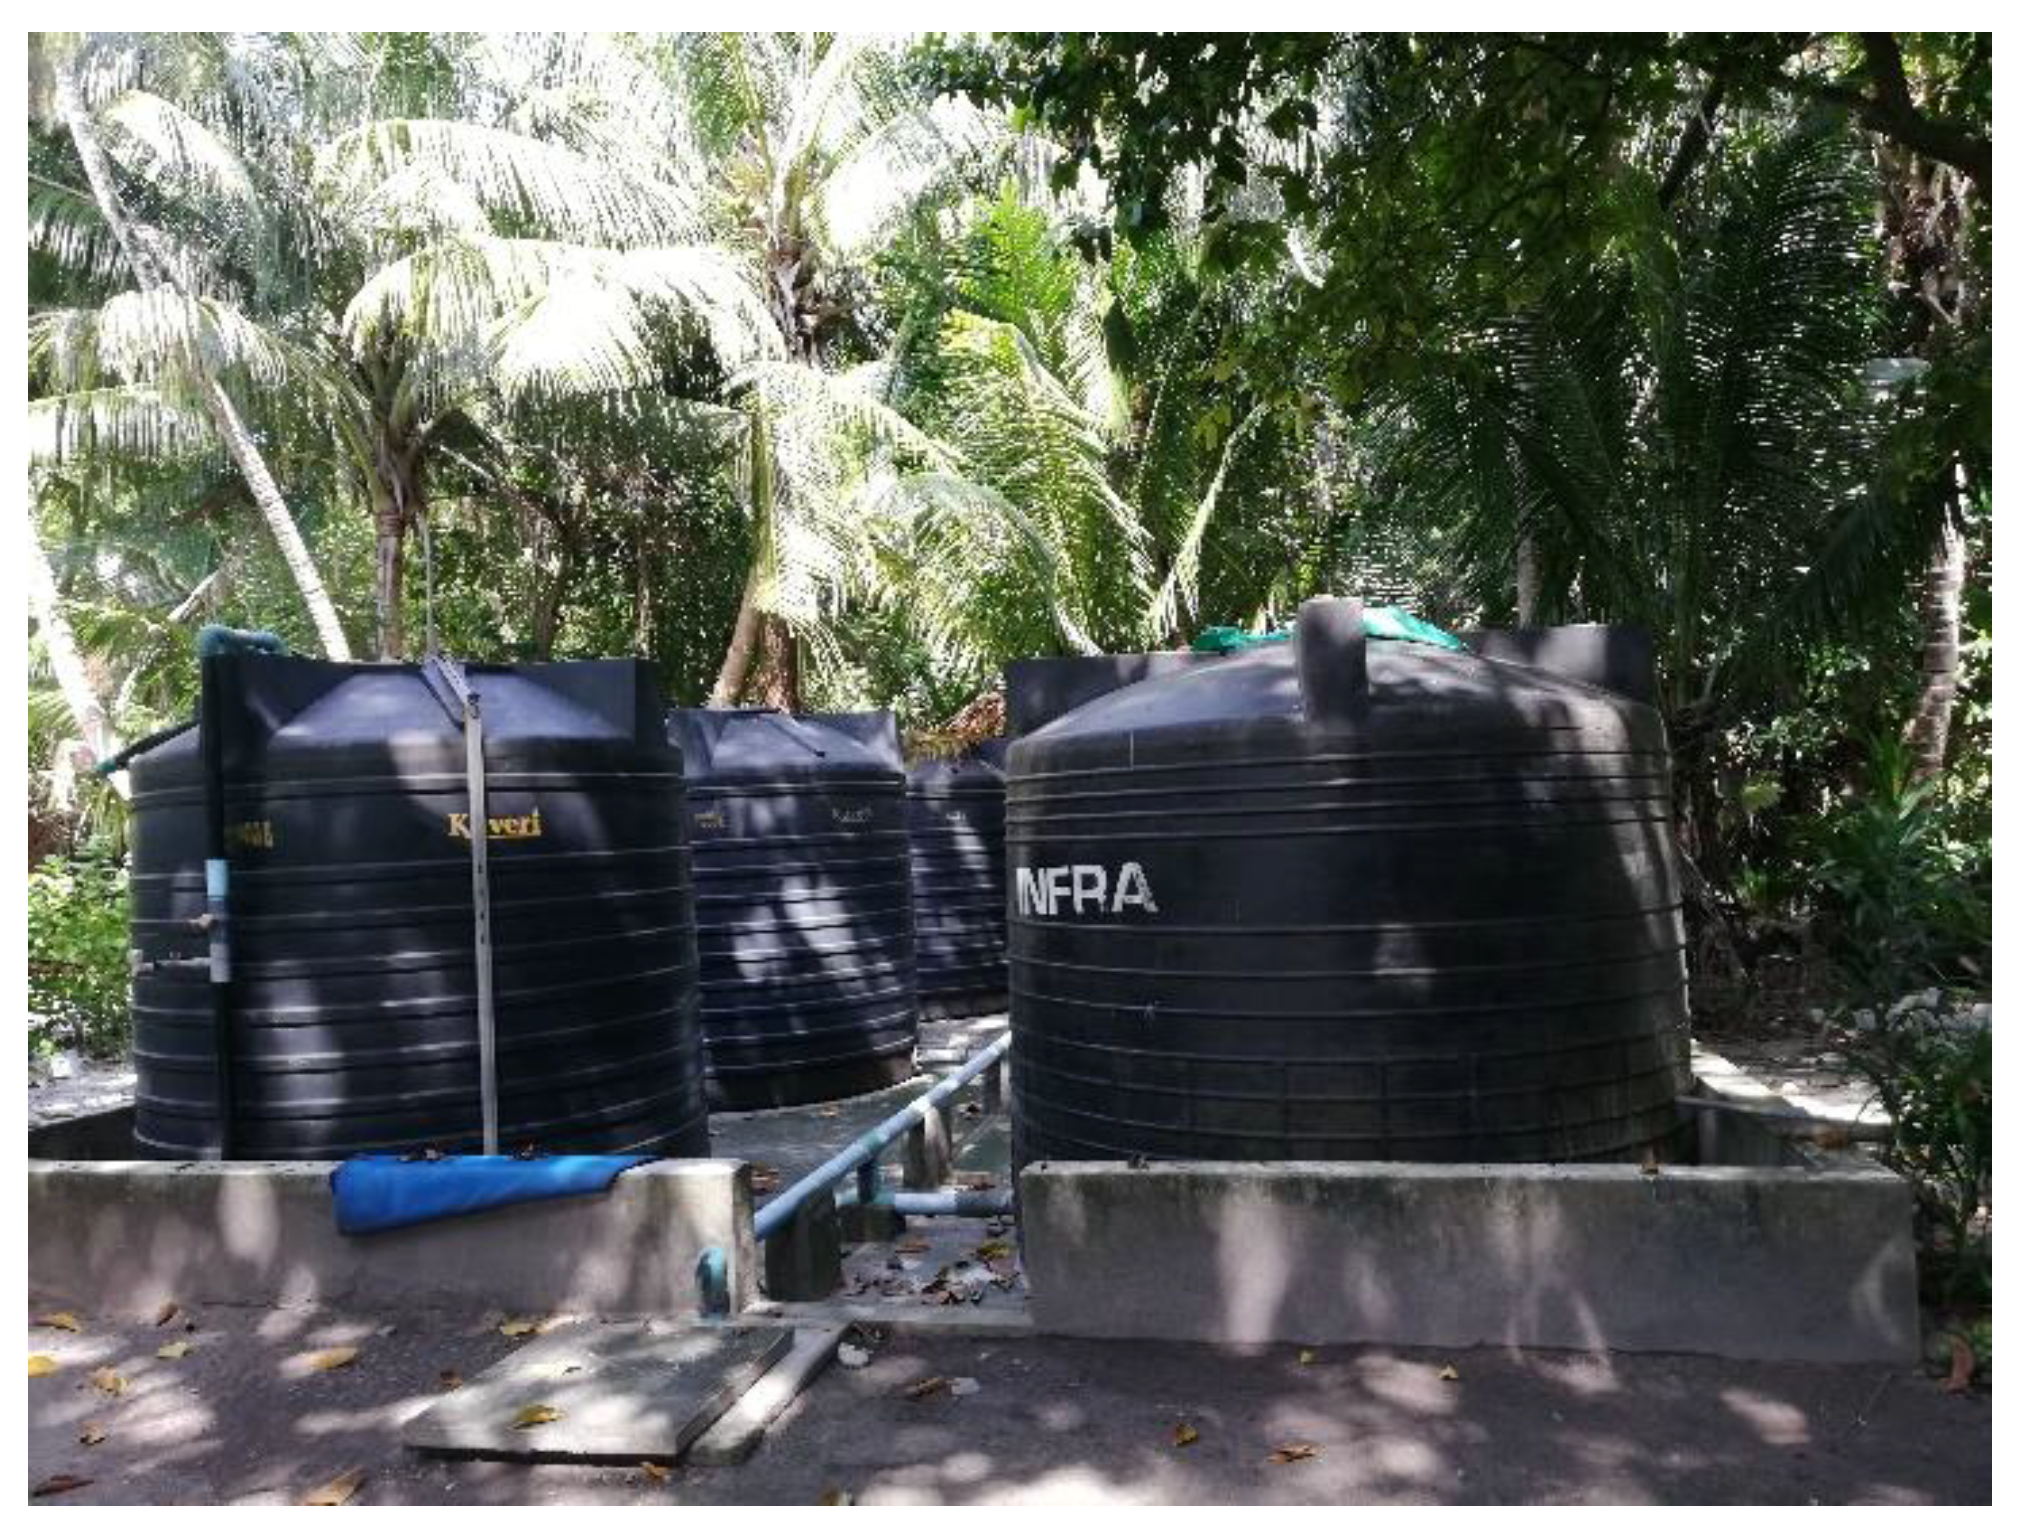
In every family house, including the MaRHE Center, rainwater is used for cooking and drinking, while ground water is used for washing and flushing (see also [36] for a recent survey on the quality of water in The Maldives). In every family house, in the municipality compound and in the MaRHE Center, the ground water is taken from household and public wells, while the rainwater is collected in big plastic water tanks, each containing 2500 L of water. The rainwater pours into the tank through gutters on the roof. The roof is cleaned occasionally, no more than once a year, and the only filters used are pieces of clothes stuffed into the pipe hole. The water tank, once filled up, is closed, and reopened when necessary. The water flows from the tank through a faucet. The tank fills up during the rainy season and occasionally when it rains out of the rainy season. The tanks, provided by the Maldivian government more than 20 years ago and partly by the Red Cross after the 2004 tsunami, are substituted occasionally (Figure 2).
A reliable estimate puts consumption at 23.81 L per day per family, thereby using up a full tank in approximately three/four months. This amounts to the full use of 3–4 tanks per year (no data about diseases (potential presence of micro-bacteria and plastic microparticles from the tanks) caused by non-filtered water are available). People in the MaRHE Center drink the same water as the village, taken from public tanks, but filter it out by their own filters through a water dispenser located in the MaRHE Center canteen.
The water from the tanks is felt by local people as not safe for drinking, but it is extensively used for cooking. As an alternative to water tanks, water in plastic bottles is used. The bottled water, in plastic usually of 1.5 L, is given mainly to children and sick people to drink and consumption is large. From Table 1, the consumption of water (rainwater and bottled water) per person per day amounts to 4.35 L. The World Health Organization sets the minimum quantity of water needed at 7.5 L per person per day [40]. Statistics on water consumption in touristic resorts and hotels are rare. An estimate from a big hotel chain in Europe puts water consumption in the range 380–1100 L/guest/night. Swimming pool accounts for an equivalent of 60 L/guest/night [1].
Data in Table 1 correspond to the quantity for drinking and cooking, not considering water for washing and flushing, taken from underground wells.
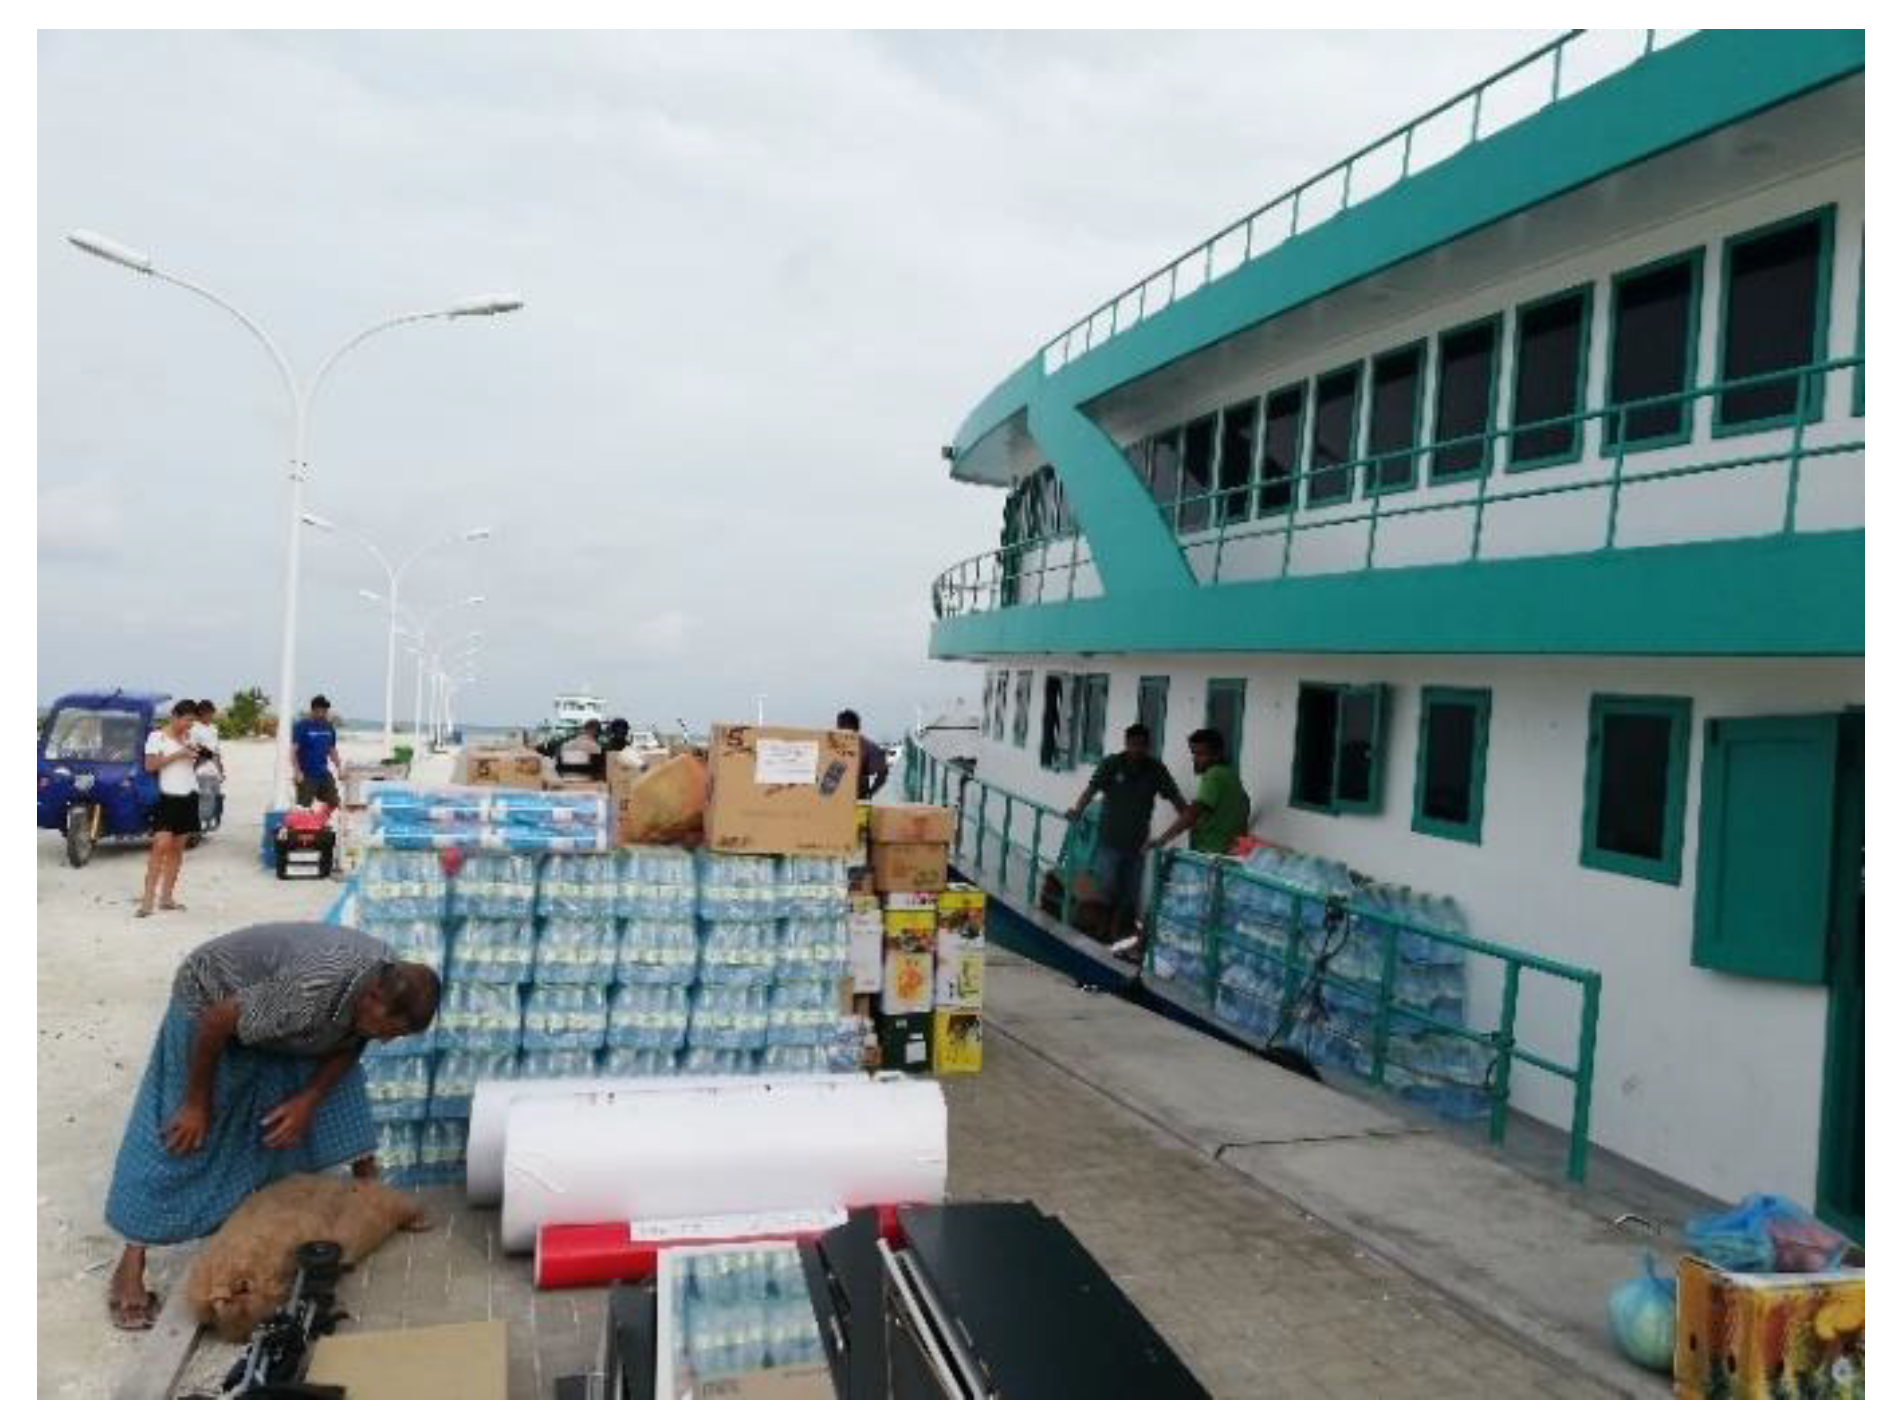
The bottled water is transported to the village by a supply boat (dhoni) (Figure 3) that carries, on average, 2300 L of water per week. The water is sold in the little shops at an average cost of approximately 3.6 MVR per liter ($1 = 15.45 MVR, as of March 2019. the water sold in little shops is bought by the local population only. The price of water varies according to supply conditions and demand. People of the MaRHE Center, practicing an anti-plastic policy, drink the water from the dispenser available in the Center. The total consumption of plastic bottled water sums up to 830 L of water per family, per year. This corresponds to an average cost of $193 per year per resident family the median yearly income of a family in the Faafu Atoll is $17,087 (264,000 MVR) [http://statisticsmaldives.gov.mv/nbs/wp-content/uploads/2016/03/Presentation-Income-HIES2016.pdf] (accessed on 1 March 2021). The consumption of plastic bottles corresponds to 1.1% of yearly income (Table 1).
The current individual consumption of water amounts to an average of 4.35 L per day. This water is rainwater and/or bought in the market in plastic bottles.
The aim of the project is to provide 6 L of safe drinking water per day to all inhabitants of the island (Table 2). The supply of water will be provided by a desalination plant fed by an off-grid source of energy that can be renewable or conventional.
2.2. Choice of a Desalination Technology
Given the size of the island, a small scale decentralized desalination unit can be sufficient. The plant will be fed by off-grid electricity.
The strength and weakness of the available desalination technologies were analyzed to choose the appropriate technology. The advantages and disadvantages of some well-known commercial desalination technologies are reported in the literature [41,42,43,44].
When choosing a technology, an important factor is the required energy demand for the desalination technology as well as the use of a mature technology when designing a decentralized small-scale desalination unit. In choosing desalination technologies to be coupled with a renewable energy source, it is also important to know the amount of the conventional energy required by the desalination processes (Table 3). The reverse osmosis plant cost has been determined according to an offer by a local installer in Magoodhoo (Table 4). As can be seen from Table 4, the cost of the desalination plant is $16,500 but the complete installation, including complementary tools, amounts to $50,000. If working 12 h/day, the plant is designed to satisfy the local demand, guaranteeing 5 m3/day (5000 L/day), which is 40% more of the current consumption.
We recall that a minimum of 7.5 L per capita per day will meet the requirements of most people under most conditions [40]. With this project, the desalination plant will provide 6 L of safe drinkable water per day per person. Rainwater and ground water are still available for other purposes.
The RO plant design includes a pre-treatment process in which fouling elements would be removed. Conventional pre-treatment was selected due to the low incurred costs.
For our requirements, a RO desalination plant of 3.7 kW is selected with a production capacity of 417 L/h. The water produced is stored in two different tanks. As the renewable energy source, photovoltaic is the source commonly coupled with the desalination plants [23,26]. We compare this scenario with a conventional one where the electricity required by the desalination plant is delivered by a diesel generator. Another alternative we consider is the current scenario (business as usual).
2.3. Technological and Economic Analysis of Two Alternative Actions
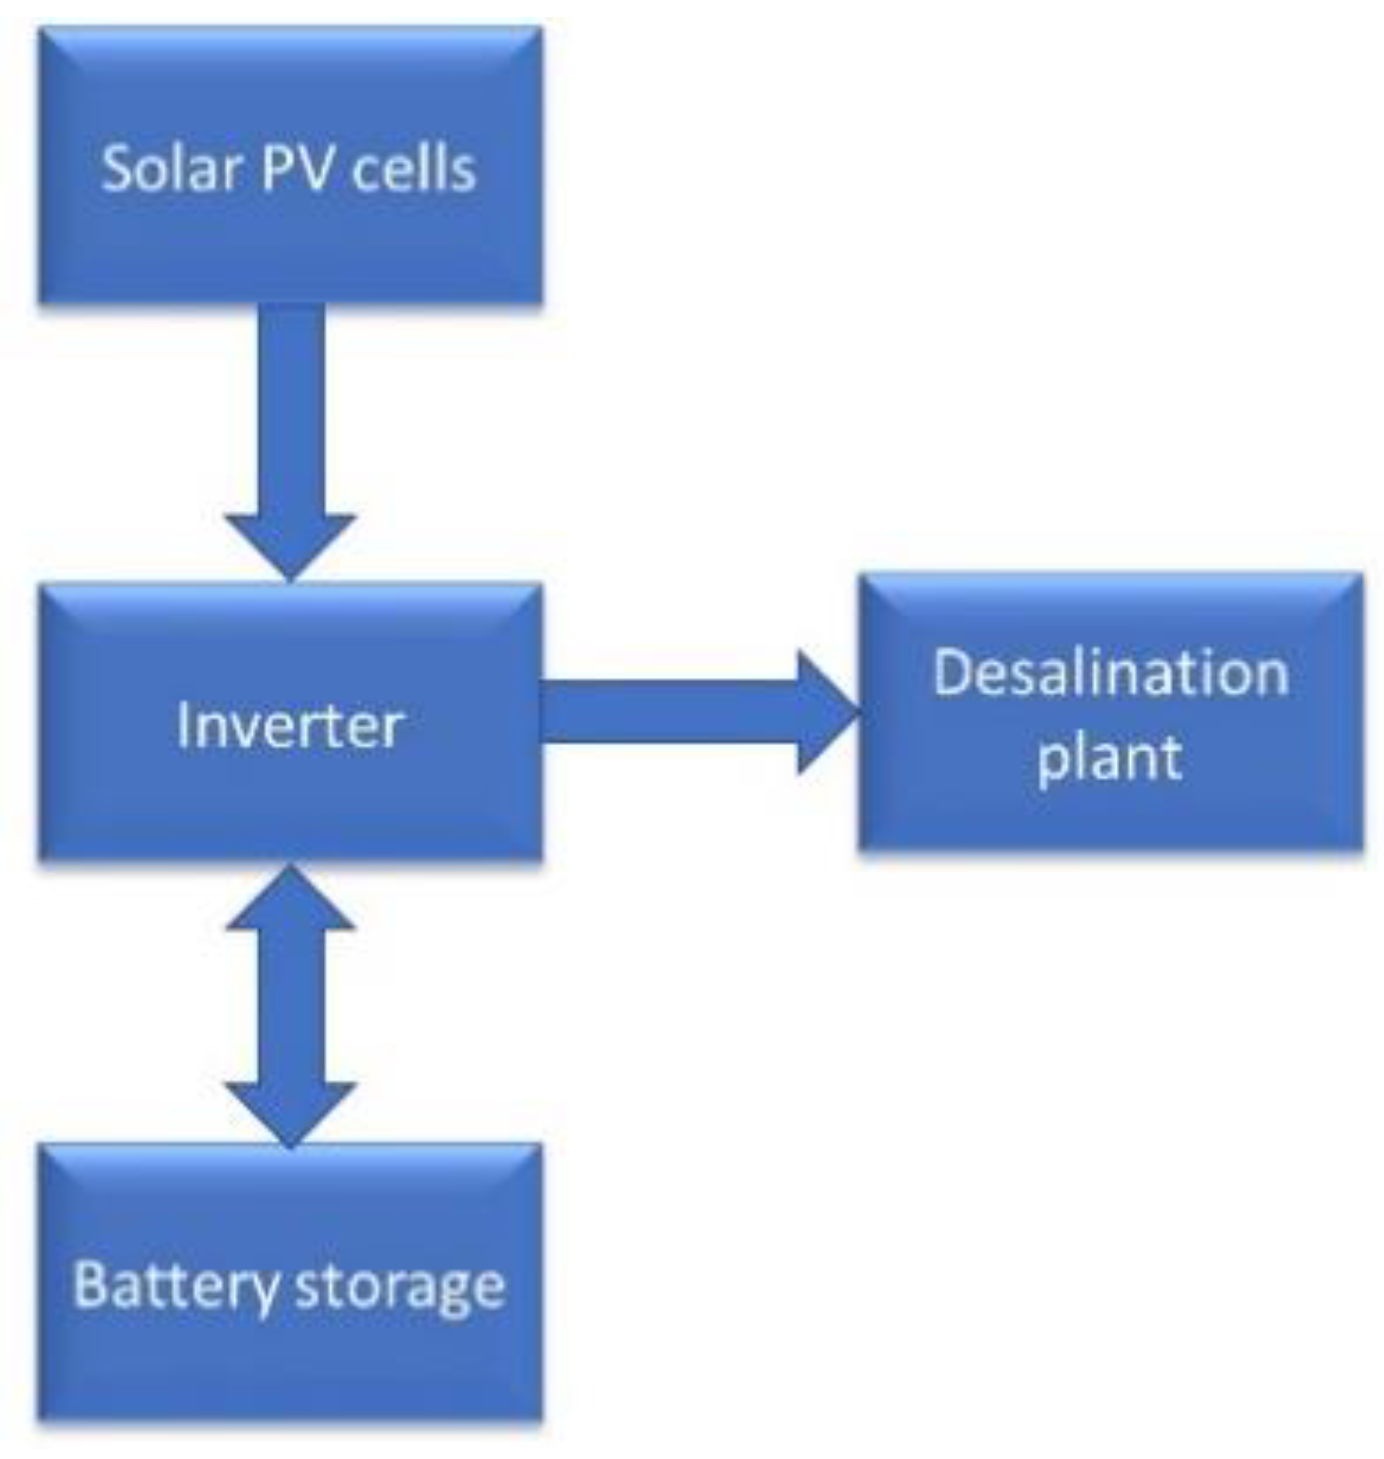
RETScreen is a software tool for energy system modelling which analyzes the energy scenario among the energy mix suggested by the user and provides a detailed financial analysis and emission analysis [45,46] software was used to estimate the energy production using solar PV and economic assessment of the plant. The main components of the proposed RO system are shown in Figure 4. The system consists of PV panels, a battery bank, an inverter, a high-pressure pump (HP), a membrane module and a storage tank.
The proposed integrated system for the RO load with 417 kW peak demand and the combined renewable energy sources were modelled using RETScreen software.
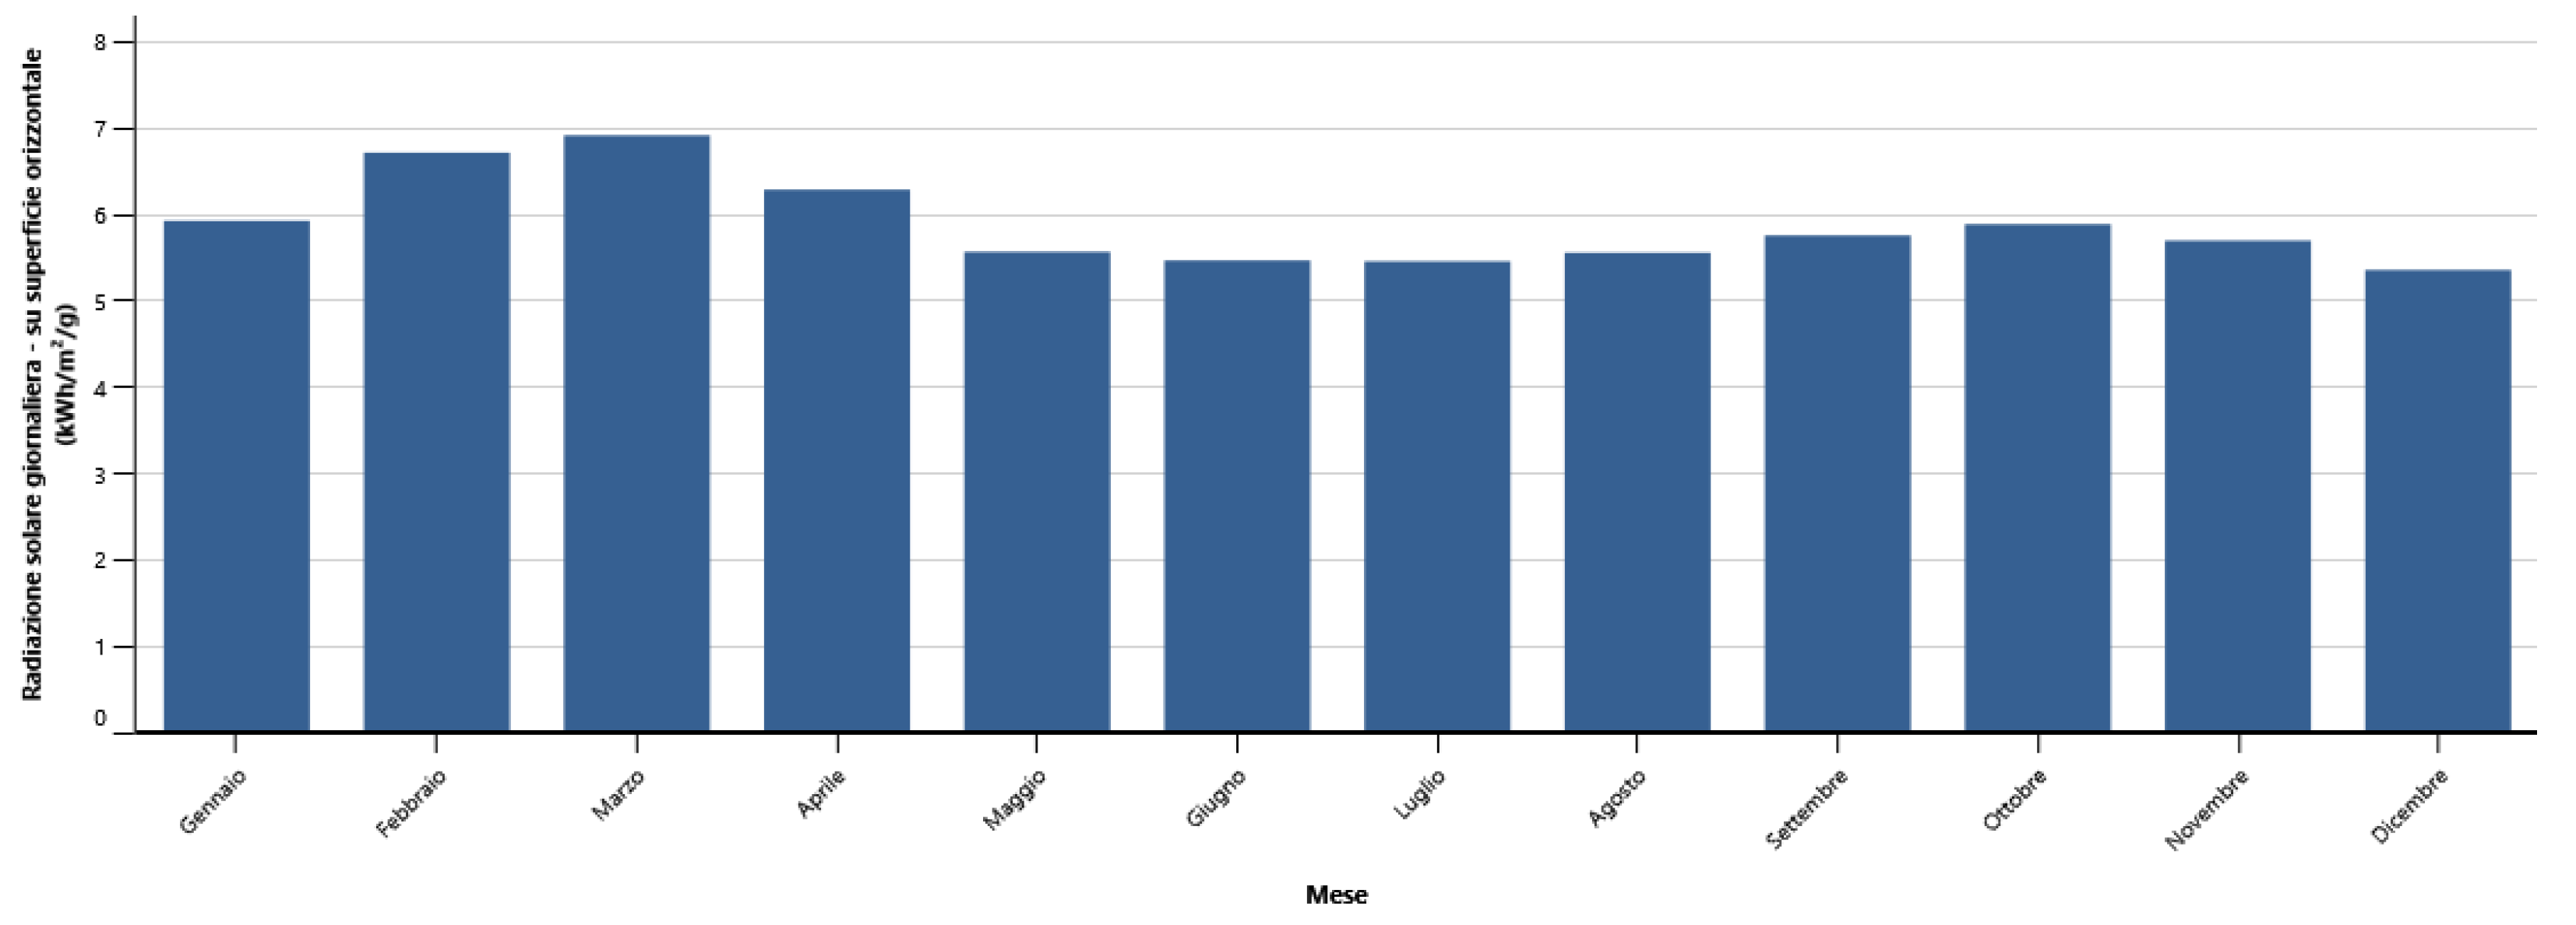
First, an energy production analysis involving inputs and costs was carried out for the PV plant. Input values and energy production are illustrated in Table 5. The power capacity of the PV system is 10.8 kW. The output of the inverter in AC kW is 10 kW. Magoodhoo Island, and The Maldives in general, are in a very good position to benefit from the sun’s energy through solar PV technology, due to excellent solar radiation all year round. The solar radiation in Magoodhoo varies from 5.9 to 6.9 kWh/m2/day (Figure 5).
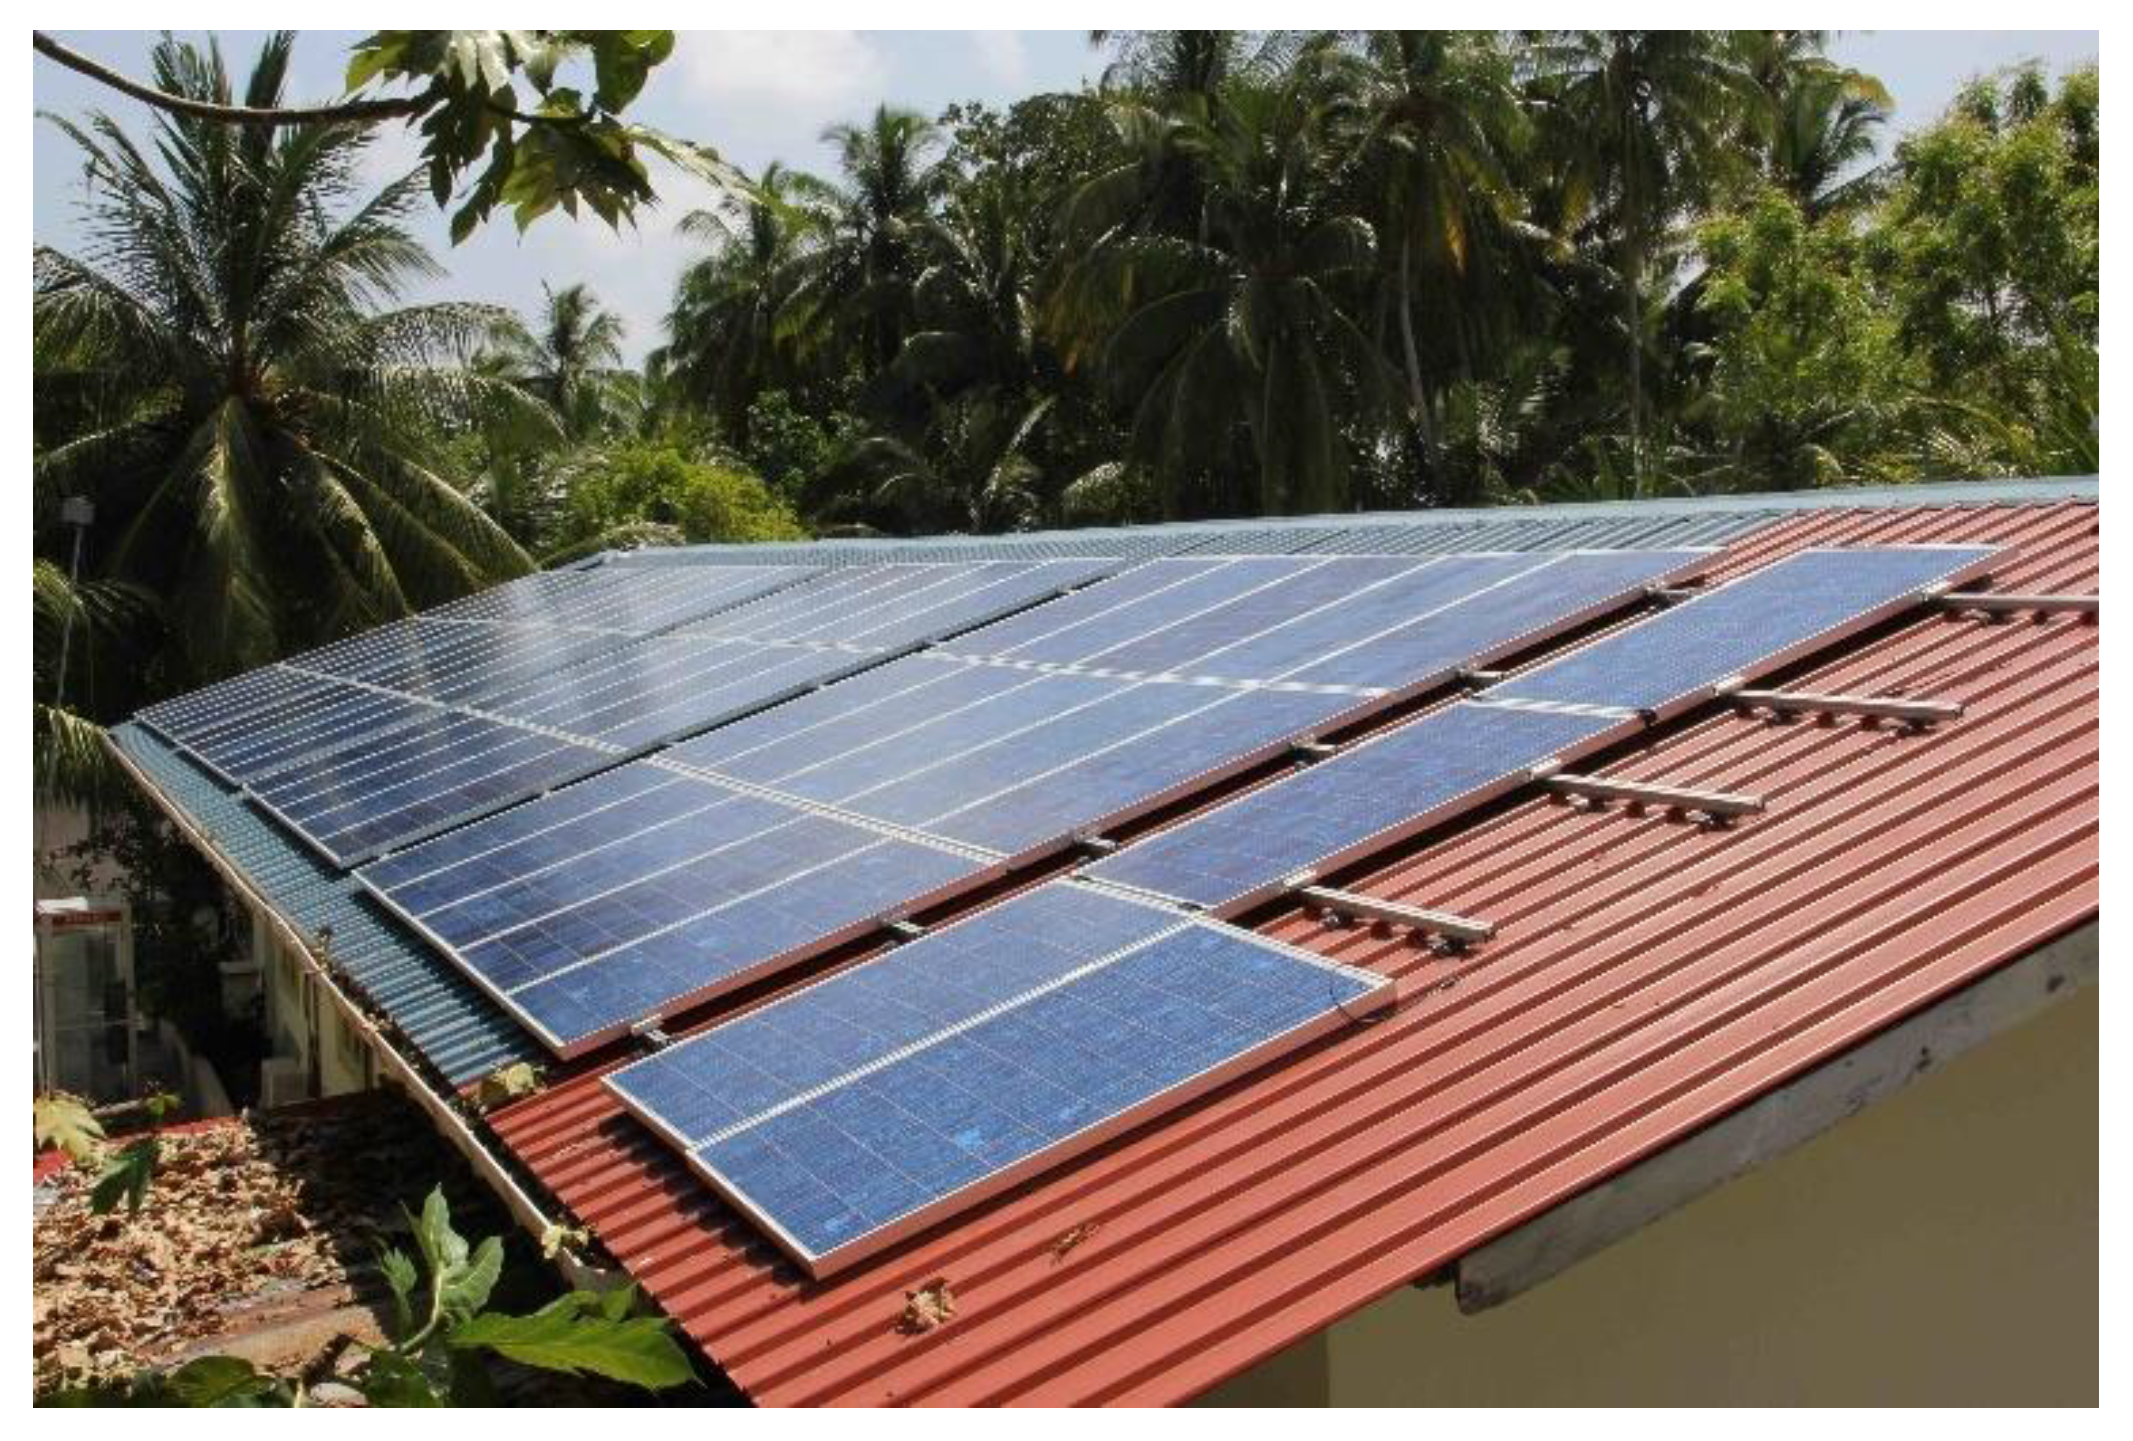
The annual electricity produced is about 17,600 kWh, which means a production of about 48 kWh/day. The total solar collector area is 62 m2 and can be located on a roof (see also [24] for a feasibility analysis on roof-mounted solar PV systems in Hulhumale Island in The Maldives for energy production) (Figure 6).
The total average energy consumption is 48 kWh/day to produce 5 m3 of desalinated water per day (H12 water production).
The cost of the PV plant with all components is $30,000 (tax included) and has been determined according to an offer by a local installer (Table 6). Prices in the mainland are probably lower, but the island is remote and local installers set the price.
Due to the intermittent nature of solar energy, in a PV based power system, battery storage facilities are needed to ensure a constant power supply. The cost of battery storage is around $1500. The lifetime is estimated at 10 years.
2.4. Choice of the Best Alternative among ACTION 1, ACTION 2 and the Current Situation (Business as Usual) Based on Financial and Environmental Criteria
To proceed with the choice of the most feasible solution, three alternatives have been considered:
- The current scenario, business as usual (BAU);
- ACTION 2, desalination system fed by conventional fuel (diesel);
- ACTION 2, desalination system fed by a PV plant.
For all alternatives, the net present value (NPV), the payback period (PBP) and the CO2 emissions are calculated and compared. NPV is the difference between the present value of cash inflows and the present value of cash outflows over the lifetime of the project. NPV is used in capital budgeting to analyze the profitability of a projected investment. The best alternative has the highest NPV.
PBP refers to the amount of time it takes to recover the cost of the projected investment; or in other words, PBP is the length of time it takes for a projected investment to reach its breakeven point. The best alternative has the lowest PBP.
The current scenario (BAU)
In the current scenario, approximately 6133 bottles of 1.5 L capacity are brought from Malé on the island every month; that is 73,600 plastic bottles per year.
A range between 75 and 180 g of CO2 per bottle of 1.5 L emitted in the life cycle can be estimated [47,48,49,50,51,52]. This is also confirmed by an LCA evaluation carried out by the Polaris Research Center of the University of Milano–Bicocca. The results state that a 1.5 L plastic bottle is responsible for the emission of 108 grams of CO2 equivalent over its life cycle (data not published). Here, we consider for the LCA of the bottles from the extraction of raw materials to waste disposal.
This means 662.36 kg of CO2 per month and almost 7.95 tons of CO2 per year. We must add to it the emissions produced during the travel by boat. The 1 ton cargo supply dhoni (typology of the boat is referred to the LCA database software Gabi at this link http://gabi-documentation-2018.gabi-software.com/xml-data/processes/3a819ab9-1979-45b7-a8e9-b4f633d5a662.xml accessed on 1 March 2021) issues in the atmosphere 0.02324 kg CO2 eq per km. The distance from Malé to Magoodhoo Island is almost 137 km, and it is traveled once a week for water transport. It amounts to 25.47 kg of CO2 per month and almost 305.65 kg of CO2 per year.
The average cost of water is 3.6 MVR per liter ($1 = 15.45 MVR) for a total expenditure of $25,721 per year (almost $193 per family per year) (Table 1). This is a cost sensible market change and is expected to grow according to the increasing number of inhabitants. Costs are summarized in Table 7.
In Table 7, the current scenario is shown. Advantages (pros) are that no investment costs are required. However, disadvantages (cons) are big in damages for the environment and potential dangers for health from the non-filtered water kept in the tanks for months.
ACTION 1 Desalination and Conventional Fuel.
The objective of ACTION 1 is to provide safe water for the community for drinking and cooking.
In this scenario, a RO desalination plant is installed with a working period of H12, 3.7 kW and a capacity of 417 L/h, for a total of 5000 L/day. The market price is $50,000. In addition, the desalination plant requires an estimated O&M cost of $1000 per year.
A fuel generator (diesel) powers the plant. The total energy required is 16,200 kWh/y. The fuel generator is sold at a market price of $5000.
In order to feed the generator (working H12) we need 4524 L of fuel per year. The local price for fuel is 0.91 $/L which amounts to $4116.84 per year. This is a yearly cost necessary to power the system, but subjected to market conditions. The emission of CO2/L of diesel is 2.66 kg [21] which amounts to 12,033.84 kg of CO2 issued in the atmosphere per year.
In ACTION 1, the whole demand of water for drinking and cooking is fulfilled. Rainwater is available for other domestic uses, like washing and for personal use. Flushing is guaranteed by the ground water.
From Table 8, plastic bottles (with a saving of CO2 emissions) are not used but the fuel causes high pollution. In case of disruption, rainwater can still be used.
ACTION 2 Desalination and PV Plant with Battery Storage.
The objective of ACTION 2 is to provide safe water for the community for drinking and cooking.
As in ACTION 1, the market price of the RO desalination plant is $50,000.
The total energy required is 16,200 kWh/y, provided by the PV plant at 10.8 kW with battery packs of a max capacity of 260 Ah.
In ACTION 2, the initial investment cost is high. The market cost is $30,000. The price of batteries is $405 per kWh of installed capacity, which amounts to $1500 [24] with a life expectancy of 10 years. O&M PV costs amount approximately to $100 per year.
In ACTION 2, the whole demand of water for drinking and cooking is fulfilled. Rainwater is available for other domestic uses, like washing and for personal use. Flushing is guaranteed by the ground water.
From Table 9, the advantage in terms of the environment is very clear; however, initial capital expenditure is high.
The benefit of investing in ACTION 1 and ACTION 2 comes from the elimination of the “perpetua” costs in BAU by the purchase of water in plastic, which amounts to $25,721 per year, paid by the whole community.
In ACTION 1, the initial cost of the investment is $55,000 and the yearly cash flow in the following years is $20,604.16. This revenue comes from saving $25,721, obtained by the elimination of plastic bottles, less the fixed cost of fuel to feed the generator ($4116.84) and the annual desalination plant O&M costs ($1000).
In ACTION 2, the initial cost of investment is $80,000 and the future annual benefit is $24,621, given by the “revenue” $25,747, which comes from the elimination of plastic bottles, less the fixed costs of maintenance of the PV plant ($100) and desalination plant ($1000). The cost of the batteries ($1500) is added to the cost of the PV plant.
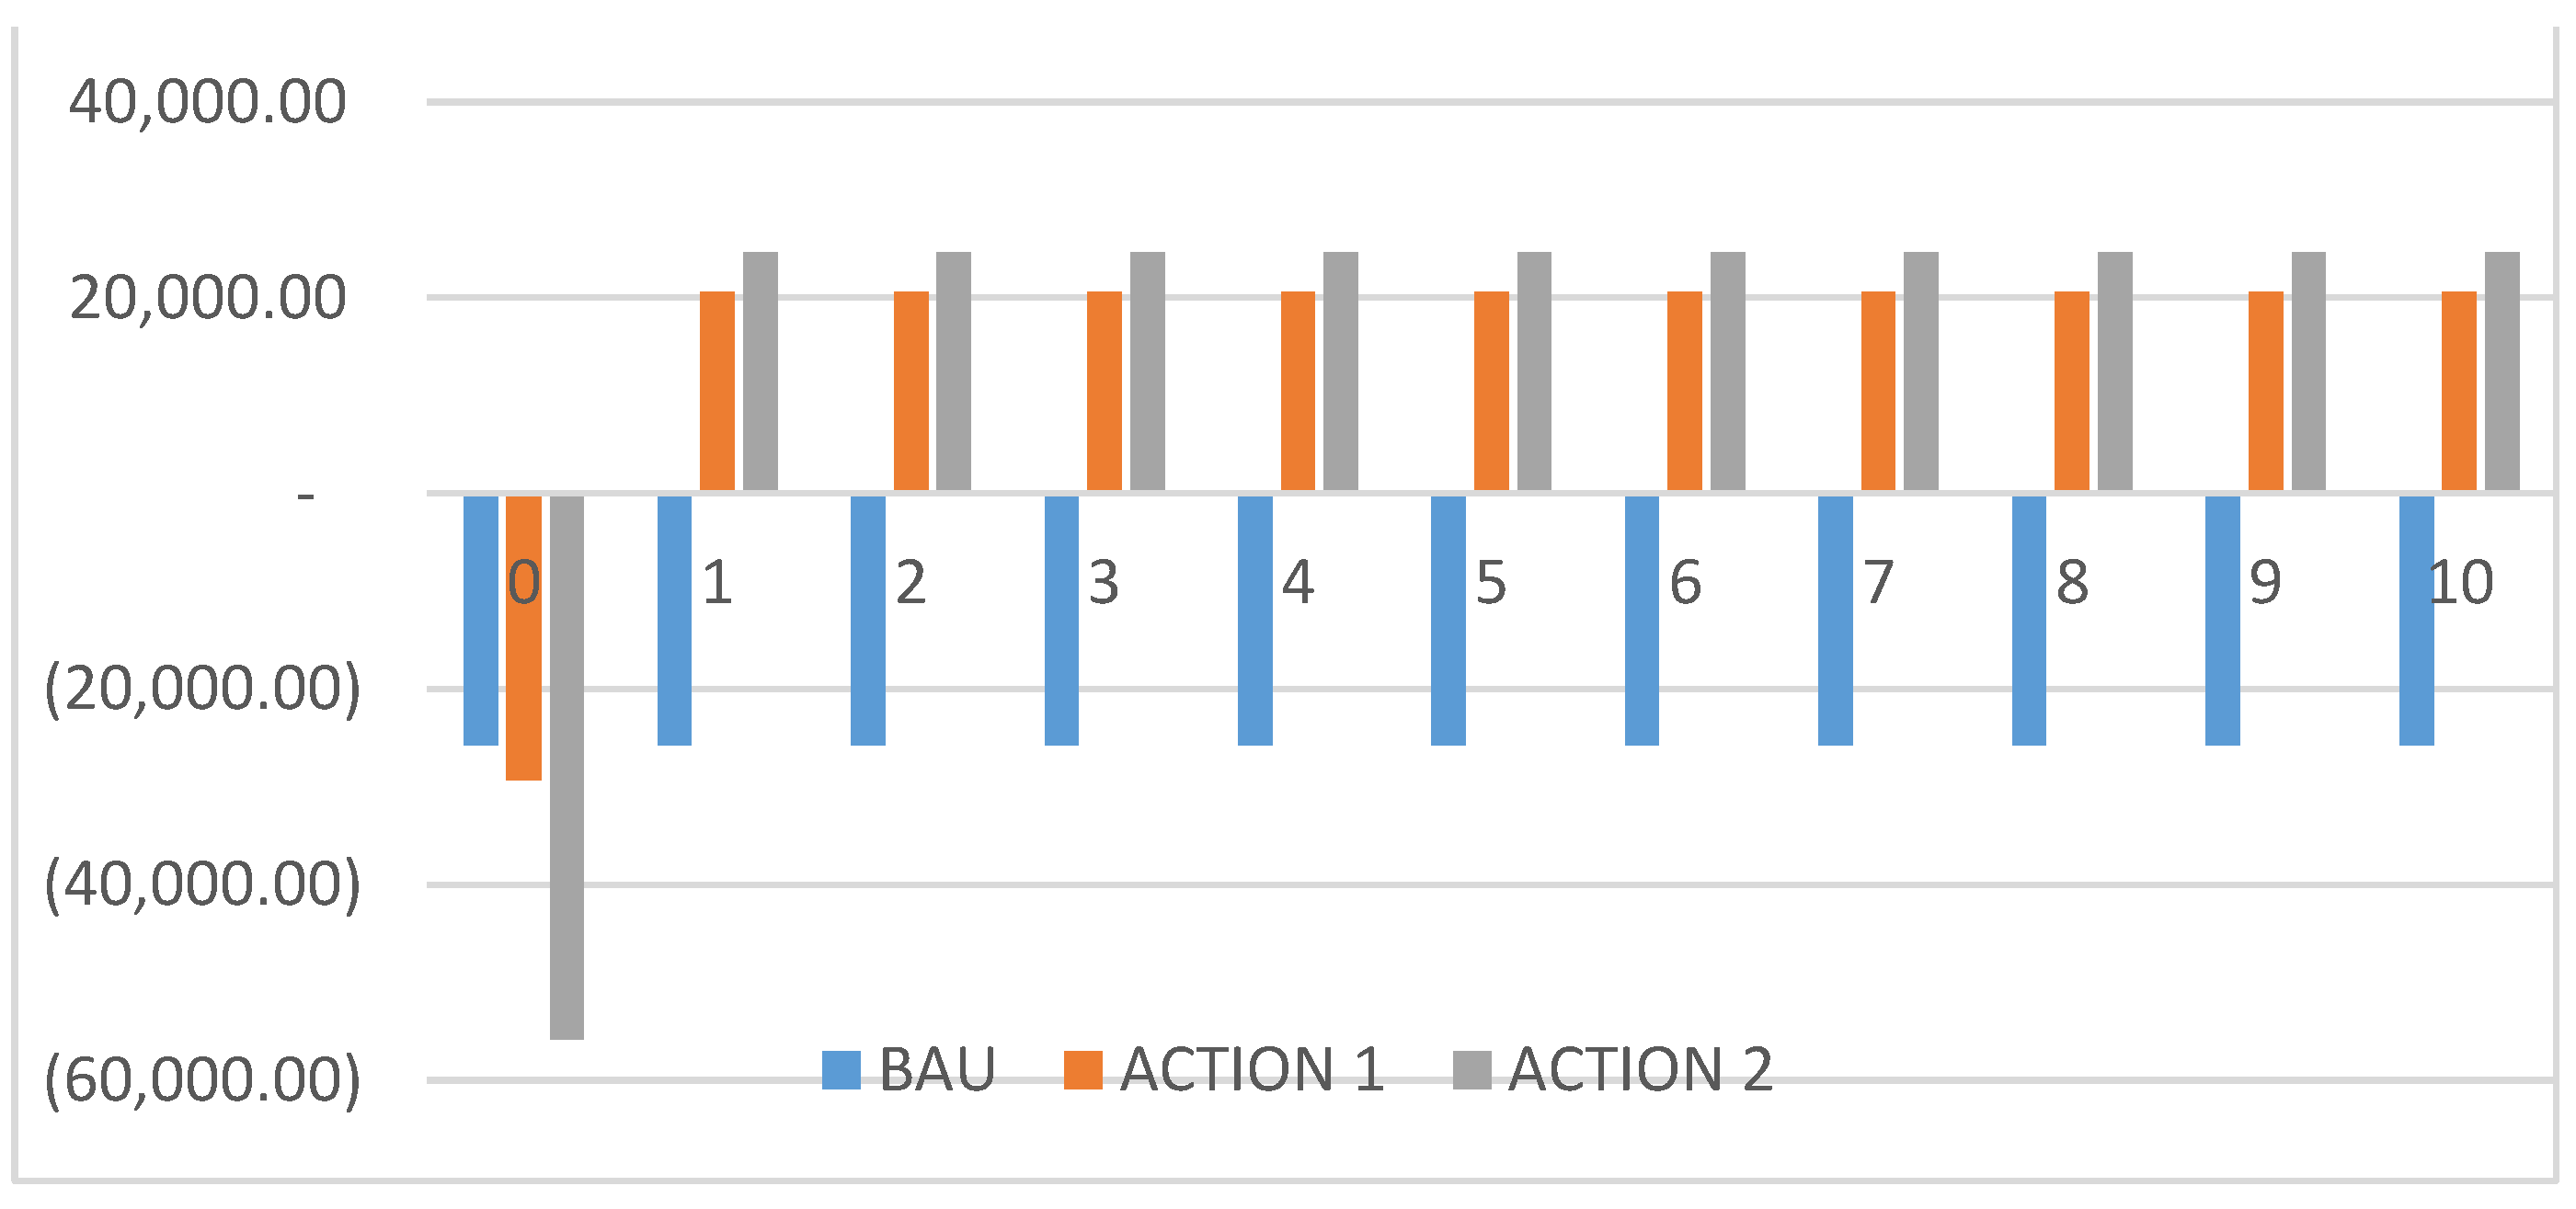
Cash flows of the three alternatives, the NPV and the PBP on a 10 year time horizon are calculated. The discount rate (7%) is taken from official 2017 data [53]. Cash flows, NPVs and PBPs are shown in Figure 7 and Table 10 respectively.
From Table 10, it is obvious that action must be taken. BAU at this stage is very expensive for the whole community, let alone the health risks of drinking rainwater kept in plastic tanks for months.
ACTION 1 and ACTION 2 require initial investments that are compensated by the savings from the use of plastic bottles. In a 10 year time horizon, the NPV for both alternatives is high and the PBP is less than three years for both actions. This means that the breakeven point for both actions is reached in less than three years and the initial high investments are compensated by the returns in the next years for the whole community. ACTION 2 shows the best NPV with a slightly higher PBP.
Finally, we calculate the levelized cost of water (LCOW) for all actions, including BAU. LCW allows the collapse of the entire analysis into a unique indicator, which is useful for making the final choice among all available options. LCOW is the cost per m3 of water generated during the whole lifetime. LCW is defined as
where are the yearly cash flows including the initial capital expenditure and . is the amount of water produced each year. The best alternative shows the lowest LCOW. Using an interest rate of 7% for a lifetime of 10 years, the results in Table 11. Levelized cost of water (LCOW) and levelized emission of water (LEOW) of each alternative for the whole island. For BAU, we have included rainwater and plastic water, for a total of 1249.944 m3/y. For ACTION 1 and ACTION 2 we have not considered the savings from not purchasing plastic water. For ACTION 1 and ACTION 2, the quantity of water produced has been taken as the maximum capacity of the RO plant (5 m3/day and 1825 m3/y).
We have expanded this concept to the levelized emission of water (LEOW) to redirect the impact on the environment in term of CO2 per m3 of water produced in the different alternatives. LEOW is defined as
where co are the yearly CO2 emissions and is the amount of water produced each year.
Results are shown in Table 11. All emissions refer to the production phase: for BAU, that is the use and disposal of plastic bottles; for ACTION 1, the use of diesel after the plant installation; for ACTION 2, there are no CO2 emissions from PV production after the plant installation.
Table 10 and Table 11 show clearly that ACTION 2 turns out to be optimal, both in terms of financial and environmental evaluation: ACTION 2 shows the lowest LCOW and no CO2 emissions. On the contrary, ACTION 1 is not sustainable and the impact on the environment does not change practically from BAU.
3. Discussion
A summary of the literature on desalination plants fed by different energy sources is reported in Table 12. For the sake of comparison, our results are included in the table.
As can be seen from Table 12, the LCOW calculated for actions 1 and 2 (Table 11) is in line with small scale RO plants powered by PV or diesel. Economies of scale apply in desalination plants and LCOW varies according to dimension and location. The production of water on islands, especially if remote, is in general more expensive. Apparently, using only LCOW as an indicator to evaluate the whole project, there is no difference between diesel or PV, as in [30].
With both ACTIONs 1 and 2 the yearly cost of water per family lowers: while in the current situation it is $193 (Table 1), with ACTIONs 1 and 2, the cost lowers to $126 (including a markup of 30% for management of the plants by the municipality). The population pays less for more water, as the desalination plant provides 40% more of the current available water.
However, when considering environmental aspects, the choice is driven strongly towards PV.
Finally, it must be noted that the environmental analysis we have performed is in fact underestimating the effect of plastic disposal since microplastic and charred microplastic may have strongly damaging effect on seawater life. Even though Magoodhoo is remote, the population is relatively scarce and touristic annual afflux is practically null, microplastics and especially charred microplastics are found abundantly nearby the island, related to local practices of burning plastic waste at the shoreline [54]. No indicators exist that can quantify the phenomenon.
4. Conclusions
Magoodhoo Island, like many rural atolls in The Maldives, suffers from scarcity of energy and water and has a strong dependence on imports from the mainland.
While rainfall is obviously carbon free, the use of plastic bottles has a negative impact on the environment and high costs for the local population.
In order to provide a proper amount of safe drinkable water to the population, installation of a desalination plant is planned, fed by diesel or by a PV plant equipped with battery storage.
Results are in favor of the combination RO + PV plant (ACTION 2), both from a financial and environmental point of view. In less than three years (PBP indicator), the initial investment can be offset by the savings in the use of water imported from mainland. RO + PV is also environmentally friendly (LEOW indicator).
This is one of the first projects in The Maldives for a sustainable water supply system and we strongly believe that if all islands undertake and strive to change the way they manage water and energy significantly, in the next years The Maldives will appreciate a substantial reduction of CO2 emissions, while guaranteeing good water supply.
The local population living conditions must improve, but not at the expense of a fragile environment. Therefore, any choice involving substantial investments must be accompanied by a financial and environmental analysis. Our project considers both aspects.
Author Contributions
Conceptualization, S.S. and M.F.A.; methodology, S.S., S.C. and M.F.A.; software, M.A. and G.M.; validation, P.G. and S.C.; resources, S.S. and. S.C.; data curation, G.M.; writing—original draft preparation, S.S. and S.C.; writing—review and editing M.F.A., S.S. and M.F.A.; supervision, P.G. All authors have read and agreed to the published version of the manuscript.
Funding
This research received no external funding.
Institutional Review Board Statement
Not applicable.
Informed Consent Statement
Not applicable.
Data Availability Statement
Not applicable.
Acknowledgments
Research developed within the MaRHE Center and B.A.S.E. Center of University Milano Bicocca. The authors are grateful to reviewers for their constructive suggestions.
Conflicts of Interest
The authors declare no conflict of interest.
References
- Styles, D.; Schonberger, H.; Galvez Martos, J.L. Best Environmental Management Practice in the Tourism Sector; Publications Office of the European Union: Luxembourg, 2013. [Google Scholar] [CrossRef]
- Asian Development Bank. A Brighter Future for Maldives Pwered by Renewables Road Mapfor the Energysector 2020–2030; Asian Development Bank: Mandaluyong, Philippines, 2020; ISBN 978-92-9262-514-6. [Google Scholar]
- UN. Available online: https://www.un.org/ohrlls/content/about-small-island-developing-states (accessed on 1 March 2021).
- IEA. Global Energy Review; IEA: Paris, France, 2020; Available online: https://www.iea.org/reports/global-energy-review-2020 (accessed on 1 March 2021).
- Michalenaa, E.; Hills, J.M. Paths of renewable energy development in small island developing states of the South Pacific. Renew. Sustain. Energy Rev. 2018, 82, 343–352. [Google Scholar] [CrossRef]
- Blechinger, P.; Cader, C.; Bertheau, P.; Huyskens, H.; Seguin, R.; Breyer, C. Global analysis of the techno-economic potential of renewable energy hybrid systems on small islands. Energy Policy 2016, 98, 674–687. [Google Scholar] [CrossRef]
- IEA. Global CO2 Emissions by Sector; IEA: Paris, France, 2020; Available online: https://www.iea.org/data-and-statistics/charts/global-co2-emissions-by-sector-2018 (accessed on 1 March 2021).
- Notaro, V.; Puleo, V.; Fontanazza, C.M.; Sambito, M.; La Loggia, G. A decision support tool for water and energy saving in the integrated water system. Procedia Eng. 2015, 119, 1109–1118. [Google Scholar] [CrossRef] [Green Version]
- Liu, J.; Mei, C.; Wang, H.; Shao, W.; Xiang, C. Powering an island system by renewable energy—A feasibility analysis in the Maldives. Appl. Energy 2018, 227, 18–27. [Google Scholar] [CrossRef]
- Meschede, H.; Holzapfel, P.; Kadelbach, F.; Hesselbach, J. Classification of global island regarding the opportunity of using RES. Appl. Energy 2016, 175, 251–258. [Google Scholar] [CrossRef]
- Kuang, Y.; Zhang, Y.; Zhou, B.; Li, C.; Cao, Y.; Li, L.; Zeng, L. A review of renewable energy utilization in islands. Renew. Sustain. Energy Rev. 2016, 59, 504–513. [Google Scholar] [CrossRef]
- Mendoza-Vizcaino, J.; Raza, M.; Samper, A.; Diaz Gonzales, F.; Galceran-Arellano, S. Integral approach to energy planning and electric grid assessment in a renewable energy technology integration for a 50/50 target applied to a small island. Appl. Energy 2019, 233–234, 524–543. [Google Scholar] [CrossRef]
- Meschede, H.; Esparcia, E.A., Jr.; Holapfel, P.; Berthaud, P.; Ang, R.C.; Blanco, A.C.; Ocon, J.D. On the transferability of smart energy systems on off-grid islands using cluster analysis—A case study for the Philippine archipelago. Appl. Energy 2019, 251, 113290–113296. [Google Scholar] [CrossRef]
- Segurado, R.; Krajacic, G.; Duic, N.; Alves, L. Increasing the penetration of renewable energy resources in S. Vicente, Cape Verde. Appl. Energy 2011, 2, 466–472. [Google Scholar] [CrossRef] [Green Version]
- Berthaud, P.; Cader, C. Electricity sector planning for the Philippine islands: Considering centralized and decentralized supply options. Appl. Energy 2019, 251, 113393–113398. [Google Scholar] [CrossRef]
- Surroop, D.; Raghoo, P. Energy landscape in Mauritius. Renew. Sustain. Energy Rev. 2017, 73, 688–694. [Google Scholar] [CrossRef]
- Shea, R.P.; Ramgolam, Y.K. Applied levelized cost of electricity for energy technologies in a small island developing state: A case study in Mauritius. Renew. Energy 2019, 132, 1415–1424. [Google Scholar] [CrossRef]
- Aguirre-Mendoza, A.M.; Diaz-Mendoza, C.; Pasqualino, J. Renewable energy potential analysis in non interconnected islands. Case study: Isla Grande, Corales del Rosario Archipelago, Colombia. Ecol. Eng. 2017. [Google Scholar] [CrossRef]
- Handayani, K.; Krozer, Y.; Filatova, T. From fossil fuels to renewables: An analysis of long-term scenarios considering technological learning. Energy Policy 2019, 127, 134–146. [Google Scholar] [CrossRef]
- Dornan, M.; Jotzo, F. Renewable technologies and risk mitigation in small island developing states: Fiji’s electricitysector. Renew. Sustain. Energy Rev. 2015, 48, 35–48. [Google Scholar] [CrossRef]
- Soomauroo, Z.; Blechinger, P.; Creutzig, F. Unique Opportunities of Island States to Transition to a Low-Carbon Mobility System. Sustainability 2020, 12, 1435. [Google Scholar] [CrossRef] [Green Version]
- Masrur, H.; Howlader, H.O.R.; Elsayed Lofty, M.; Khan, K.R.; Guerrero, J.M.; Seniyu, T. Analysis of Techno-Economic-Environmental Suitability of an Isolated Microgrid System Located in a remote island of Bangladesh. Sustainability 2020, 12, 7. [Google Scholar] [CrossRef] [Green Version]
- Eras-Almeida, A.A.; Egido Aguilera, M.A.; Blechinger, P.; Berendes, S.; Caamaño, E.; García-Alcalde, F. Decarbonizing the Galapagos Islands: Techno-Economic Perspectives for the Hybrid Renewable Mini-Grid Baltra-Santa Cruz. Sustainability 2020, 12, 2282. [Google Scholar] [CrossRef] [Green Version]
- Ali, I.; Shafiullah, G.M.; Urmee, T. A preliminary feasibility of roof-mounted solar PV systems in the Maldives. Renew. Sustain. Energy Rev. 2018, 83, 18–32. [Google Scholar] [CrossRef]
- Wijayatunga, P.; George, L.; Lopez, A.; Aguado, J.A. Integrating Clean Energy in Small Island Power Systems: Maldives Experience. Energy Procedia 2016, 103, 274–279. [Google Scholar] [CrossRef]
- Ministry of Environment. Island Electricity Data Book. 2017. Available online: https://www.environment.gov.mv/v2/en/download/6796 (accessed on 1 March 2021).
- Ibrahim, S.A.; Bari, M.R.; Miles, L. Water Resources Management in Maldives with an Emphasis on Desalination. Available online: http://citeseerx.ist.psu.edu/viewdoc/download?doi=10.1.1.113.913&rep=rep1&type=pdf (accessed on 1 March 2021).
- Alanis-Noyola, A.E.; Prasanna, A.; Rannu, T.; Roja Solorzano, L. Pre-Feasibility Analysis of a Desalination Plant Powered by Renewable Energy in Thira, Greece. In Proceedings of the International Conference on Renewable Energies and Power Quality (ICREPQ’12), Santiago de Compostela, Spain, 28–30 March 2012. [Google Scholar] [CrossRef]
- Fthenakis, V. New Prospects for PV Powered Water Desalination Plants: Case Studies in Saudi Arabia; Brookhaven National Laboratory: Upton, NY, USA, 2015. [Google Scholar]
- Kaya, A.; Tok, M.E.; Koc, M. A Levelized Cost Analysis for Solar-Energy-Powered Sea Water Desalination in The Emirate of Abu Dhabi. Sustainability 2019, 11, 1691. [Google Scholar] [CrossRef] [Green Version]
- Helal, A.M.; Al-Malek, S.A.; Al-Katheeri, E.S. Economic feasibility of alternative designs of a PV-RO desalination unit for remote areas in the United Arab Emirates. Desalination 2008, 221, 1–16. [Google Scholar] [CrossRef]
- Caldera, U.; Breyer, C. Strengthening the global water supply through a decarbonised global desalination sector and improved irrigation systems. Energy 2020, 200, 17507–117554. [Google Scholar] [CrossRef]
- IRENA. Renewable Desalination: Technology Options for Islands. 2015. Available online: https://www.irena.org/publications/2015/Dec/Renewable-Desalination-Technology-Options-for-Islands (accessed on 1 March 2021).
- Yu, Y.; Dale, J. Analysis of a Wave-Powered, Reverse-Osmosis System and Its Economic Availability in the United States. In Proceedings of the 36th International Conference on Ocean, Offshore and Arctic Engineering OMAE, Trondheim, Norway, 25–30 June 2017. [Google Scholar]
- Ahmadi, E.; McLellan, B.; Ogata, S.; Ivatloo, B.M.; Tezuka, T. An Integrated Planning Framework for Sustainable Water and Energy Supply. Sustainability 2020, 12, 4295. [Google Scholar] [CrossRef]
- Jaleel, M.I.; Shaheeda, A.I.; Afsal, H.; Mustafa, M.; Pathirana, A. A Screening Approach for Assessing Groundwater Quality for Consumption in Small Islands: Case Study of 45 Inhabited Islands in the Maldives. Water 2020, 12, 2209. [Google Scholar] [CrossRef]
- Sambito, M.; Freni, G. LCA Methodology for the Quantification of the Carbon Footprint of the Integrated Urban Water System. Water 2017, 9, 395. [Google Scholar] [CrossRef] [Green Version]
- Jeong, H.; Minne, E.; Crittenden, J.C. Life cycle assessment of the City of Atlanta, Georgia’s centralized water system. Int. J. Life Cycle Assess. 2015, 20, 880–891. [Google Scholar] [CrossRef]
- Dettore, C. Comparative Life-Cycle Assessment of Bottled vs. Tap Water System. Master’s Thesis, University of Michigan, Ann Arbor, MI, USA, 2009. [Google Scholar]
- World Health Organization. Available online: https://www.who.int/water_sanitation_health/emergencies/qa/emergencies_qa5/en/ (accessed on 1 March 2021).
- Alkaisi, A.; Mossad, R.; Sharifian-Barforoush, A. A review of the water desalination systems integrated with renewable energy. Energy Procedia 2017, 110, 268–274. [Google Scholar] [CrossRef]
- Monnot, M.; Martínez Carvajal, G.D.; Laborie, S.; Cabassud, C.; Lebrun, R. Integrated approach in eco-design strategy for small RO desalination plants powered by photovoltaic. Desalination 2017, 435, 246–258. [Google Scholar] [CrossRef]
- Nagaraj, R.; Thirugnanamurthy, D.; Murthy Rajput, M.; Panigrahi, B.K. Techno-Economic Analysis of Hybrid Power System siZing Applied to Small Desalination Plants for Sustainable Operation. Int. J. Sustain. Built Environ. 2016, 5, 269–276. [Google Scholar] [CrossRef] [Green Version]
- Atallah, M.O.; Farahat, M.A.; Lotfy, M.E.; Senjyu, T. Operation of conventional and unconventional energy sources to drive a reverse osmosis desalination plant in Sinai Peninsula, Egypt. Renew. Energy 2020, 145, 141–152. [Google Scholar] [CrossRef]
- RETScreen International (2001–2004), Clean Energy Project Analysis: RETScreen Engineering and Cases Textbook; Minister of Natural Resource: Verennes, QC, Canada, 2005; Available online: http://msessd.ioe.edu.np/wp-content/uploads/2017/04/Textbook-clean-energy-project-analysis.pdf (accessed on 1 March 2021).
- Alsheghri, A.; Sharief, S.A.; Rabbani, S.; Aitzhan, N.Z. Design and Cost Analysis of a Solar Photovoltaic Powered Reverse Osmosis Plant for Masdar Institute. Energy Procedia 2015, 75, 319–324. [Google Scholar] [CrossRef] [Green Version]
- Lagioia, G.; Calabró, G.; Amicarelli, V. Empirical study of the environmental management of Italy’s drinking water supply. Resour. Conserv. Recycl. 2012, 60, 119–130. [Google Scholar] [CrossRef]
- Nessi, S.; Rigamonti, L.; Grosso, M. LCA of waste prevention activities: A case study for drinking water in Italy. J. Environ. Manag. 2012, 108, 73–83. [Google Scholar] [CrossRef]
- Perugini, F.; Mastellone, M.L.; Arena, U. A life cycle assessment of mechanical and feedstock recycling options for management of plastic packaging wastes. Environ. Prog. 2005, 24, 137–154. [Google Scholar] [CrossRef]
- Bez, J.; Heyde, M.; Goldhan, G. Waste treatment in product specific life cycle inventories. Int. J. LCA 1998, 3, 100–105. [Google Scholar] [CrossRef]
- Shen, L.; Worrell, E.; Patel, M.K. Open-loop recycling: A LCA case study of PET bottle-to-fibre recycling. Resour. Conserv. Recycl. 2010, 55, 34–52. [Google Scholar] [CrossRef]
- Papong, S.; Malakul, P.; Trungkavashirakun, R.; Pechda, W.; Chom-in, T.; Nithitanakul, M.; Sarobol, E. Comparative assessment of the environmental profile of PLA and PET drinking water bottles from a life cycle perspective. J. Clean. Prod. 2014, 65, 539–550. [Google Scholar] [CrossRef]
- Maldives Central Bank Discount Rate 31 December 2017, Index Mundi. Available online: https://www.indexmundi.com/maldives/central_bank_discount_rate.html (accessed on 1 March 2021).
- Saliua, F.; Montano, S.; Garavaglia, M.G.; Lasagnia, M.; Seveso, D.; Galli, P. Microplastic and charred microplastic in the Faafu Atoll, Maldives. Mar. Pollut. Bull. 2018, 136, 464–471. [Google Scholar] [CrossRef]
Figure 1.
The Faafu Atoll in The Maldives.

Figure 2.
Public water tank used by the inhabitants of Magoodhoo to collect rainfall water for daily use.
Figure 2.
Public water tank used by the inhabitants of Magoodhoo to collect rainfall water for daily use.

Figure 3.
Weekly supply via dhoni of water bottles for the island of Magoodhoo.

Figure 4.
Main components of the RO + photovoltaic (PV) configuration.

Figure 5.
Daily average solar radiation in the site [RETScreen data].

Figure 6.
Photovoltaic plant under construction on the rooftop of Magodhoo Municipality.

Figure 7.
BAU, ACTION 1, ACTION 2; cash flows.


Table 1.
Water consumption (liters) and cost ($) per person, per family, of the whole island.
 |  |  | ||
|---|---|---|---|---|
| PLASTIC BOTTLES | Daily | 0.38 L 0.09 $ | 2.30 L 0.54 $ | 307 L 71.44 $ |
| Monthly | 11.51 L 2.68 $ | 69 L 16.11 $ | 9200 L 2143 $ | |
| Yearly | 138 L 32.17 $ | 830 L 193 $ | 110,400 L 25,721 $ | |
| RAINWATER | Daily | 3.97 L | 23.81 L | 3166 L |
| Monthly | 119.05 L | 714 L | 94,962 L | |
| Yearly | 1429 L | 8568 L | 1,139,544 L | |
Table 2.
Current consumption and target per person, per family, of the whole island (liters per day).
Table 2.
Current consumption and target per person, per family, of the whole island (liters per day).
| | | | |
|---|---|---|---|
| CURRENT | 4.35 L/day | 26.11 L/day | 3471 L/day |
| DESALINATED WATER | 6 L/day | 36 L/day | 4800 L/day |
Table 3.
Technical specifications of the reverse osmosis (RO) plant.
| Characteristic | Unit | Quantity |
|---|---|---|
| Capacity | m3/day | 5 |
| Feed temperature | °C | 25 |
| Water quality | ppm Total Dissolved Solids g/mL | <500 |
| Power consumption | kW | 3.7 |
| Daily operating | h/day | 12 |
| Total energy required | kWh/day | 44.4 |
Table 4.
Cost of the RO plant.
| Components | Cost ($) |
|---|---|
| Reverse osmosis desalination plant-10 PTD | 16,500 |
| Drinking water storage tank | 1500 |
| Water storage for toilet service | 3000 |
| Sea water intake and reject line | 15,000 |
| Sea water intake pump system with control board | 1850 |
| Registration | 5000 |
| Installation materials Masonry (to arrive a 50,000) | 3000 1319 |
| GST 6% | 2830 |
| Total | 50,000 |
Table 5.
Input values for the RETScreen energy model sheet.
| Item | Input Value |
|---|---|
| Solar tracking mode | One-axis |
| Slope | 2 |
| Azimuth | 0° |
| PV module type | Si-monocrystalline-Jkm315M-72 |
| Capacity of one PV unit | 16.23% |
| Number of PV units | 32 |
| Annual solar horizontal radiation (MWh/m2) | NASA 22-year monthly average |
| Miscellaneous losses | 5% (dust and sandstorms) |
| Inverter efficiency (DC to AC) | 96% |
| Inverter capacity | 10 kW |
| Inverter losses | 1% |
| Total annual PV production (kWh/y) | 17,600 |
| Daily PV energy production (kWh/day) | 48 |
Table 6.
PV plant cost (in $).
| Components | Cost $/Wp | |
|---|---|---|
| Module cost ($) | 8427 | 0.84 |
| Inverter | 2520 | 0.25 |
| Balance of System | 4435 | 0.44 |
| Installation labor | 3226 | 0.32 |
| Installer margin and overhead | 11,392 | 1.15 |
| Total | 30,000 | 3.00 |
Table 7.
Business as usual (BAU).
| Total plastic water consumption per year: 110,400 L |
| Annual cost: $25,721 |
| Annual CO2 consumption: 8.255 tons |
| Pros: no need of investments for water supply |
| Cons: Consumption of plastic water bottles and large production of CO2, low predictability of the rainwater amount (there have been recent phenomena of water shortage, solved by municipality intervention), potential damage to health from nonfiltered water for drinking and cooking. |
Table 8.
ACTION 1 Desalination and conventional fuel ($).
| Desalination plant capital expenditure: 50,000 |
| Fixed Annual cost (O&M desalination plant): 1000 |
| Fuel generator initial cost: 5000 |
| Fixed Annual cost (fuel alimentation): 4116.84 |
| Annual CO2 consumption: 12.033 tons |
| Pros: no use of plastic bottles, stability of production during operating hours, possible use of rainwater for drinking and cooking in case of failure. In case of major need, the system may work until 24 h a day at a higher cost. |
| Cons: CO2 emissions are almost 50% more than those in BAU, cost of fuel variable, depending on market conditions. |
Table 9.
ACTION 2 Desalination and PV plant with battery storage ($).
| Desalination plant capital expenditure: 50,000 |
| PV plant capital expenditure: 30,000 |
| Battery cost: 1500 |
| Fixed Annual cost (O&M desalination plant): 1000 |
| Fixed Annual cost (O&M PV plant): 100 |
| Annual CO2 consumption: 0 kg |
| Pros: no use of plastic bottles, possible use of rainwater for drinking and cooking in case of failure, totally CO2 free, energy free of charge and stable due to batteries, total independence from local energy provider. |
| Cons: higher initial capital expenditure. In case of extreme bad weather, the PV production may decrease but the storage allows a stable production. In case of major need, the system should be equipped with additional PV modules and battery storage at a higher cost. |
Table 10.
Net Present Value (NPV), Payback period (PBP).
| NPV ($) | PBP (Years) | |
|---|---|---|
| BAU | −206,374 | Not applicable |
| ACTION 1 | 115,436 | 1.42 |
| ACTION 2 | 117,149 | 2.27 |
Table 11.
Levelized cost of water (LCOW) and levelized emission of water (LEOW) of each alternative for the whole island.
Table 11.
Levelized cost of water (LCOW) and levelized emission of water (LEOW) of each alternative for the whole island.
| | LCOW ($/m3) | LEOW (kg/m3) | |
|---|---|---|---|
| BAU | 1249.944 m3/y | 22.58 | 6.6 |
| ACTION 1 | 1825 m3/y | 7.095 | 6.59 |
| ACTION 2 | 1825 m3/y | 6.961 | 0 |
Table 12.
Summary of the literature data; our data are included.
| Reference | Desalination Technology | Power Technology | Location | Dimension m3/Day | LCOW (USD/m3) |
|---|---|---|---|---|---|
| [26] | Reverse Osmosis | PV | Sinai Peninsula Egypt | 100 | 0.59 |
| [27] | Multi-stage flash | PV | Thira, Greece | 1000 | 0.49 |
| Reverse Osmosis | Wind | 1.97 | |||
| [29] | Multi-stage flash | PV | The Emirate of Abu Dhabi | 90,000 | 0.8–1.5 |
| Multi-effect distillation | 90,000 | 0.7–1.2 | |||
| Reverse Osmosis | 90,000 | 0.2–0.4 | |||
| [28] | Reverse Osmosis | PV | Saudi Arabia | 6550 | 1.21–1.42 |
| 190,000 | 0.85–0.89 | ||||
| [30] | Reverse Osmosis | Motor diesel | United Arab Emirates | 20 | 7.64 |
| PV | 7.34 | ||||
| [33] | Reverse Osmosis | Wave energy converter | USA | 2000–5800 | 1.79–2.2 |
| [34] | Reverse Osmosis | PV | Middle East | 1–400 | 1.5–33.0 |
| Wind | 50–3360 | 0.7–9.0 | |||
| [47] | Reverse Osmosis | PV | United Arab Emirates | 1344 | 0.83 |
| Our solution | Reverse Osmosis | BAU | Faafu Atoll The Maldives | 5 | 22.6 |
| Motor diesel | 7.09 | ||||
| PV +battery | 6.96 |
Publisher’s Note: MDPI stays neutral with regard to jurisdictional claims in published maps and institutional affiliations. |
© 2021 by the authors. Licensee MDPI, Basel, Switzerland. This article is an open access article distributed under the terms and conditions of the Creative Commons Attribution (CC BY) license (http://creativecommons.org/licenses/by/4.0/).
Share and Cite
MDPI and ACS Style
Acciarri, M.F.; Checola, S.; Galli, P.; Magatti, G.; Stefani, S. Water Resource Management and Sustainability: A Case Study in Faafu Atoll in the Republic of Maldives. Sustainability 2021, 13, 3484. https://doi.org/10.3390/su13063484
AMA Style
Acciarri MF, Checola S, Galli P, Magatti G, Stefani S. Water Resource Management and Sustainability: A Case Study in Faafu Atoll in the Republic of Maldives. Sustainability. 2021; 13(6):3484. https://doi.org/10.3390/su13063484
Chicago/Turabian StyleAcciarri, Maurizio Filippo, Silvia Checola, Paolo Galli, Giacomo Magatti, and Silvana Stefani. 2021. "Water Resource Management and Sustainability: A Case Study in Faafu Atoll in the Republic of Maldives" Sustainability 13, no. 6: 3484. https://doi.org/10.3390/su13063484
Note that from the first issue of 2016, this journal uses article numbers instead of page numbers. See further details here.