Article

An Integrated Modelling Study on the Effects of Weir Operation Scenarios on Aquatic Habitat Changes in the Yeongsan River

1
Yeonsan River Environment Research Center, National Institute of Environmental Research, Gwangju 61011, Korea
2
National Institute of Environmental Research, Incheon 22689, Korea
*
Author to whom correspondence should be addressed.
Sustainability 2022, 14(10), 6090; https://doi.org/10.3390/su14106090
Submission received: 6 April 2022 / Revised: 16 May 2022 / Accepted: 16 May 2022 / Published: 17 May 2022
(This article belongs to the Special Issue Integrated Watershed Management for Adaptation to Climate Change)

Abstract

:
The Seungchon and Juksan Weirs were constructed in 2012 through four major river projects to control floods and secure water in the Yeongsan River. However, anthropogenic changes in the environment can lead to loss of biodiversity and longitudinal connectivity and the deterioration of ecosystem health. The objective of this study is to evaluate the effects of physical and chemical changes in the Yeongsan River on aquatic habitats through an integrated (water quality–aquatic habitat) model (i.e., Delft3D and HABITAT). The target species used to simulate habitat suitability included Squalidus chankaensis tsuchigae (an endemic fish), Cyprinus carpio, and Micropterus salmoides (an invasive species of fish). Based on the results, maintaining the lowest water level in one of the two weirs was predicted to improve the habitat of the target species. In particular, the habitat area was greatly improved, especially when the Juksan Weir was completely opened. Furthermore, resistance to environmental changes due to habitat area changes indicates that invasive species adapt more to environmental changes than endemic species. This study suggests that physical and chemical changes in the environment can predict the impact on the health of the aquatic ecosystems, which will be useful in establishing an integrated water management plan. These results can be used as basic data for supporting water management policy, to apply an aquatic ecology prediction model suitable for the Yeongsan River system, and to present a management plan for improving the health of an aquatic ecosystem.

1. Introduction

Aquatic ecosystems include the habitats of living organisms and can change due to spatiotemporal changes in the physicochemical characteristics of the habitat and the physiological and behavioral characteristics of fish and benthic macroinvertebrates. In particular, artificial changes in the physical environment can lead to problems such as the loss of biodiversity and longitudinal connectivity, as well as the deterioration of ecosystem health. To address these problems, various methods have been proposed for the restoration of natural aquatic environments and the improvement of aquatic ecosystem health [1,2,3].
In the “second master plan to manage the national water environment” established in 2016, the Ministry of Environment (MOE) set the goal of maintaining and restoring aquatic ecosystem health to the excellent (B) grade or higher in river waters across the country by 2025 [3]. Subsequently, in the “first master plan for national water management” established in 2021, the restoration of natural aquatic environments and securing the health of aquatic ecosystems were presented as major strategies for achieving the goal of a “sound water cycle”. However, the Yeongsan River exhibits the worst aquatic system health among the five major rivers in Korea, and the epilithic diatom health index is lower than the national average at most of the survey points along this river [3,4].
Changes in an aquatic ecosystem require a comprehensive analysis that takes into consideration the organisms which inhabit the river, as well as the physical and chemical properties of the river. To achieve the present and future policy goals, it is important to develop an ecological information-based approach for comprehensively identifying the current status of this river ecosystem. To this end, recent research on aquatic ecosystem models has expanded to include the analysis of physical habitats. Physical habitat analysis involves analyzing habitat changes by combining the ecological information of aquatic organisms from a hydraulic perspective (including physical and chemical changes in rivers) and a hydrological perspective (including changes in water balance due to factors such as the weather, rainfall, and watersheds) [5,6]. Thus, this analysis comprises hydraulic analysis of physical and chemical changes and habitat analysis that simulates quantitative and qualitative changes in the conditions of habitats preferred by aquatic organisms [7,8,9]. In other countries, research has been conducted using the instream flow incremental methodology (IFIM) to examine the ecological flow needs required for the survival of aquatic organisms in rivers [1,10,11,12,13,14,15,16,17]. Physical habitat analysis has also been used in Korea since 2000, and plans have been established to minimize the adverse effects of various river-related projects on aquatic ecosystems. Studies have been conducted on the calculation of the environmental flow [12,18,19,20,21,22], the modification of dam discharge scenarios [12,23,24], the impacts of weir removal [25,26,27,28], the restoration of natural river channels [20,27,29], and the evaluation of habitat changes through river restoration projects [7,29,30]. However, previous studies have primarily focused on predicting changes in aquatic habitats due to changes in physical environments (such as water depth and flow velocity). These studies have limitations in evaluating integrated water management practices for managing water quantity, water quality, and aquatic ecosystems in a comprehensive manner. The efficient management of aquatic ecosystems in rivers requires an analytical tool that can comprehensively consider the functions of aquatic ecosystems by integrating physical, chemical, and biological information and also predict changes in aquatic ecosystem health due to environmental changes [31,32,33,34].
This study is a project planned over a total of three years. The main contents of the previous study were the changes in aquatic ecology due to changes in water quantity, and the one target fish species in Yeongsan River was applied [35]. However, this study aimed to qualitatively and quantitatively evaluate how physical and chemical changes in a river affect the habitats of aquatic organisms inhabiting the ecosystem. Based on our analysis, we present management plans from an integrated water management perspective by developing an integrated hydraulics–water quality–aquatic habitat prediction model suitable for the Yeongsan River system. To this end, we used the Delft3D model (a three-dimensional (3D) numerical model developed by Deltares in the Netherlands) and HABITAT (a habitat model). The Delft3D model can evaluate changes in the hydraulics, riverbed, water quality, and algae, according to various prediction purposes, and it can be linked with the HABITAT model to evaluate habitat suitability for various species. In this study, the Delft3D-FLOW, Delft3D-WAQ, and HABITAT models were linked for the freshwater section in the main stream of the Yeongsan River. Accordingly, we evaluated how changes in the physical and chemical environments (a result of the multi-function weir operation) affected aquatic habitats in the study area. The integrated hydraulics–water quality–aquatic habitat prediction model constructed in this study is expected to be a useful analytical tool for the management of various aquatic ecosystems in rivers.

2. Materials and Methods

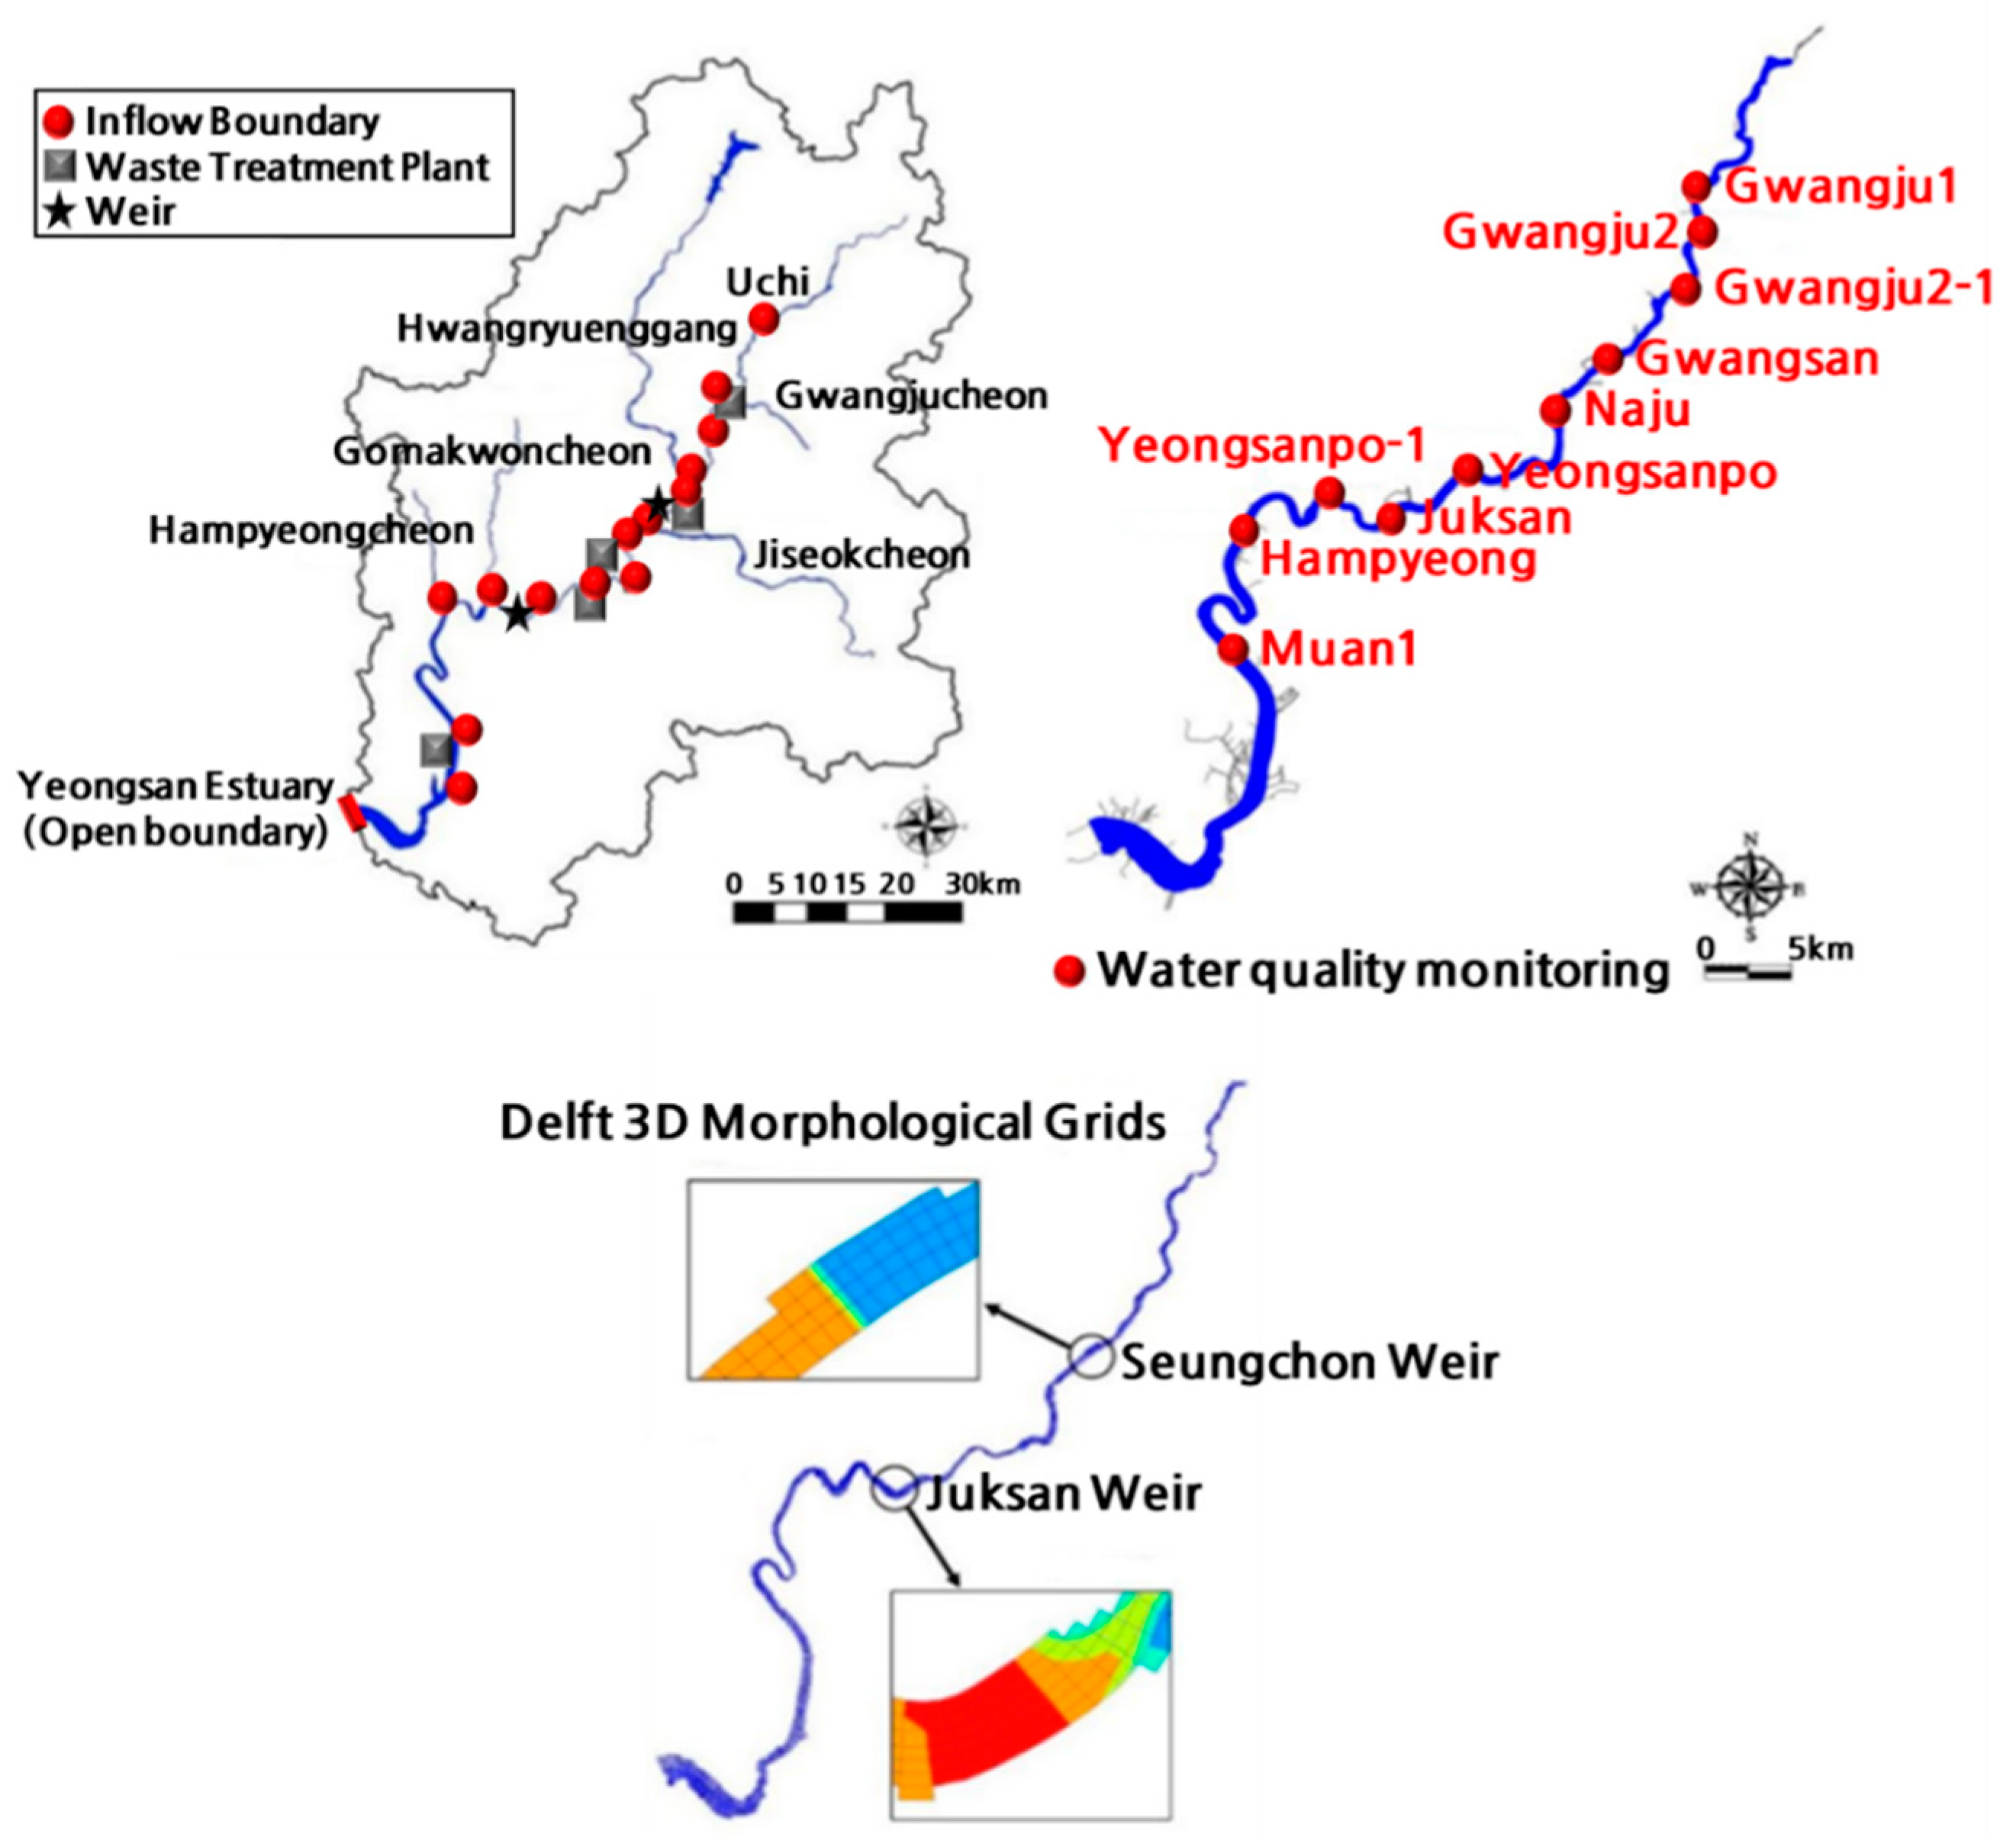
2.1. Study Area and Input Data

In this study, the Delft3D model was constructed for an approximately 103 km long section of the main stream of the Yeongsan River (Figure 1). This section extended from Wuchi point (in the water quality monitoring network) to the Yeongsan River estuary bank. Orthogonal variable grids were used for grid configuration, and the number of grids was 2626. The horizontal grid sizes ranged from 47 m to 315 m, and the average grid size was 145 m in the lateral direction and 113 m in the longitudinal direction. The vertical direction was composed of five equally spaced water layers that were determined through the application of the σ-coordinate system. The altitudes of all grids were constructed using data from the Korea Institute of Civil Engineering and Building Technology (KICT) [36]. The inflow boundary conditions were defined for the model by constructing 20 boundary conditions, including 13 tributaries (e.g., the Hwangryong River, Jiseok Stream, and Gwangju Stream) and the effluent from 6 public sewage treatment plants (e.g., Gwangju, Damyang, and Naju). The weather boundary conditions were defined using hourly data provided by the Korea Meteorological Administration (KMA) [37], including information regarding the temperature, precipitation, and evaporation (including the amount of cloud cover). Data from the Gwangju and Mokpo weather stations were used.
To estimate flow according to the inflow boundary conditions, we used the weekly flow data from the Water Environment Information System (WEIS) [38] and the daily flow data from the Yeongsan River Flood Control Center of the Water resources Management Information System (WAMIS) [39]. The data from the WEIS were used for water quality, and the effluent data from the sewage treatment plants were constructed and applied using the daily data released by each research institute. In addition, the downstream boundary conditions were defined using data regarding the daily water level at the Yeongsan River estuary bank, as provided by the Yeongsan River Flood Control Center [39]. In addition, fish monitoring was carried out using the cast nets and kick nets. As a result of on-site monitoring, three species of dominant and subdominant species were found, which correspond to about 63% of the study area. In the present study, we performed physical habitat analysis on three species, i.e., Squalidus chankaensis tsuchigae, Cyprinus carpio, and Micropterus salmoides, to understand the effects of weir operation scenarios on the aquatic habitat.

2.2. Methods

2.2.1. The Delft3D Model

The Delft3D model is a 3D numerical model developed by Deltares in the Netherlands and can simulate flows (including sediment transport) and changes in water quality in freshwater, estuaries, and marine water bodies. This model allows the selection of various modules (hydraulics, water quality, algae, and sediment transport (including deposits)), and these can be linked and applied according to the research objectives. The Delft3D-FLOW module includes four options for numerical analysis (stability, implicit-explicit methods, error rate reduction, and rapid fluctuation simulation), and the advection term can be calculated by selectively combining and applying these options. The Delft3D-WAQ module can analyze water quality and is applied in connection with flow field information through hydraulic analysis. It can simulate the behavior of dissolved oxygen, nutrients, and organic matter—as well as changes in these factors—through a wide range of reaction networks of organic matter (e.g., mineralization, precipitation and resuspension, and nitrification and denitrification). The Delft3D-BLOOM module can simulate competition among various algae and populations based on the adaptation of species to various limiting factors and species extinction. The Delft3D model and its various modules have been applied in several studies [40,41,42,43].
The Delft3D-FLOW module consists of 3D nonlinear continuity equations and shallow water equations for mathematical analysis. The governing equations summarized under the Boussinesq assumption for an incompressible fluid are detailed below [43].
ζ t + 1 G ξ ξ + G η η ( ( d + ζ ) U G η η ξ + 1 G ξ ξ + G η η ( ( d + ζ ) V G ξ ξ η = ( d + ζ ) Q
where t is the time; ξ and η are the horizontal axes in a spherical coordinate system; Q is the flow rate (m3/s); ζ is the water depth above the datum level (m); d is the water level below the datum level (m); and U and V are the average flow velocities (m/s) in the ξ and η directions, respectively. In the Delft3D model, the flow velocity in the vertical direction is calculated from the continuity equation and the momentum equations in the horizontal (ξ) and vertical (η) directions are as follows [43]:
u t + u G ξ ξ u ξ + v G η η u η + ω d + ζ u σ v 2 G ξ ξ G η η G η η ξ + u v G ξ ξ G η η G ξ ξ η f v = 1 ρ 0 G ξ ξ P ξ + F ξ + 1 ( d + ζ ) 2 σ ( ν V u σ ) + M ξ
v t + u G ξ ξ v ξ + v G η η u η + ω d + ζ v σ u v G ξ ξ G η η G η η ξ + u 2 G ξ ξ G η η G ξ ξ η + f u = 1 ρ 0 G η η P η + F η + 1 ( d + ζ ) 2 σ ( ν V v σ ) + M η
where ω is the flow velocity in the vertical direction (m/s); f is the Coriolis constant (1/s); ρ0 is the density of seawater (kg/m3); ν is the kinematic viscosity (m2/s); Pξ and Pη are pressure gradients and Fξ and Fη are the Reynolds pressure imbalances (m2/s) in the ξ and η directions, respectively; and Mξ and Mη are the generated and extinct momentums, respectively. In addition, the state (density), hydrostatic pressure condition, and turbulence terms are included in the basic equation to construct the basic Delft3D-FLOW module [43].
C t + ( u C ) x + ( v C ) y + ( ω C ) z = x ( K x C x ) + y ( K y C y ) + x ( K z C z ) + S c
where C is the water quality-related ecological variable; u, v, and ω are flow velocities in the x, y, and z directions, respectively; Kx, Ky, and Kz are turbulent diffusion coefficients in the x, y, and z directions, respectively; and Sc is the external and internal generation terms and extinction terms.
In the Delft3D-WAQ module, the basic equation is similar to the thermohaline conservation equation and biogeochemical internal generation and extinction terms can be added. In addition, it can take into account the dynamic responses of 32 water quality-related ecological variables. Moreover, generation and extinction actions for each water quality variable and interactions between them can also be considered. In this study, we included an empirical formula for the heat exchange between water and air and added the items of nitrification, denitrification, and oxygen consumption to the basic DO-BOD model. This allowed us to consider interactions between variables for external and internal generation and extinction terms. Detailed descriptions of the empirical formulas for water quality items and the interactions between variables (obtained through generation and extinction actions for each applicable water quality variable) can be found in [43].

2.2.2. The HABITAT Model

Depending on the purpose, the HABITAT model can be utilized in the form of various models, including data-based, structural, and habitat suitability assessment models. The HABITAT model in the form of a habitat suitability assessment model was developed by Deltares in the Netherlands, and it is a tool for spatiotemporal analysis that supports watershed-level planning as well as river environments. Lim et al. [35] and Haasnoot and van de Woolfshaar [44] reported that the habitat suitability assessment model is based on ecological information and can be used for qualitative (e.g., spatial distribution of a habitat) and quantitative (e.g., habitat area for specific species or communities of species) evaluations. In addition, it can be used to analyze changes in the distribution and area of habitats due to various external environmental changes (e.g., floods, droughts, and the installation and operation of artificial structures). In the HABITAT model, the main input variable is the response curve (knowledge rule), and the habitat suitability index (HSI) is applied for each species. To improve the quality of research for HABITAT model performance, Deltares provides formulas or graphs (free of charge) detailing the habitat distribution relationships for basic habitat environmental conditions, as well as information regarding various target species in ecosystems.
In the HABITAT model, four modules can be selected, depending on the independent variable (an environmental factor) and the dependent variable (the target species). The broken linear model—the most basic module in the HABITAT model—considers a single dependent variable (e.g., water depth and flow velocity) and is used to assess habitat suitability. However, because complex aquatic environments are reflected using only one variable, simulations of habitat suitability using this module show high uncertainty. Therefore, the formula-based module in the HABITAT model is used because it considers two or more environmental factors simultaneously. The classification module can identify changes in habitats according to the particle size of riverbed materials and assess the habitats of various species in a community according to water depth and flow velocity. This module applies one environmental factor for various independent variables and identifies results by designating independent variables corresponding to the ranges of environmental factors. In addition, it ensures the reliability of habitat change assessments for various species (e.g., lotic, lentic, and benthic species) by using data on various environmental factors.

2.2.3. Statistical Methods for Reproducibility

To verify the reproducibility of the Delft3D model applied to the main stream of the Yeongsan River, we performed model calibration from 1 January to 31 December 2018, and model verification from 1 January to 31 December 2019. Nash–Sutcliffe efficiency (NSE), percent bias (Pbias), bias, index of agreement (IOA), and mean absolute error (MAE) were used as indicators for the analysis of reproducibility. NSE was used as an indicator of the proficiency of model predictions; Bias and Pbias were used as indicators of the average direction of data; and MAE and IOA were used to analyze the differences in prediction accuracy. As NSE and IOA approached 1 and Bias and MAE approached 0, they were judged as target values. The indicators were expressed as follows [45]:
NSE = 1 i = 1 N ( O i P i ) 2 i = 1 N ( O i O ¯ i ) 2
PBIAS = i = 1 N ( O i P i ) i = 1 N O i × 100
BIAS = 1 N i = 1 N ( P i O i )
IOA = 1 i = 1 N ( O i P i ) 2 i = 1 N ( | P i O ¯ i | + | O i O ¯ i | ) 2
MAE = 1 N i = 1 N | P i O i |
where Pi is the simulated value (time i); Oi is the observed value (time i); and O ¯ i is the average value observed during the entire period.
A model based on the signal detection theory was used to examine and evaluate the reproducibility of the HABITAT model. Using this method, comparisons of model predictions and measured values can be expressed in four combinations: “True positive (Tp)”, which represents consistency between the prediction and reality; “False negative (Fn)” and “False positive (Fp)”, which indicate a discrepancy between the prediction and reality; and “True negative (Tn)”, which indicates nonreproducibility in terms of both prediction and reality. Based on this, the accuracy of the results was calculated using the correct classification rate (CCR) as follows [46]:
CCR ( % ) = ( T p + T n ) ( T p + F p + T n + F n ) × 100
where Tp, Tn, Fp, and Fn represent the number of times the corresponding results were obtained. The HSI calculated in the HABITAT model ranges from 0 (unsuitable) to 1 (suitable); therefore, it may affect the CCR, depending on the population and HSI standards obtained through an actual field survey [1,3,7,35].

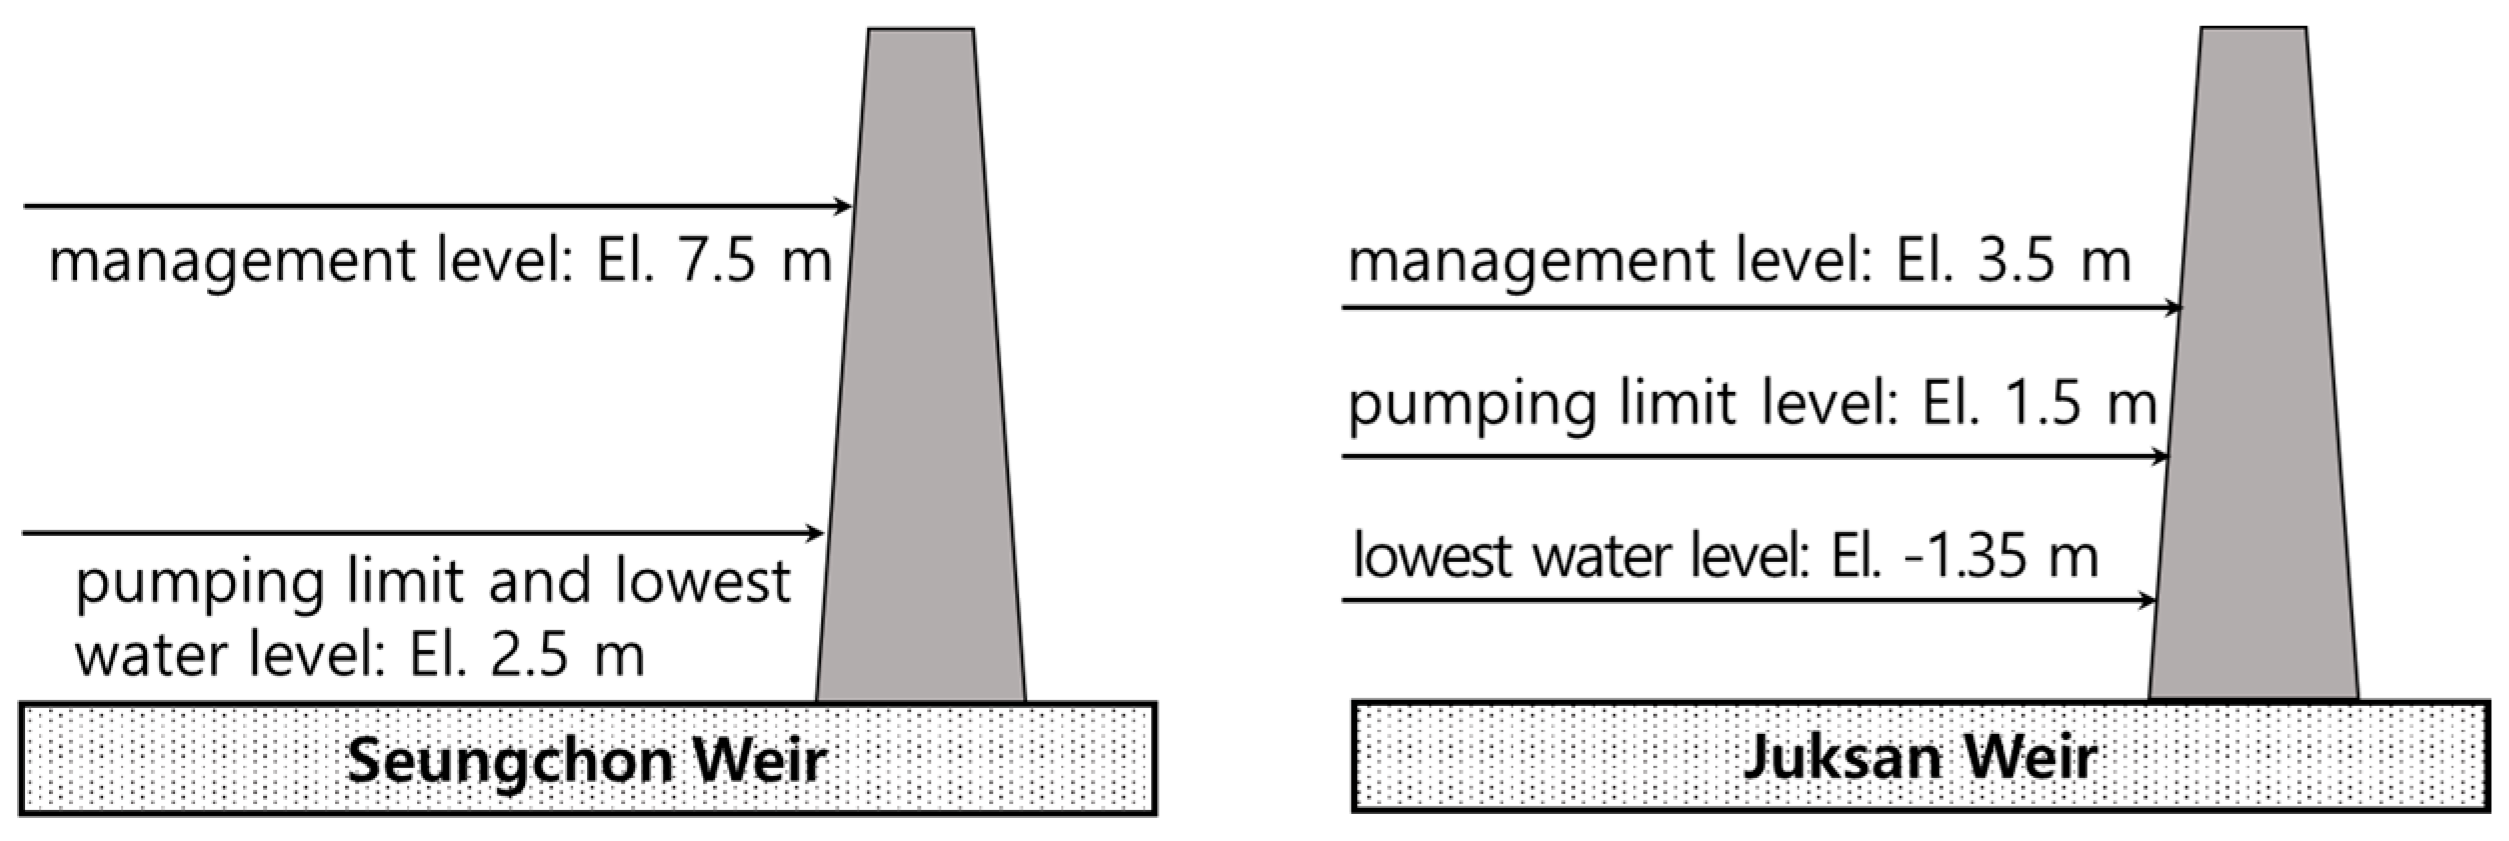
2.2.4. Scenarios of Weir Operation

As part of the ‘Four Major Rivers Project’, two weirs were constructed in the main stream of the Yeongsan River to increase water use and flood control capacity. Although the amount of water has increased due to the construction of the weir, the water depth was deepened and the flow was delayed, and there are disadvantages, such as longitudinal disconnectivity and aquatic habitat deterioration.
Simulation conditions (scenarios) were constructed to identify the effects of hydraulic structure operations on changes in habitat suitability (Figure 2). For the Seungchon and Juksan Weirs installed on the main stream of the Yeongsan River, scenarios were constructed under the assumption that a certain water level would be maintained by opening the sluice gates according to recent weir-opening conditions.
Scenario 1 involved the partial opening of the Seungchon Weir (EL, 6.0 m) and partial opening of the Juksan Weir (average water level EL, 1.5 m), whereas Scenario 2 involved the full opening of the Seungchon Weir (EL, ~2.7 m) and partial opening of the Juksan Weir (average water level EL, 1.5 m). Scenario 3 involved the partial opening of the Seungchon Weir (EL, 6.0 m) and full opening of the Juksan Weir (EL, −1.35 m (lowest)). These scenarios include cases in which the weirs are partially or fully opened; therefore, it is possible to compare the changes in habitats according to the operation of existing hydraulic structures.

3. Results and Discussion

In this study, HABITAT 3.0 (Deltares, Delft, The Netherlands) was used to analyze changes in the habitat suitability for target species. The grids generated in the Delft3D model were converted and applied using the Surfer 16 software [35]. Physical habitat analysis is a numerical tool that quantifies the quality of the aquatic habitats for target species at a certain given discharge. For physical habitat analysis, hydraulic and habitat simulations must be performed. Therefore, the results of the Delft3D-FLOW and Delft3D-WAQ modules were utilized to assess physical and chemical changes, respectively. In the HABITAT model, the input data included the habitat suitability curves (HSCs) of the physical and chemical variables for each target species. The target species were selected based on the species that inhabit or occur in the Yeongsan River system. In the first year, the candidate species were examined to secure their ecological importance and association with the project. Subsequently, we selected the following target species for this study: Squalidus chankaensis tsuchigae, a dominant and endemic species in the Yeongsan River system; Cyprinus carpio, a species that overlapped with the project in the first year; and Micropterus salmoides, an exotic species.
Squalidus chankaensis tsuchigae is an endemic species of the Republic of Korea and mainly inhabits rivers flowing into the West Sea, such as the Han River, Mangyeong River, Geum River, and Yeongsan River. It mainly inhabits the middle of rivers or reservoirs, where there is a lot of aquatic vegetation and shallow water. Cyprinus carpio lives in places with muddy bottoms, such as puddles and ponds. In winter, they dive deep into the water, and when the water temperature rises, they flock to shallow places. Some live in the estuaries of rivers with slightly salty water. Micropterus salmoides is a species of fish belonging to the order Bass and is largely divided into freshwater bass and sea bass. The most common freshwater bass is the black bass, which lives mainly in lakes and rivers. The most significant characteristic of bass is that they reproduce easily and show rapid growth. The most common bass in Korea is the freshwater bass, which began to enter the domestic ecosystem in 1975 after the discharge of Lake Paldang. On the other hand, the bass, which is native to North America, is a very aggressive fish species [47,48,49,50,51].
Table 1 lists the input data of HSI for the target species applied to the HABITAT model. In addition, Figure 3 shows the HSCs of physical and chemical variables constructed using the Instream Flow and Aquatic Systems Group (IFASG) method [52]. The HSCs provide values of a habitat suitability index (HSI) as a function of physical habitat variables. In the present study, this method sets the range of each physical factor in fish monitoring data and gives the values of habitat suitability indexes 1.0, 0.5, 0.1, and 0.05 to the values of the population distribution of fish, corresponding to the top 50%, 75%, 90%, and 95% of the total population when the population of fish corresponds to each range [52]. These variables were constructed using available data, such as those collected by the basic environmental survey project and the eco-river project (2007–2011) [53].

3.1. Model Calibration and Verification

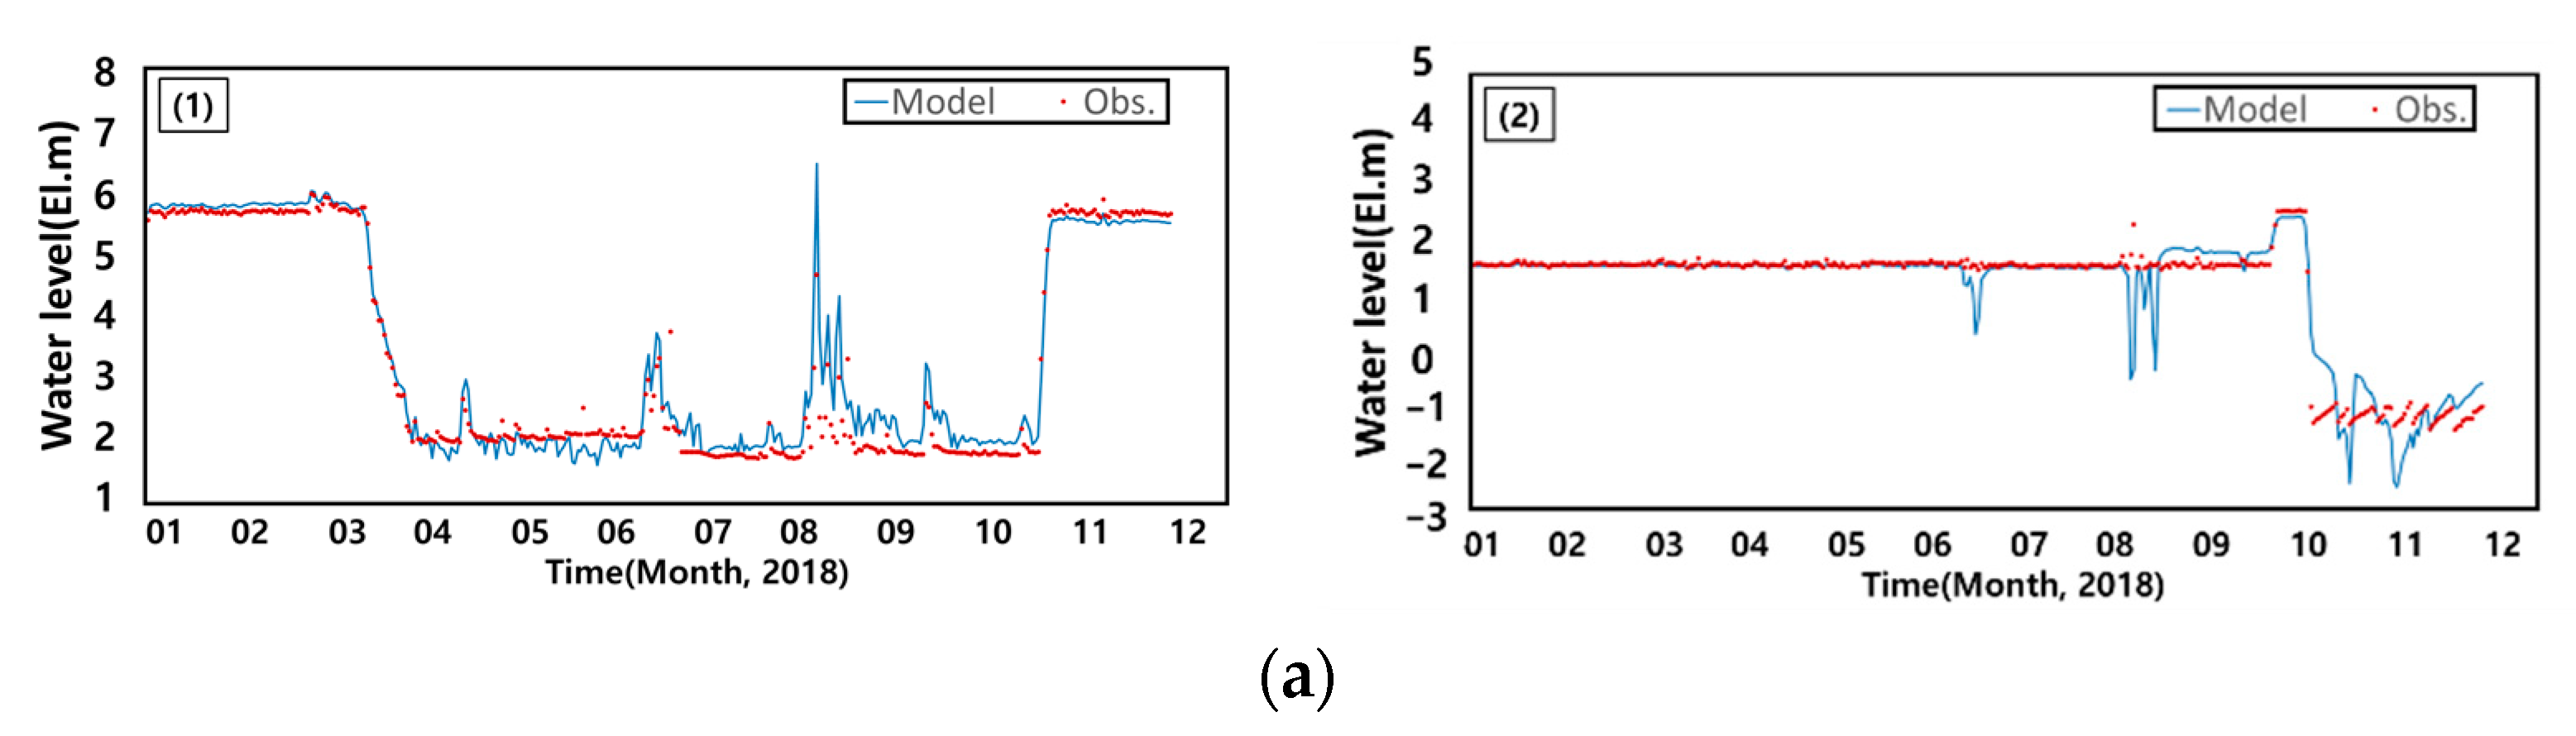
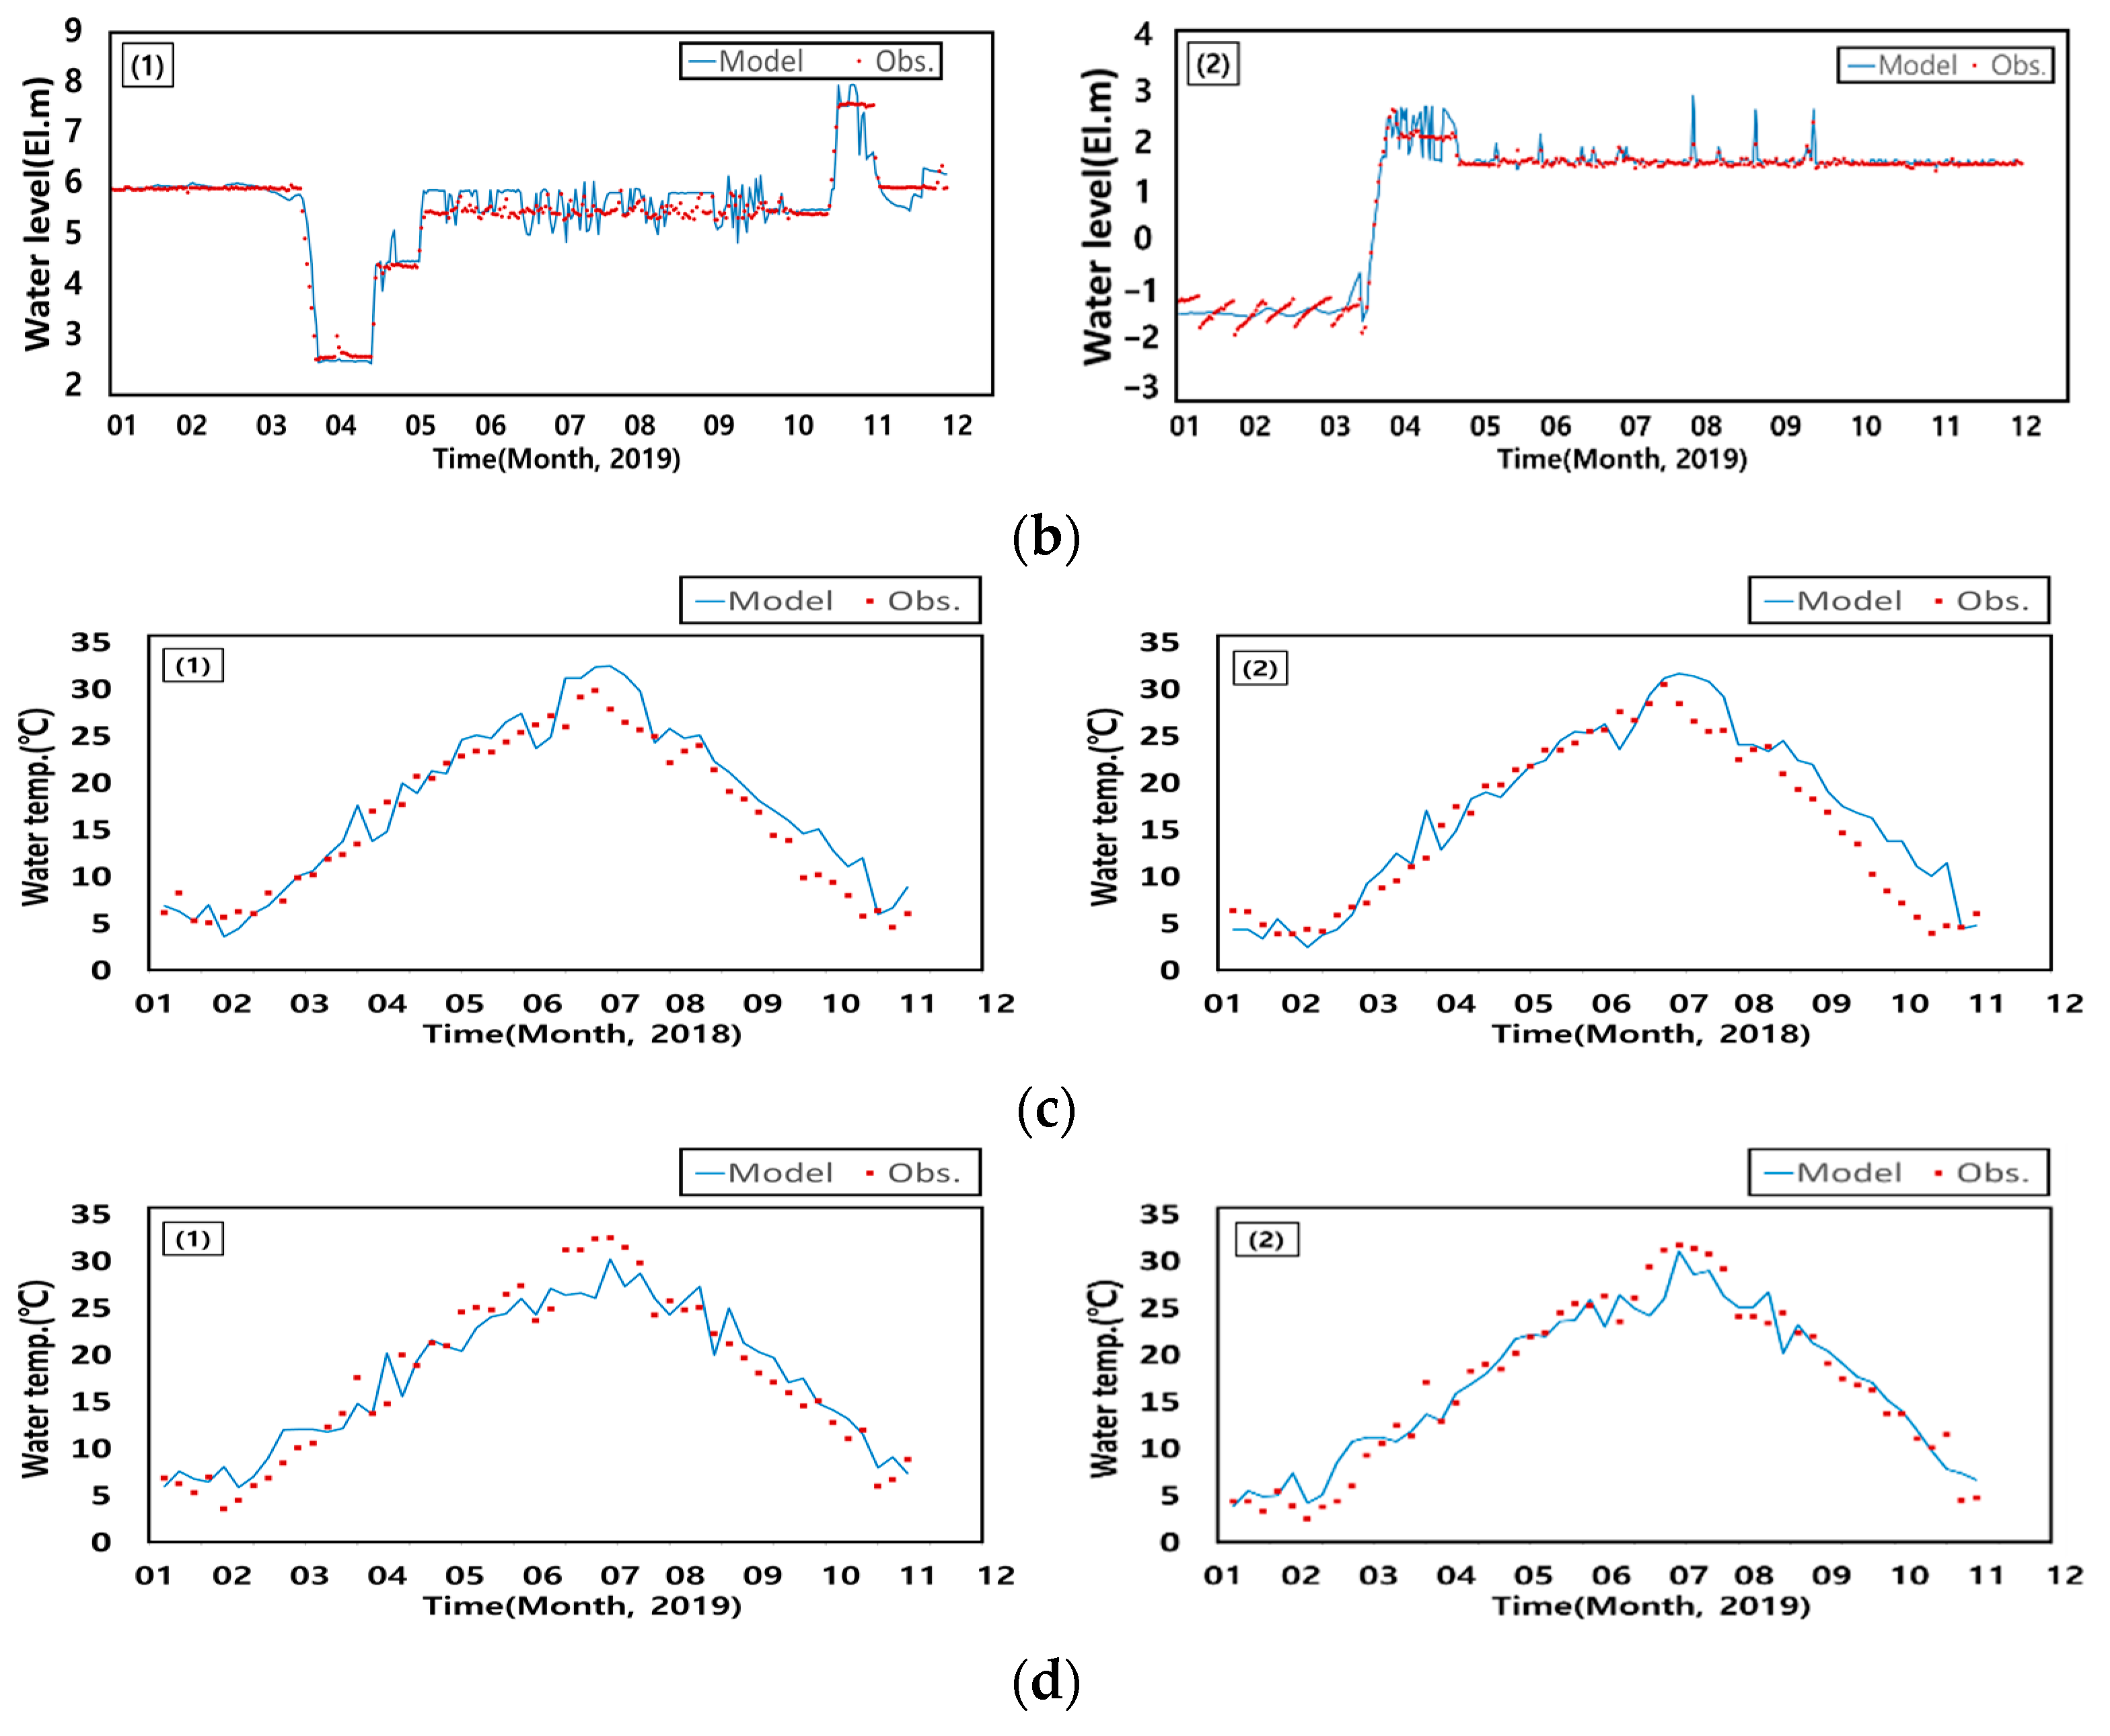
3.1.1. The Delft3D-FLOW Model

The Delft3D-FLOW model was used to examine the reproducibility of water levels at the Seungchon and Juksan Weirs on the Yeongsan River. The results confirmed that the simulated values approached the observed values and the indicators were calculated as follows: Bias, −0.11 to 0.43 m; MAE, 0.16 to 0.46 m; NSE, −2.71 to 0.97; Pbias, −2.08 to 6.54%; and IOA, 0.72 to 0.99 (Figure 4a,b). The reproducibility of the model for water temperatures was examined using water temperature data from the water quality monitoring network at the same locations, as provided by the MOE. For the observed and simulated values of water temperature, the Bias values ranged from −1.65 to 0.16 °C; MAE from 0.06 to 0.35 °C; NSE from 0.72 to 0.97; Pbias from −2.03 to 1.41%; and IOA from 0.88 to 0.99 (Figure 4c,d). The accuracy was also evaluated according to Moriasi et al. [54], and the results corresponded to grades ranging from ‘Satisfactory’ to ‘Very good’.

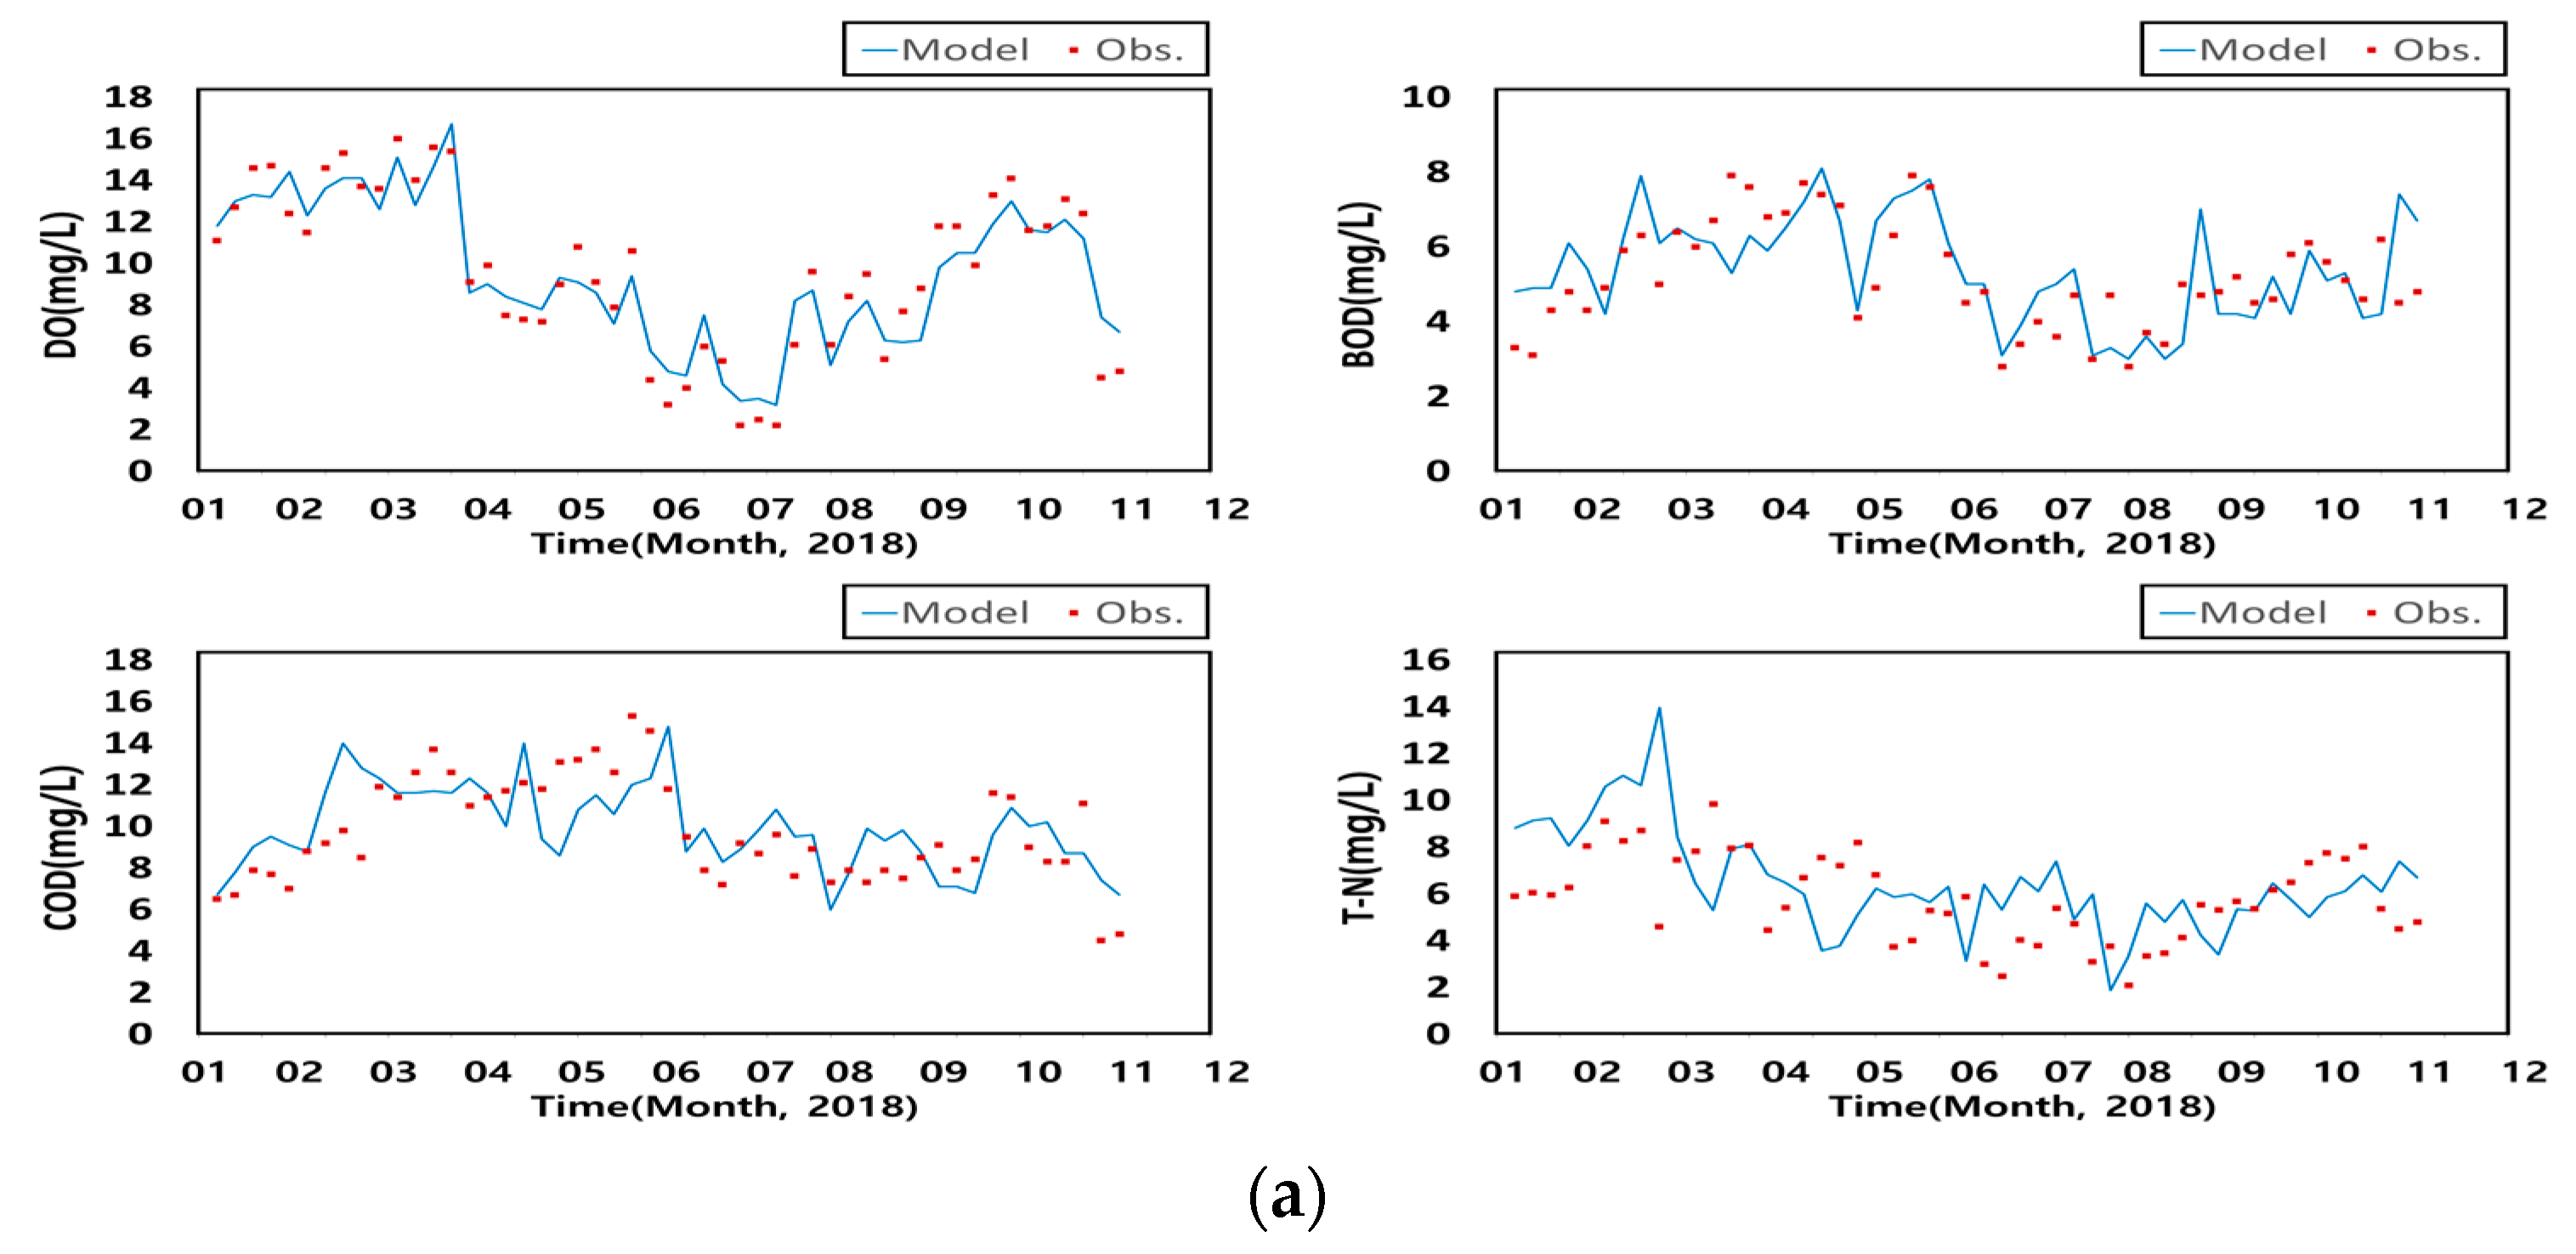
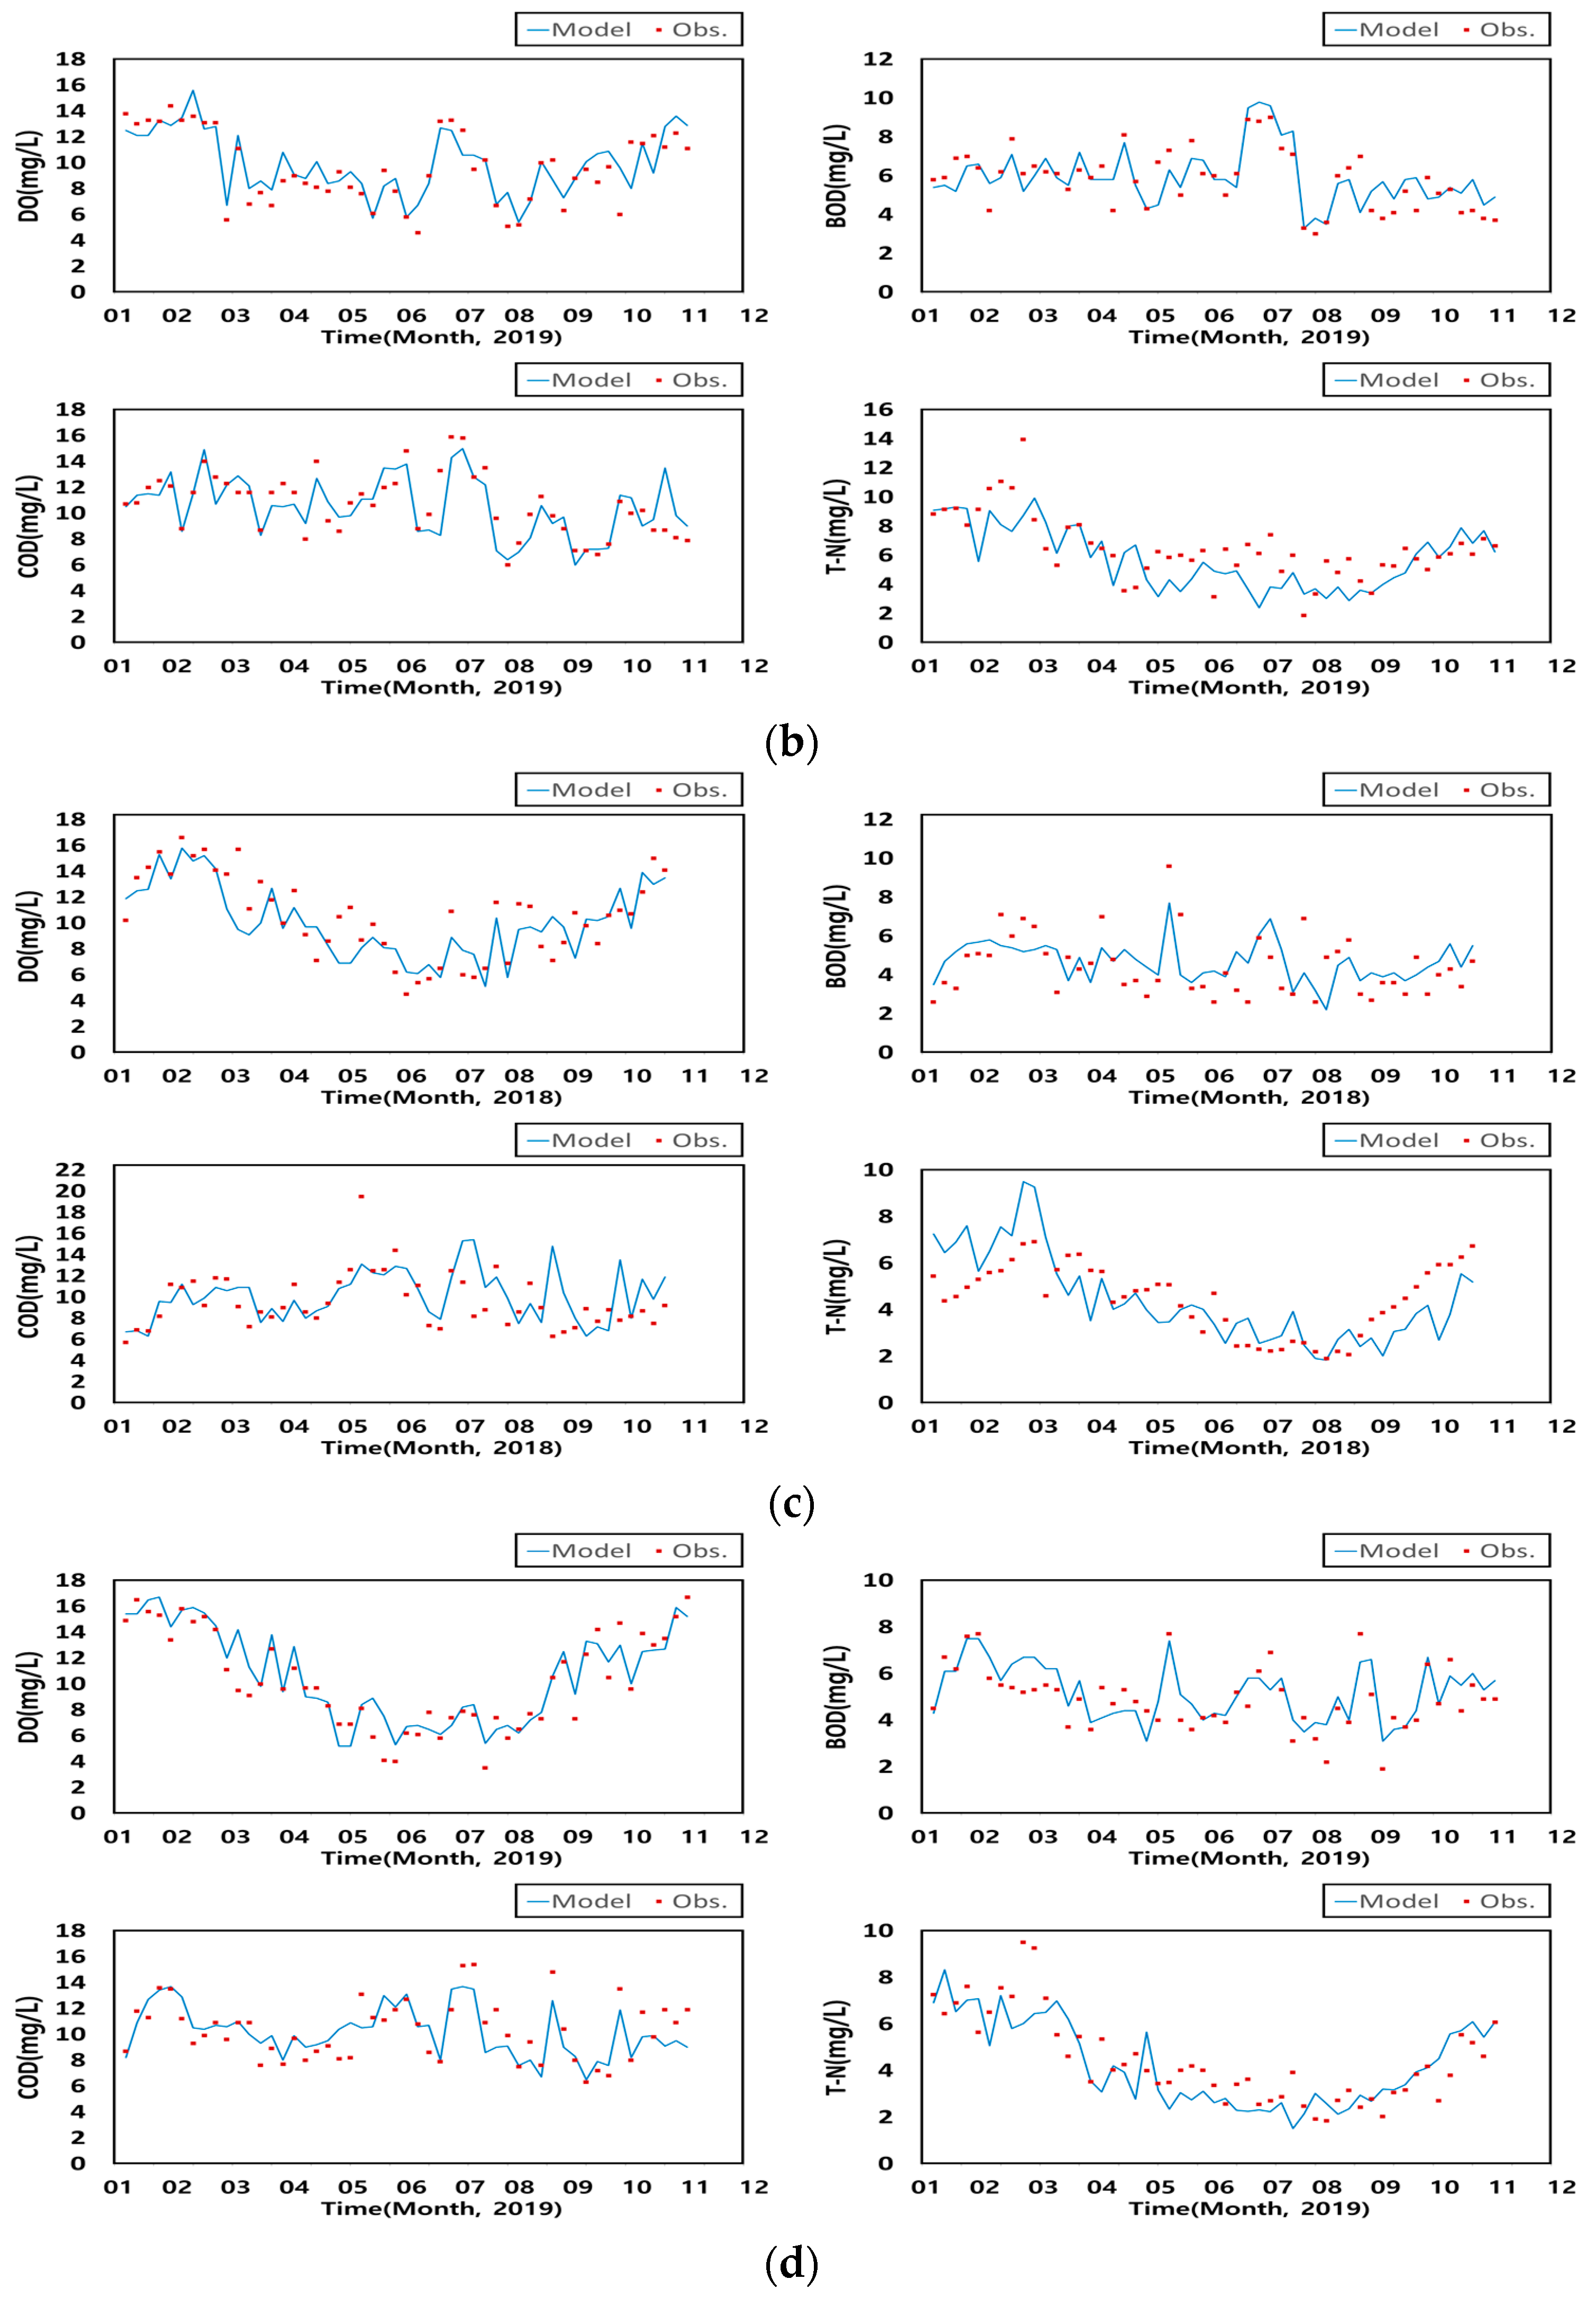
3.1.2. The Delft3D-WAQ Model

To examine the reproducibility of water quality-related items using the Delft3D-WAQ model, the simulated and observed values were compared for dissolved oxygen (DO), biochemical oxygen demand (BOD), chemical oxygen demand (COD), and total nitrogen (T-N) at representative locations in the Seungchon and Juksan Weirs. The Bias values ranged from −5.15 to 5.83 mg/L; MAE from −2.25 to 3.58 mg/L; NSE from 0.65 to 0.82; Pbias from −5.75 to 7.18%; and IOA from 0.66 to 0.80 (Figure 5).
When the results of the Delft3D-FLOW/-WAQ modules were compared with the observed values, the tendencies were accurately predicted. However, some data with large fluctuations were either underestimated or overestimated. In the Delft3D-WAQ module, appropriate coefficient values were applied within the characteristics and ranges of the applied targets for 15 water quality-related factors (Table 2). In general, calibration and verification were performed using the environmental data, observed values, and modeling results. However, it was difficult to set appropriate coefficient values in situations with large data variability or the occurrence of singular values. Therefore, for the coefficients applied in this study, the accuracy of model prediction was judged to be significantly low when the water quality data of other target sections were predicted. The improved optimization of coefficients requires improvements in the data obtained from various water quality monitoring networks. Moreover, it is necessary to recalculate the appropriate ranges of coefficients suitable for the characteristics of rivers in Korea. The spatiotemporal results of the Delft3D-Flow and Delft3D-WAQ modules were used as time-series flow field information for the reference scenario in the HABITAT model. In addition, for the reference scenario, the changes in habitats were analyzed using the HSC data constructed for the target species in this study.

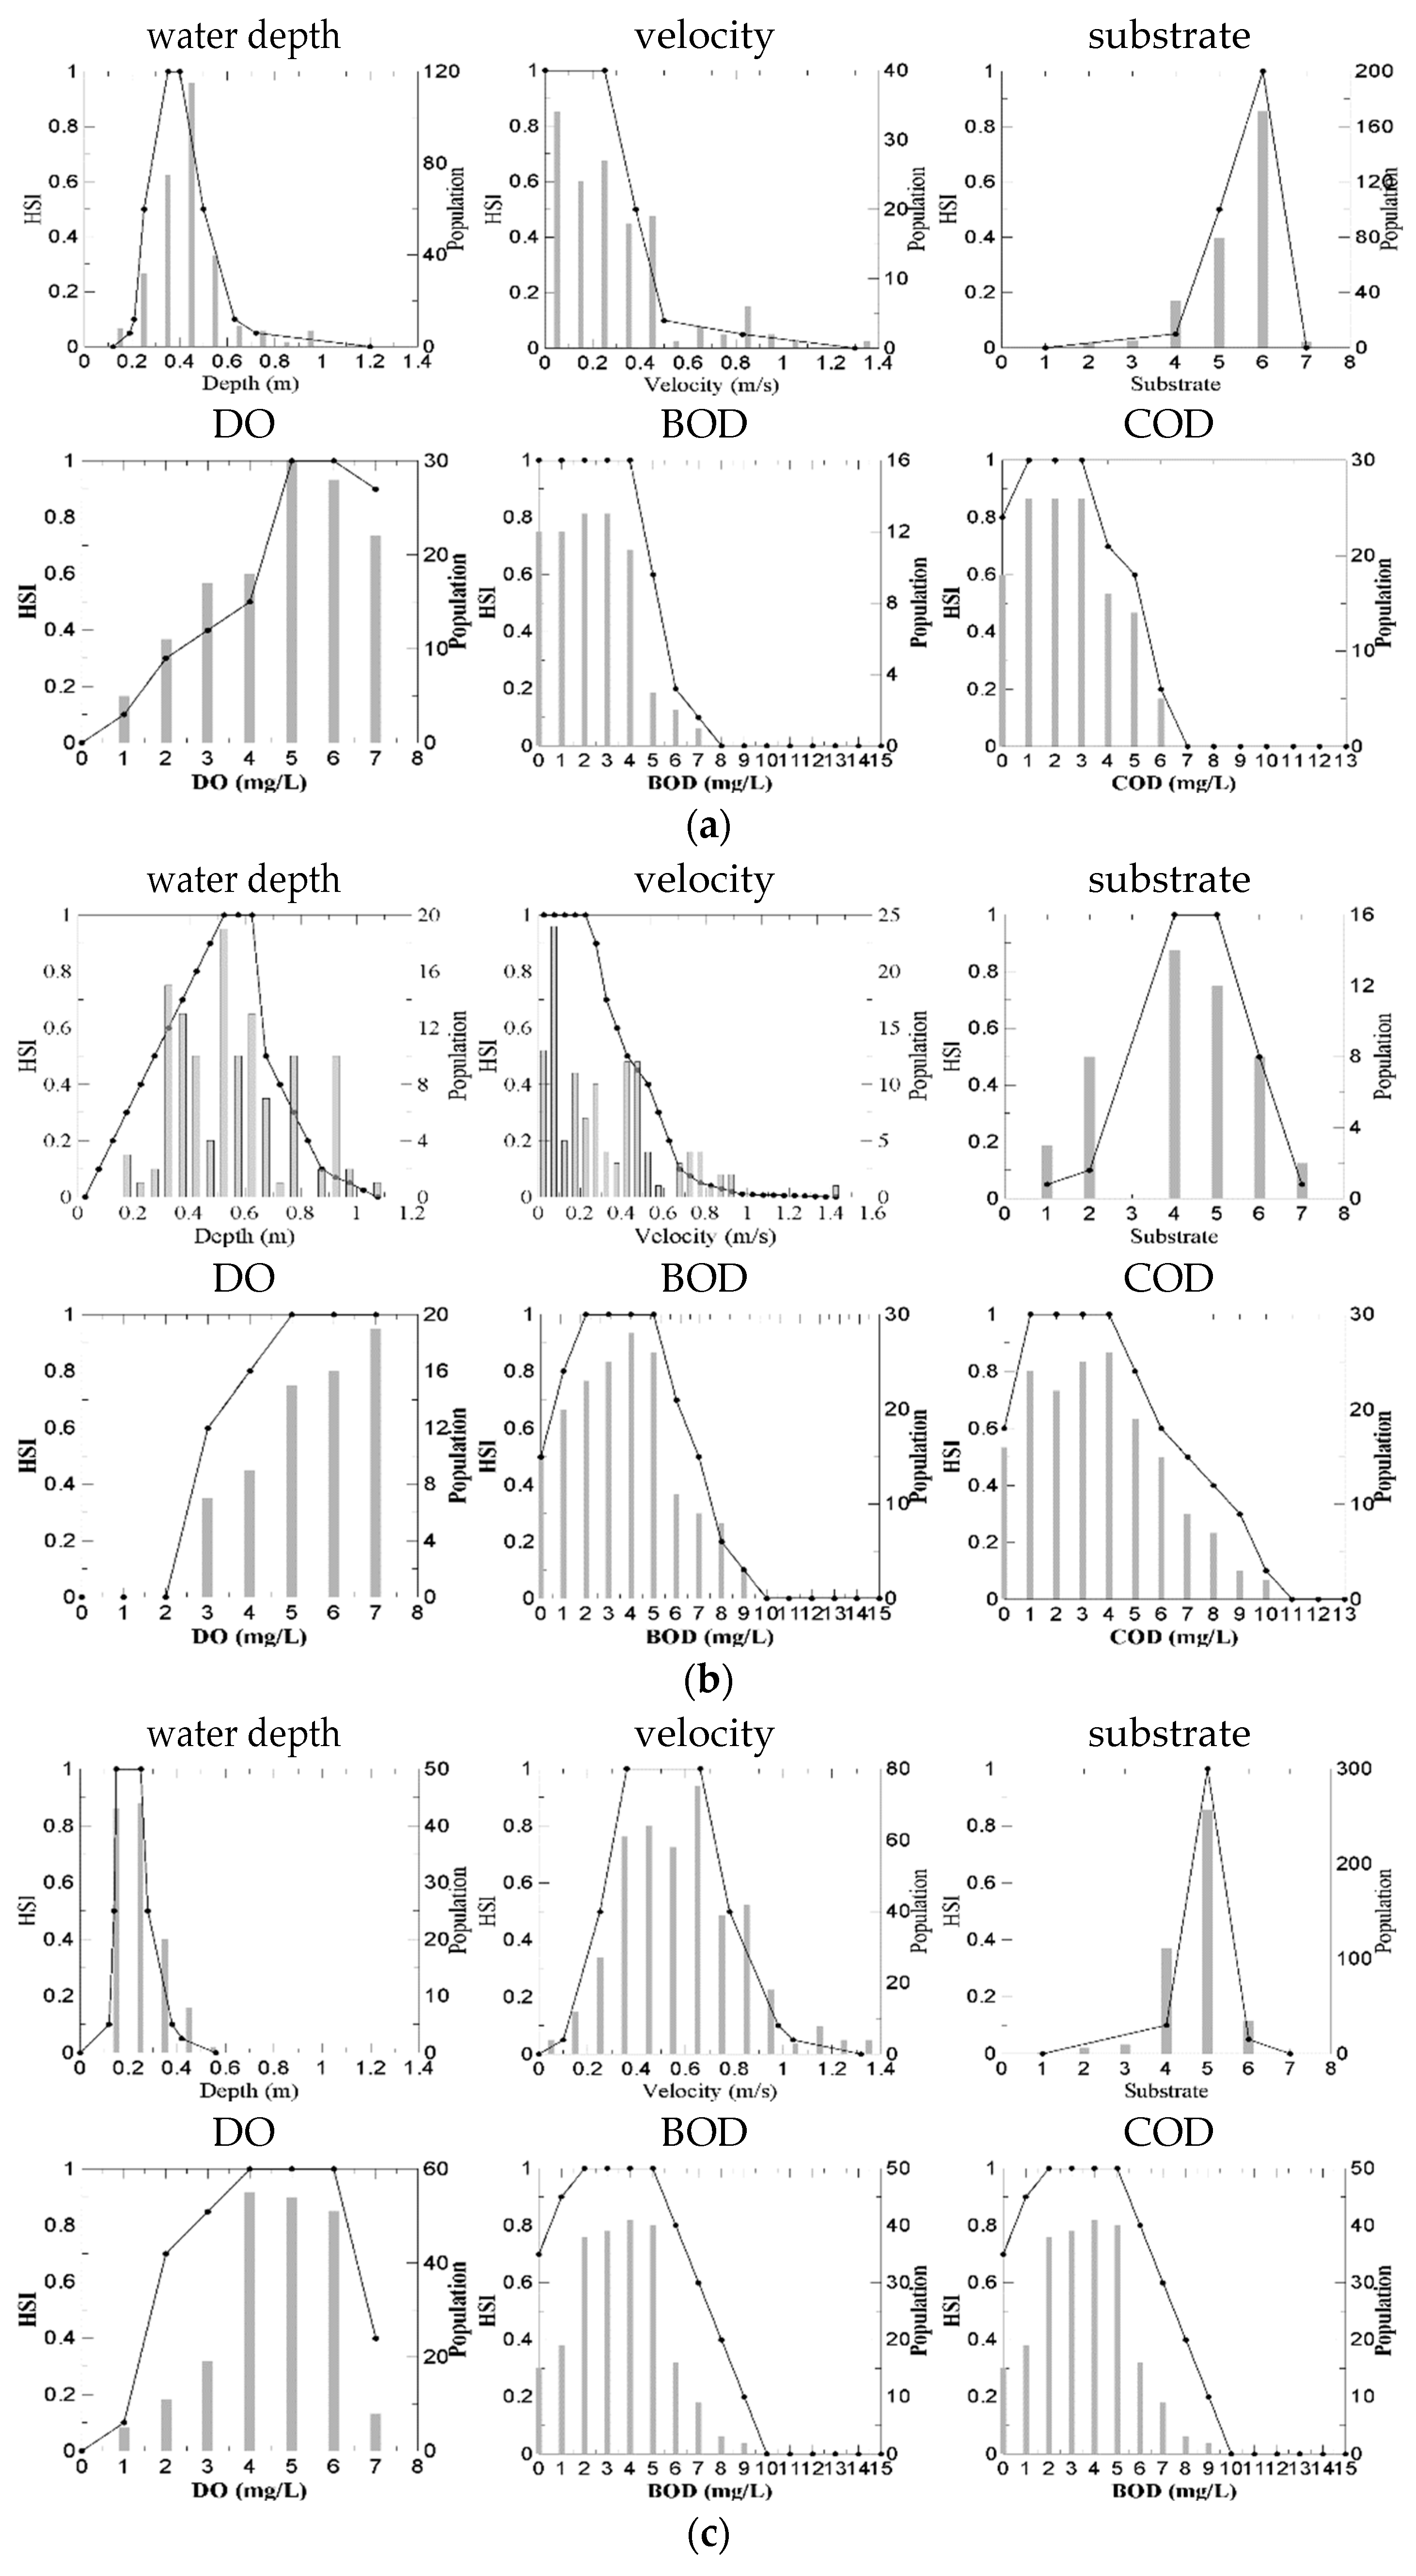
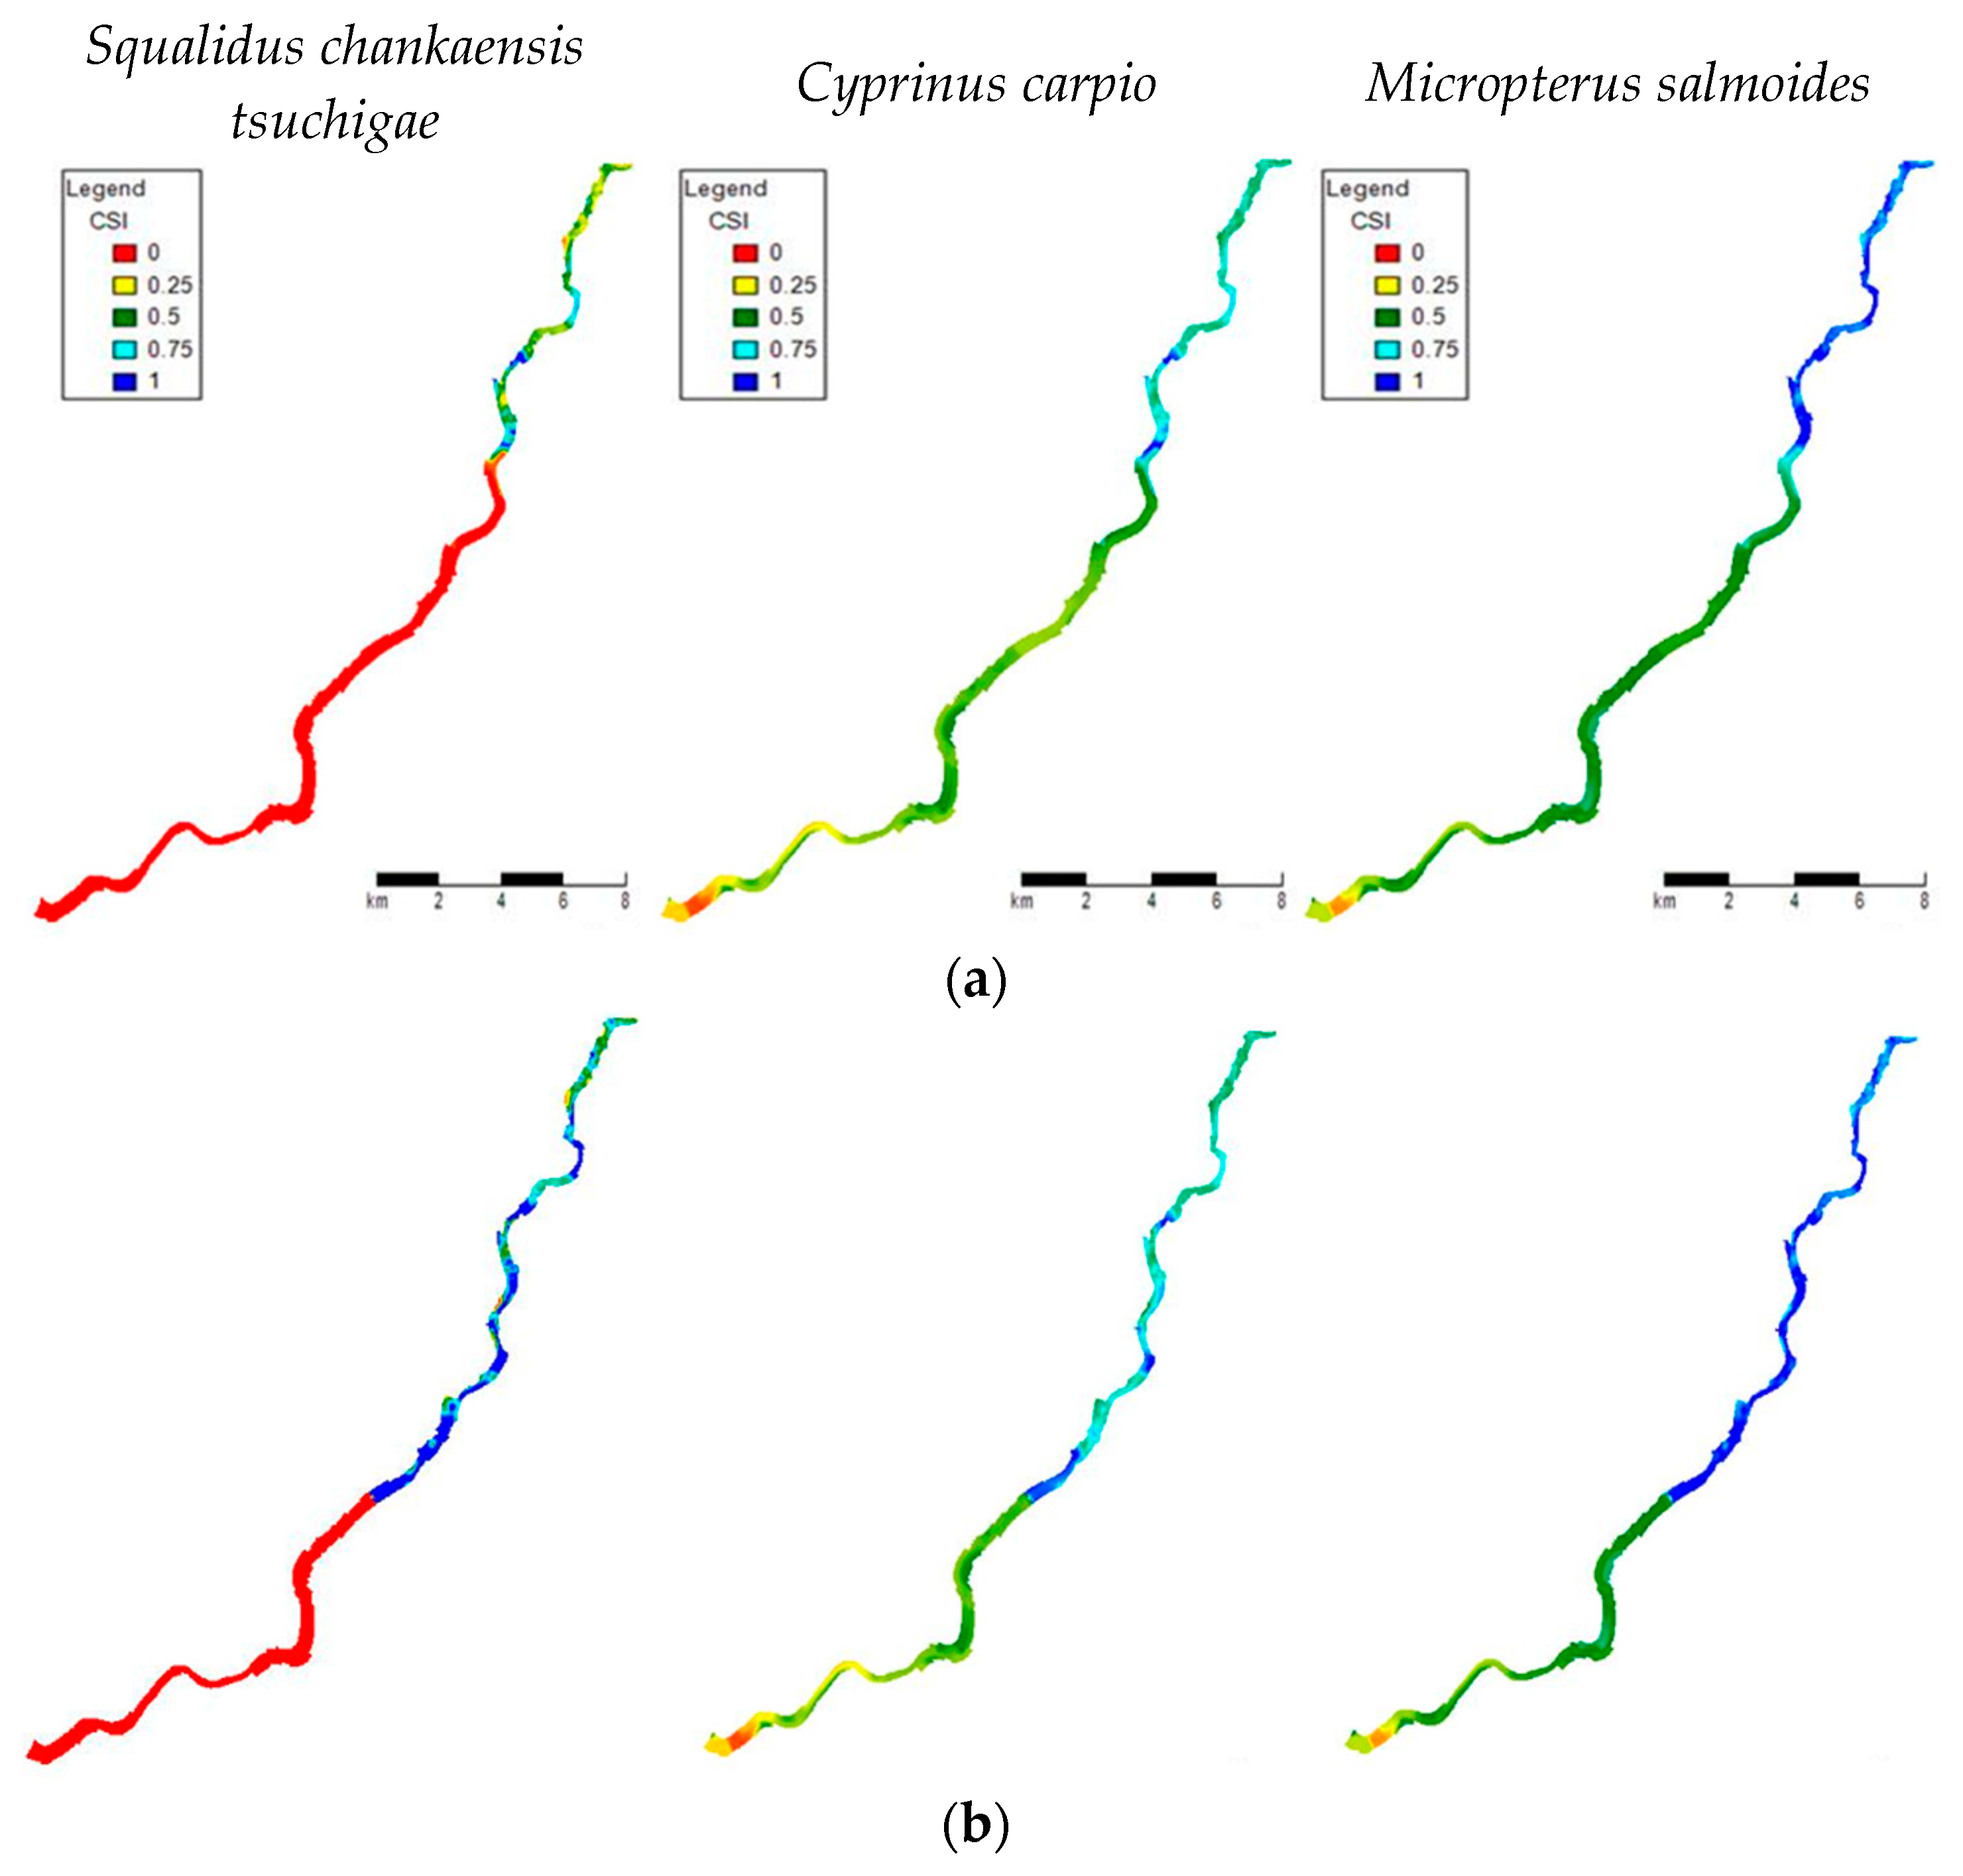
3.1.3. The HABITAT Model

To evaluate the reproducibility of the HABITAT model, the species distributions (confirmed by the results of a biomonitoring network) and the results of a basic environmental survey project were compared with the results of the HABITAT model. The fish field monitoring was conducted from August to October 2019, and reproducibility between the results, obtained using the HABITAT model, was compared with the results for August. This is because during the period, except August 2019, analysis was difficult due to the lack of fish monitoring data. In addition, three target fish species applied in the present study appeared in August. Moreover, we selected locations at which the HSI was >0.25 and where ≥3 populations had been monitored. Therefore, a total of 14 locations were selected for the examination of reproducibility. This included one survey point at Yeongsan Bridge that had been included in the basic environmental survey project.
Figure 6 shows the reproducibility of model results for the target species using the correct classification rate. The CCR values of Squalidus chankaensis tsuchigae, Cyprinus carpio, and Micropterus salmoides were 71.4%, 50.0%, and 42.9%, respectively. Squalidus chankaensis tsuchigae was found to be the dominant species inhabiting the Yeongsan River and showed high prediction accuracy when compared with the actual monitoring results. For Cyprinus carpio, the observed and calculated habitat suitability metrics were inconsistent because the actual number of observations was insufficient for proper analysis. If various monitoring data are recorded and used in future analyses, the accuracy of the results and model reproducibility are expected to improve. Micropterus salmoides is known to be highly adaptive to environmental changes, as it is a carnivorous species and exhibits lentic and lotic habitat characteristics [47,48,49,50,51].
Therefore, the species frequency was found to be high at the actual monitoring points, but the reproducibility of the model results was not high. This indicates that it is difficult to predict changes in aquatic habitats based only on the physicochemical changes caused by artificial weir operation practices under specific conditions. The accuracy of prediction is expected to improve if compared with model results under different conditions. Therefore, despite differences in the sections where the field survey results were insufficient, we found an average accuracy of about 55% for the target species. This indicates that the reproducibility of the HABITAT model is reasonable. If various analytical conditions and monitoring data are used in the future, the reproducibility and prediction accuracy of the HABITAT model are expected to improve.

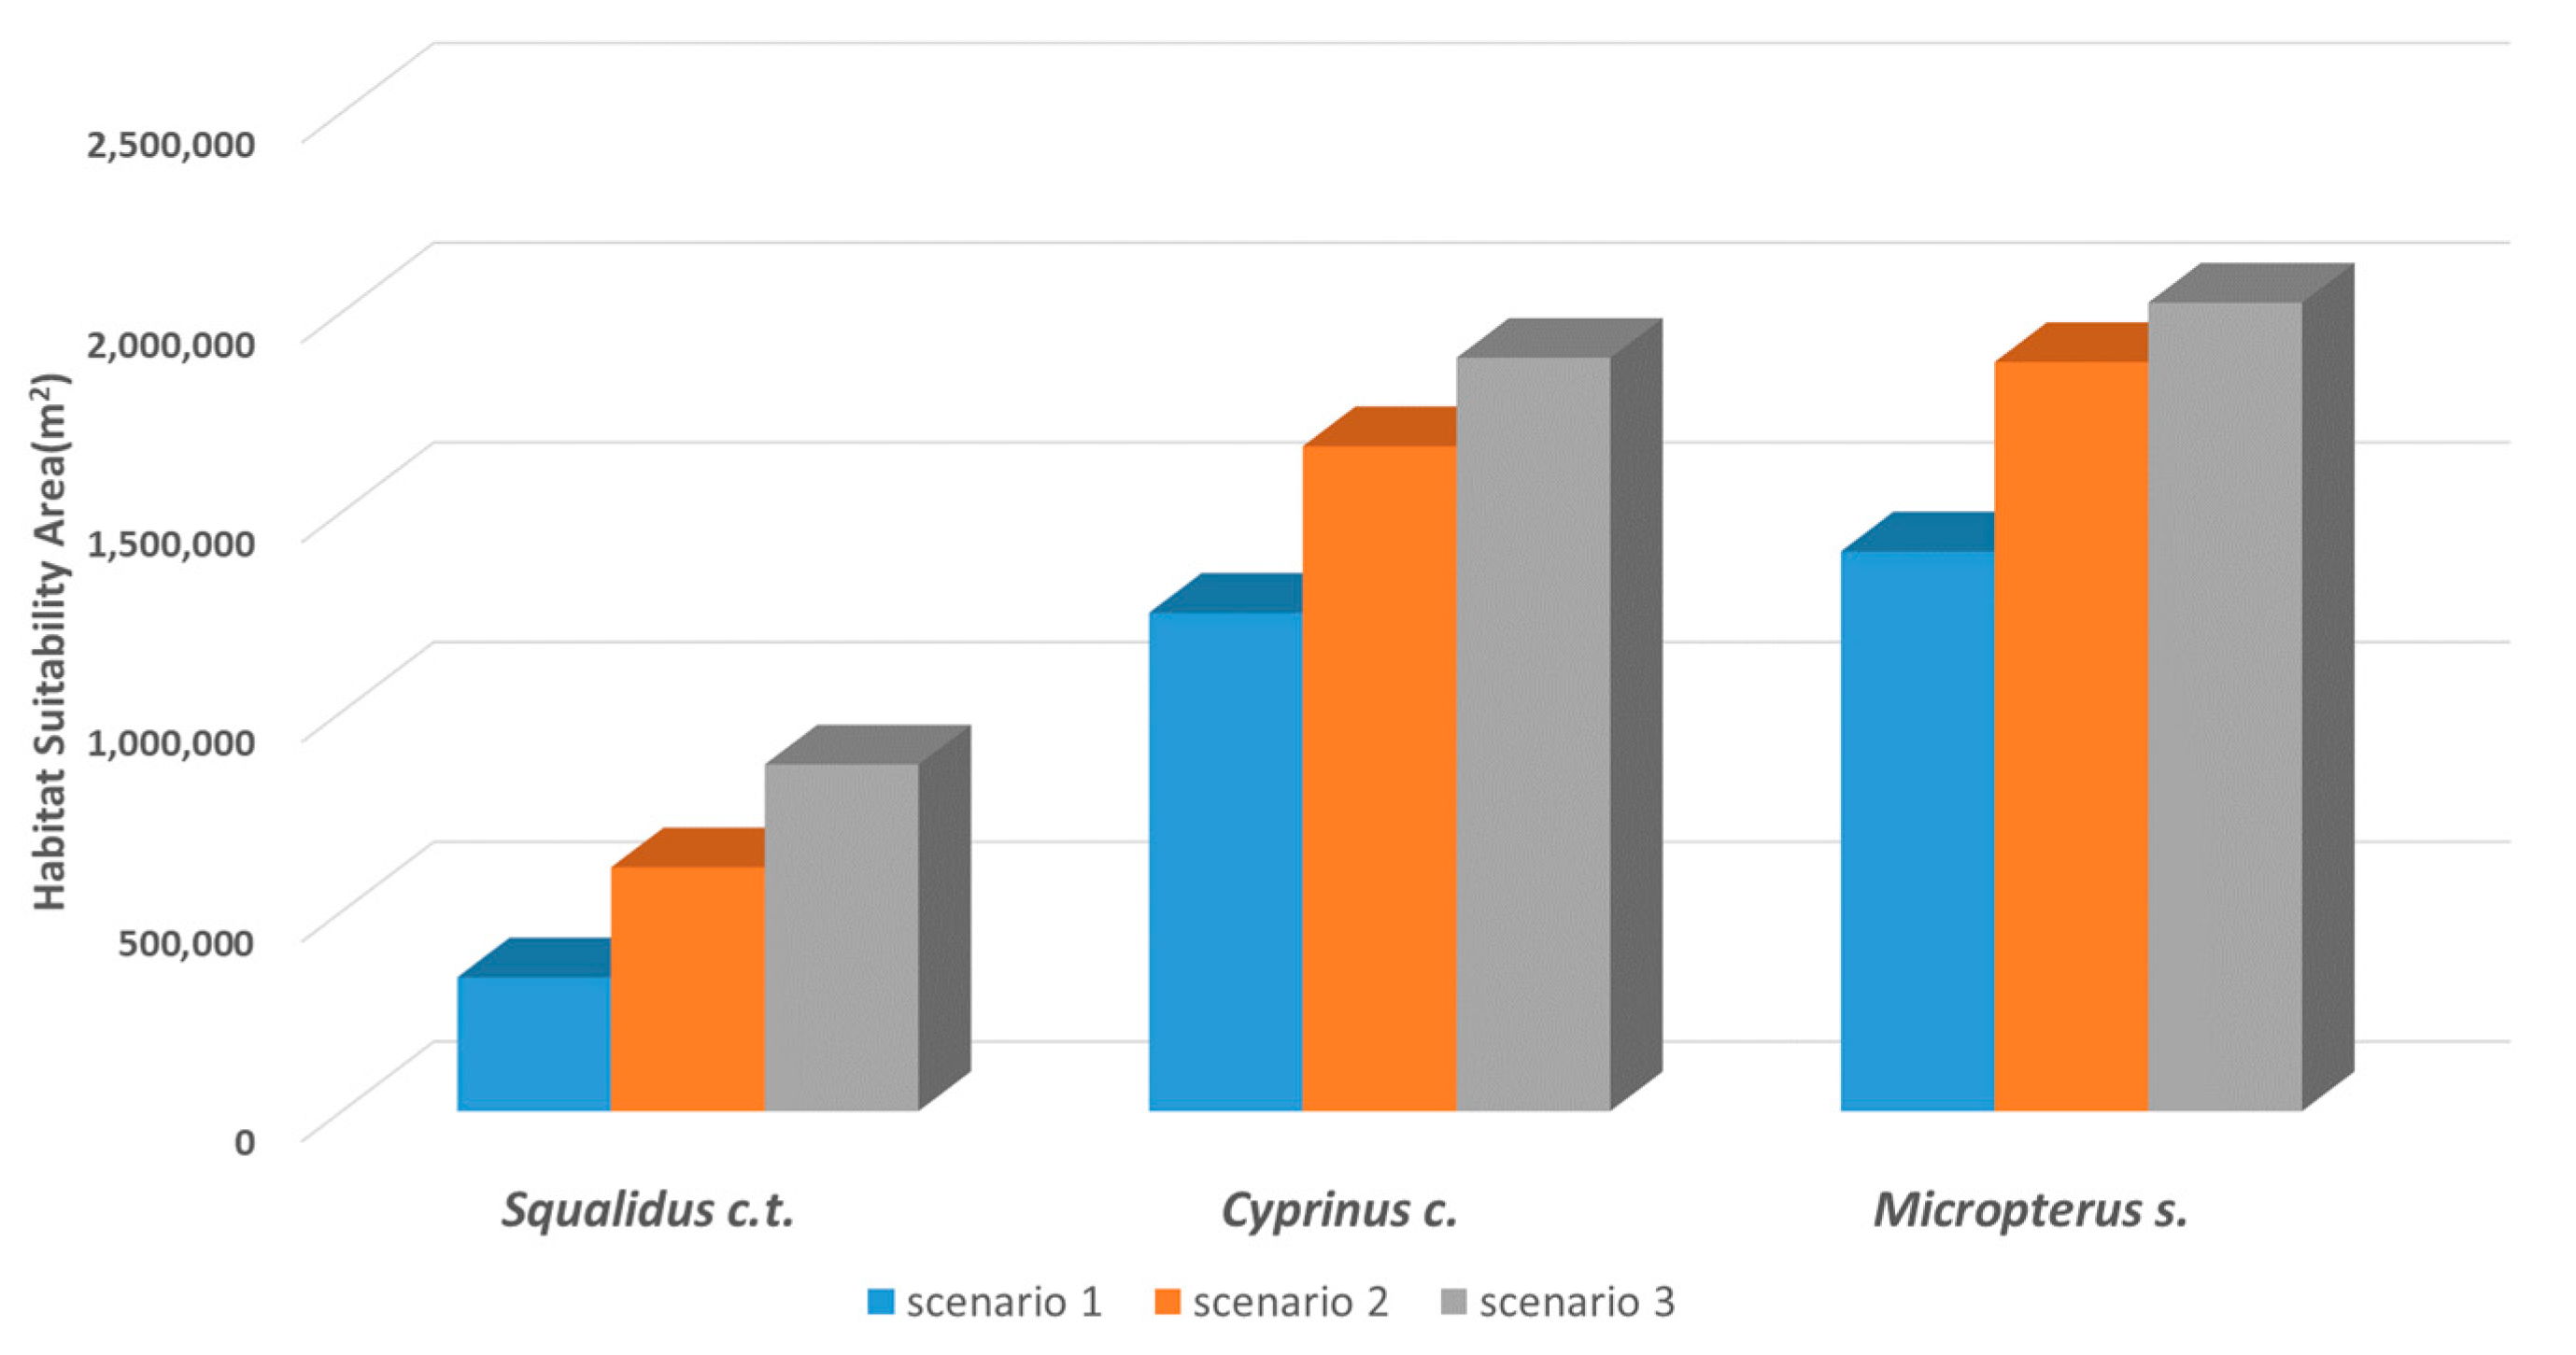
3.2. Changes in the Composite Suitability Index and Weighted Usable Area

As detailed above, three weir operation conditions were applied to the HABITAT model (Figure 7). Both the Seungchon and Juksan Weirs were partially opened under Condition 1, whereas the Seungchon Weir was fully opened and the Juksan Weir was partially opened under Condition 2. Under Condition 3, the Seungchon Weir was partially opened and the Juksan Weir was fully opened.

3.2.1. Squalidus chankaensis tsuchigae

Squalidus chankaensis tsuchigae is a dominant and endemic species in the Yeongsan River. Under simulation of Condition 1, the habitat suitability in the river channel was found to deteriorate (except in the upstream region). Under simulation Conditions 2 and 3, the habitats in the river channel were improved. This was because the full opening of one weir allowed the water depth and flow velocity to reach the conditions preferred by the target species. From a quantitative perspective, the habitat suitability area was improved by approximately 47% when one weir was fully opened compared to the simulation of Condition 1 where both weirs were partially opened.

3.2.2. Cyprinus carpio

Cyprinus carpio exhibits the characteristics of a lentic species. Habitat suitability was found in areas where a suitable water depth was secured in the river channel, even under the condition of partial opening of a weir. It can be seen that the species is highly tolerant and adaptive to changes in the physical environment, such as artificial weir operation conditions. Compared to simulation condition 1, the habitat suitability area was improved by approximately 42% under fully opened conditions (Conditions 2 and 3).

3.2.3. Micropterus salmoides

Micropterus salmoides exhibits both lentic and lotic characteristics. The species was found to be less affected by artificial weir operations because the habitat suitability for this species was generally high in the river channel. As a carnivorous species, Micropterus salmoides is also known to be highly adaptive to environmental changes. When one weir was fully opened, the average habitat suitability area was improved by 36% compared to in conditions of partial opening. Because the habitat suitability of an exotic species was also improved despite artificial weir operations, it is necessary to prepare and establish plans to protect native species against exotic species in the future.

3.2.4. Degree of Tolerance for Environmental Changes (Adaptability)

As shown in the Figure 8, the average habitat area in the river channel was calculated according to the simulation conditions, compared, and analyzed using the aforementioned qualitative and spatial changes in habitat suitability. Changes in the average habitat area can be interpreted as the degree of tolerance (adaptability) for physical environmental changes caused by artificial weir operation. The average habitat suitability area, according to the simulation conditions, was found to be 604,560 m2 for Squalidus chankaensis tsuchigae, 1,599,441 m2 for Cyprinus carpio, and 1,766,941 m2 for Micropterus salmoides. When the degree of adaptability was examined based on these results, Micropterus salmoides and Cyprinus carpio were found to have strong tolerance for environmental changes, whereas Squalidus chankaensis tsuchigae (a native species) was found to be vulnerable to such changes. In addition, the habitat suitability area was more significantly improved under the simulated conditions of Scenario 3 than under the simulated conditions of Scenarios 1 and 2. This indicates that the habitat suitability area was maximized when the Juksan Weir (rather than the Seungchon Weir) was fully opened. Above all, the habitat affected by the Juksan Weir is more widely distributed than the section affected by the Seungchon Weir in the study area. Furthermore, in the case of the Juksan Weir, it is located in a downstream section of the Yeongsan River and, due to the backwater effect of the river, a wide stagnant water area is formed there. Therefore, when the weir gate is opened, changes in stream flow occur, and it is judged that these changes have a greater impact on aquatic habitats.

4. Conclusions

Predicting changes in aquatic ecosystems (as a result of environmental changes) and efficiently managing these changes requires an integrated model capable of analyzing the interactions between physical, chemical, and ecological factors. To this end, this study aimed to develop an integrated hydraulics–water quality–aquatic habitat prediction model that can be applied to the Yeongsan River system. Moreover, we aimed to develop management plans to improve aquatic ecosystem health through habitat prediction. In the second year of the study, the Delft3D-Flow and Delft3D-WAQ models were linked with the HABITAT model, and an integrated model was constructed for the main stream of the Yeongsan River. In addition, we evaluated and analyzed the changes in habitat suitability according to the three weir operation scenarios. Based on field survey data regarding the aquatic species inhabiting the river system, we used the IFASG method to construct the habitat suitability curves (HSCs) of the target species according to the physical and chemical variables of the environment.
The reproducibility of the Delft3D model was evaluated using five indicators (bias, Pbias, MAE, NSE, and IOA) of the water level, water quality, and water temperature. The results for water level and water temperature corresponded to the ‘Satisfactory’ grade or higher. However, although the simulated water quality tended to be in line with the observed data, some data were underestimated or overestimated. The reproducibility of the HABITAT model for Squalidus chankaensis tsuchigae, Cyprinus carpio, and Micropterus salmoides was evaluated using CCR, and the model simulated the appearance of the target species with about 55% accuracy.
When changes in habitat suitability were evaluated, the habitats of the target species were predicted to improve when at least one of the two weirs installed on the Yeongsan River remained fully open. In particular, habitat improvement was maximized when the Juksan Weir (rather than the Seungchon Weir) was fully opened. In addition, we used changes in the average habitat area to analyze the degree of tolerance of the species for physical environmental changes. In this analysis, Micropterus salmoides and Cyprinus carpio were found to have high adaptability, whereas Squalidus chankaensis tsuchigae exhibited low adaptability. Based on the results of this study, we expect that the integrated prediction models that links Delft3D with HABITAT could be used to predict the effects of physical and chemical environmental changes on aquatic ecosystems. Moreover, with these results, it is expected that the effect of changes in water quantity and water quality on aquatic ecology through the various weir operation scenarios will be analyzed and it will be helpful when planning rehabilitation in the future.
A future research direction involves using the construct a Delft3D-based model for predicting changes in algal populations according to changes in hydraulic features and water quality-related items. Using data related to the changes in weather conditions and hydraulic structures, we can predict associated changes in the characteristics of a specific algal species due to competition and adaptation under various scenarios. In addition, plans are underway to use machine learning algorithms to evaluate the spatiotemporal changes in algal communities by analyzing long-term zooplankton survey data in the weir sections of Yeongsan River. Field-based survey data, data from the basic environmental survey linked with this research project, and available databases in Korea will be used to construct HSCs for aquatic species inhabiting the river system (e.g., fish, benthic organisms, and epilithic diatom) and expand the available range of modeling. This is expected to improve the reliability of the results and the applicability of aquatic ecosystem models to species that inhabit the Yeongsan River system. We will also develop a hydraulic model to predict salinity changes and changes in the habitat environment of marsh clams in the Seomjin River estuary. This will improve the scalability of the integrated (hydraulics–water quality–aquatic habitat) prediction model and make it possible to identify the effects of efficient dam operation on the restoration of natural aquatic environments, thus improving the water circulation structure in river systems. The implementation of this prediction model based on the driver–pressure–state–impact–response (DPSIR) framework can help derive optimal water management plans and policies.

Author Contributions

Conceptualization, B.C., J.P., D.-S.S., E.H.N. and J.C.; Data curation, B.C., J.P., T.-W.K. and J.C.; Formal analysis, B.K., E.H.N. and J.C.; Funding acquisition, D.-S.S. and E.H.N.; Investigation, B.C. and J.C.; Methodology, B.C., B.K., T.-W.K., D.-S.S. and J.C.; Resources, E.H.N. and J.C.; Supervision, B.K.; Validation, B.C. and E.H.N.; Visualization, J.C.; Writing—original draft, B.C. and J.C.; Writing—review & editing, B.C., B.K., J.P., T.-W.K., D.-S.S., E.H.N. and J.C. All authors have read and agreed to the published version of the manuscript.

Funding

This research was funded by the National Institute of Environmental Research grant number (NIER-2022-01-01-044).

Institutional Review Board Statement

Not applicable.

Informed Consent Statement

Not applicable.

Data Availability Statement

Not applicable.

Acknowledgments

This study was supported by a grant from the National Institute of Environmental Research (NIER), funded by the Ministry of Environment (MOE) of the Republic of Korea (NIER-2022–01–01–044). In addition, this paper is a part of NIER research report (Report Name: “Application of habitat analysis and modelling for improvement of aquatic ecosystem health in the Yeongsan River (I&II)”).

Conflicts of Interest

The authors declare no conflict of interest.

References

  1. Bovee, K.D. A Guide to Stream Habitat Analysis Using the Instream Flow Incremental Methodology; Western Energy and Land Use Team, Office of Biological Services, Fish and Wildlife Service, US Department of the Interior: Washingtown, DC, USA, 1982.
  2. Huang, W.; Mynnet, A. Effects of changes in Lugu Lake water quality on Schizothorax yunnansis ecological habitat based on HABITAT model. In Proceedings of the International Conferences Security Technology, Disaster Recovery and Business Continuity, Jeju Island, Korea, 13–15 December 2010; pp. 259–268. [Google Scholar]
  3. Ministry of Environment, National Institute of Environment Research (MOE/NIER). Stream/River Ecosystem Survey and Health Assessment (I–XI) (2008–2018); Ministry of Environment/National Institute of Environmental Research: Incheon, Korea, 2018.
  4. Ministry of Environment (MOE). The Basic Plan for National Water Environment Management; Ministry of Environment: Sejong, Korea, 2016.
  5. Kang, H.; Jeon, D.J.; Kim, S.; Jung, K. Estimation of fish assessment index based on ensemble artificial neural network for aquatic ecosystem in South Korea. Ecol. Indic. 2022, 136, 108708. [Google Scholar] [CrossRef]
  6. Staehr, P.A.; Staehr, S.U.; Tonetta, D.; Høgslund, S.; Nielsen, M.M. Contribution of boulder reef habitats to oxygen dynamics of a shallow estuary. Sci. Total Environ. 2022, 805, 150261. [Google Scholar] [CrossRef] [PubMed]
  7. Choi, B.; Choi, S.S. Integrated hydraulic modelling, water quality modelling and habitat assessment for sustainable water management: A case study of the Anyang-Cheon stream, Korea. Sustainability 2021, 13, 4330. [Google Scholar] [CrossRef]
  8. Ishaq, A.; Dahiru, S.; Danazumi, A.I. Effect of physicochemical and biological parameters for model simulation on the quality of water reservoir (tributaries) along Nuhu Bamalli Polytechnic Zaria. J. Inventive Eng. Technol. 2021, 1, 54–63. [Google Scholar]
  9. Hintz, C.L.; Booth, M.T.; Newcomer-Johnson, T.A.; Fritz, K.M.; Buffam, I. Urban buried streams: Abrupt transitions in habitat and biodiversity. Sci. Total Environ. 2022, 819, 153050. [Google Scholar] [CrossRef]
  10. Macura, V.; Stefunkova, Z.; Majorosova, M.; Halaj, P.; Skrinar, A. Influence of discharge on fish habitat suitability curves in mountain watercourses in IFIM methodology. J. Hydrol. Hydromech. 2018, 66, 12. [Google Scholar] [CrossRef] [Green Version]
  11. Valentin, S.; Lauters, F.; Sabaton, C.; Breil, P.; Souchon, Y. Modelling temporal variations of physical habitat for brown trout (Salmo trutta) in hydropeaking conditions. Regul. Rivers Res. Manag. 1996, 12, 317–330. [Google Scholar] [CrossRef]
  12. Tharme, R.E. A global perspective on environmental flow assessment: Emerging trends in the development and application of environmental flow methodologies for rivers. River Res. Appl. 2003, 19, 397–441. [Google Scholar] [CrossRef]
  13. Mathur, D.; Bason, W.H.; Purdy, E.J., Jr.; Silver, C.A. A critique of the in stream flow incremental methodology. Can. J. Fish. Aquat. Sci. 1985, 42, 825–831. [Google Scholar] [CrossRef]
  14. Hedden-Nicely, D.R. The Contemporary Methodology for Quantifying Reserved Instream Flow Water Rights to Support Aquatic Habitat. Environ. Law 2020, 50, 257–286. [Google Scholar]
  15. Lee, J.H.; Jeong, S.M.; Lee, M.H.; Lee, Y.S. Estimation of instream flow for fish habitat using instream flow incremental methodology (IFIM) for major tributaries in Han river basin. KSCE J. Civ. Environ. Eng. Res. 2006, 26, 153–160. [Google Scholar]
  16. Armour, C.L.; Taylor, J.G. Evaluation of the instream flow incremental methodology by US Fish and Wildlife Service field users. Fisheries 1991, 16, 36–43. [Google Scholar] [CrossRef]
  17. Souchon, Y.; Capra, H. Aquatic habitat modelling: Biological validations of IFIM/Phabsim methodology and new perspectives. Hydroecol. Appl. 2004, 14, 9–25. [Google Scholar] [CrossRef] [Green Version]
  18. Bunn, S.E.; Arthington, A.H. Basic principles and ecological consequences of altered flow regimes for aquatic biodiversity. Environ. Manag. 2002, 30, 492–507. [Google Scholar] [CrossRef] [PubMed] [Green Version]
  19. Choi, B.; Choi, S.U. Physical habitat simulations of the Dal River in Korea using the GEP Model. Ecol. Eng. 2015, 83, 456–465. [Google Scholar] [CrossRef]
  20. Nikghalb, S.; Shokoohi, A.; Singh, V.P.; Yu, R. Ecological regime versus minimum environmental flow: Comparison of results for a river in a semi Mediterranean region. Water Resour. Manag. 2016, 30, 4969–4984. [Google Scholar] [CrossRef]
  21. Im, D.; Choi, S.U.; Choi, B. Physical habitat simulation for a fish community using the ANFIS method. Ecol. Inform. 2018, 43, 73–83. [Google Scholar] [CrossRef]
  22. Choi, S.U.; Kim, S.K.; Choi, B.; Kim, Y. Impact of hydropeaking on downstream fish habitat at the Goesan Dam in Korea. Ecohydrology 2017, 10, e1861. [Google Scholar] [CrossRef]
  23. Zhang, W.; Di, Z.; Yao, W.W.; Li, L. Optimizing the operation of a hydraulic dam for ecological flow requirements of the You-shui River due to a hydropower station construction. Lake Reserv. Manag. 2016, 32, 1–12. [Google Scholar] [CrossRef]
  24. Kang, H.; Choi, B. Dominant fish and macroinvertebrate response to flow changes of the Geum River in Korea. Water 2018, 10, 942. [Google Scholar] [CrossRef] [Green Version]
  25. Gillenwater, D.; Granata, T.; Zika, U. GIS-based modeling of spawning habitat suitability for walleye in the Sandusky River, Ohio, and implications for dam removal and river restoration. Ecol. Eng. 2006, 28, 311–323. [Google Scholar] [CrossRef]
  26. Tomsic, C.A.; Granata, T.C.; Murphy, R.P.; Livchak, C.J. Using a coupled eco-hydrodynamic model to predict habitat for target species following dam removal. Ecol. Eng. 2007, 30, 215–230. [Google Scholar] [CrossRef]
  27. Downs, P.W.; Kondolf, G.M. Post-project appraisals in adaptive management of river channel restoration. Environ. Manag. 2002, 29, 477–496. [Google Scholar] [CrossRef] [PubMed]
  28. Im, D.; Kang, H.; Kim, K.H.; Choi, S.U. Changes of river morphology and physical fish habitat following weir removal. Ecol. Eng. 2011, 37, 883–892. [Google Scholar] [CrossRef]
  29. Gard, M. Modeling changes in salmon spawning and rearing habitat associated with river channel restoration. Int. J. River Basin Manag. 2006, 4, 201–211. [Google Scholar] [CrossRef]
  30. Schwartz, J.S.; Herricks, E.E. Evaluation of pool -riffle naturalization structures on habitat complexity and the fish community in an urban Illinois stream. River Res. Appl. 2007, 23, 451–466. [Google Scholar] [CrossRef]
  31. Zou, J.; Wang, S.; Liu, C.; Han, Z.; Zhu, B.; Jiang, Z. Evaluation of Water Quality and Habitat Quality in the Beiyunhe River Watershed. IOP Conf. Ser. Earth Environ. Sci. 2021, 638, 012091. [Google Scholar] [CrossRef]
  32. Sedighkia, M.; Abdoli, A. Balancing environmental impacts and economic benefits of agriculture under the climate change through an integrated optimization system. Int. J. Energy Environ. Eng. 2022, 1–14. [Google Scholar] [CrossRef]
  33. Muhammetoglu, A.; Kocer, M.A.T.; Durmaz, S. Evaluation of different management scenarios for trout farm effluents using dynamic water quality modeling. Environ. Monit. Assess. 2022, 194, 1–19. [Google Scholar] [CrossRef]
  34. Li, X.; Li, C.; Wang, X.; Liu, Q.; Yi, Y.; Zhang, X. A Developed Method of Water Pollution Control Based on Environmental Capacity and Environmental Flow in Luanhe River Basin. Water 2022, 14, 730. [Google Scholar] [CrossRef]
  35. Lim, H.; Na, E.H.; Jeon, H.C.; Song, H.; Yoo, H.; Hwang, S.H.; Ryu, H.S. Application of Integrated Modelling Framework Consisted of Delft3D and HABITAT for Habitat Suitability Assessment. J. Korean Soc. Water Environ. 2021, 37, 217–228. [Google Scholar]
  36. Korea Institute of Civil Engineering and Building Technology (KICT). Monitoring and Evaluation of River Change (River Channel Changes); Han River Flood Control Office: Seoul, Korea, 2015. [Google Scholar]
  37. Korea Meteorological Administration (KMA). Available online: https://data.kma.go.kr/ (accessed on 15 November 2021).
  38. Water Environment Information System (WEIS). Available online: http://weis.nier.go.kr (accessed on 16 November 2021).
  39. Water resources Management Information System (WAMIS). Available online: http://www.wamis.go.kr (accessed on 22 November 2021).
  40. Stevens, A.W.; Lacy, J.R. The influence of wave energy and sediment transport on seagrass distribution. Estuaries Coasts 2012, 35, 92–108. [Google Scholar] [CrossRef]
  41. Symonds, A.M.; Vijverberg, T.; Post, S.; Van Der Spek, B.J.; Henrotte, J.; Sokolewicz, M. Comparison between Mike 21 FM, Delft3D and Delft3D FM flow models of western port bay. Australia Coast. Eng. 2016, 2, 1–12. [Google Scholar] [CrossRef]
  42. Des, M.; Martinez, B.; DeCastro, M.; Viejo, R.M.; Sousa, M.C.; Gomez-Gesteira, M. The impact of climate change on the geographical distribution of habitat-forming macroalgae in the Rias Baixas. Mar. Environ. Res. 2020, 161, 105074. [Google Scholar] [CrossRef]
  43. Deltares Systems. D-Flow & D-Water Quality; Delrates: Delft, The Netherlands, 2014. [Google Scholar]
  44. Haasnoot, M.; Van de Woolfshaar, K.E. Combing a conceptual framework and a spatial analysis tool, HABITAT, to support the implementation of river basin mangement plans. Int. J. River Basin Manag. 2009, 7, 295–311. [Google Scholar] [CrossRef]
  45. Vu, T.T.; Li, L.; Jun, K.S. Evaluation of multi-satellite precipitation products for streamflow simulations: A case study for the Han River Basin in the Korean Peninsula, East Asia. Water 2018, 10, 642. [Google Scholar] [CrossRef] [Green Version]
  46. Jamalabadi, H.; Alizadeh, S.; Schonauer, M.; Leibold, C.; Gais, S. Classification based hypothesis testing in neuroscience: Below chance level classification rates and overlooked statistical properties of linear parametric classifiers. Hum. Brain Mapp. 2016, 37, 1842–1855. [Google Scholar] [CrossRef]
  47. Byeon, H.-K.; Yoon, M.-H. Ecological Characteristics of Squalidus chankaensis tsuchigae (Cyprinidae) in Geum River, Korea. Korean J. Environ. Ecol. 2016, 30, 888–895. [Google Scholar] [CrossRef]
  48. Kruger, J.D.W.; Smit, G.L.; Van Vuren, J.H.J.; Ferreira, J.T. Some chemical and physical characteristics of the semen of Cyprinus carpio L. and Oreochromis mossambicus (Peters). J. Fish Biol. 1984, 24, 263–272. [Google Scholar] [CrossRef]
  49. Lee, E.H.; Kim, M.; Kim, H.M.; Son, M.; Chang, K.H.; Nam, G.S. Ecological characteristics and distribution of fish in the downstream region of Gyeongan stream. Korean J. Environ. Biol. 2013, 31, 478–485. [Google Scholar] [CrossRef]
  50. Koo, K.S.; Kwon, S.; Do, M.S.; Kim, S. Distribution characteristics of exotic turtles in Korean wild-based on Gangwon-do and Gyeongsangnam-do. Korean J. Ecol. Environ. 2017, 50, 286–294. [Google Scholar] [CrossRef]
  51. Son, M.; Byun, J. An experimental study on the habitat characteristics of largemouth bass. J. Korea Water Resour. Assoc. 2019, 52, 845–853. [Google Scholar]
  52. Bovee, K.D. Development and Evaluation of Habitat Suitability Criteria for Use in the Instream Flow Incremental Methodology; FWS/OBS-86/7; Instream Flow and Aquatic Systems Group (IFASG), USDI Fish and Wildlife Service: Washington, DC, USA, 1986.
  53. Ministry of Land, Infrastructure and Transport (MOLIT). Integrated River Restoration Manual, Ecoriver21 Report; Korea Institute of Civil Engineering and Building Technology (KICT): Seoul, Korea, 2011. [Google Scholar]
  54. Moriasi, D.N.; Arnold, J.G.; Van Liew, M.W.; Bingner, R.L.; Haemel, R.D.; Veith, T.L. Model evaluation guidelines for systematic quantification of accuracy in watershed simulations. Trans. ASABE 2007, 50, 885–900. [Google Scholar] [CrossRef]
Figure 1. Study area in ref. [35] (modified).
Sustainability 14 06090 g001
Figure 2. Operating rules for the coupled operation of the Seungchon and Juksan Weirs.
Sustainability 14 06090 g002
Figure 3. Habitat suitability curves (HSCs) of the physical (water depth, velocity, substrate) and chemical (DO, BOD, COD) variables for the target species. (a) Squalidus chankaensis tsuchigae; (b) Cyprinus carpio; (c) Micropterus salmoides.
Sustainability 14 06090 g003
Figure 4. Comparison of simulated and observed water levels and water temperature at (1) the Seungchon Weir and (2) the Juksan Weir. (a) Model calibration (water level); (b) model verification (water level); (c) model calibration (water temp.); (d) model verification (water temp.).
Sustainability 14 06090 g004aSustainability 14 06090 g004b
Figure 5. Comparison of simulated and observed water levels and water temperatures at the Seungchon and Juksan Weirs. (a) Model calibration (Seungchon Weir); (b) model verification (Seungchon Weir); (c) model calibration (Juksan Weir); (d) model verification (Juksan Weir).
Sustainability 14 06090 g005aSustainability 14 06090 g005b
Figure 6. Reproducibility of model results for the target species using the correct classification rate.
Sustainability 14 06090 g006
Figure 7. Distributions of the habitat suitability index for the target species. (a) Scenario 1; (b) Scenario 2; (c) Scenario 3.
Sustainability 14 06090 g007aSustainability 14 06090 g007b
Figure 8. Changes in the optimal habitat suitability areas of the target species in each modeling scenario.
Sustainability 14 06090 g008
Table 1. Habitat suitability index (HSI) ranges of each variable for target fishes.
ParameterValueUnit
Squalidus chankaensis tsuchigae
physical
variables
water depth[0, 0]; [0.35, 1]; [0.45, 1]; [1.0, 0.1]; [10, 0]m
velocity[0, 1]; [0.3, 1]; [1.0, 0.4]; [2.0, 0.1]; [100, 0]m/s
substrate[6 (Granules and Pebbles), 1]-
chemical
variables
DO 1[0, 0]; [1, 0.1]; [2, 0.3]; [3, 0.4]; [4, 0.45]; [5, 1]; [6, 1]; [7, 0.9]mg/L
BOD 2[0, 1]; [1, 1]; [2, 1]; [3, 1]; [4, 1]; [5, 0.8]; [6, 0.4]; [7, 0.0]mg/L
COD 3[0, 0.8]; [1, 1]; [2, 1]; [3, 1]; [4, 0.7]; [5, 0.6]; [6, 0.2]; [7, 0.0]mg/L
Cyprinus carpio
physical
variables
water depth[0, 0.5]; [0.5, 1]; [0.7, 1]; [1.0, 0.7]; [1.2, 0.2]; [10, 0]m
velocity[0, 1]; [0.3, 1]; [1.0, 0.7]; [1.5, 0.4]; [100, 0]m/s
substrate[4–5 (Silt and Clay, Fine Sand), 1]-
chemical
variables
DO[0, 0]; [1, 0]; [2, 0.6]; [3, 0.7]; [4, 0.8]; [5, 1]; [6, 1]; [7, 0.7]mg/L
BOD[0, 0.5]; [1, 0.8]; [2, 1]; [3, 1]; [4, 1]; [5, 1]; [6, 0.7]; [7, 0.5]; [8, 0.2]; [9, 0.1]; [10, 0]mg/L
COD[0, 0.6]; [1, 1]; [2, 1]; [3, 1]; [4, 1]; [5, 0.8]; [6, 0.6]; [7, 0.5]; [8, 0.4]; [9, 0.3]; [10, 0.1]; [11, 0]mg/L
Micropterus salmoides
physical
variables
water depth[0, 0.7]; [0.2, 1]; [0.4, 1]; [1.0, 0.7]; [1.5, 0.6]; [10, 0]m
velocity[0, 1]; [0.3, 1]; [0.7, 0.7]; [1.0, 0.8]; [2.0, 0.5]; [100, 0]m/s
substrate[5 (Medium Sand and Pebbles), 1]-
chemical
variables
DO[0, 0]; [1, 0.1]; [2, 0.7]; [3, 0.85]; [4, 1]; [5, 1]; [6, 1]; [7, 0.4]mg/L
BOD[0, 0.7]; [1, 0.9]; [2, 1]; [3, 1]; [4, 1]; [5, 1]; [6, 0.8]; [7, 0.6]; [8, 0.4]; [9, 0.2]; [10, 0]mg/L
COD[0, 0.5]; [1, 0.7]; [2, 1]; [3, 1]; [4, 1]; [5, 0.7]; [6, 0.5]; [7, 0.4]; [8, 0.3]; [9, 0.2]; [10, 0.1]; [11, 0]mg/L
1 Dissolved oxygen, 2 Biochemical oxygen demand, 3 Chemical oxygen demand.
Table 2. The information of water quality parameter based on Delft3D-WAQ results.
ParameterDescriptionUnitRangeSetting Factor
SWSatOxySwitch saturation DO calculation-≤42.000
ThrAlgNH4threshold concentration uptake ammoniumgN/m30–10.041
ThrAlgNO3threshold concentration uptake nitrategN/m30–0.10.020
ThrAlgPO4threshold concentration uptake phosphategP/m30–0.10.015
RcDen20MM-denitrification reaction rate at 20 °CgN/m3/d0–0.10.100
TcDenWattemperature coefficient for denitrification-0.5–1.51.070
KsNiDenhalf saturation constant for nitrate cons.gN/m30–0.10.500
KsOxDenhalf saturation constant for oxygen inhib.g/m30–51.000
KsAmNithalf saturation constant for ammonium cons.gN/m30–30.500
KsOxNithalf saturation constant for DO cons.g/m3default1.000
RcNitfirst-order nitrification rate1/d0–20.140
OOXNIToptimum oxygen concentration for nitrificationgO2/m3default5.000
CFLNIToxygen function level for oxygen below COXNIT-0–1.50.025
SWRearswitch for oxygen reaeration formulation-default1.000
TCReartemperature coefficient for reaeration-0.5–1.81.016
Publisher’s Note: MDPI stays neutral with regard to jurisdictional claims in published maps and institutional affiliations.

