
Assessment of Tropical Fish Stocks Using the LBB Method in Dongzhaigang Bay, Hainan Island, China
by
 ,
,
Chengpu Jiang
1,* ,
,
Wenqing Wang
1,
Suzhen Yan
1,
Yipeng Ding
1,
Xuefang Mi
1,
Mao Wang
1,* and
Daniel Pauly
2 1
Key Laboratory of the Coastal and Wetland Ecosystems, Ministry of Education, College of the Environment and Ecology, Xiamen University, Xiamen 361102, China
2
Sea Around Us, Institute for the Oceans and Fisheries, University of British Columbia, 2202 Main Mall, Vancouver, BC V6T 1Z4, Canada
*
Authors to whom correspondence should be addressed.
Sustainability 2022, 14(16), 9933; https://doi.org/10.3390/su14169933
Submission received: 14 July 2022
/
Revised: 9 August 2022
/
Accepted: 10 August 2022
/
Published: 11 August 2022
Abstract
:This study used catch/effort (CPUE) and length-frequency (L/F) data to evaluate the status of 26 fish species in the mangroves of the Dongzhaigang National Reserve, Hainan Province, China, sampled in 2009 (16 species), 2014 (18 species) and 2020 (15 species) using CPUE and the length-based Bayesian biomass (LBB) method. The CPUE, both in number and weight, was lower in 2009 than in 2014 and lower again in 2020, with the 2009 low attributed to pollution due to shrimp, pig and duck farming within the reserve. Of the 26 fish species assessed, four experienced a large reduction of length from 2009 to 2020, and nine exhibited a decline in the ratio of current biomass to biomass at carrying capacity (B/B0), which is expressed as the ‘biomass left’. This ratio was, for most species, below 0.5 in 2009, which suggests that overfishing occurred in 2009 and that it has since become worse. Thus, while the CPUE data provided ambiguous results, the L/F data analyzed by the LBB method demonstrated unambiguously that ‘miniaturization’ through overfishing is occurring among the exploited 26 fish species from the mangroves of the Dongzhaigang National Reserve. For the fisheries in the mangals of Dongzhaigang Bay to remain viable, fishing effort should be reduced by local governments working with the affected communities, just as they reduced pollution a decade ago.
1. Introduction
Mangrove ecosystems occur between land and sea in tropical and subtropical regions. They include various subsystems, such as forested areas, creeks and mudflats, which provide habitats for a huge range of terrestrial and aquatic animals [1], many of which are exploited by local people [2]. These animals, fishes and invertebrates, mainly crustaceans, such as crabs and shrimps, are either relatively small and spend the majority of their lives within the mangrove or can become large and use the mangroves only as nursery areas, later spending the rest of their lives offshore.
Fishery in mangroves is often performed by men and women working together, as in the Philippines [3] and as observed in Dongzhaigang National Reserve, Hainan Province, China, as well. However, there, fishing couples rely on small boats equipped with outboard motors, which increase the efficiency of their operations.
Mangrove areas are declining throughout the intertropical belt due to coastal development to create ponds for shrimp farming and logging to produce charcoal and other wood products [4]. Jointly with increasing fishing pressure, this is reducing the producing capacity of mangroves. However, successful mangrove replanting programs are being initiated in different parts of the world [5,6], notably to protect coastlines from the effect of heavy seas. Such programs would benefit from the systematic monitoring and assessment of mangrove fisheries and the design of management rules that would ensure their sustainability or their rebuilding where necessary.
The assessment of fish stocks exploited by mangrove fisheries is difficult because (1) their unique habitats make it difficult to collect samples; (2) catches consist of a large number of small fish species whose key traits (growth, natural mortality, longevity) are not well documented or are unknown and (3), even when (2) is not an issue, e.g., because of the availability of FishBase [7], the multitude of species makes it problematic to apply traditional stock assessment models [8]. Thus, the dynamics of fish stocks in mangroves are rarely assessed, which makes it difficult to manage their fishery resources.
These constraints can be overcome with a stock assessment method that is suitable for data-limited situations, relying primarily on data that are straightforward to obtain even from a mangrove fishery, i.e., length-frequency (L/F) data. A number of such methods have been developed since the study of Pauly and Martosubroto [8], notably the approach known as Electronic Length Frequency Analysis or ELEFAN [9,10]. However, currently, the most sophisticated approach for L/F analysis, which also incorporates many of the earlier developments, is the length-based Bayesian estimation (LBB) method [11,12]. Although relatively recent, the LBB method is used widely [13,14], including in China [15,16,17]. Here, we present its first application using L/F data from a mangrove fishery.
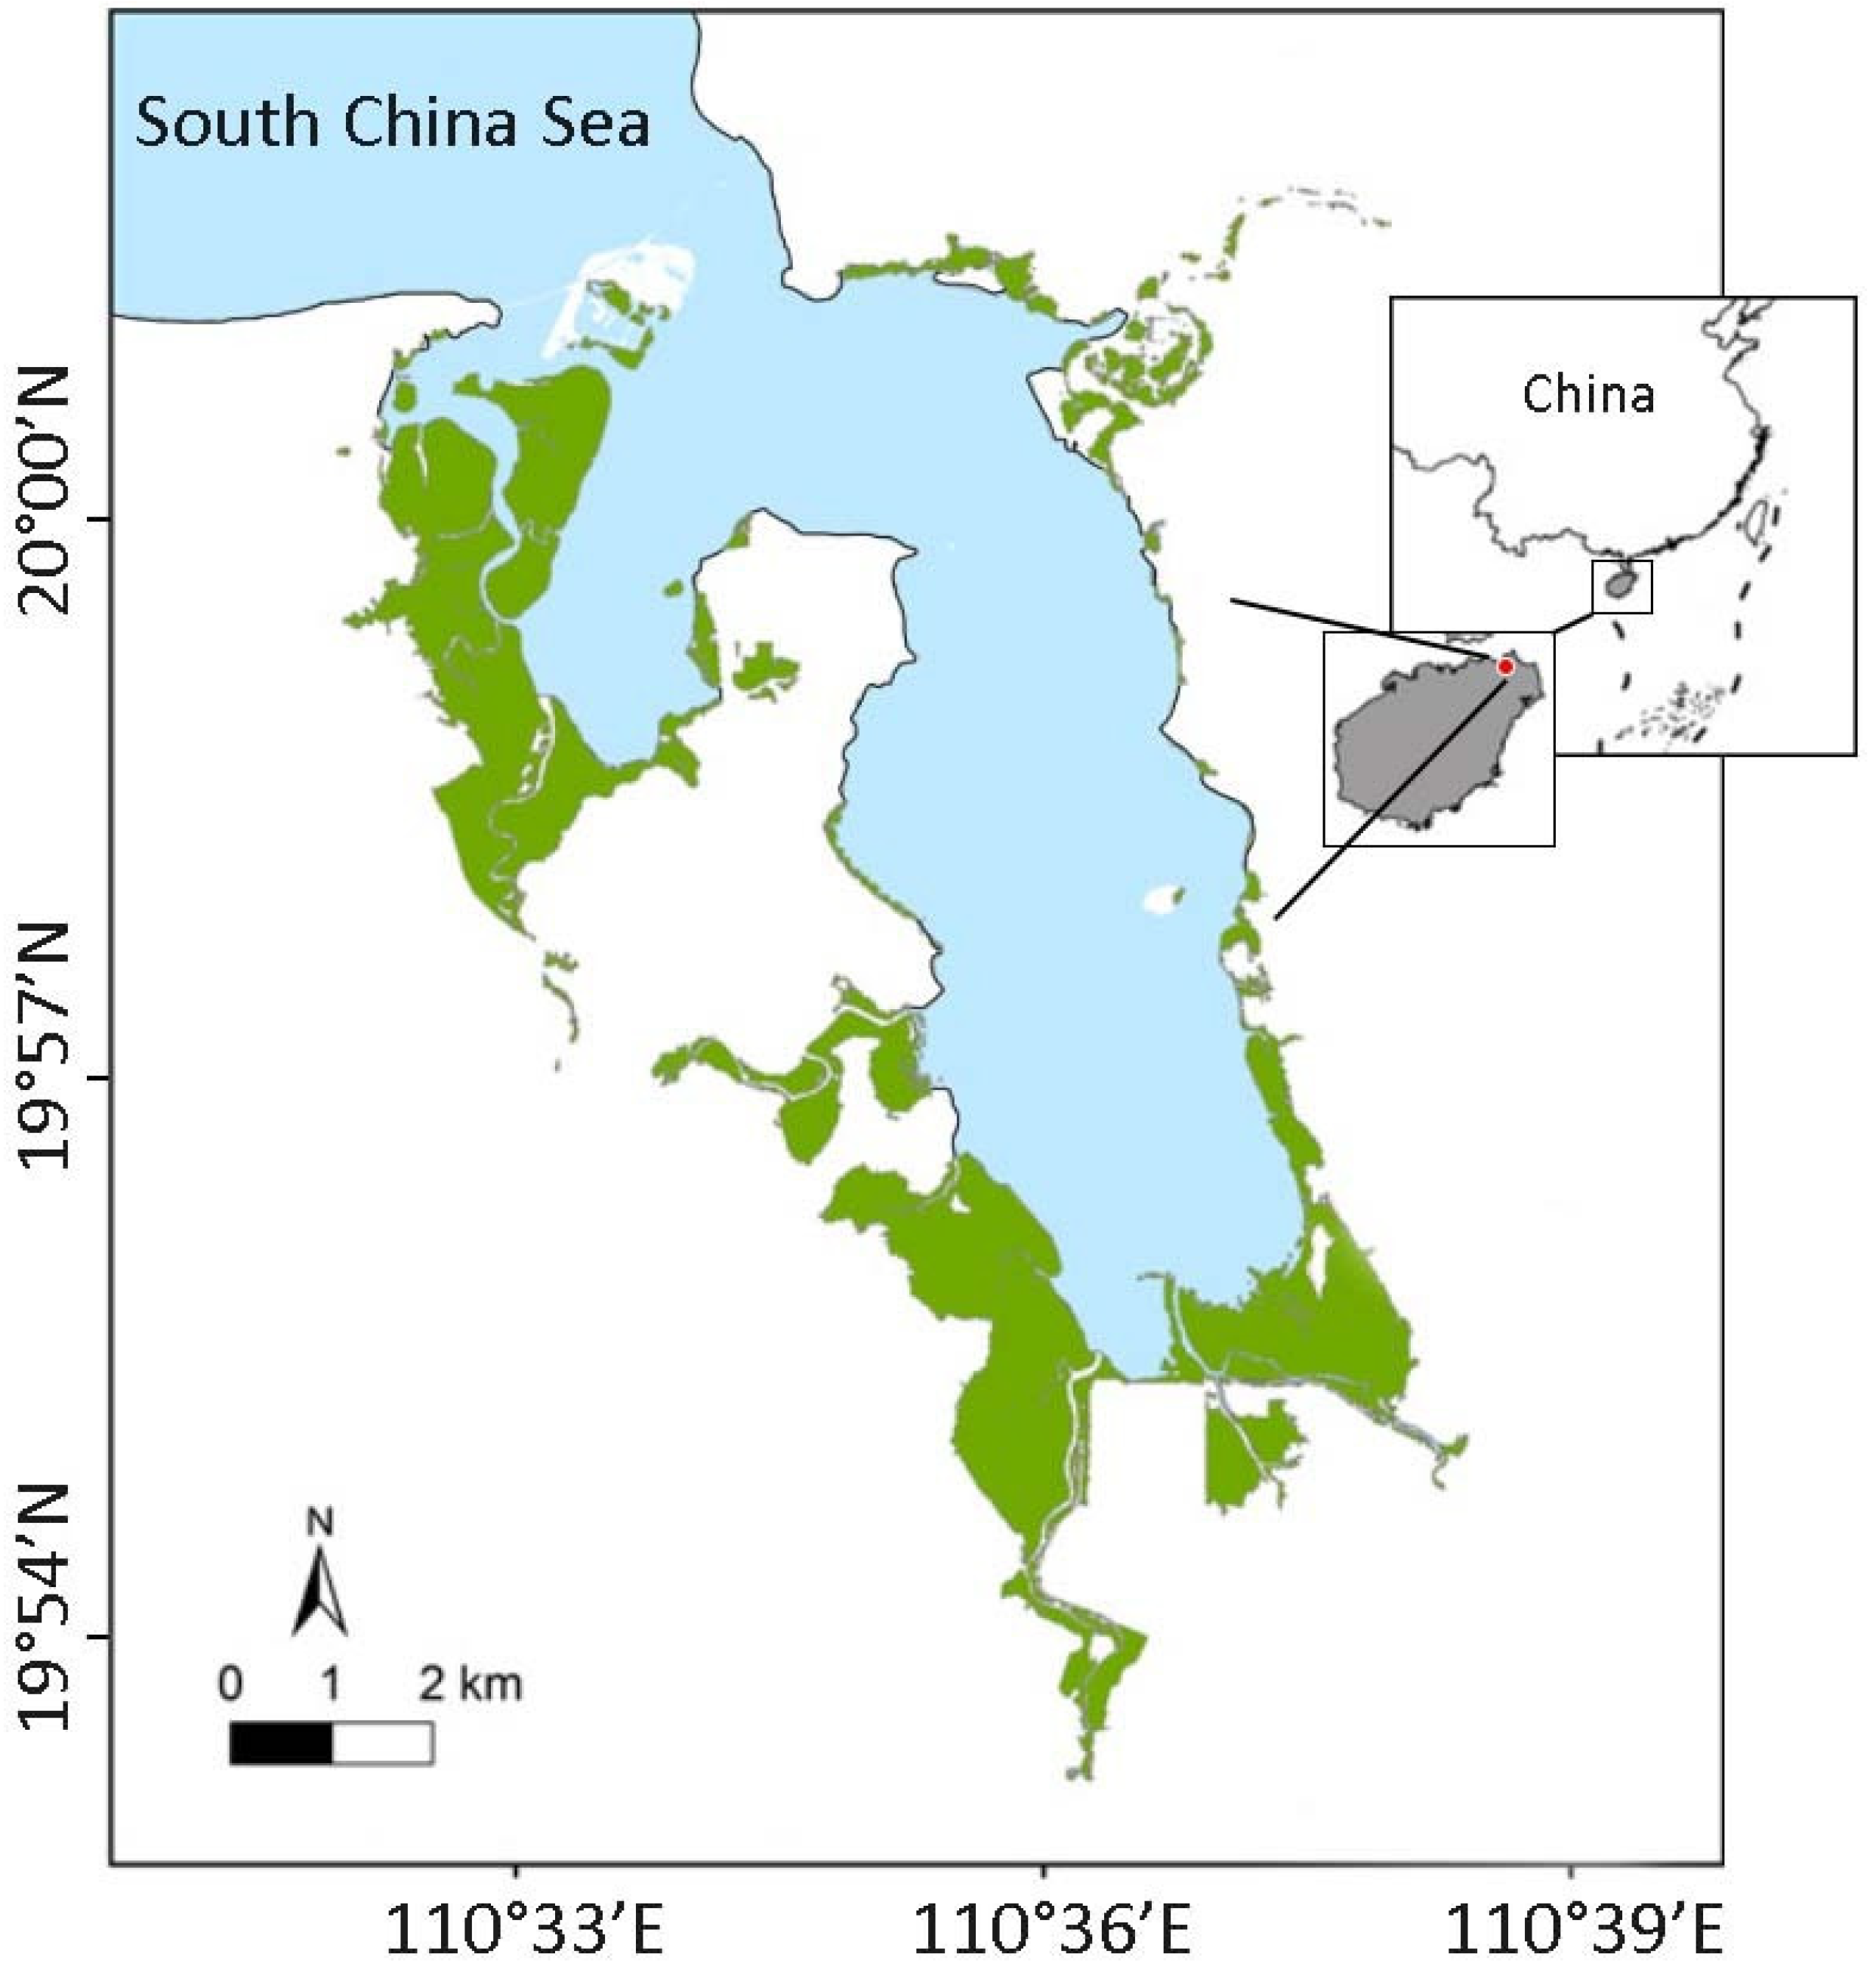
The Dongzhaigang Bay mangal, in the northeast of Hainan Island (Figure 1), is the first of the mangrove national nature reserves established in China. Researchers from Xiamen University have studied this mangrove area for nearly two decades. From 2009 to 2013, the nature reserve experienced a phase of severe water pollution (especially from nitrogen and phosphorus) due to the building of shrimp ponds and the farming of pigs and ducks (Anas platyrhynchos) from which it began to recover in late 2013 [18]. Notably, the local governments, starting in 2010, issued several circulars banning farming in the reserve. However, improvements in water quality began only in 2013, when these circulars were finally implemented.
This study, primarily devoted to assessing the status of the exploited fish stocks in the Dongzhaigang Bay mangroves, therefore, accounts, if briefly, for the water quality issue that occurred in the first year of sampling.
2. Materials and Method
2.1. Study Area
The Dongzhaigang Bay mangrove area is located in northeastern Hainan Island, China (110°32′–110°37′ E, 19°51′–20°1′ N; Figure 1), and harbors a rich diversity of animals and plants, both terrestrial and marine. The mangrove area is 33.4 km2, and the tides are irregularly semi-diurnal with an average range of 1.3 m. The tropical monsoon climate has an annual average temperature currently ranging from 23.3 to 23.8 °C and annual precipitation of 1676 mm.
2.2. Sample Collecting
The fish studied here were collected during seasonal field trips performed in 2009, 2014 and 2020 by faculty and graduate students from Xiamen University using 10 m “centipede” nets with 1 cm meshes with the same design as those used in commercial fishery. For each sampling season, we collected specimens of each species until we had at least 100 individuals so as to obtain a representative L/F sample for each species. All collected specimens were immediately put on ice and transported to a laboratory where they were weighed to the nearest 0.1 g and measured to the nearest millimeter (standard length; SL).
2.3. Catch per Effort
Catch per effort (C/f or CPUE) during the sampling periods was estimated in terms of fish numbers per net set and in terms of catch weights per net set. The latter was obtained by computing, for each of the sampling years, the weight of a sample of 100 individual fish of a given species with the average length distribution in that year then multiplying the weight of the % sample by the mean catch per effort in number for that year.
This required, for each species considered, the a and b parameters of the length–weight relationships (LWR) of the form W = a·Lb (from [19]) and an expression for computing the mean weight of the fish in length class i with lower class limit Li and upper class limit Li+1, i.e.,
Ref. [20]. Note that this equation provides the exact value of , which is not the case with the weights corresponding to L = (Li + Li+1)/2 or the mean of the weights corresponding to Li and Li+1.
Given Equation (1), the weight of any sample can be estimated from
where
is the mean weight of class i;
fi,j is the frequency of class i in sample j; and
nj is the number of classes in sample j.
2.4. The LBB Method
The length-based Bayesian (or LBB) method [11] is based on the von Bertalanffy growth function (VBGF; [21]), which is, in the form given by Beverton and Holt [22]:
where Lt is the length at age t (here: years) of the individual in a given population (of fish), Linf is their mean asymptotic length, i.e., the mean length they would reach if they survived to a very high (or infinite) age, K is the rate at which Linf is approached (here: year−1) and t0 is the age at zero length if the young fish in question always grew according to the VBGF (which is not the case but which can be neglected because t0 plays no role in LBB).
The LBB method also assumes that the number of individuals that are retained by the fishing gear at length L, which is a function of the gear’s selectivity, can be represented by:
As well, the selectivity of the gear used to obtain the L/F samples is assumed to be the same as that used in the fishery that is being studied, which applies in the case of Dongzhaigang Bay.
Starting with the length (Lstart), where S ≈ 1, when all the fish impacted by the gear are retained, the fish of length Li that are left in the population are:
and
where NLi refers to the fish having survived to length Li, NLi−1 is their number at length Li−1, M and F are the rates of natural and fishing mortality in the population in question and CLi is the number of individual fish vulnerable to the gear, as estimated using the probabilities from Equation (2).
The length at which the maximum biomass of an unexploited population can be computed from
while the length at first capture Lc−opt, associated with the maximum catch, and biomass (i.e., the ‘optimum length’) are obtained from
As catch/effort, or CPUE, can be conceived as being proportional to biomass, and fishing mortality is strictly proportional to fishing effort, CPUE′/R can be derived from Equation (7) by dividing it by F/M, which gives:
Then, relative biomass ( for >Lc) when F = 0, (i.e., before exploitation started) is estimated by
Therefore, the relative biomass of a population under exploitation can be estimated by
The LBB method requires priors, notably for Linf. These priors were mainly derived from FishBase, and they were the same for all three sampling periods (see Table 1).
3. Results
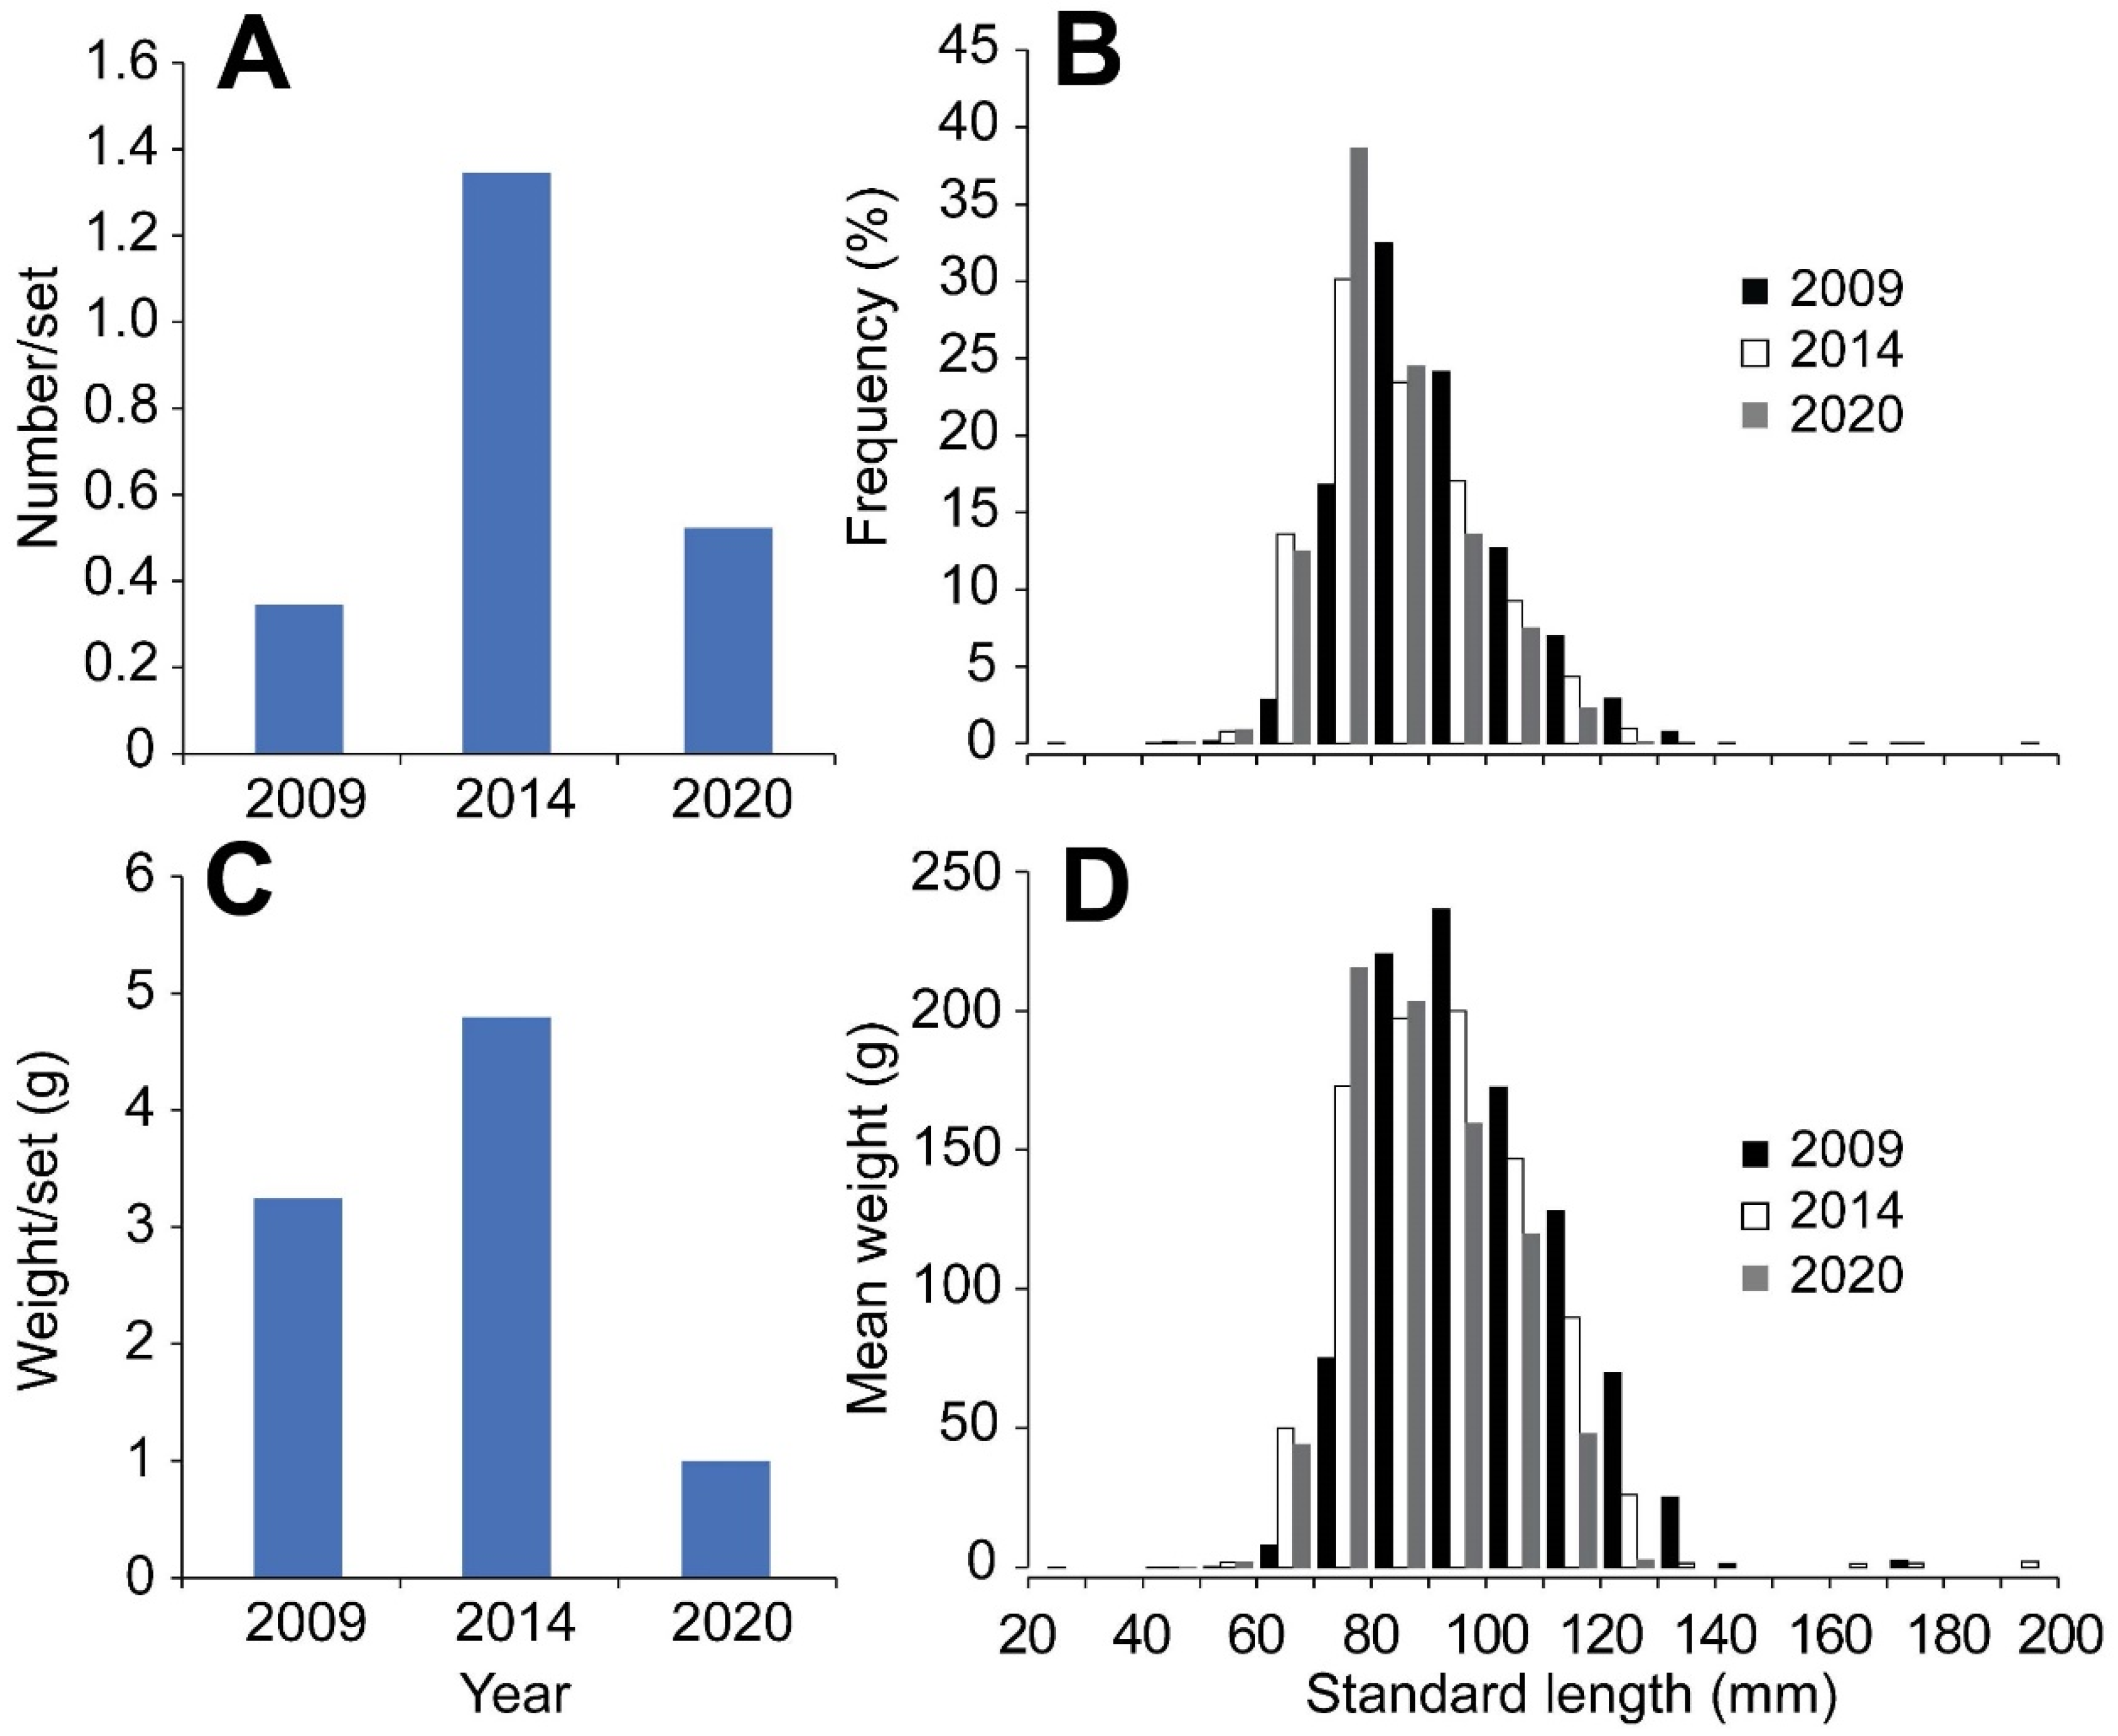
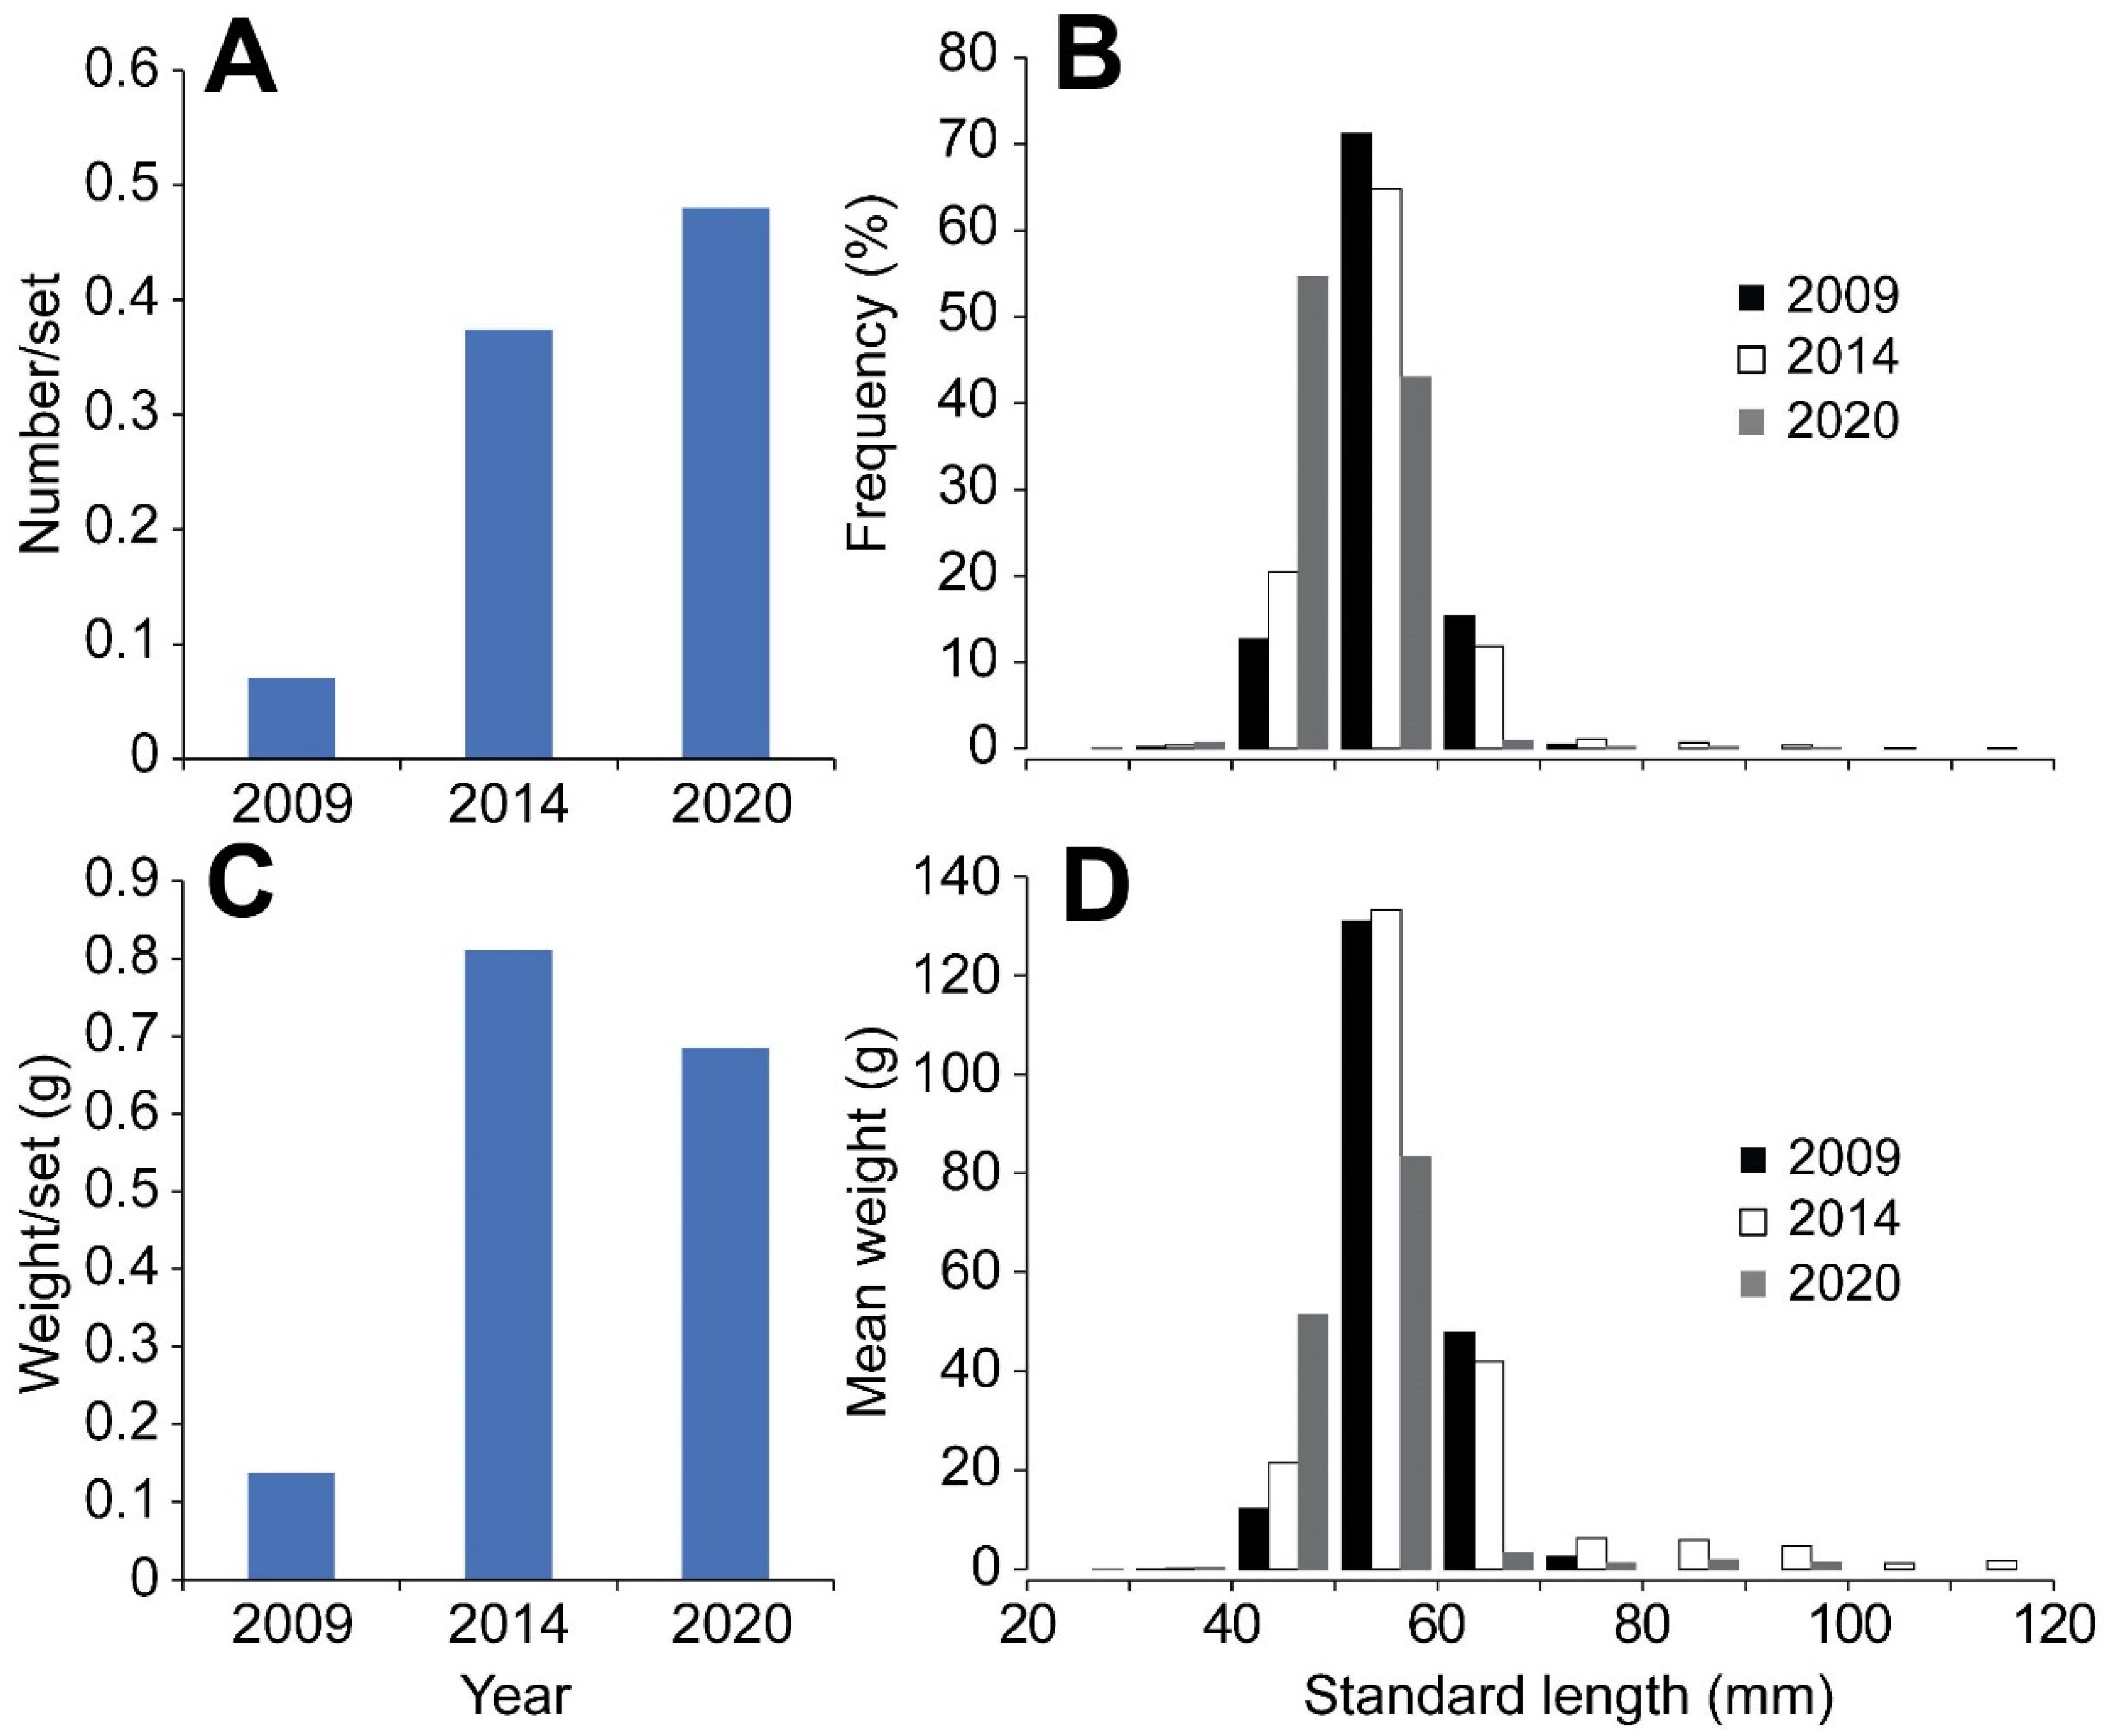
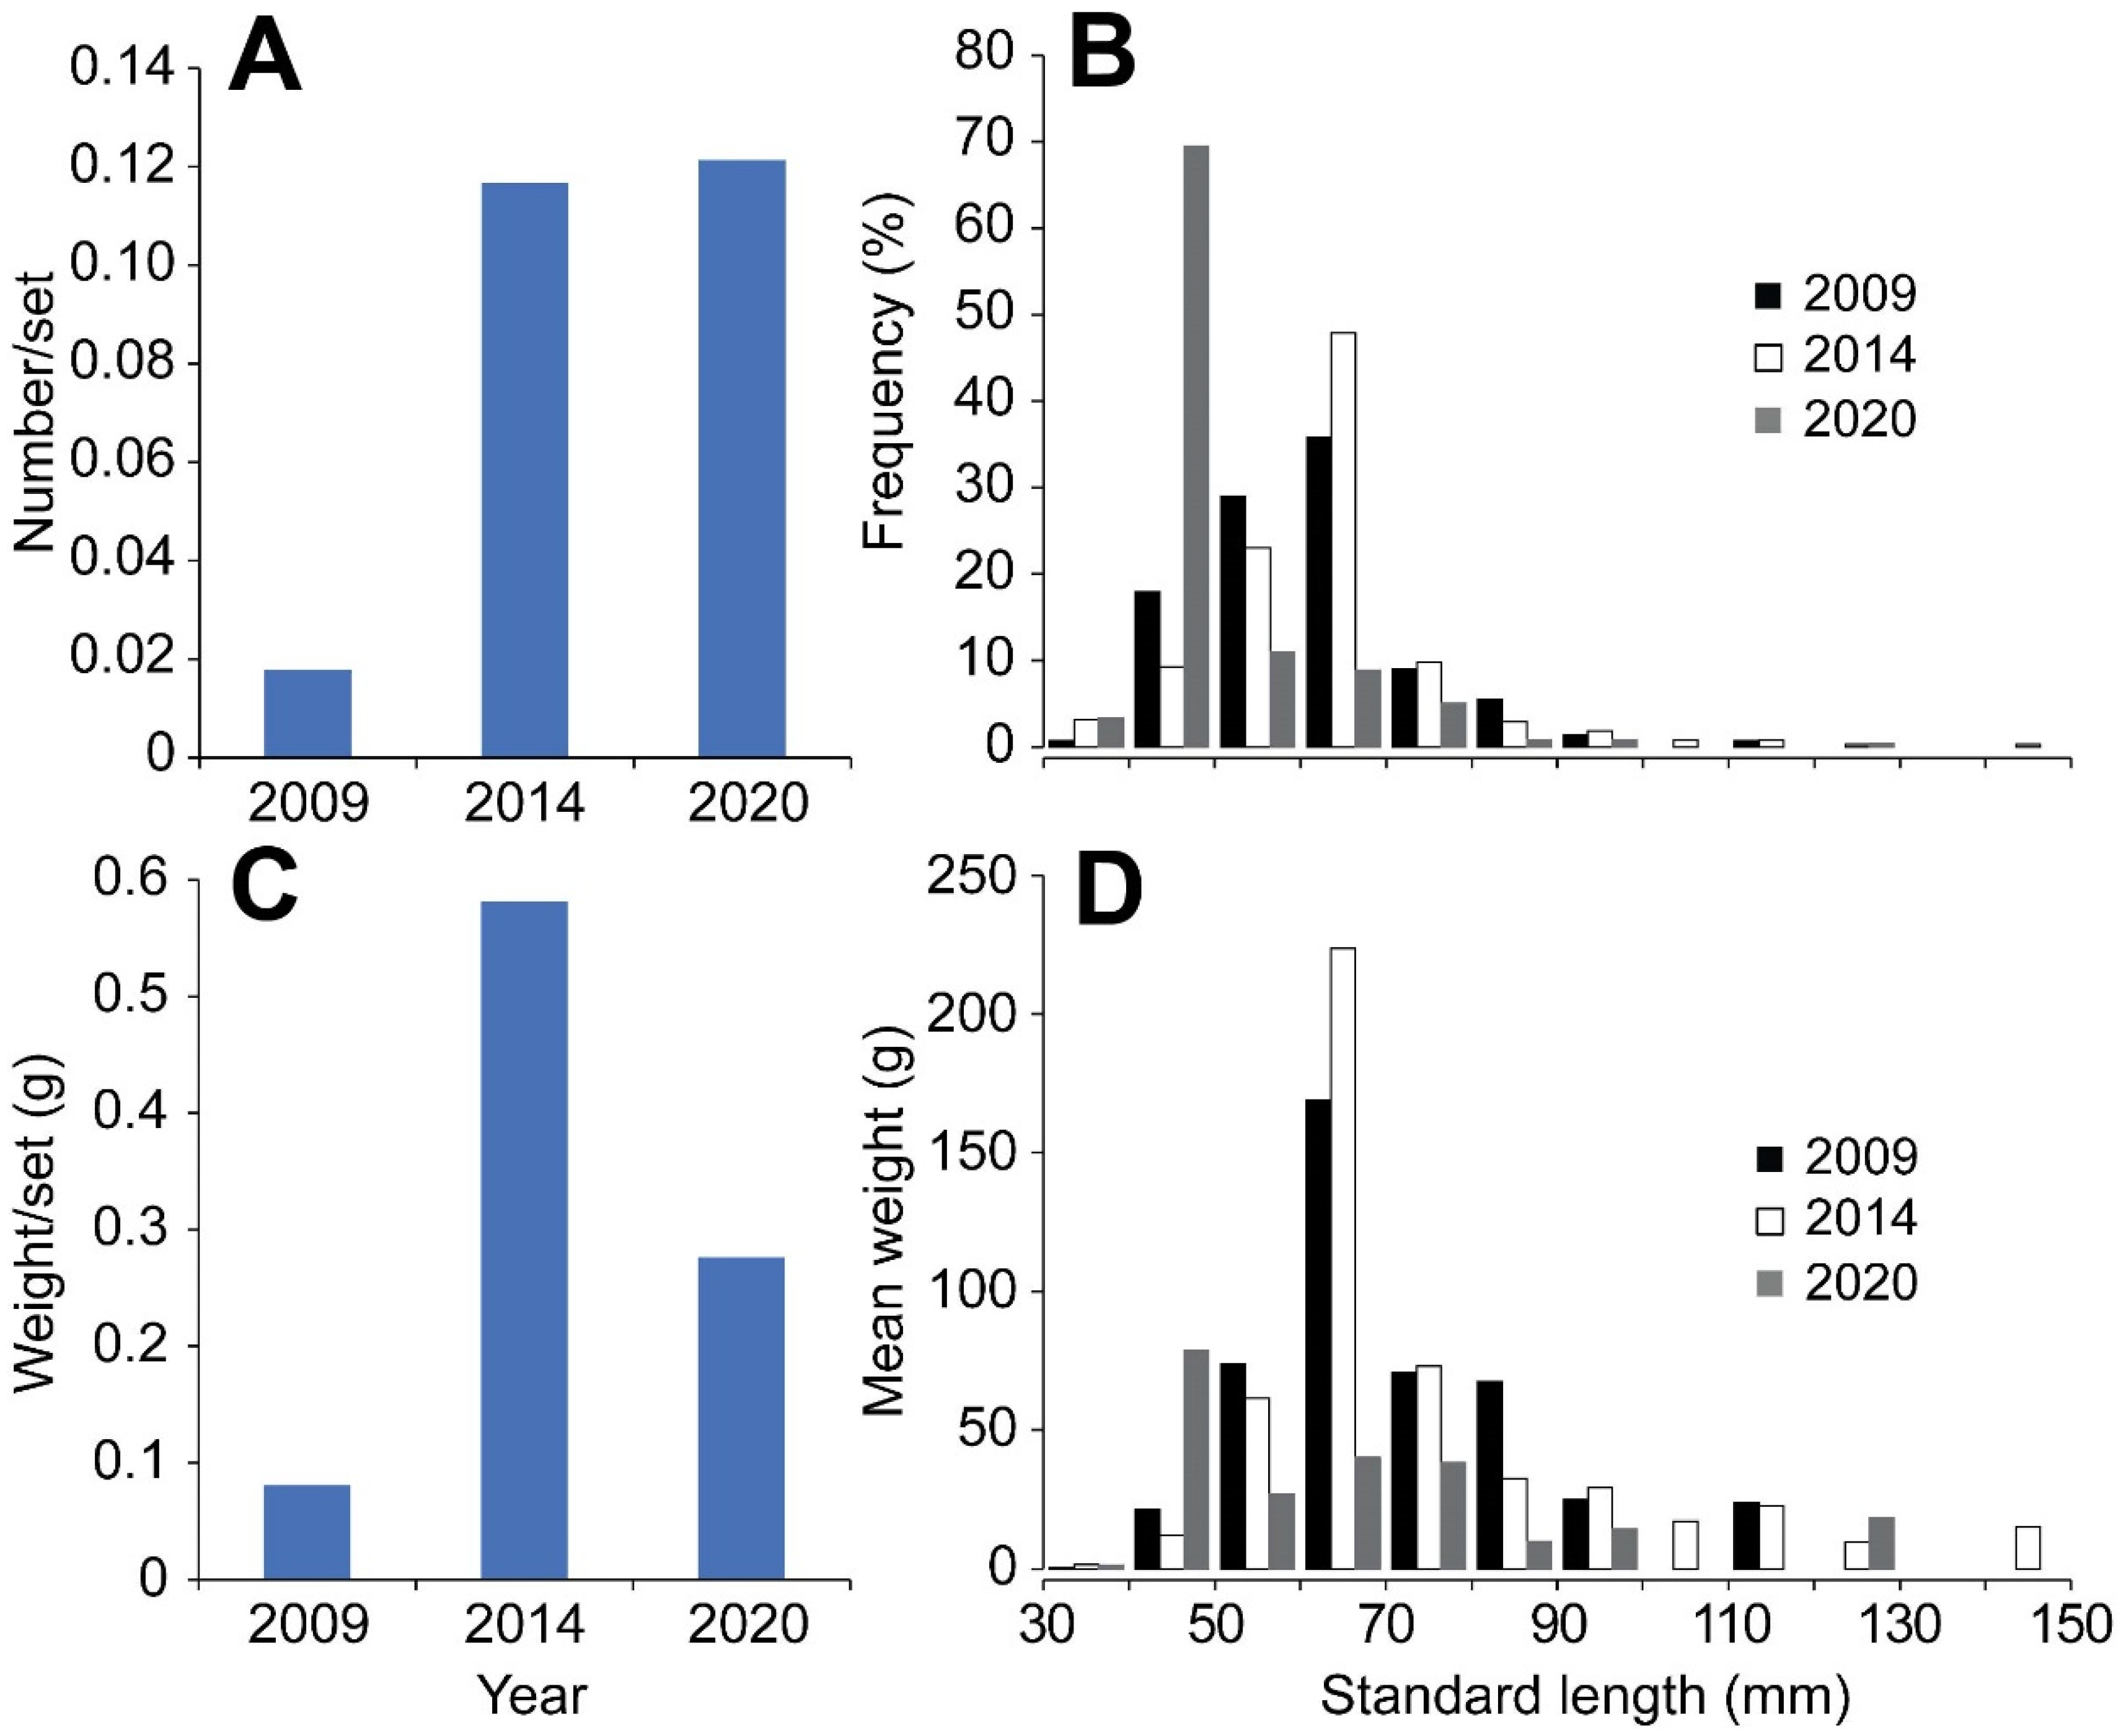
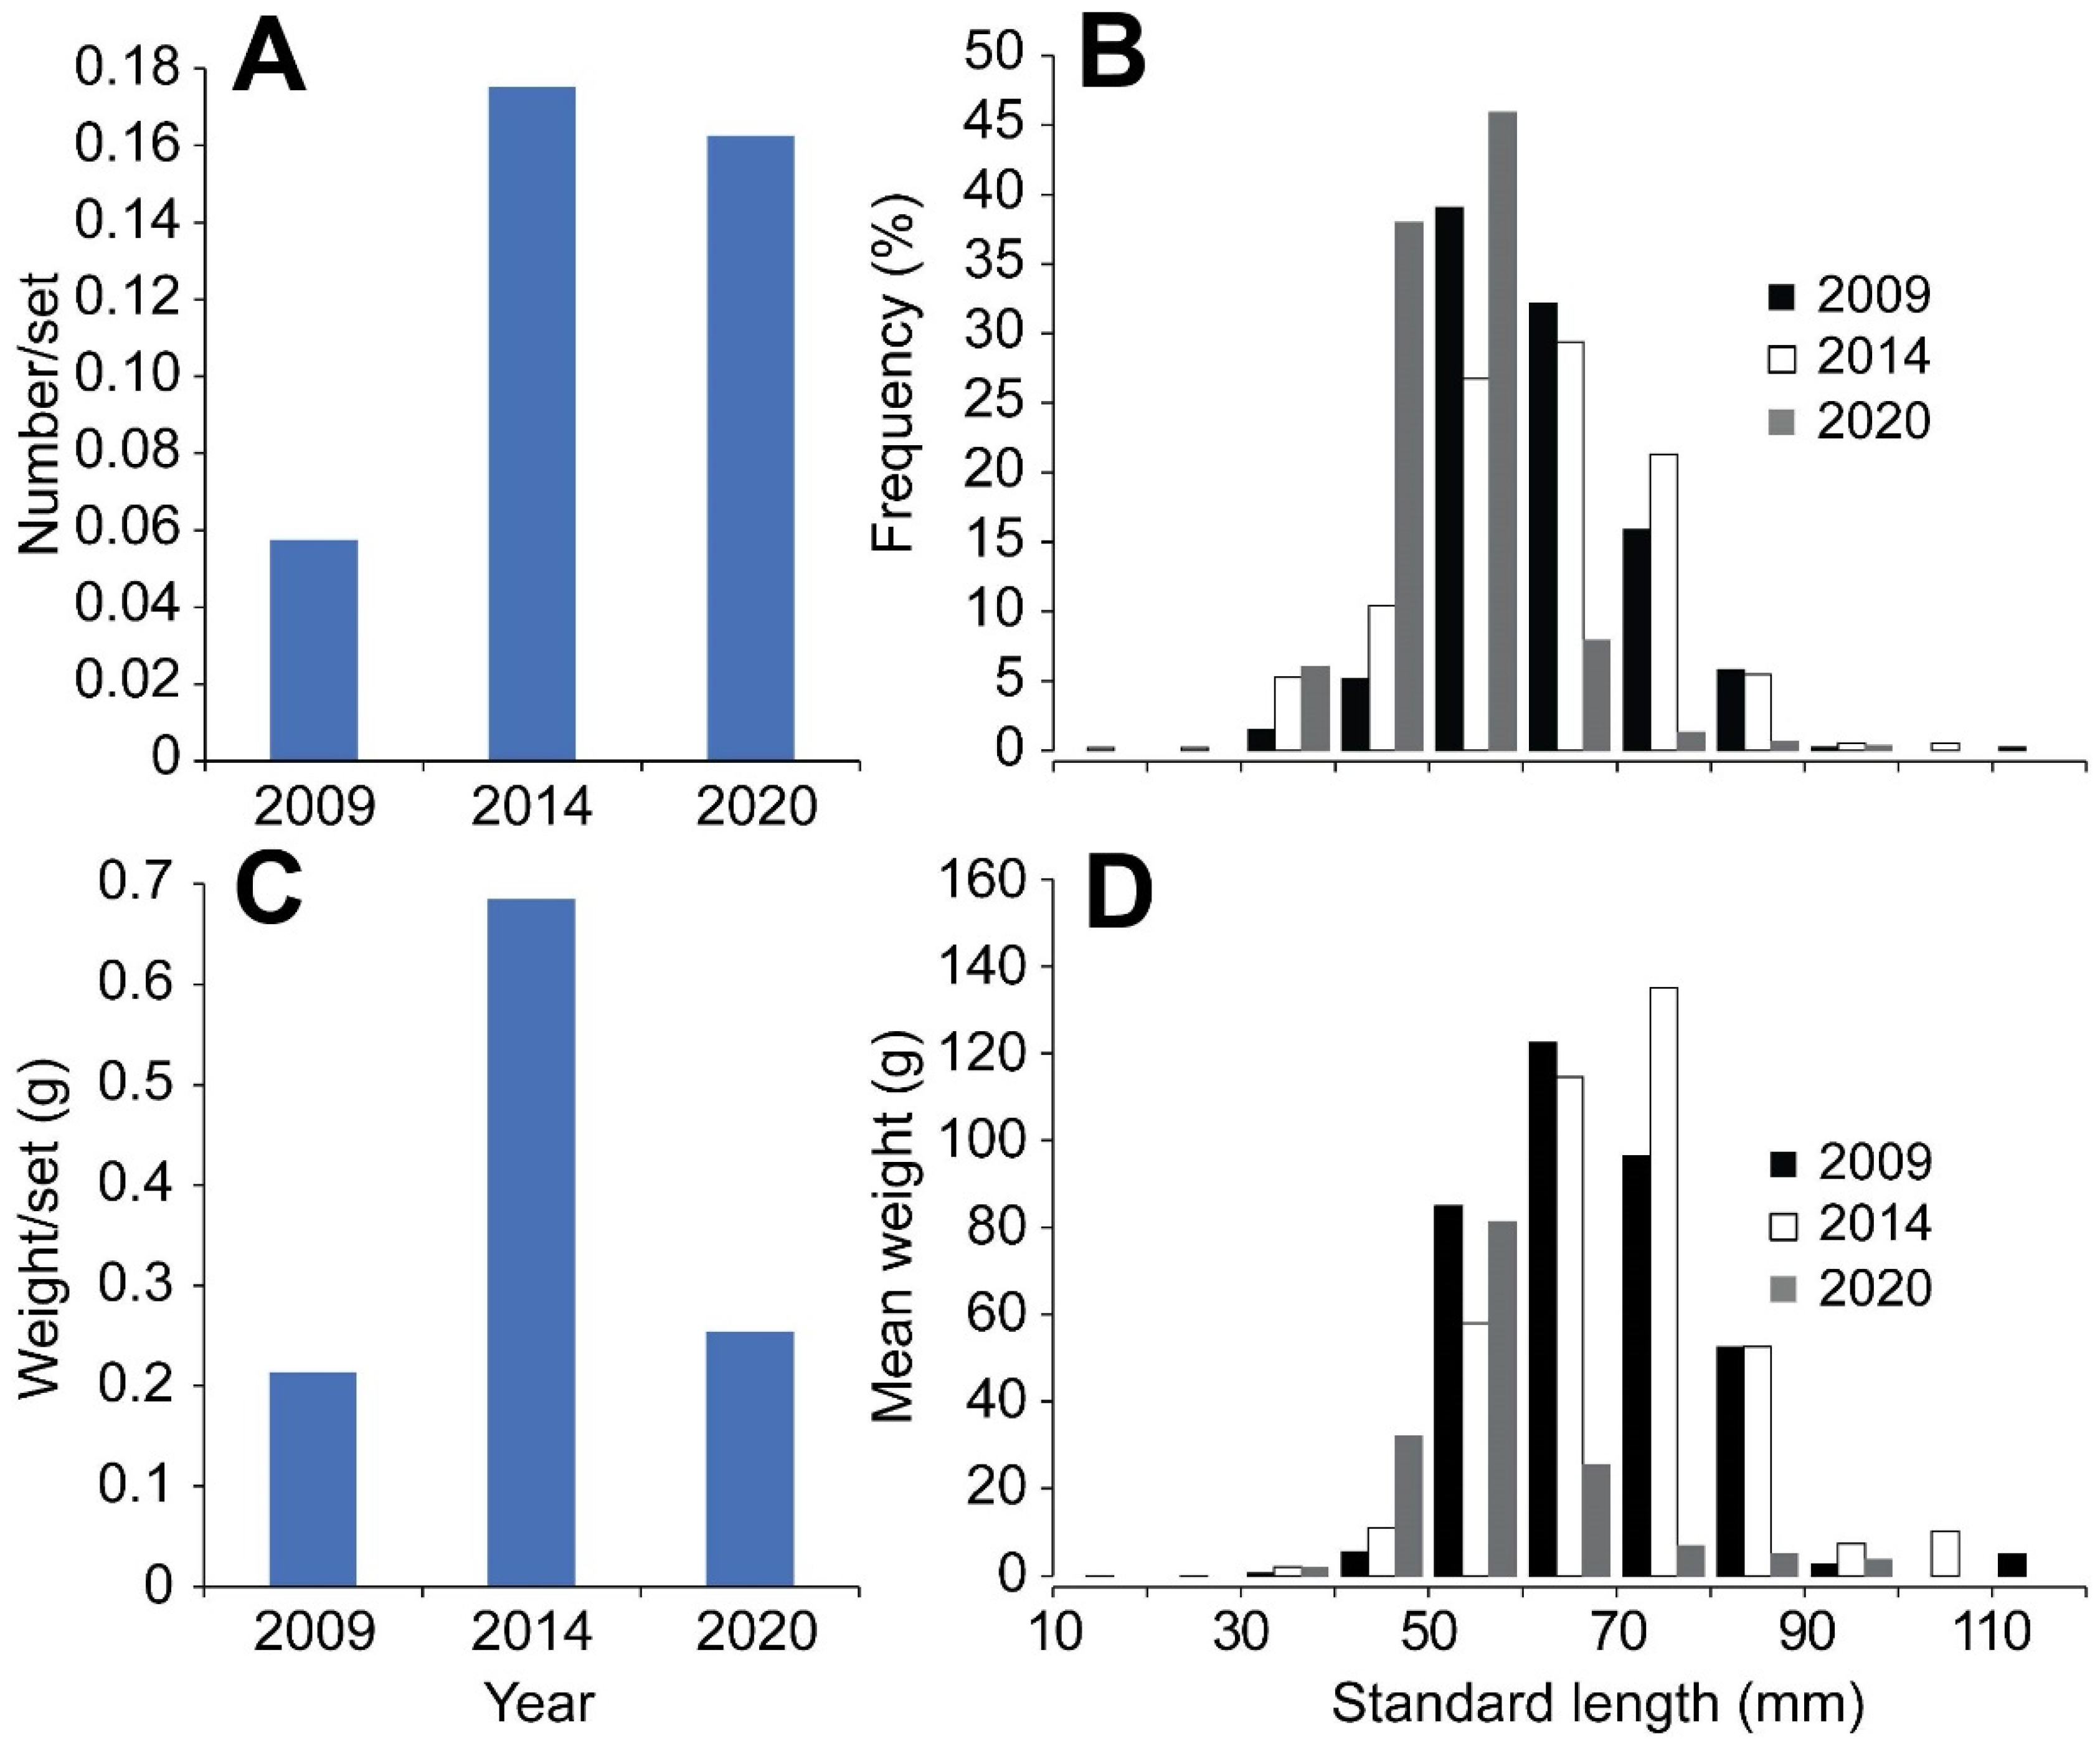
In this study, L/F data were sampled for 26 fish species in Dongzhaigang National Reserve, i.e., 16 species in 2009, 18 in 2014 and 15 in 2020 (Table 1). Of these, six species occurred in the three sampling years, 11 species in two and nine species appeared only once. Figure 2, Figure 3, Figure 4 and Figure 5, pertaining to spotted green goby (Acentrogobius viridispunctatus), bald glassy (Ambassis gymocephalus), saddleback silver-biddy (Gerres lucidus) and shortnose ponyfish (Leiognathus brevirostris), illustrate their catch per effort in numbers (Figure 2A, Figure 3A, Figure 4A and Figure 5A) and in weight (Figure 2C, Figure 3C, Figure 4C and Figure 5C) during the three sampling years. Figure 2B,D, Figure 3B,D, Figure 4B,D and Figure 5B,D illustrate the length-frequency and weight-frequencies, respectively, in these three years.
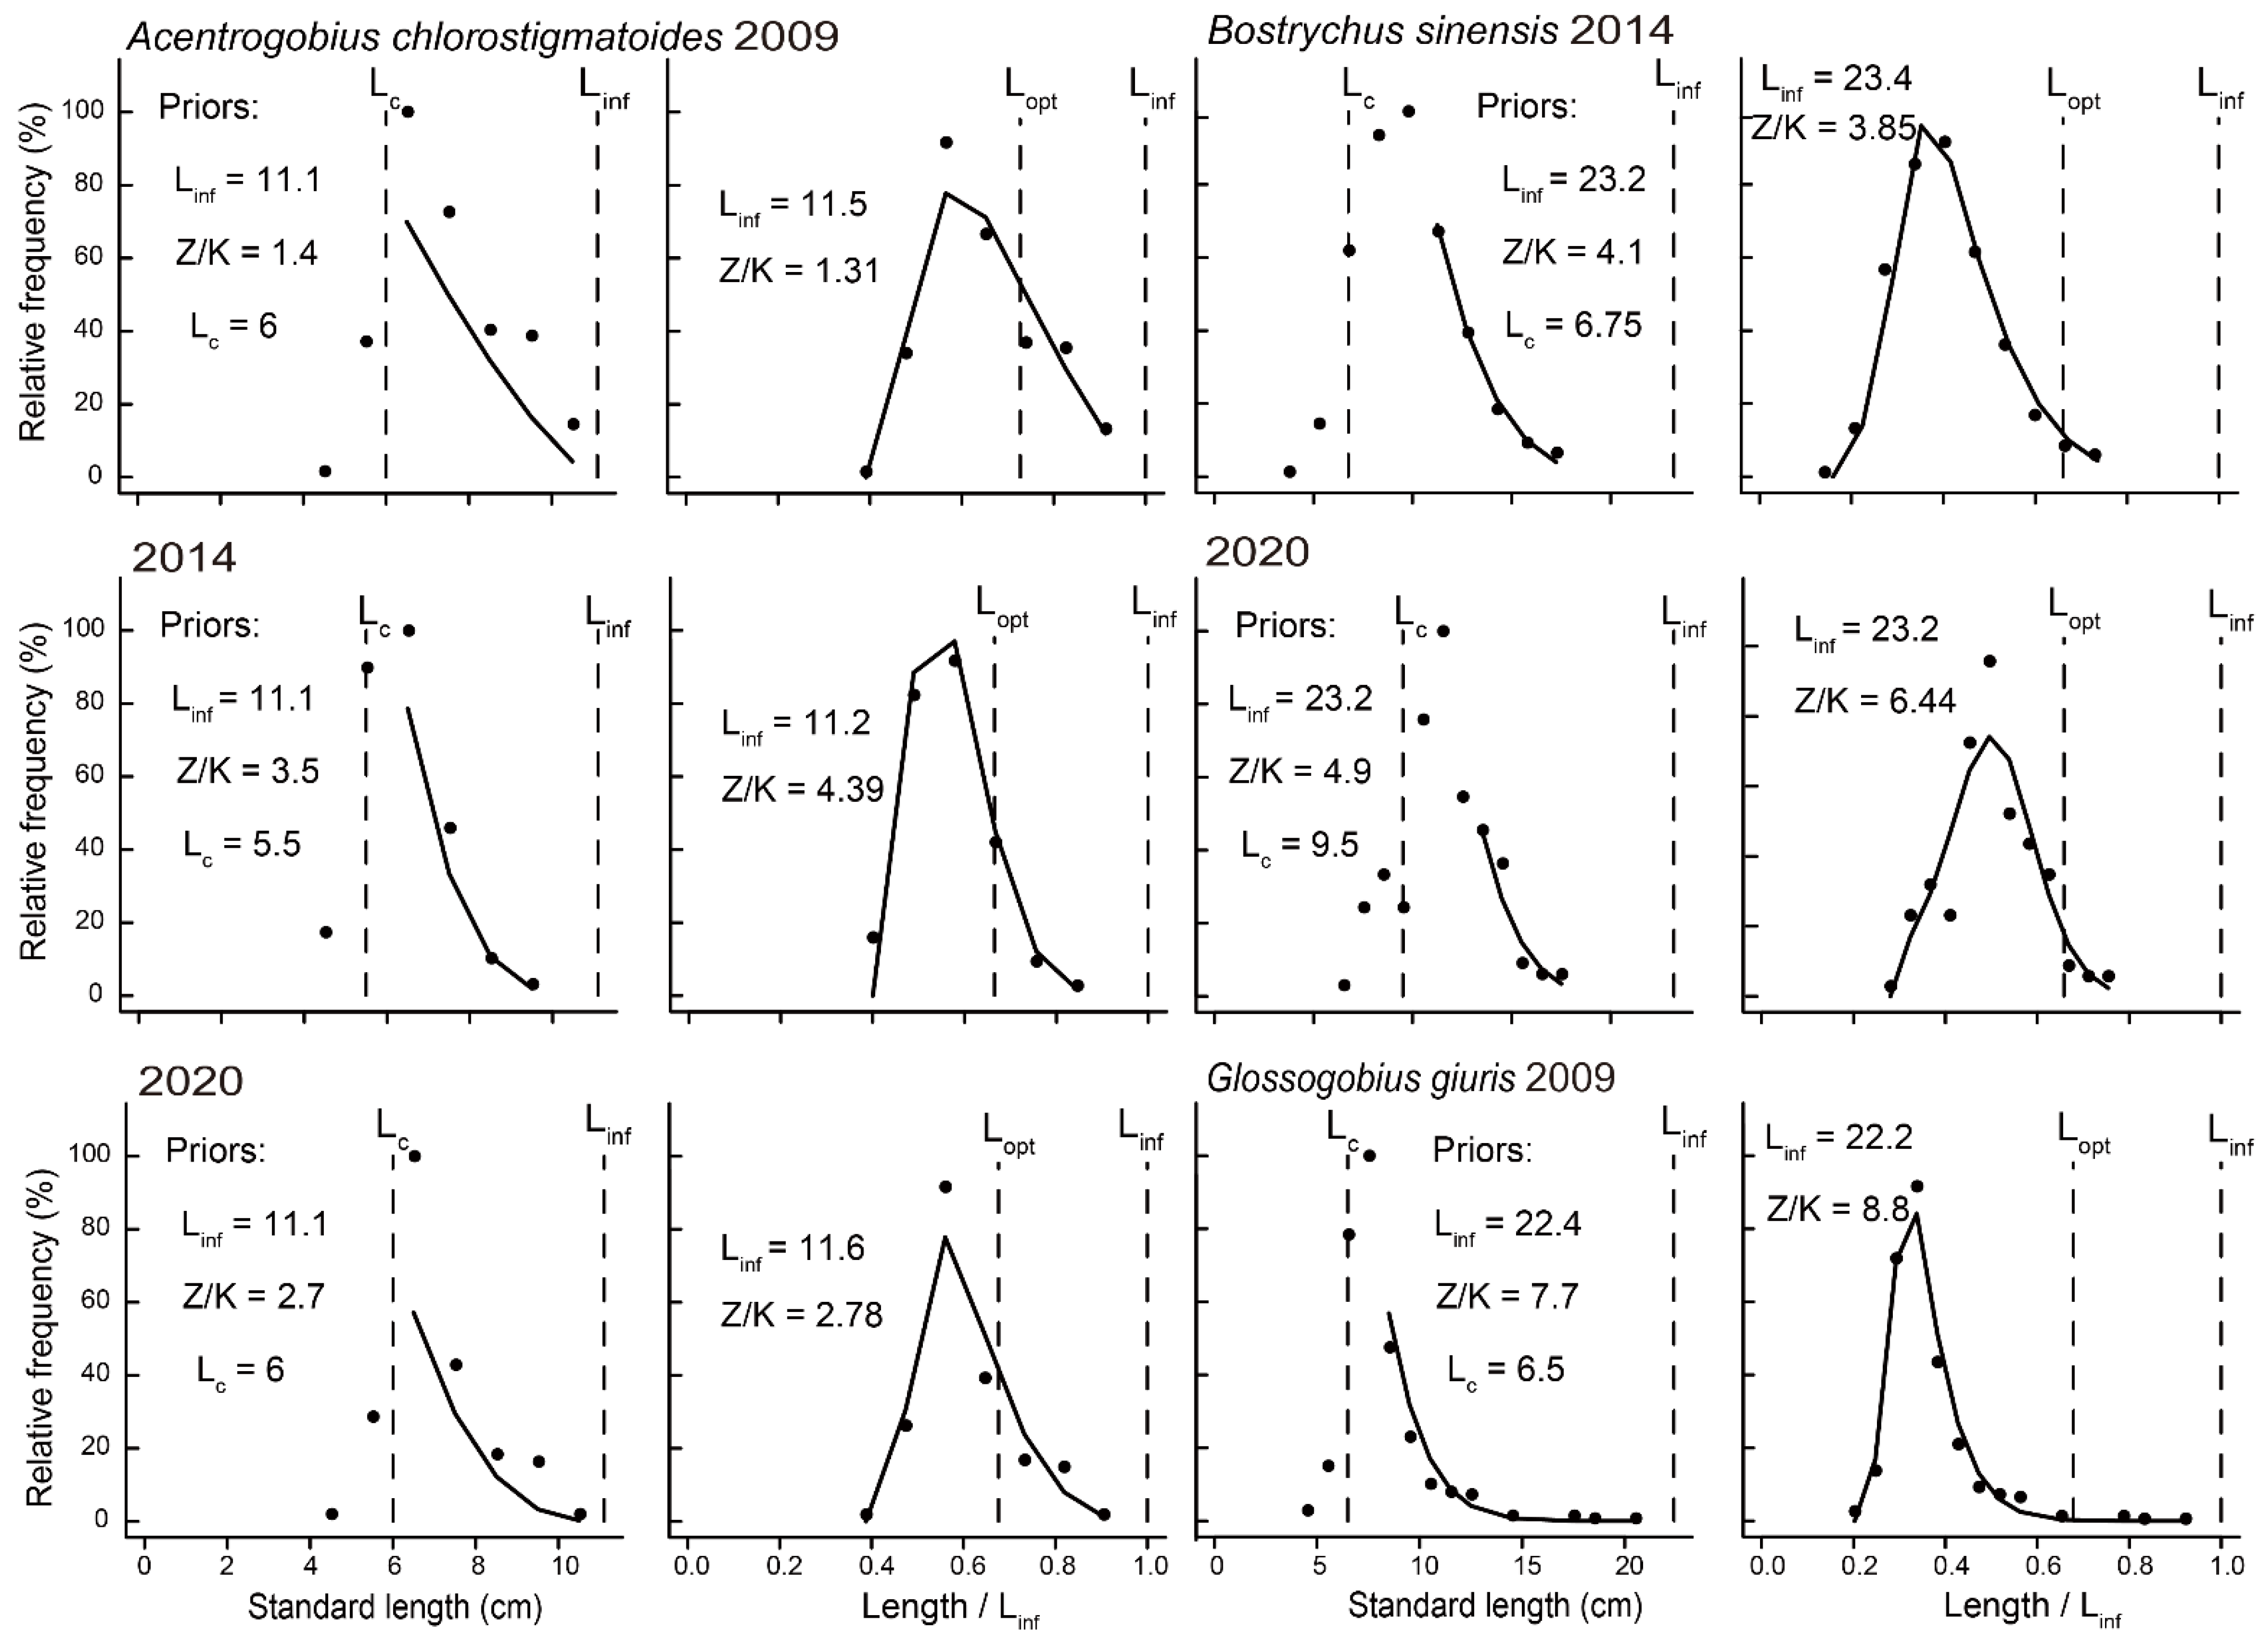
Table 2 gives the LBB results for all 26 of our species. Figure 6 illustrates the application of the LBB method to three species, i.e., greenspot goby (Acentrogobius chlorostigmatoides), for which three years’ worth of L/F data were available, four-eyed sleeper (Bostrychus sinensis), with two years of L/F data, and tank goby (Glossogobius giuris), with one year of L/F data. The graphical results of the LBB for the remaining 23 species are given in the Supplementary Materials.
4. Discussion
Mangrove fisheries such as those in Dongzhaigang National Reserve not only provide fish for food, but also can play an important role in providing livelihoods to local communities. Although many counties have focused on protecting their mangroves for the biodiversity and ecosystem services they render, the method used in that research often fails to assess the status of the exploited fish populations. The LBB method, on the other hand, allows the assessment of all the fish populations for which sufficient L/F data have been collected. The main result of these assessments was, unsurprisingly, that all these species are overfished, i.e., have a biomass well below that which generates maximum sustainable yield (Table 2). Similar levels of overexploitation were reported by [26] in the Sundarbans mangrove ecosystem in Bangladesh.
At least four species (A. viridipunctatus, A. gymnocephalus, G. lucidus and L. brevirostris) of the Dongzhaigang National Reserve are experiencing the ‘miniaturization’ that has also been widely reported in other fish populations along the coast of China, e.g., the populations of small yellow croaker Larimichthys polyactis [27,28] or the greenfin horse-faced filefish Thamnaconus septentrionalis [29]. The main reason for miniaturization is overfishing. With the improvement in living standard in China, the demand for fish is becoming higher, which is leading to increasing fishing pressure, i.e., overfishing.
Some species are targeted because of their high value; one example is Bostrychus sinensis, the price of which, around 200 RMB/kg, is much higher than that of other fish species from the mangroves, and it is viewed by the local community as having medicinal properties, especially for pregnant women, the elderly and children [30]. Though the species is also raised in ponds, its wild stocks have been outside of safe biological limits since 2014 (Table 2). This high-value species, which appears to spawn between May and August [31] may need special protection.
Two species of the Family Leiognathidae may be mentioned which possess interesting adaptations to living in mangrove areas. The first is the common ponyfish (Leiognathus equula), whose well-documented habit of exuding massive quantities of slime through its skin [32] may be an adaption to a life in turbid water. The slime causes suspended matter to flocculate, thus enlarging the fish’s field of vision [33]. The other adaptation may occur in Leiognathus brevirostris, which, like all its congeners, possesses a gland around the esophagus that is filled with bioluminescent bacteria, generating light that the leiognathid directs downward so as to counter-illuminate their shadow and thus foil predators below them [34]. In turbid water, the need for such counter-illumination is reduced [35], and, thus, L. brevirostris should emit less light than most of its congeners.
The CPUE data in Figure 2, Figure 3, Figure 4, Figure 5 and Figure 6 show a decline in number and weight of fish caught in 2020 compared with 2014, which is in line with the LBB results. However, the corresponding 2009 CPUE data were also low. Pending further studies, we attribute the low CPUE in 2009 to the pollution prevailing in Dongzhaigang National Reserve at that time. This pollution may have reduced the recruitment of multiple species, which, however, continued to be fished, thus resulting in both low CPUE and small fish sizes. This hypothesis, however, is tentative and is likely to remain so given the absence of monitoring data sampled at annual intervals.
5. Conclusions
Of the 26 fish species for which length-frequency samples were collected in 2009, 2014 and 2020 in the Dongzhaigang Bay mangrove area of Hainan, China, most were overexploited, which reduced both the biomass of their population and the size of individuals. This endangered the local fishery, although it appeared to have recovered from the serious pollution a decade ago caused by the operation of shrimp, pig and duck farming. The intervention of local governments was required to limit these farming operations and the pollution they generated. What is currently required is a similar intervention to limit and possibly reduce the fishing effort that is currently deployed in the Dongzhaigang Bay mangrove area and/or increase the legal mesh size of the net in the fishery, which would help to halt and then possibly reverse the miniaturization of the fish therein and the decline of their biomass and eventually lead to higher fisheries catches of larger fish.
Supplementary Materials
The following supporting information can be downloaded at: https://www.mdpi.com/article/10.3390/su14169933/s1, Species with L/F data in 2009, 2014 and 2020; Species with L/F data in only 2 periods; Species with only one year’s worth of L/F data.
Author Contributions
C.J., W.W. and M.W.: methodology, formal analysis and writing original draft; S.Y., Y.D., X.M. and C.J.: data collecting; D.P.: methodology, reviewing and editing the draft. All authors have read and agreed to the published version of the manuscript.
Funding
This research was funded by the National Natural Science Foundation of China (NSFC) (grant no. 42076161).
Institutional Review Board Statement
Ethical review and approval were waived for this study due to the collection of fish samples was by the ‘centipede’ net until the low tide, and animals had died before the treatments.
Informed Consent Statement
Not applicable.
Data Availability Statement
Data are available upon reasonable request.
Acknowledgments
We thank Elaine Chu for Figure 1, Figure 2, Figure 3, Figure 4 and Figure 5, Yu Li, Yiqiao Chen, Jianghua Cheng and other colleagues for assistance with collecting and organizing data and the staff of Hainan’s Dongzhaigang National Nature Reserve and the local community for their understanding and support.
Conflicts of Interest
The authors declare that the research was conducted in the absence of any commercial or financial relationships that could be construed as a potential conflict of interest.
References
- Spalding, M.; Blasco, F.; Field, C. (Eds.) World Mangrove Atlas; International Society for Mangrove Ecosystems (ISEM): Okinawa, Japan, 1997; p. 178. [Google Scholar]
- Hutchison, J.; Spalding, M.; Zu Ermgassen, P. The role of mangroves in fisheries enhancement. Nat. Conserv. Wetl. Int. 2014, 54, 434. [Google Scholar]
- Torell, E.; Castro, J.; Lazarte, A.; Bilecki, D. Analysis of Gender Roles in Philippine Fishing Communities. J. Int. Dev. 2021, 33, 233–255. [Google Scholar] [CrossRef]
- Friess, D.A.; Rogers, K.; Lovelock, C.E.; Krauss, K.W.; Hamilton, S.E.; Lee, S.T.; Lucas, R.; Primavera, J.; Rajkaran, A.; Shi, S. The state of the world’s mangrove forests: Past, present, and future. Annu. Rev. Environ. Resour. 2019, 44, 89–115. [Google Scholar] [CrossRef]
- Barbier, E.B. Natural barriers to natural disasters: Replanting mangroves after the tsunami. Front. Ecol. Environ. 2006, 4, 124–131. [Google Scholar] [CrossRef]
- Bosire, J.; Dahdouh-Guebas, F.; Walton, M.; Crona, B.; Lewis, R.; Field, C.; Kairo, J.; Koedam, N. Functionality of restored mangroves: A review. Aquat. Bot. 2008, 89, 251–259. [Google Scholar] [CrossRef]
- Froese, R.; Pauly, D. FishBase. World Wide Web Electronic Publication. 2022. Available online: www.fishbase.org (accessed on 2 May 2022).
- Pauly, D.; Martosubroto, P. The population dynamics of Nemipterus marginatus (Cuv. & Val.) off Western Kalimantan, South China Sea. J. Fish Biol. 1980, 17, 263–273. [Google Scholar]
- Pauly, D. Beyond our original horizons: The tropicalization of Beverton and Holt. Rev. Fish Biol. Fish. 1998, 8, 307–334. [Google Scholar] [CrossRef]
- Gayanilo, F.C.; Sparre, P.; Pauly, D. The FAO-ICLARM Stock Assessment Tools (FiSAT) User’s Guide; FAO Computerized Information Series/Fisheries; FAO: Rome, Italy, 1996; Volume 8, p. 126. [Google Scholar]
- Froese, R.; Winker, H.; Coro, G.; Demirel, N.; Tsikliras, A.C.; Dimarchopoulou, D.; Scarcella, G.; Probst, W.N.; Dureuil, M.; Pauly, D. A new approach for estimating stock status from length frequency data. ICES J. Mar. Sci. 2018, 75, 2004–2015. [Google Scholar] [CrossRef]
- Froese, R.; Winker, H.; Coro, G.; Demirel, N.; Tsikliras, A.C.; Dimarchopoulou, D.; Scarcella, G.; Probst, W.N.; Du-Reuil, M.; Pauly, D. A Simple User Guide for LBB (LBB_33a.R). 2019. Available online: http://oceanrep.geomar.de/44832/ (accessed on 1 September 2021).
- Chowdhury, S.R.M.; Uddin, S.; Nazrul, K.M.S.; Sultana, R. Stock Assessment for Seven Fish Species Us-ing the LBB Method from the Northeastern Tip of the Bay of Bengal, Bangladesh. Sustainability 2021, 13, 1561. [Google Scholar]
- Kindong, R.; Gao, C.; Pandong, N.A.; Ma, Q.; Tian, S.; Wu, F.; Sarr, O. Stock Status Assessments of Five Small Pelagic Species in the Atlantic and Pacific Oceans Using the Length-Based Bayesian Estimation (LBB) Method. Front. Mar. Sci. 2020, 7, 953. [Google Scholar] [CrossRef]
- Liang, C.; Xian, W.; Liu, S.; Pauly, D. Assessments of 14 Exploited Fish and Invertebrate Stocks in Chinese Waters Using the LBB Method. Front. Mar. Sci. 2020, 7, 314. [Google Scholar] [CrossRef]
- Wang, Y.; Wang, Y.; Liu, S.; Liang, C.; Zhang, H.; Xian, W. Stock Assessment Using LBB Method for Eight Fish Species from the Bohai and Yellow Seas. Front. Mar. Sci. 2020, 7, 164. [Google Scholar] [CrossRef]
- Zhai, L.; Li, Z.; Hu, Y.; Huang, C.; Tian, S.; Wan, R.; Pauly, D. Assessment of Coilia mystus and C. nasus in the Yangtze River Estuary, China, using a length-based approach. Fishes 2022, 7, 95. [Google Scholar] [CrossRef]
- Mi, X.F. Mangrove Restoration by Water Quality Improvement: A Case of Dongzhaigang Bay. Master’s Thesis, Xiamen University, Hainan, China, 2016; p. 75. [Google Scholar]
- Jiang, C.P.; Wang, W.Q.; Wang, M.; Pauly, D. Length-weight relationships and other morphological traits of fishes in the mangrove of Hainan, China. Fishes 2022. Under review. [Google Scholar]
- Beyer, J.E. On length-weight relationships, Part I: Computing the mean weight of the fish in a given length class. Fishbyte Newsl. Netw. Trop. Fish. Sci. 1987, 5, 11–13. [Google Scholar]
- Bertalanffy, L. von. A quantitative theory of organic growth (inquiries on growth laws. II). Hum. Biol. 1938, 10, 181–213. [Google Scholar]
- Beverton, R.J.H.; Holt, S.J. On the Dynamics of Exploited Fish Populations; Springer: Berlin/Heidelberg, Germany, 1993. [Google Scholar] [CrossRef]
- Beverton, R.J.H.; Holt, S.J. Manual of Methods for Fish Stock Assessment, Part II. Tables of Yield Function; FAO Fisheries Technical Paper; FAO: Rome, Italy, 1966; Volume 38, p. 103. [Google Scholar]
- Zhang, Q.; Sheng, S.; Zhang, W. Age, growth and fecundity of the mudskipper Boleophthalmus pectinirostris. J. Fish China 1990, 14, 179–188. [Google Scholar]
- Rahangdale, S.; Chakraborty, S.K.; Jaiswar, A.K.; Shenoy, L.; Raje, S.G. Preliminary study on growth and mortality of Escualosa thoracata (Valenciennes, 1847) from Mumbai waters. Indian J. Geo-Mar. Sci. 2016, 45, 290–295. [Google Scholar]
- Hoq, M.E. An analysis of fisheries exploitation and management practices in Sundarbans mangrove ecosystem, Bangladesh. Ocean Coast. Manag. 2007, 50, 411–427. [Google Scholar] [CrossRef]
- Li, Z.; Shan, X.; Jin, X.; Dai, F. Long-term variations in body length and age at maturity of the small yellow croaker (Larimichthys polyactis Bleeker, 1877) in the Bohai Sea and the Yellow Sea, China. Fish. Res. 2011, 110, 67–74. [Google Scholar] [CrossRef]
- Lin, L.S.; Jiang, Y.Z.; Liu, Z.L.; Dou, S.Z.; Gao, T.X. Analysis of the distribution difference of small yellow croaker between the Southern Yellow Sea and the East China Sea. Period. Ocean Univ. China 2010, 40, 1–6, (In Chinese with English Abstract). [Google Scholar]
- Zhan, B.Y. Fisheries Stock Assessment; China Agriculture Press: Beijing, China, 1995; p. 353. (In Chinese) [Google Scholar]
- Shao, G.Z. The fish database of Taiwan [EB/OL]. 2021. Available online: http://fishdb.sinica.edu.tw (accessed on 30 June 2022).
- Wu, H.; Wang, H.; Ding, S. Reproductive biology and annual reproductive cycles of two sympatric line-ages of Bostrychus sinensis with a natural habitat on southeastern coast of China. Anim. Reprod. Sci. 2021, 232, 106821. [Google Scholar] [CrossRef] [PubMed]
- Pauly, D.; Wade-Pauly, S. An annotated bibliography of slipmouths (Pisces: Leiognathidae). ICLARM Bib-Liographies 1981, 2, 62. [Google Scholar]
- Nikolsky, G.V. The Ecology of Fishes; Academic Press: Cambridge, MA, USA, 1973; p. 532. [Google Scholar]
- Hastings, J.W. Light to hide by: Ventral luminescence to camouf1age the silhouette. Science 1971, 173, 116–117. [Google Scholar] [CrossRef]
- Pauly, D. The Leiognathidae (Teleostei): A hypothesis relating their mean depth occurrence to the intensity of their counter-shading bioluminescence. Mar. Res. Indones. 1977, 19, 137–146. [Google Scholar] [CrossRef]
Figure 1.
Map showing the distribution of mangroves around Dongzhaigang Bay in the northeast of Hainan Island (first insert) in the south of China (second insert).
Figure 1.
Map showing the distribution of mangroves around Dongzhaigang Bay in the northeast of Hainan Island (first insert) in the south of China (second insert).

Figure 2.
Size distribution of the catch of spotted green goby (Acentrogobius viridipunctatus) in 2009, 2014 and 2020. (A) Total catch effort per set of spotted green goby in three periods; (B) frequency of spotted green goby by length class; (C) total weight per set of spotted green goby in three periods; (D) weight of spotted green goby in different length class (corresponds to their frequency in (B)).

Figure 3.
Size distribution of the catch of bald glassy (Ambassis gymnocephalus) in 2009, 2014 and 2020. (A) Total catch effort per set of bald glassy in three periods; (B) frequency of bald glassy by length class; (C) total weight per set of bald in three periods; (D) weight of bald glassy in different length class (corresponds to their frequency in (B)).

Figure 4.
Size distribution of the catch of saddleback silver-biddy (Gerres lucidus) in 2009, 2014 and 2020. (A) Total catch effort per set of saddleback silver-biddy in three periods; (B) frequency of saddleback silver-biddy by length class; (C) total weight per set of saddleback silver-biddy in three periods; (D) weight of saddleback silver-biddy in different length class (corresponds to their frequency in (B)).

Figure 5.
Size distribution of the catch of shortnose ponyfish (Leiognathus brevirostris) in 2009, 2014 and 2020. (A) Total catch effort per set of shortnose ponyfish in three periods; (B) frequency of shortnose ponyfish by length class; (C) total weight per set of shortnose ponyfish in three periods; (D) mean weight of shortnose ponyfish in different length class (corresponds to their frequency in (B)).

Figure 6.
LBB estimates of fish species collected in 3 time periods: greenspot goby (Acentrogobius chlorostigmatoides); 2 time periods: four-eyed sleeper (Bostrychus sinensis); and 1 time period: tank goby (Glossogobius giuris) from the Dongzhaigang National Reserve, Hainan, China. The left panels show the length-frequency (L/F) data with the prior values (LC, Linf and Z/K); the right panels show the result of the LBB method with the estimates of Linf, Z/K and Lopt.


Table 1.
Summary of data collected in the Dongzhaigang National Reserve, Hainan, Province, China, during 2009, 2014 and 2020 and used to estimate priors for Linf from maximum length for LBB analyses. All lengths (standard length) are in centimeters; n = number of individuals. FishBase (see www.fishbase.org) was accessed on 2 May 2022.
| Species | n | Standard Length Range | Prior Linf | Reference (Year) | ||||
|---|---|---|---|---|---|---|---|---|
| 2009 | 2014 | 2020 | 2009 | 2014 | 2020 | |||
| Acentrogobius caninus | 1066 | - | 178 | 4.4–10.7 | - | 2.6–10.5 | 19.1 | [7] |
| Acentrogobius chlorostigmatoides | 190 | 261 | 103 | 5–11.1 | 4.1–9.8 | 5.0–10.1 | 11.1 | This study |
| Acentrogobius viridipunctatus | 2799 | 4361 | 1017 | 3.4–16.8 | 1.2–18.5 | 3.4–11.2 | 18.5 | This study |
| Ambassis gymnocephalus | 572 | 1212 | 934 | 2.5–7 | 2.1–10.2 | 1.7–8.3 | - | - |
| Boleophthalmus pectinirostris | - | 187 | 112 | - | 5.3–12.3 | 5.8–12.2 | 14.7 | [24] |
| Bostrychus sinensis | - | 313 | 138 | - | 4.5–17.5 | 6.9–18.0 | 23.2 | [7] |
| Brachirus orientalis | 122 | 182 | - | 3.3–14.4 | 3.4–14.1 | - | - | - |
| Escualosa thoracata | - | - | 374 | - | - | 3.4–9.2 | 11.9 | [25] |
| Gerres filamentosus | 216 | - | 139 | 4.2–11.5 | - | 2.5–13.8 | - | - |
| Gerres lucidus | 145 | 378 | 236 | 3–10.5 | 2.8–13.4 | 2.0–11.9 | 13.4 | This study |
| Glossogobius giuris | 412 | - | - | 4.8–20.1 | - | – | 22.4 | [7] |
| Glossogobius olivaceus | 312 | 576 | - | 4.7–16.6 | 2.3–18.2 | – | 18.2 | This study |
| Konosirus punctatus | - | 132 | - | - | 3.6–15.6 | – | 25.2 | [7] |
| Leiognathus brevirostris | 466 | 568 | 316 | 2.1–10.5 | 0.8–10 | 2.0–8.3 | 12 | [7] |
| Leiognathus equula | - | - | 139 | - | - | 2.5–7.7 | - | - |
| Liza carinata | 704 | 1713 | - | 3.91–18.3 | 2.2–16.8 | – | 20.4 | [7] |
| Liza subviridis | - | - | 498 | - | - | 3.2–21.1 | - | - |
| Mugil cephalus | 930 | 1624 | - | 4.2–21.5 | 2.7–16.1 | – | - | - |
| Oxyurichthys microlepis | 311 | 252 | - | 4.5–9.1 | 2.8–9.3 | – | 10 | [7] |
| Oxyurichthys ophthalmonemus | - | 141 | 407 | - | 4.8–10.5 | 3.9–11.3 | 13.9 | [7] |
| Sillago sihama | 346 | 689 | 356 | 5.6–13.7 | 2.6–13.5 | 3.6–12.9 | 23.5 | [7] |
| Takifugu niphobles | 192 | 766 | - | 4.7–14.4 | 2.3–11.1 | - | 14.4 | This study |
| Terapon jarbua | - | 110 | - | - | 2.7–10.3 | - | - | - |
| Thryssa mystax | - | 111 | - | - | 3.8–11.2 | - | - | - |
| Thryssa vitrirostris | 152 | - | - | 3.4–13.1 | - | - | 20.8 | [7] |
| Valamugil cunnesius | - | - | 510 | - | - | 3.6–14.3 | 16.9 | [7] |
Table 2.
Parameter estimates obtained by the LBB method applied to fish sampled in 2009, 2014 and 2020 in the mangrove of the Dongzhaigang National Reserve, Hainan, China. H: healthy stock; R: recovering stock; Out: stocks outside of safe biological limits; Over: overfished stock; D: severely depleted stock [17].
| Species | Linf | F/K | Lc/Lc_opt | B/B0 | Stock Status | ||||||||||
|---|---|---|---|---|---|---|---|---|---|---|---|---|---|---|---|
| 2009 | 2014 | 2020 | 2009 | 2014 | 2020 | 2009 | 2014 | 2020 | 2009 | 2014 | 2020 | 2009 | 2014 | 2020 | |
| A. caninus | 19.4 | - | 19.1 | 11.40 | - | 8.93 | 0.53 | - | 0.49 | 0.03 | - | 0.03 | D | - | D |
| A. chlorostigmatoides | 11.5 | 11.2 | 11.6 | 0.18 | 2.88 | 1.34 | 0.90 | 0.81 | 0.84 | 0.79 | 0.19 | 0.35 | H | D | Over |
| A. viridipunctatus | 17.3 | 17.8 | 18.0 | 4.95 | 5.68 | 6.55 | 0.57 | 0.49 | 0.50 | 0.06 | 0.04 | 0.04 | D | D | D |
| A. gymnocephalus | 6.8 | 11.9 | 8.1 | 3.01 | 15.60 | 9.97 | 1.10 | 0.52 | 0.66 | 0.26 | 0.01 | 0.03 | Out | D | D |
| B. pectinirostris | - | 14.6 | 14.4 | - | 1.90 | 1.25 | - | 0.92 | 1.10 | - | 0.29 | 0.43 | - | Over | Over |
| B. sinensis | - | 23.4 | 23.2 | - | 2.35 | 4.88 | - | 0.49 | 0.80 | - | 0.16 | 0.11 | - | Out | Out |
| B. orientalis | 14.1 | 17.3 | - | 0.29 | 3.34 | - | 0.51 | 0.55 | - | 0.71 | 0.11 | - | H | D | |
| E. thoracata | - | - | 11.8 | - | - | 5.81 | - | - | 0.78 | - | - | 0.11 | - | - | D |
| G. filamentosus | 12.0 | - | 14.1 | 2.70 | - | 0.15 | 0.95 | - | 0.23 | 0.23 | - | 0.78 | Over | - | H |
| G. lucidus | 13.4 | 13.2 | 13.3 | 6.87 | 7.75 | 6.38 | 0.55 | 0.50 | 0.30 | 0.05 | 0.03 | 0.03 | D | D | D |
| G. giuris | 22.2 | - | - | 7.38 | - | - | 0.43 | - | - | 0.03 | - | - | D | - | - |
| G. olivaceus | 18.5 | 18.0 | - | 3.41 | 5.68 | - | 0.59 | 0.50 | - | 0.12 | 0.05 | - | D | D | - |
| K. punctatus | - | 25.7 | - | - | 5.93 | - | - | 0.36 | - | - | 0.04 | - | - | D | - |
| L. brevirostris | 12.0 | 11.9 | 12.1 | 4.14 | 6.68 | 13.30 | 0.56 | 0.69 | 0.48 | 0.10 | 0.06 | 0.02 | D | D | D |
| L. equula | - | - | 9.3 | - | - | 0.99 | - | - | 0.24 | - | - | 0.38 | - | - | R |
| L. carinata | 20.7 | 20.2 | - | 3.80 | 3.50 | - | 0.44 | 0.45 | - | 0.07 | 0.09 | - | D | D | - |
| L. subviridis | - | - | 21.8 | - | - | 0.88 | - | - | 0.18 | - | - | 0.40 | - | - | R |
| M. cephalus | 22.8 | 16.8 | - | 7.58 | 0.09 | - | 0.55 | 0.62 | - | 0.04 | 0.92 | - | D | H | - |
| O. microlepis | 10.2 | 10.2 | - | 2.99 | 5.75 | - | 1.50 | 1.20 | - | 0.40 | 0.17 | - | Over | Out | - |
| O. ophthalmonemus | - | 14.0 | 13.4 | - | 4.50 | 2.40 | - | 1.00 | 0.92 | - | 0.18 | 0.21 | - | Out | Over |
| S. sihama | 23.3 | 23.0 | 23.1 | 13.30 | 15.20 | 6.94 | 0.53 | 0.51 | 0.39 | 0.02 | 0.01 | 0.03 | D | D | D |
| T. niphobles | 15.0 | 13.9 | - | 4.98 | 7.59 | - | 0.77 | 0.51 | - | 0.10 | 0.02 | - | D | D | - |
| T. jarbua | - | 10.5 | - | - | 0.74 | - | - | 0.96 | - | - | 0.57 | - | - | H | - |
| T. mystax | - | 13.4 | - | - | 12.40 | - | - | 1.20 | - | - | 0.12 | - | - | Out | - |
| T. vitrirostris | 21.1 | - | - | 9.67 | - | - | 0.44 | - | - | 0.02 | - | - | D | - | - |
| V. cunnesius | - | - | 17.2 | - | - | 6.94 | - | - | 0.90 | - | - | 0.09 | - | - | D |
Publisher’s Note: MDPI stays neutral with regard to jurisdictional claims in published maps and institutional affiliations. |
© 2022 by the authors. Licensee MDPI, Basel, Switzerland. This article is an open access article distributed under the terms and conditions of the Creative Commons Attribution (CC BY) license (https://creativecommons.org/licenses/by/4.0/).
Share and Cite
MDPI and ACS Style
Jiang, C.; Wang, W.; Yan, S.; Ding, Y.; Mi, X.; Wang, M.; Pauly, D. Assessment of Tropical Fish Stocks Using the LBB Method in Dongzhaigang Bay, Hainan Island, China. Sustainability 2022, 14, 9933. https://doi.org/10.3390/su14169933
AMA Style
Jiang C, Wang W, Yan S, Ding Y, Mi X, Wang M, Pauly D. Assessment of Tropical Fish Stocks Using the LBB Method in Dongzhaigang Bay, Hainan Island, China. Sustainability. 2022; 14(16):9933. https://doi.org/10.3390/su14169933
Chicago/Turabian StyleJiang, Chengpu, Wenqing Wang, Suzhen Yan, Yipeng Ding, Xuefang Mi, Mao Wang, and Daniel Pauly. 2022. "Assessment of Tropical Fish Stocks Using the LBB Method in Dongzhaigang Bay, Hainan Island, China" Sustainability 14, no. 16: 9933. https://doi.org/10.3390/su14169933
Note that from the first issue of 2016, this journal uses article numbers instead of page numbers. See further details here.