
A Systematic Analysis for Mapping Product-Oriented and Process-Oriented Zero-Defect Manufacturing (ZDM) in the Industry 4.0 Era


1
Department of Informatics, SIRIUS, University of Oslo, Gaustadalléen 23B, N-0373 Oslo, Norway 2 Department of Mechanical Engineering, University of North Florida, Jacksonville, FL 32224-7634, USA
2
Department of Mechanical Engineering, University of North Florida, Jacksonville, FL 32224-7634, USA
*
Author to whom correspondence should be addressed.
Sustainability 2023, 15(16), 12251; https://doi.org/10.3390/su151612251
Submission received: 4 July 2023
/
Revised: 28 July 2023
/
Accepted: 8 August 2023
/
Published: 10 August 2023
(This article belongs to the Special Issue The Complicated Relationship between Innovation and Sustainability: Opportunities, Threats, Challenges, and Trends)
Abstract
:Quality is a key aspect in the era of Industry 4.0. Zero-defect manufacturing (ZDM) as the latest quality assurance approach. It can be implemented in two different approaches: the product-oriented and the process-oriented ZDM. It is important to know how and when to consider adopting one approach over the other. To achieve that there is the need for analyzing the differences of the two ZDM approaches. However, the current literature lacks a detailed analysis and comparison of these two approaches to ZDM implementation. Earlier studies on the topic have adopted one of these approaches over the other without evaluating how it fits with specific cases. The literature of the last decade indicates a movement towards product-oriented approaches, but it has not shown proof why product oriented was used over process oriented. Guided by these gaps, this research work creates a model for quantifying the effects of the implementation of both the product-oriented and process-oriented ZDM approaches. The proposed model considers all the critical parameters that affect the problem and serves as an assisting tool to engineers during the design or re-configure manufacturing systems, for choosing the most efficient ZDM approach for their specific cases. The robustness of the model was analyzed using the design of experiments method. The results from both the designed experiments and an industrial use case illustrate that in most cases, product-oriented ZDM performs better than the process-oriented approach. Nevertheless, in our analysis, we also highlight strong interactions between some factors that make the selection between product-oriented and process-oriented ZDM difficult and complex.
1. Introduction
In the complex environment of manufacturing, many things can go wrong, leading to mistakes that result in defective products [1]. To become and remain competitive in the current and future business landscape, companies must follow the practices and philosophy of producing high-quality products with less waste [2,3,4,5]. Poor product quality can significantly affect the performance and efficiency of manufacturing companies [6]. There can be both direct and indirect costs caused by poor quality such as repair costs, transportation costs, product returns, and loss of sales due to customer dissatisfaction [7,8,9,10]. Defects in manufacturing can be caused by process variations due to machines, worn tooling, non-conforming material, and human mistakes, among other factors [11]. Except for human mistakes, these variations can be predicted by using Industry 4.0 technologies, methods, and tools to implement corrective actions to eliminate the root causes of the defects. The approach to achieving zero defects by using Industry 4.0 technologies is what constitutes zero-defect manufacturing (ZDM) [12,13]. In that regard, there are two different approaches for ZDM implementation: (i) product-oriented ZDM and (ii) process-oriented ZDM [12]. The literature of the last decade shows a movement towards product-oriented approaches, but without proof that they are superior to the process-oriented approaches [14,15,16,17,18,19,20].
ZDM is considered a viable alternative over traditional quality improvement methods [21]. A recent review article analyzed the critical success and failure factors of traditional quality improvement methods and at the same time depicted potential disadvantages of traditional improvement methods over ZDM [22]. Additionally, a direct comparison between traditional quality improvement methods with ZDM was performed by Psarommatis et al., revealing that ZDM can significantly increase the sustainability levels of manufacturing systems [13]. More specifically, ZDM has numerous advantages compared to the quality improvement methods that are being used currently by manufacturing companies, such as six sigma or lean that are not capable of coping with modern quality and market needs [23]. Traditional quality improvement methods are characterized as corrective approaches, meaning that there must first be a problem to address. Further, they do not take full advantage of Industry 4.0 technologies, and to an extent, they lack the notion of predicting events. Additionally, they do not learn well from the defects since they are specifically designed to simply remove the identified defects from production [13,22]. Most traditional techniques for quality improvement are used only at the process level [24,25], ZDM, however, can be used to both product and process levels [12].
Furthermore, it is important to underline the implications of ZDM on sustainability, a critical dimension in today’s manufacturing landscape. As we push the boundaries of efficiency and quality in manufacturing through practices like ZDM, we are concurrently addressing key aspects of sustainability [13]. By striving for zero defects, we minimize waste, make better use of resources, and reduce the energy expended on rework and corrections—all of which are in alignment with the principles of sustainable manufacturing. In addition, a successful ZDM implementation can result in products with extended life cycles, leading to reduced demand for new products and further conserving resources. Therefore, ZDM not only represents a technological advancement in manufacturing but also a stride towards more sustainable practices in the industry.
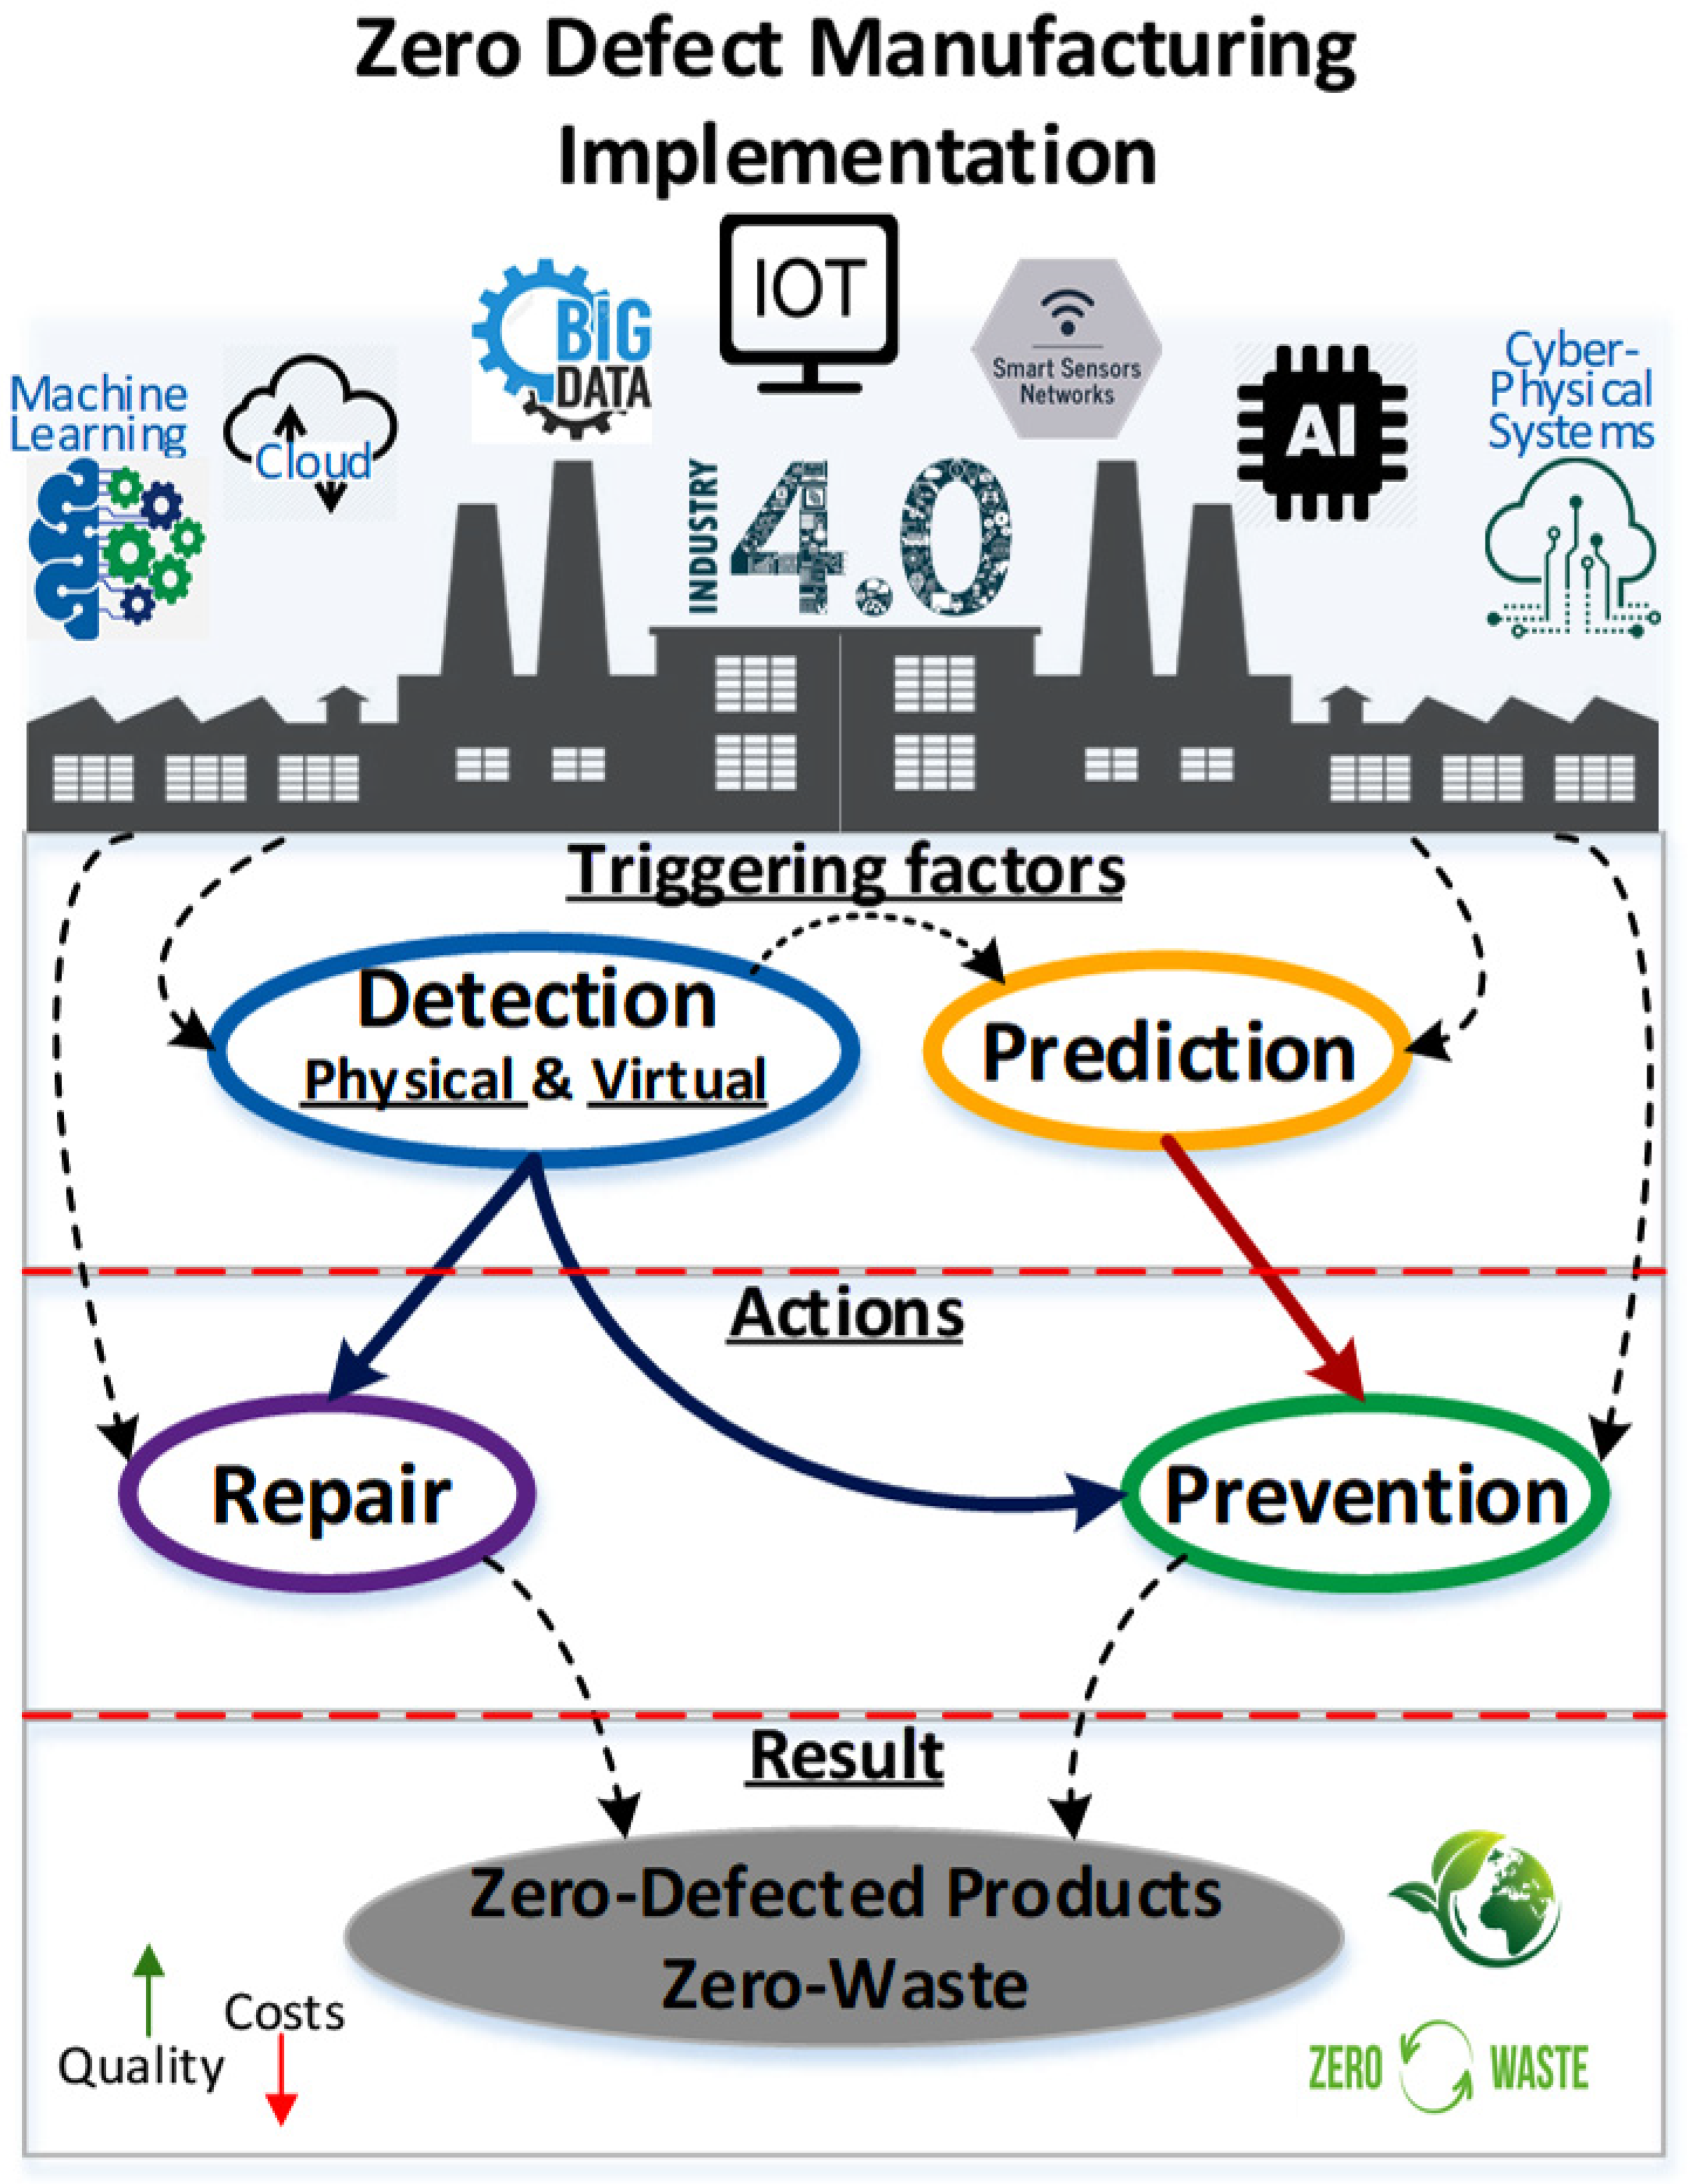
ZDM is an Industry 4.0 paradigm that goes beyond conventional quality management approaches by utilizing new technologies, methods, and tools in manufacturing environments. Contemporary ZDM is highly relevant to Industry 4.0 in the sense that the success of prediction algorithms and associated prevention mechanisms rely on modern technologies such as AI, IoT, and digital twins [26]. Furthermore, increased computing power, advancements in data analytics methods and tools, decreased cost of sensors, and more affordable storage opportunities provided by the Fourth Industrial Revolution foster ZDM capabilities and applications [13]. In that regard, Myklebust (2013) defines ZDM as having an extended lifecycle-oriented process focus and suggests an integrated view on the product and factory lifecycle models [14]. Wang (2013) illustrates the need for the development of smart and self-optimizing ZDM systems and provides a conceptual ZDM framework along with a data-driven approach toward achieving zero defects [27]. May and Kiritsis (2019) propose ZDM strategies and platforms for successful implementation in smart Industry 4.0 factories [12]. Further, Psarommatis et al. (2020) describe four strategies, namely detect, predict, repair, and prevent, for successful ZDM implementation [28]. Figure 1 highlights these implementation strategies and the interrelationships between them.
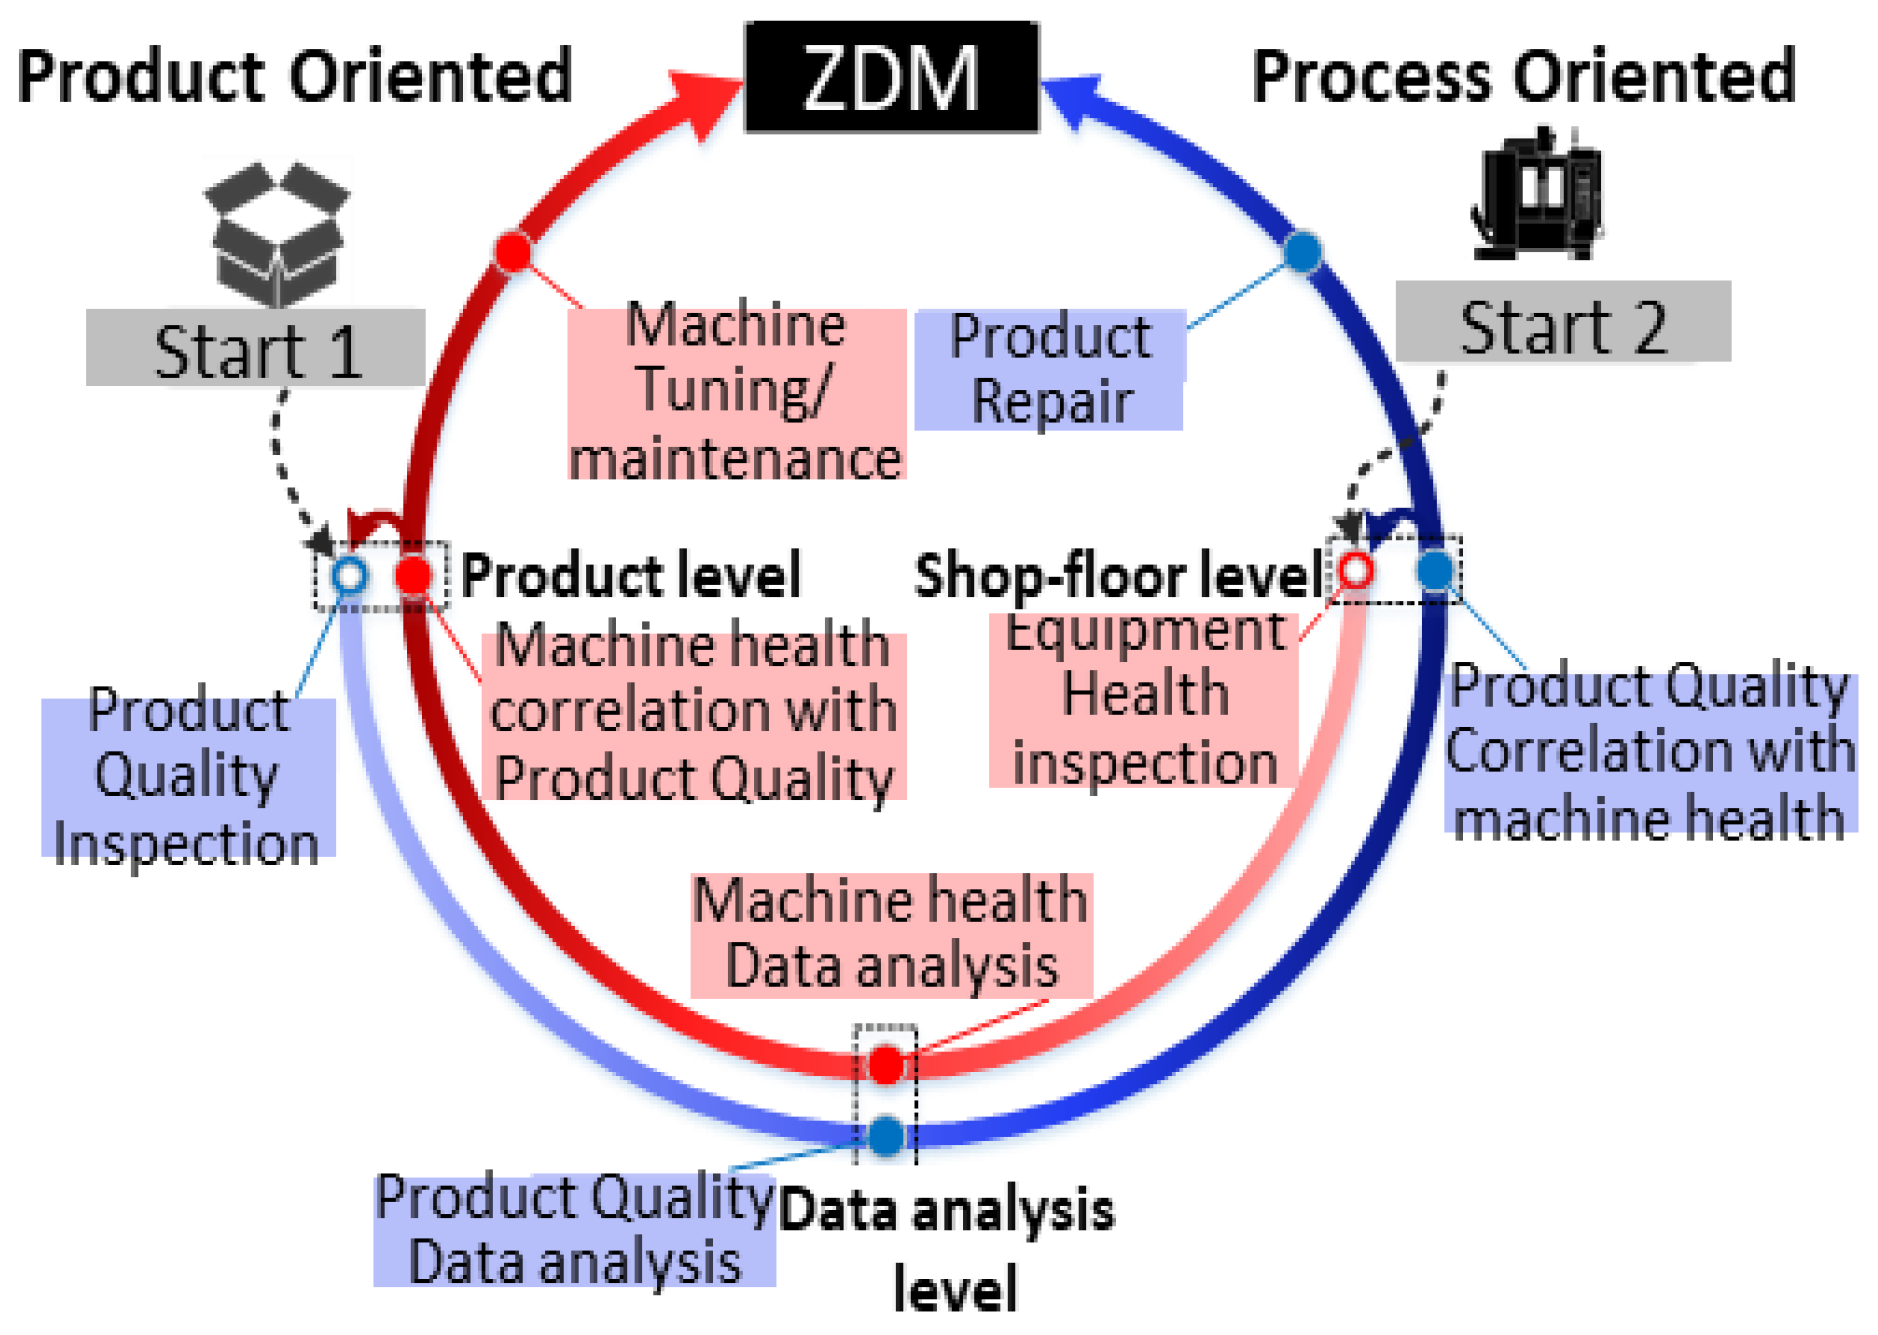
Figure 2 illustrates two different approaches to ZDM; the difference between these two is due to the beginning point of the ZDM implementation. Product-oriented ZDM begins with analyzing product quality, and if any anomalies are found, it proceeds with investigating the process. Process-oriented ZDM is initiated by analysis of a machine’s condition, and if anomalies are identified, the quality of the manufactured product is investigated. For instance, virtual metrology is a product-oriented ZDM approach since it focuses on analyzing product quality, and process quality is then derived from product quality.
While there are two different approaches to ZDM—product-oriented and process-oriented—the current literature often treats these methods as separate entities without a detailed comparative analysis [29]. Previous studies have underscored the importance of understanding the distinguishing aspects of these two ZDM approaches, but they stop short of providing a detailed model to guide their selection and application in diverse manufacturing settings [30]. The limitations in existing studies manifest in the form of a gap in comprehensive understanding and the lack of a decision-making tool for selecting the most suitable approach [31]. This research work aims to fill this gap by providing an analysis and comparison of these two ZDM approaches and developing a cost model to assist decision-making. The importance of addressing this gap lies in its potential to enhance efficiency, reduce waste, and improve overall productivity in manufacturing, as evidenced by numerous studies [32].
Given the complexity involved in Zero Defect Manufacturing (ZDM) and the existing gaps in literature, this study aims to develop a robust and comprehensive cost model. This model is intended to assist manufacturers in selecting the most effective ZDM approach, whether product- or process-oriented, considering the associated cost implications. We also aim to provide a tool for manufacturers to efficiently select appropriate equipment for the implementation of ZDM. Through the application of this model to real-world industrial scenarios, our goal is to offer practical insights and actionable guidance for ZDM implementation in the context of Industry 4.0.
2. State of the Art
2.1. ZDM Tools and Methods
There are a plethora of tools and methods available on the market today for product quality improvement, and a majority of these tools were evolved from traditional methods by adding the prediction approach and offering more effective prevention mechanisms.
Incorporating ZDM methodologies within the framework of Industry 4.0 introduces a wealth of opportunities [33,34]. As we venture further into the realm of digital manufacturing, we are witnessing the increasing relevance of sophisticated technologies such as artificial intelligence, machine learning, and the Internet of Things. These advancements serve to extend the potential of both product-oriented and process-oriented ZDM significantly. Consider the setting of a smart factory [28]. Here, the production process and the products themselves are sources of an immense volume of data [24]. Today’s technologies allow us to capture, analyze, and respond to this data in real time. This facilitates more precise and prompt identification and rectification of defects. The amalgamation of these technological capabilities does more than just refine ZDM strategies—it also aids in the achievement of core Industry 4.0 objectives, such as enhancing efficiency, improving quality, and enabling greater flexibility in manufacturing processes.
There have been many endeavors to address the issue of ZDM on the process level. On the research side, several scholars have focused on improving machinery for achieving zero-defect quality. For instance, Mourtzis et al. (2021) investigated how to optimize equipment design based on digital twins for ZDM and proposed a platform for utilizing data derived in manufacturing environments for that purpose [35]. To predict defects and increase yield, Galetto et al. (2020) provide a framework with three steps that can be applied in the early detection of equipment failure [36]. They do this by employing a semi-supervised learning model. Another topic representing this group of studies is predictive maintenance. Accordingly, Dreyfus and Kiritsis (2018) provide a paradigm for attaining ZDM through the joint application of a predictive maintenance strategy and scheduling algorithms that address uncertainty [37]. Aksa et al. (2021) designed and developed a predictive maintenance web platform and illustrated its application to fulfill ZDM objectives in smart factories [38].
Another group of researchers studied the synergies between ZDM and production planning. An early work on this key topic focuses on a flexible flow shop problem with the unexpected arrival of new jobs and proposes a reactive model that generates a stable reschedule against any possible occurrences of disruptions [39]. Another research work proposes a scheduling approach for flow-shop manufacturing systems in the case of unexpected events occurring as a result of the detection of defects during quality control [40]. Another good example of this cluster is the work conducted by Psarommatis and Kiritsis (2018) that provides a scheduling tool for achieving ZDM [41]. In a later work, Levitin et al. (2019) focuses their analysis on manufacturing systems with defects caused by external shocks that lead to delayed failure and create an optimum inspection schedule to increase the likelihood that the mission will succeed while maintaining the appropriate degree of failure avoidance probability [42]. Another research study illustrates the use of an improved heuristics algorithm for rescheduling in flexible job shop manufacturing systems to improve product quality [43]. Most recently, Ruiz et al. (2021) developed a smart digital twin based on a deep reinforcement learning model for scheduling job shop orders in a ZDM environment [44].
Toward the goal of achieving ZDM in Industry 4.0, there have been numerous studies on the manufacturing system level as well as many other research studies dealing with tools and methods for ZDM. An early work in this area by Vandebroek, Lan, and Knapen (2017) designed a diagnostic procedure for identifying the root causes of product defects in multi-component and multi-stage manufacturing systems [45]. Later, Vafeiadis et al. (2017) developed an autonomous and self-adjusted early-stage inference engine to support the implementation of zero-defect strategies in smart manufacturing environments [46]. Eger et al. (2018) illustrate a data-driven approach and provide a correlation analysis method for reaching ZDM [47], and Serrano et al. (2018) developed a digital twin to model and optimize supply chains in ZDM settings [48]. Caccamo et al. (2021) propose a hybrid Industry 4.0 architecture to deploy a data quality management system for ZDM [49]. In an effort to assist manufacturers in moving closer to ZDM in the dynamic nature of a manufacturing system, Psarommatis and Kiritsis (2021) have developed a hybrid decision support system that effectively detects flaws and automates the post-detection decision-making process [10].
2.2. Product-Oriented and Process-Oriented ZDM
Product-oriented and process-oriented ZDM are two approaches for achieving zero defects. An instance of product-oriented ZDM is virtual metrology, whereas predictive maintenance can be considered a process-based approach. The outcome of both approaches is to achieve ZDM, but the difference is whether the analysis begins with product or process data.
A process-oriented approach can indicate, through an intelligent prognosis system, anomalies of manufacturing equipment that can be addressed by maintenance services to improve product quality [14]. The analysis in the process-oriented ZDM approach thus begins on the process level to eventually improve product quality, and there have been several recent studies on this subject. For instance, Zhao et al. (2021) propose an integrated maintenance approach for risk-oriented optimization of product quality loss in multi-stage manufacturing systems [50]. Tao et al. (2018) give a health-management strategy and prognostics for complex machinery based on digital twins that also leads to improved product quality [51]. Stojanovic and Milenovic (2018) present a new data-driven approach based on self-aware digital twins for improving manufacturing processes and illustrate the results of its implementation in an industrial case study of the 3D laser-cutting process [52]. To increase the efficiency and effectiveness of end milling operations, Su et al. (2021) suggest an image-based neural network method for forecasting instantaneous cutting forces [53]. Additionally, Zhang et al. (2021) deal with the problem of reliability evaluation in high-quality new product development with limited data resulting from few or no failures or the absence of failure time information [54]. In order to achieve the requisite production quality and a stable manufacturing process, Guo et al. (2021) present a digital twin model for real-time prediction of remaining usable life and preventative maintenance [55].
As opposed to the process-oriented approach, analysis in the product-oriented ZDM approach begins on the product level. For instance, Al-Kharaz et al. (2019) created a multi-layer perceptron feed-forward artificial neural network for semi-conductor manufacturing processes to anticipate and enhance product quality [56]. In a tubing extrusion process, Garcia et al. (2018) suggest models that accurately forecast product quality [57]. In order to increase the predictability and management of online quality control of essential parts used in marine diesel engines during the machining process, Cheng et al. (2020) offer a digital twin-driven solution [58]. Detzner and Eigner (2018) provide a data structure to enable data-driven analytics and decision assistance and emphasize the essential components of a digital twin for monitoring and root cause analysis of product quality monitoring [59]. Finally, Baturynska and Martinsen (2021) focus on predicting geometry deviations of additive manufactured products [60].
2.3. The Research Gap
While numerous studies employ data from both product and process levels to enhance product quality in manufacturing [34], it remains unclear whether one approach—product-oriented or process-oriented—offers a superior pathway to achieving ZDM. Current literature does not explicitly state a preferred method or provide guidelines on when to apply one strategy over the other [61,62]. This lack of comparison or choice guidance can create confusion, potentially leading to less efficient or ineffective implementations of ZDM strategies.
The choice between these approaches is not trivial, as it directly affects the efficiency and efficacy of defect management. The process-oriented approach, focusing on predictive maintenance and improvement of the production process, might be more suitable for certain scenarios, such as in complex machinery operations or systems with high equipment fault risks. On the other hand, a product-oriented approach, concentrating on the product’s quality attributes, could be better aligned with manufacturing systems where the product’s intricate characteristics and specifications are of paramount importance. Consequently, implementing an unsuitable approach could result in an inefficient use of resources and sub-optimal product quality, underscoring the importance of a thoughtful decision between these methodologies.
Despite the evident importance of this strategic decision, a comprehensive comparison and guidelines for the selection between the two approaches are conspicuously absent in existing literature. Most studies implicitly favor one approach over the other based on their research focus, without providing a robust justification for their choice or considering the potential benefits of the alternative approach. Therefore, the gap in the literature that this study aims to fill is a comprehensive analysis and comparison of the two ZDM approaches. By providing clear criteria and a decision-making framework, we hope to help manufacturers and researchers select the most suitable approach for their specific contexts, thus enhancing the effectiveness of their ZDM strategies.
3. Modelling Procedure and Analysis Methods
To guarantee that the manufactured goods meet accepted standards for quality, manufacturers implement improvement methods to control and assure the quality of their products. As stated in the introduction and the State of the Art chapter, the latest approach for quality improvement is ZDM [12,13], and it can be implemented in both product- and process-oriented approaches [63]. The proposed methodology is designed to be generic and use-case independent, meaning that it can be applied to any manufacturing case [18]. Therefore, no specific manufacturing operations or products are considered, and the identified parameters (presented in Table 1) are as generic as possible so that the proposed model can be utilized in several different applications that are characterized by the same parameters. The outcome of this methodology is a tool that can assist manufacturers in the decision-making process when selecting between product or process ZDM approaches. This assistance consists of comparing the different solutions for ZDM implementation and, based on the suggested cost function, selecting the most efficient approach [64]. In Section 4, the proposed product- and process-oriented models are analyzed in detail, and the effect of each model parameter is quantified using design of experiments (DoE) based on the Taguchi approach [65]. The analysis-of-means (ANOM) diagrams of the main effect and some interactions are calculated alongside the ANOVA analysis. This analysis is intended to identify the most impactful parameters and study the behavior of each model as well as to examine the robustness of the model.
3.1. Product- and Process-Oriented ZDM Formulation
To model and quantify the two ZDM approaches, the key parameters that characterize these implementations must first be identified. The aim of this study is not to create a detailed model including all the aspects that characterize these approaches but to identify those parameters that are different and skip most of the parameters that are the same [63]. Adopting this approach ensures that the model is simple enough but at the same time has all the key information for comparing the two ZDM approaches. The goal of the proposed models is to compare and analyze the two approaches using the DoE method (Section 3.2), and manufactures can use this formulation for supporting the design process of their quality improvement systems. In total, we identified 10 characteristics that impact how effective the two ZDM strategies are. These parameters are presented in Table 1. Some of the defined parameters are taken from a previous study, and in the current study, some additional parameters are defined in order to enrich the model in the literature [63].

Table 1.
Identified problem parameters.
| Parameter Name | Notation | Parameter Description |
|---|---|---|
| Life volume | LV | Expected production volume of a specific product |
| Unit cost | UC | Nominal manufacturing cost of one unit of product |
| Defect rate | DR | Percentage indicating the anticipated number of problems |
| Profit | PRF | Percentage showing the manufacturer’s targeted profit margin in relation to the cost of production for the good |
| Poor quality ratio | PQLR | Percentage that contrasts the overall revenues with the potential losses brought on by poor quality. Freight charges, chargebacks, product returns, and sales losses are all included in this element. |
| Inspection cost | PIC | Percentage illustrating the cost of inspection per unit of product compared to the unit cost. This cost includes both the investment cost for acquiring the equipment and the costs for operating the equipment. |
| Machine data Analysis cost | MDAC | A percentage illustrating the cost of data analysis for each unit of a product in relation to the unit cost. This cost includes both the investment cost for acquiring the equipment and the costs for operating the equipment. |
| Machine data correlation accuracy | MDA | Percentage illustrating the likelihood of the system’s ability to accurately link machine data to product defects. |
| Mitigation action cost | MAC | Percentage showing how much it costs on average, relative to the unit cost, to implement mitigation actions in order to prevent future defects (small maintenance, machine parameters tuning, tool replacement, etc.) |
| Mitigation action effectiveness | MAE | Percentage showing the effectiveness of the mitigation action. |
| Inspection accuracy | IA | Percentage indicating the likelihood that a product flaw will be correctly identified by the inspection tools. |
| Rework cost | RC | Percentage that compares the unit cost to the cost of reworking a component. This cost includes both the investment cost for acquiring the equipment and the costs for operating the equipment. |
| Rework effectiveness | REF | Percentage showing the effectiveness of the rework procedure. This percentage demonstrates how many parts are finally successfully reworked. |
There are two different categories of parameters identified for the current modeling procedure: the business-oriented parameters and the ZDM approach-specific parameters, which are derived directly from conceptual differences between the two approaches. As highlighted in Figure 2, in product-oriented ZDM, the entire process starts with product inspection, and if there is a quality issue, the process parameters are analyzed to mitigate the abnormality. The process-oriented ZDM procedure is the exact opposite: the process characteristics are analyzed, and if an abnormality is identified, the quality of the product is inspected. The model presented in the current section is a cost model, meaning that all the factors are translated into monetary values in order to derive the final cost required for the corresponding ZDM approach to be implemented [49,66,67,68,69,70,71].
The business-oriented parameters are the same for both ZDM approaches, but they are selected because of their criticality for calculating the performance of each ZDM approach, and depending on their values, the results change. These parameters are the life volume (LV) of the product under investigation and the nominal product cost per unit (UC). The reason why manufacturers adopt quality improvement techniques is because their systems have a specific failure rate (DR) that needs to be decreased. Defect rates are directly correlated with the losses brought on by poor quality (PQLR). The matching profit margin that manufacturers set for their goods is also connected to the PQLR (PRF).
Since all goods are inspected in product-oriented (PRD) ZDM, the cost of inspection as well as the precision of the related inspection equipment are crucial considerations [18]. According to the inspection process accuracy, it is possible that some problems will go undetected. Defects must also be repaired to meet requirements, reduce waste, and maintain sustainability at levels that are acceptable. When a defect is found, the process data are examined to determine what caused it and how to fix it. Costs associated with the analysis of the process data must be taken into account (MDAC).
However, process-oriented (PRS) ZDM, as shown in Figure 2, examines all of the production data for all of the products, which results in a machine data analytics expense (MDAC). Inspection of the associated parts is carried out if anomalies in the process data are found. If a defect is discovered during the inspection, it needs to be repaired. The PQLR is present in the process-oriented approach as well, similar to the product-oriented approach.
Table 1 presents all the defined parameters that are affecting the current problem. To make the solution as generic as possible we have used the relative values over the absolute values, meaning the all the costs and times have been divided by the corresponding nominal values of the product. Life volume and unit cost have their absolute values. More specifically, the cost-oriented values are based on the unit cost, which is set to 1. The effectiveness of each strategy is determined using Equations (1)–(8). Equation (8) provides the performance of each technique in more detail and only includes the terms that differ in each situation and all the terms that are present in each case; maintenance is not taken into consideration. The result of Equation (8) is expressed as a monetary value and shows the cost that each strategy adds to the total cost of manufacturing. Therefore, the strategy with the smallest additional cost is the one that performs the best.
3.2. Design of Experiments
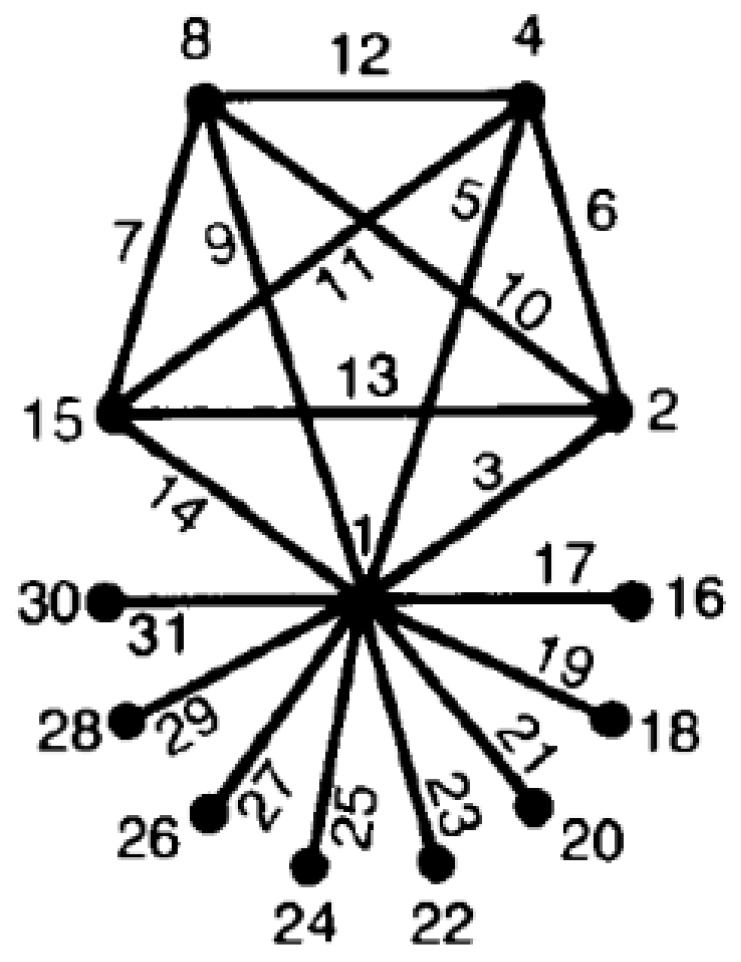
The role of the DoE is to analyze the behavior of the developed cost models. The goal is to identify how each parameter affects the final ZDM implementation cost and determine whether there are interactions between different factors. These are illustrated using the analysis of means (ANOM) diagrams. Although the parameters’ main effects are important, they often have strong interactions that sometimes affect the solution more than the main effects. Moving forward, the analysis of variance (ANOVA) addresses the question of how much each factor’s main effects and interactions affects the developed model. The ANOVA analysis provides valuable insights regarding the factors and interactions that manufacturers can use in choosing the right ZDM equipment. There are many DoE methodologies available in the literature; in the current research, we use the Taguchi approach [65]. This specific approach was selected because it offers a structured way of experimenting with the ability to study the interactions of the problem parameters with the minimum number of experiments. Based on the factors defined in Table 1, there are 13 degrees of freedom in the main factors and another 18 degrees of freedom in the interactions studied. Therefore, the current problem has 31 degrees of freedom, and the best-suited orthogonal array is L32. The selected orthogonal array can host two-level factors, and the interactions are given by the selected linear graph illustrated in Figure 3.
The level factors presented in Table 2 are selected as generic extreme low and high values that describe the majority of cases in the manufacturing domain. To collect and assess the whole range of the suggested cost model behavior, the extreme low and high values are chosen. Every cost value is relevant to the unit cost, which means that it represents a proportion of the cost of the product under inquiry divided by the cost of each procedure.
4. Product and Process ZDM Model Analysis Results
In the previous section, we developed a cost model to quantify two ZDM approaches. In this section, we scrutinize this cost model via the Design of Experiments (DoE) methodology discussed in Section 3.2. We break down this analysis into subsections as follows:
In Section 4.1, we focus on the DoE analysis of the cost model. The experimental design, as detailed in Section 3.1, dictates the execution of necessary experiments corresponding to our selected orthogonal arrays. We leverage the outcomes of these experiments to compute ANOM diagrams for main effects and interactions. Furthermore, these outcomes allow us to calculate the ANOVA tables, which grant us deeper insights into the intricate workings of the cost model.
Moving forward to Section 4.2, we put our developed methodology to test in a real-world application, within the context of the semiconductor industry. The objective here is to showcase the practical implications and efficiency of the proposed methodology, thereby demonstrating its relevance and applicability.
4.1. Cost Model DoE Analysis
Section 4.1: DoE Analysis of the Cost Model utilizes the experimental design detailed in Section 3.1. The necessary experiments for our chosen orthogonal arrays are conducted. The outcomes of these experiments are then used to compute ANOM diagrams for main effects and interactions. Additionally, these outcomes are used to calculate the ANOVA tables, enabling us to derive deeper insights into the cost model. The initial findings from the DoE analysis reveal some intriguing patterns and trends in our cost model. Notably, certain interactions and main effects have a more pronounced impact on the total cost than initially anticipated. These effects and interactions appear to be highly sensitive to various ZDM parameters, illustrating the complexity of ZDM approaches and the need for careful optimization in practical applications.
To fully understand these implications, we revisited our study’s initial focus, which highlighted the need for an effective cost model for ZDM approaches. We identified a gap in the existing literature: a comprehensive understanding of these interactions and main effects within the cost model was noticeably lacking. This observation underscored the necessity for an in-depth analysis using the DoE methodology to better comprehend the intricate interplay within the cost model.
Upon reflection, our focus on addressing this literature gap seems even more critical. Through rigorous analysis, we discovered that these interactions significantly affect the accuracy and effectiveness of the cost model. Without considering them, any cost model may lead to inaccurate estimates and potentially detrimental business decisions.
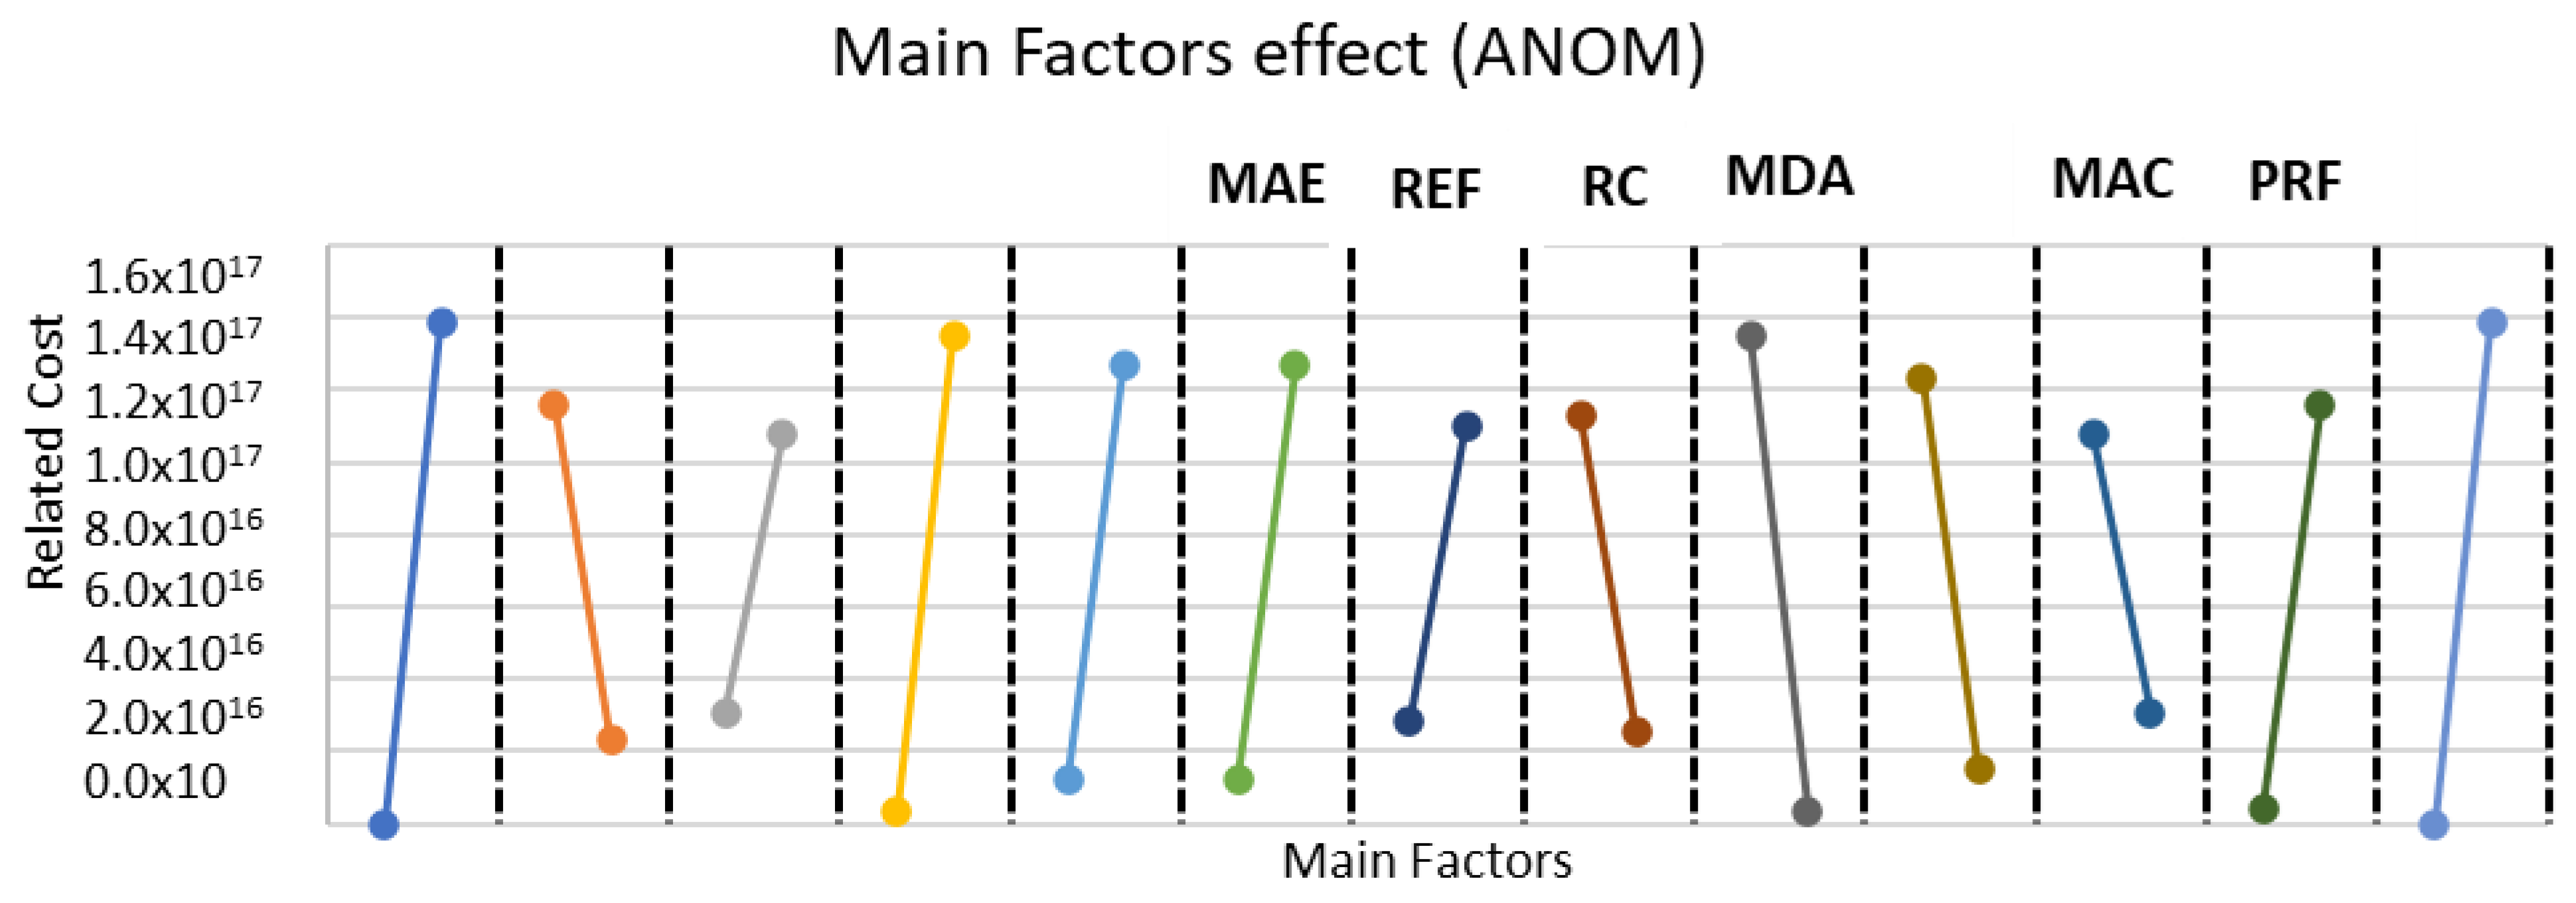
The ANOM diagrams for the factors’ main effects are illustrated in Figure 4. They depict how the corresponding factor value affects the implementation cost of either of the ZDM approaches compared to the parameters’ level (x-axis). Regarding the main effects, both approaches responded almost equally to the change in the different parameters. Therefore, for the reader’s convenience, only one set of results is presented because the difference is on average lower than 1%. There are two behaviors observed as the factors’ main effects: as the level increases from level 1 to level 2, the cost increases, while others decrease. The number of factors that increase the ZDM implementation cost as the factor levels increases are 8/13, which are UC, PQRL, DR, MAE, REF, PRF, and LV. The remaining 5/13 factors reduce the related cost as they shift from level 1 to level 2. More specifically, the ANOM results illustrate the potential of change to the final cost. The higher the increase from level 1 to level 2, the higher the influence of this factor to the related cost. Those results can be used by the manufacturers in order to evaluate alternative design and have a quick and accurate method for the estimation of the influence of each parameter.
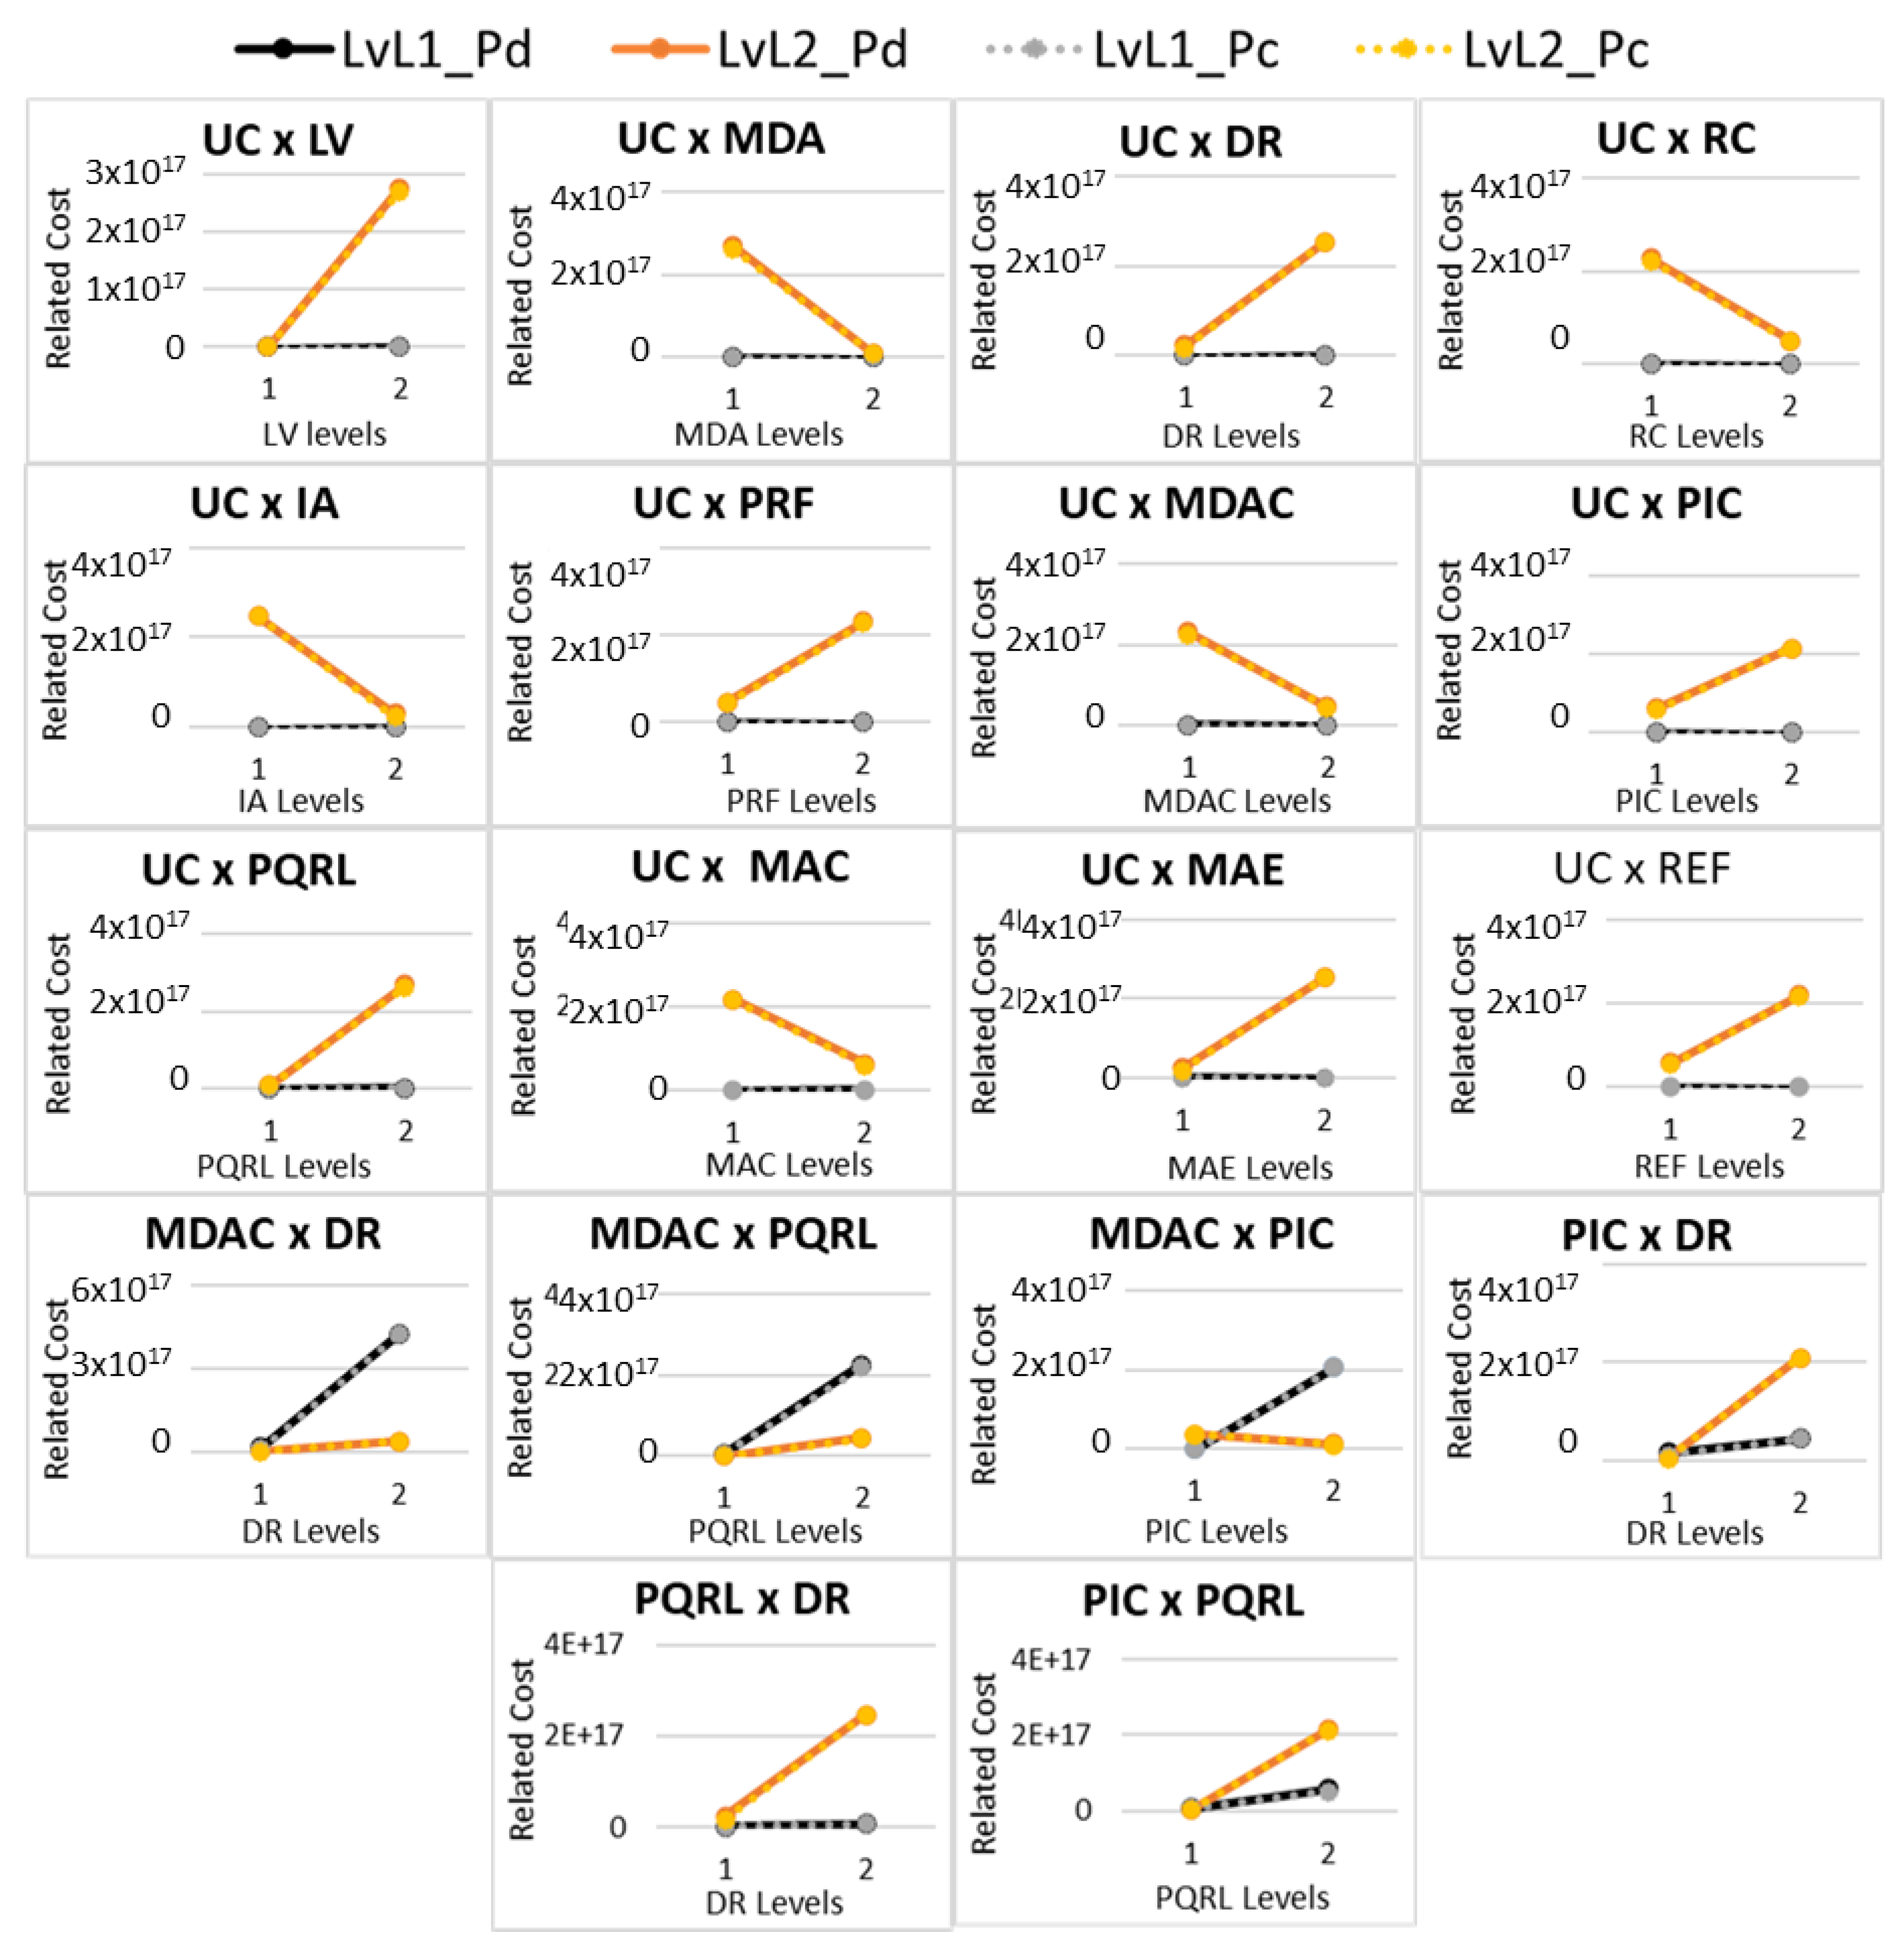
The ANOM results present the main effect of each factor on the final cost, but it is not enough for understanding completely the influence of those factors. The different factors also have some interactions between each other. To study the interactions, an L32 orthogonal array was used, and the interactions were planned according to the selected linear graph presented in Figure 3. In total, 18 interactions were studied and are presented in Figure 5. In each of these graphs, there are two solid lines that represent the product-oriented approach (Pd) and two dashed lines that represent the process-oriented approach (Pc). The two lines of each approach represent the two levels of the first factor in the title of the corresponding diagram. A result similar to the factors’ main effects is that both ZDM approaches showed almost identical behavior, validating the robustness of the proposed model. The interaction diagrams reveal that there are strong interactions between the factors. This means that when a factor changes from level 1 to level 2 then another factor that has interaction with this factor instead of increasing from level 1 to level 2 is decreasing or the slope of increase is increased. This can be understood by the fact that the two lines of each approach are not parallel. They either converge or diverge, and in some cases, they cross each other, illustrating reversal behavior and meaning that when one factor goes from level 1 to level 2, the influence of the other factor changes direction; such behavior is called anti-synergetic. All the interactions that examined the UC demonstrated two common behaviors: for unit cost level 1 in both product-oriented and process-oriented approaches, there are no interactions with the related factors, and the related cost is almost 0. When the unit cost changes from level 1 to level 2, there are some strong interactions. More specifically, two different behaviors can be observed in the unit cost interaction diagrams: one is observed in the diagrams with LV, DR, PRF, PIC, PQRL, MAE, and REF. These diagrams demonstrate increasing behavior once the unit cost changes from level 1 to level 2. The exact opposite behavior is observed for the MDA, RC, IA, MDAC, and MAC, which demonstrates a decreasing behavior when UC changes from level 1 to level 2.
The interactions of MDAC with DR, PQRL, and PIC present unique behavior compared to the rest of the interactions studied. When MDAC is at level 1, the related cost is higher compared to the related cost when MDAC is at level 2. This result also aligns with the effect of MDAC presented in Figure 4. An important observation is that the interaction of MDAC × PIX is the only anti-synergetic one. This means that once the MDAC changes from level 1 to level 2, the direction of influence of PIC levels changes. The interactions PIC × DR and PQRL × DR show similar increasing behavior as the corresponding UC diagrams. PIC × PQRL is the set with the smallest interaction compared to the rest of the studied interactions.
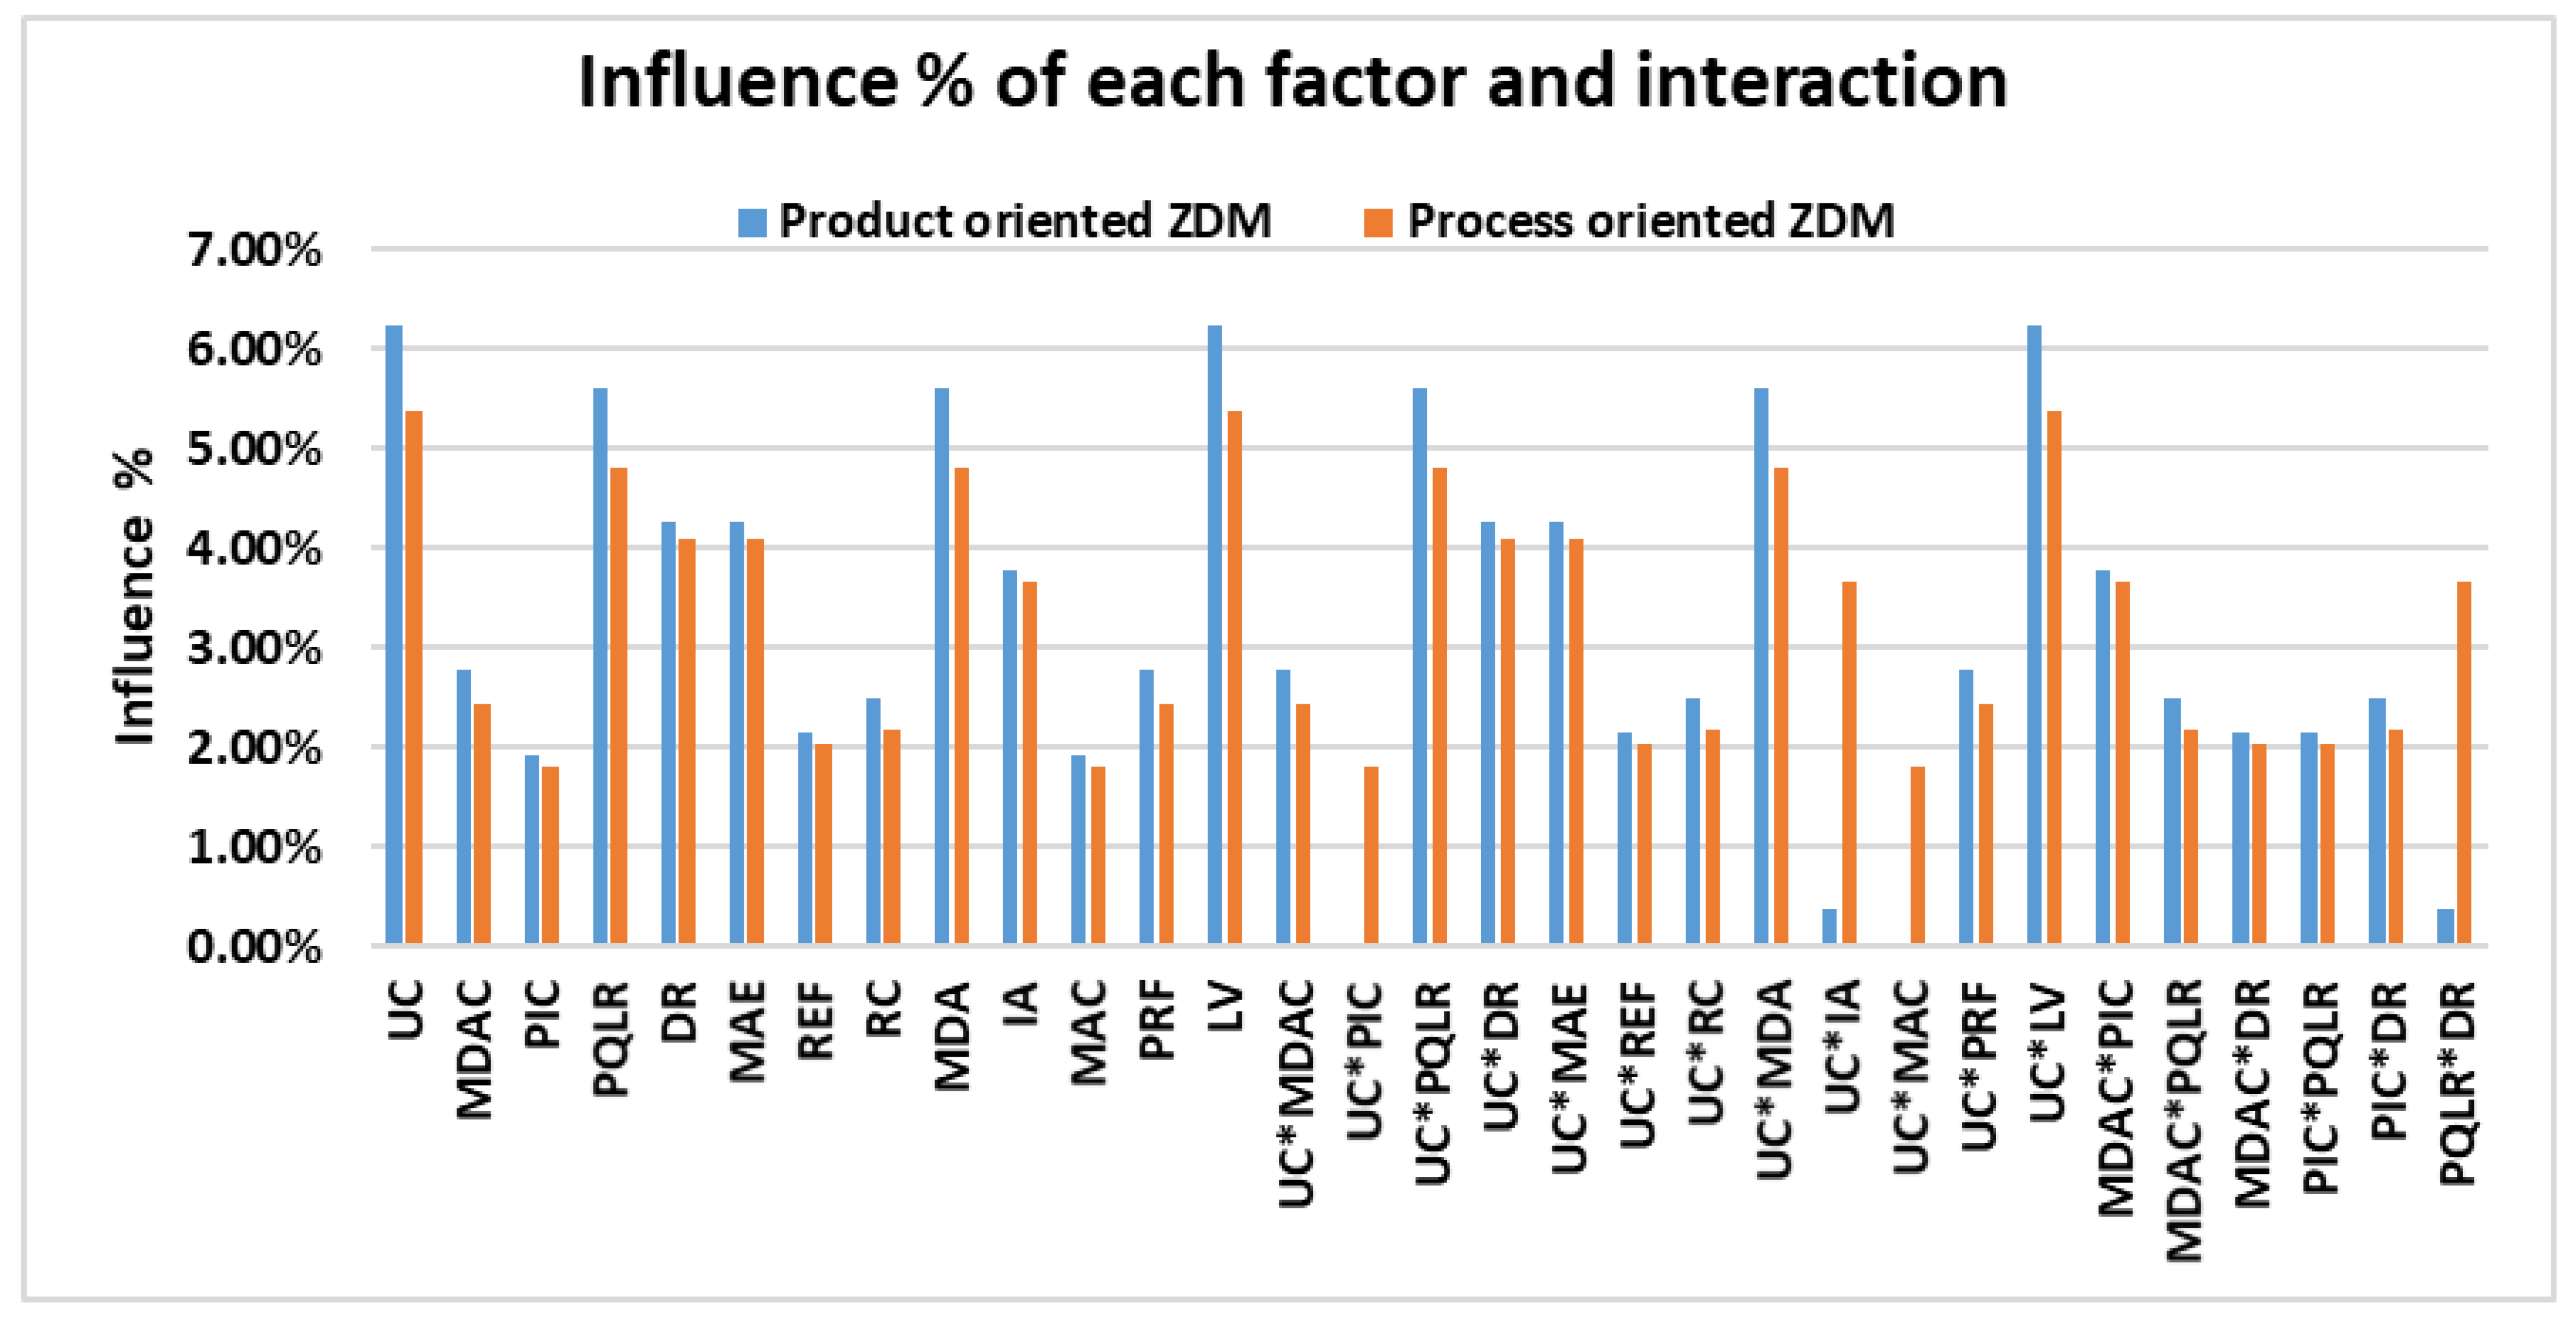
The ANOM diagrams for both the main effects and the interactions only illustrate in which direction each factor level affects the final ZDM implementation cost. In order to determine which variables are most important and how much each variable or interaction affects the final ZDM cost, the ANOVA analysis is imperative. Figure 6 illustrates the results from the ANOVA analysis for both ZDM approaches. In general, both approaches are influenced equally by the factors and interactions, but there are a few exceptions in which product-oriented ZDM is slightly more influenced and some cases in which product-oriented ZDM is not influenced at all by some interactions. More specifically, UC, PQRL, MDA, LV, UC × PQRL, UC × MDA, and UC × LV had more influence, on average 15.2%, on the final ZDM implementation cost with product-oriented ZDM compared to the corresponding influence of those factors on process-oriented ZDM. Product-oriented ZDM is not affected at all by UC × PIC or UC × MAC, whereas in UC × IA and PQE, there is less than 1% influence on the related cost in product-oriented ZDM, while the corresponding value of process ZDM is 3.65%.
4.2. Industrial Application
To illustrate the viability of the suggested cost model, we analyzed a real industrial case from the semi-conductor domain. The industrial application concerns the manufacturing of an electronics board to be used in medical devices. The nominal cost of the product under investigation is rather high, €2440. The production line that manufactures this product is composed of 12 manufacturing and assembly stations (WSx). One of them, WS4, currently has a 6.8% defect rate, which can be translated into a huge amount of waste and loss, whereas the others have <1.2%. Therefore, in WS4, it is critical to apply ZDM in order to reduce the defect rate, but this raises the following questions:
- Which type of ZDM is better for this specific case, product-oriented or process-oriented?
- Which is the most suitable equipment combination considering the available options?
- What is the estimated cost for operating the selected ZDM implementation?
Before delving into the results, we should understand the nature of the semi-conductor manufacturing process in this case study. The production line comprises multiple stations, each with a specific role in the production of the medical electronics board. WS4, a critical manufacturing station with a high defect rate, is the primary focus of our analysis. At this station, intricate processes occur which necessitate the precise combination of materials, temperature, and timing to prevent defects. When errors do occur, they result in significant waste and financial loss given the high product cost.
Our analysis is grounded in careful consideration of the complexities at WS4. We investigate the potential of both product and process-oriented ZDM strategies to tackle this issue. In the semiconductor industry, where precision and accuracy are paramount, it is important to ascertain not only the right ZDM approach but also the optimal equipment combinations.
The case company was contacted by different third parties for technological solutions to the current problem. There are four different equipment needs for physically inspecting the part: (a) a computer-based process data analysis with the use of (b) external hardware such as sensors, (c) the procedures and equipment for the rework of a defected part, and (d) the procedures and software for the mitigation of the performance issues of the machinery. For each of these four categories, the technology suppliers offered three options with different performance characteristics. Table 3 presents the three options for each of the pieces of equipment that technology suppliers offered for the current industrial application, with the corresponding specifications according to the parameters defined in Table 1. Each option has two parameters related to it, and they are linked to each other. These are the parameters for which the values depend on equipment selection. Table 4 presents the purchase costs provided by the suppliers for each of these technologies.
The business-oriented parameters have fixed values taken from the actual production data of the industrial use case. More specifically, LV = 10,000, UC = €2440, DR = 6.8%, PRF = 86%, and PQLR = 20.1%. In total, there are 81 alternative equipment combinations because there are four technologies with three options each. These 81 alternative sets were fed into the corresponding cost model, and the related ZDM implementation cost was calculated for both the product and process ZDM approach.
Now, to interpret the data, it is crucial to understand the real-world implications. The options provided for each technology are not merely alternatives but represent varying levels of investment in precision, speed, and overall efficiency of the ZDM process. For instance, the options for inspection technology (Category A) imply a trade-off between initial investment cost and inspection accuracy. A similar trade-off is present in data analysis, rework cost, and mitigation action cost.
Our study was designed to find the most cost-effective combinations of these technologies that could achieve a substantial reduction in the defect rate at WS4. The results shed light on the economic feasibility of different ZDM approaches and provide a concrete decision-making tool for the manufacturer.
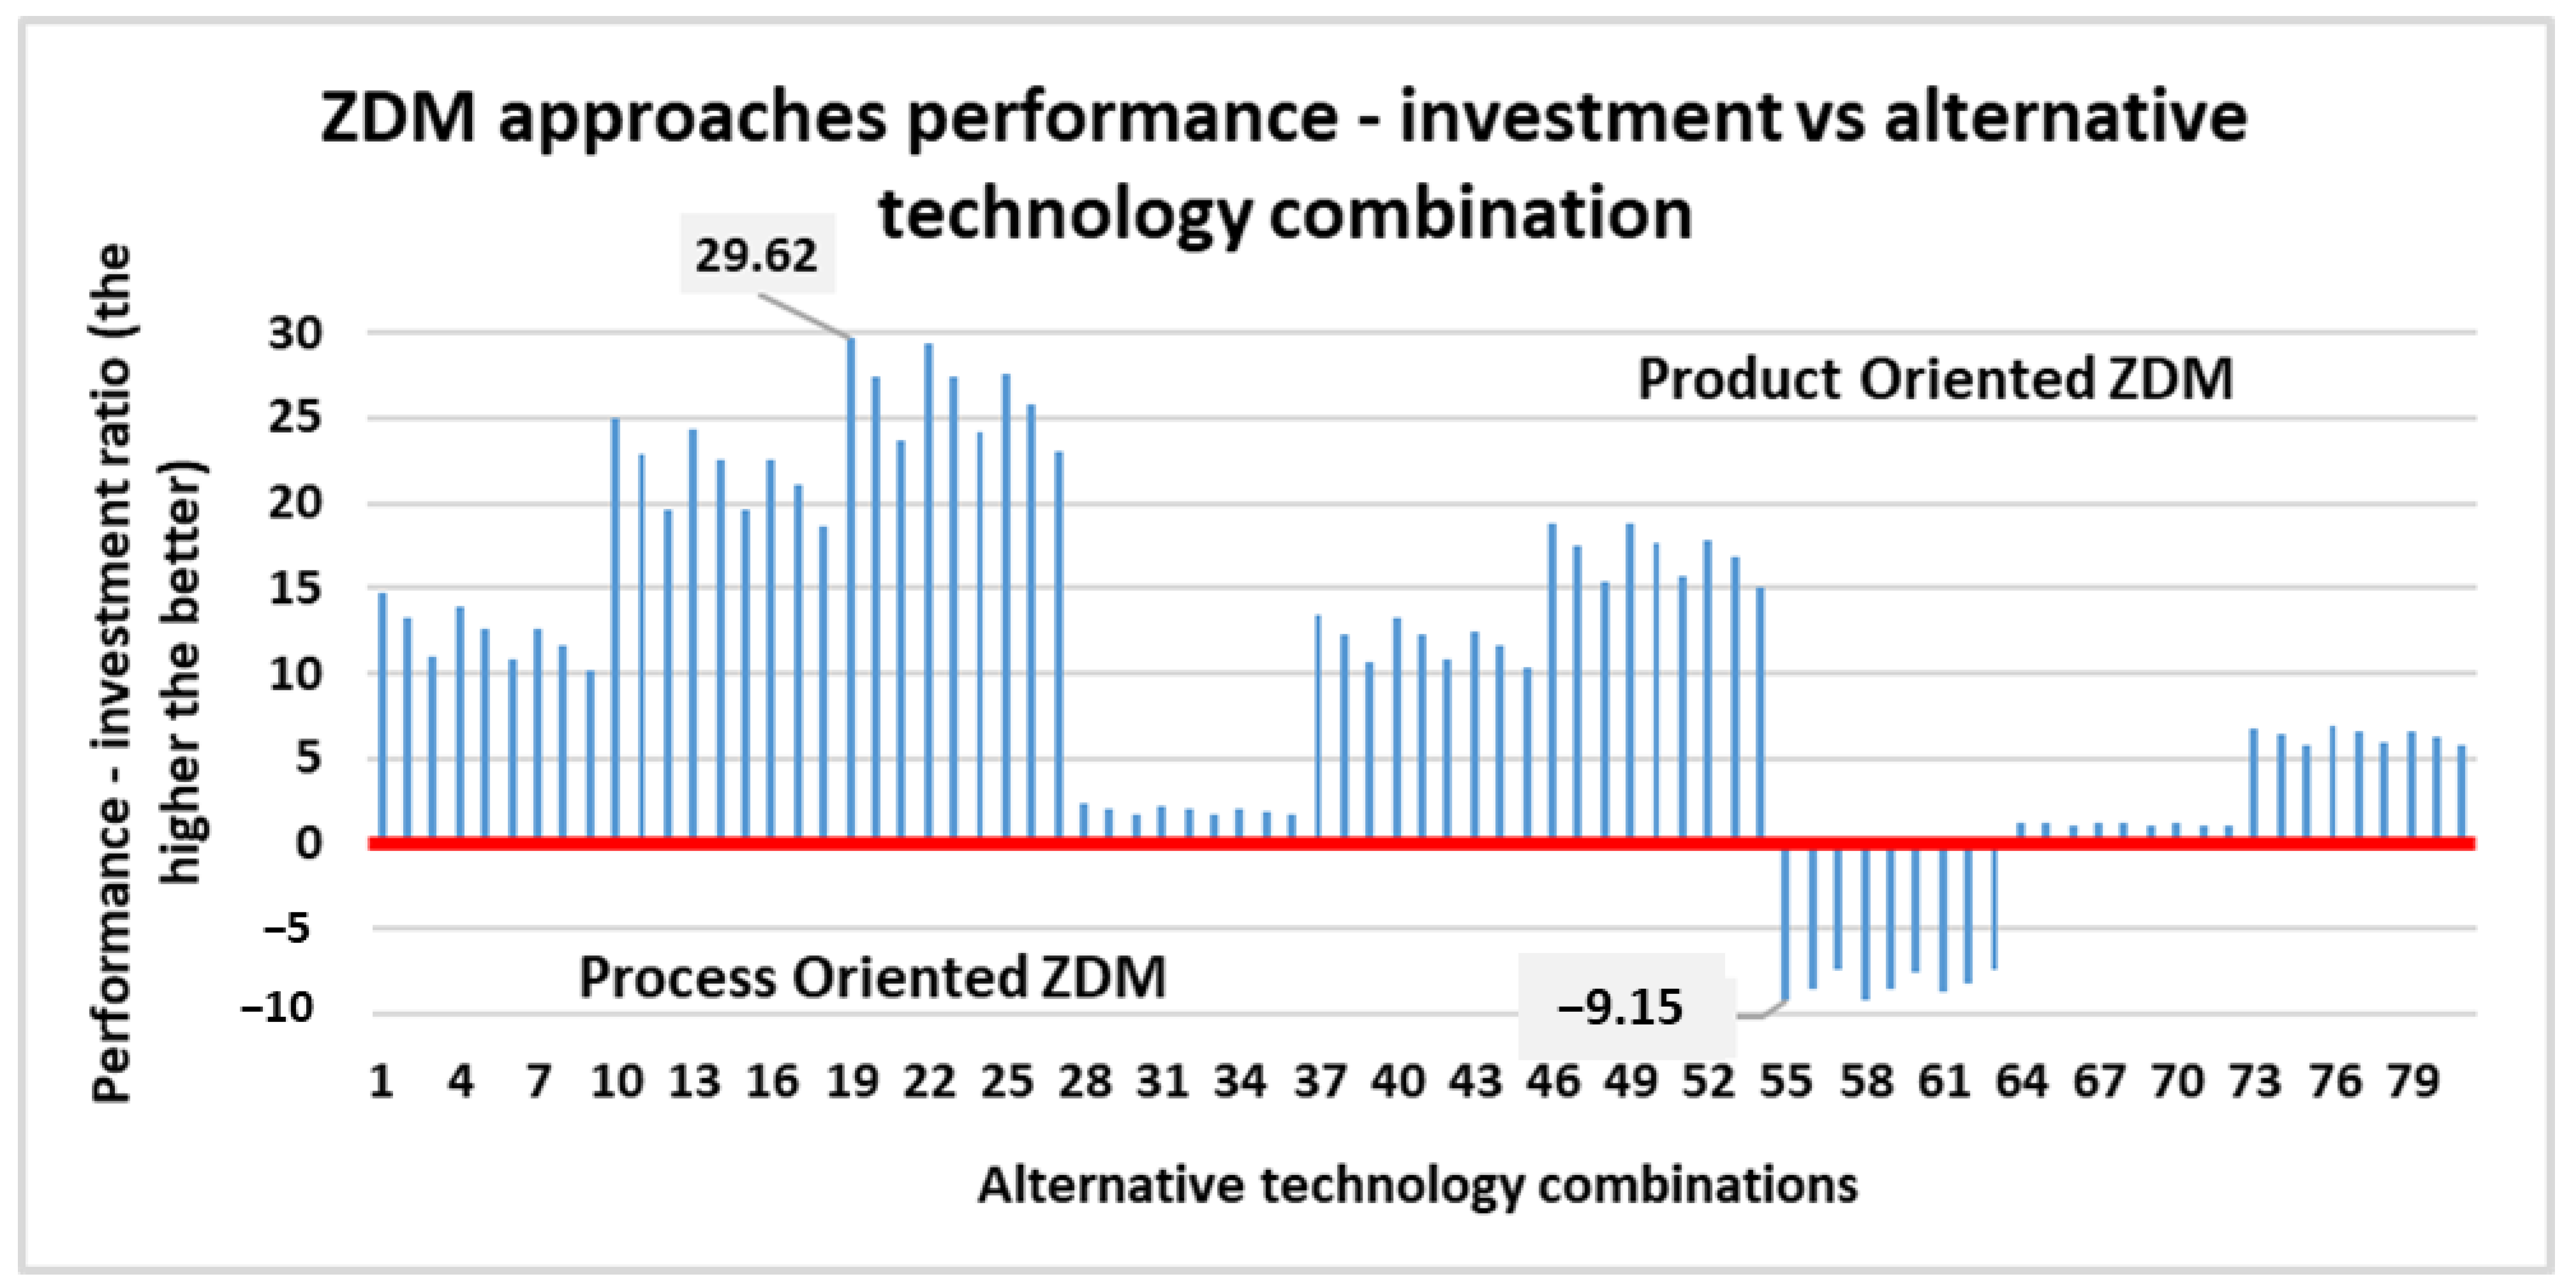
Figure 7 illustrates the results from the developed cost model (Equation (9)) in combination with Equations (10) and (11) for the current industrial use case. More specifically, Figure 7 presents the ratio of the cost difference between product and process ZDM approaches divided by the investment cost of the corresponding equipment. If the bar is on the positive side of the y axis, the product-oriented ZDM is more cost efficient, whereas if the bar is on the negative side, process-oriented ZDM is more cost effective. In 54/81 of the combinations, the product-oriented ZDM approach was the dominant approach, and 18/54 combinations had almost the same performance, with product-oriented ZDM being slightly better. There were also 9/54 sets in which process-oriented ZDM was the dominant approach. The best technology combination was A1, B3, C1, D1 using the process-oriented ZDM approach. Table 5 illustrates the scenarios in which process-oriented ZDM performed better than product-oriented ZDM.
4.3. Results Discussion
This subsection synthesizes the discussions from Section 4.1 and Section 4.2 and presents a comprehensive interpretation of the results. We highlight how our proposed model can be employed effectively. The structure of this section provides a clear roadmap to the reader, moving from the analysis of the model, to its application, and finally, a comprehensive discussion and interpretation of the results.
Our research has culminated in the development of a cost model that has been created to be generic, with the aim of being applicable to various domains. This is a key advancement as many previous studies that have developed models that are specific to a certain domain or industry, reduces their broader applicability [72]. Our model’s use of relative values for parameters increases its flexibility and generalizability, a feature not commonly found in previous research.
The Design of Experiments (DoE) analysis applied to our model has provided significant insights, exploring the direction and percentage of influence of the main factors and their interactions. This methodology has proven itself effective in many previous studies and once again has demonstrated its value in our research. Our model showed robustness, being influenced in a similar manner regardless of the Zero-Defect Manufacturing (ZDM) approach taken. This crucial trait enhances the model’s practical application, a goal that echoes the sentiment of [35] that called for more practical and versatile models in the field.
Our Analysis of Means (ANOM) brought forward several intriguing trends and, in some cases, unexpected results, particularly in relation to MDAC, RC, and MAC. Divergences from expected results are not unprecedented; a similar surprising trend was observed that sometimes counterintuitive interactions can occur in complex systems [73]. These instances spotlight the intricate nature of ZDM and highlight the need for further investigation. The ANOM diagrams illustrated that the developed cost model is robust and affected in the same way regardless of the ZDM approach, which can be considered a critical aspect for the practicality of the model. More specifically, the ANOM analysis revealed in which direction each factor and interaction affect the final ZDM implementation cost. Most of the trends in Figure 4 were expected, but there are some graphs that demonstrate unusual behavior, such as MDAC, RC, and MAC. Even though the expectation is that an increase in these parameters should increase the final cost, the related ZDM implementation cost decreased with higher values of these parameters. In addition, the study of the interactions revealed that there are very strong interactions between the different factors. Most of the interactions are with UC compared to all the other parameters, and when UC has the lowest value, that is level 1, the ZDM implementation cost is almost 0, regardless of the level of the interaction factor. This changes when UC moves to level 2. Therefore, the ANOM diagrams can be used by practitioners as a map for product and process ZDM approaches and for tuning the equipment selection. The influence of each factor on the final ZDM implementation cost, as revealed by our ANOVA analysis, brings forward a crucial aspect for consideration. These findings support the conclusions of [31] regarding the importance of understanding both the individual and the interactive effects of various factors in ZDM implementation. By identifying the most influential factors, manufacturers can channel their resources more efficiently, highlighting areas where they should pay greater attention.
The industrial use case results revealed that in most cases, product-oriented ZDM performed better than process oriented. More specifically, process-oriented ZDM performed better in only 16.6% of the 81 scenarios. This behavior is explained by the fact that the cycle for the product-oriented approach starts with the quality of the product itself, and therefore potential defects are identified, and corrections are made so that no products with defects leave the production site. In the process-oriented approach, there is little inertia because process quality has priority, and therefore products with defects might be produced without any raised alarm from the process-quality monitoring system.
The results shown in Figure 7 can be considered a map for the performance of the two ZDM approaches using the different equipment options available. Therefore, choosing between a process- or product-oriented ZDM is not an easy and straightforward task, as proven by the results of the developed model. To this extent, the developed model can be very useful for engineers when implementing ZDM in manufacturing systems. The experiments showed that when the PIC is 9.2% or higher than the product nominal cost, the IA is around 96.6%, and the MDAC is lower than 0.026%. With an accuracy of 94%, process-oriented ZDM behaves significantly better than product oriented. In other words, when product inspection is expensive, and the machine data analysis cost is relatively low, process-oriented ZDM has the advantage. The two other factors, the rework and mitigation action implementation, do not affect the direction of the solution.
The produced map for the industrial use case (Figure 7) can be used not only for selecting the most appropriate equipment, but it is also useful for comparing the two ZDM approaches when the ZDM equipment specifications are known. More specifically, the following process should be followed for selecting the proper equipment and ZDM approach. The first stage is to assess how well the manufacturing system performs while using the available technological options and determine the most suitable specification set based on several KPIs, as suggested by Psarommatis [18]. The next step is to use the produced ZDM approaches map (Figure 7) and identify which specification set corresponds to the most optimum solution suggested from the previous step. Once this is accomplished, the performance of the two ZDM approaches can be observed, and the best-performing approach can be selected. By following these two steps, manufacturers can be assured that they can achieve the best possible results from the implementation of ZDM and progress toward true sustainable manufacturing.
The performance map created in our study for the two ZDM approaches using different equipment options is a key contribution to the field. It brings forward the fact that the selection of an appropriate ZDM approach and equipment is not an easy or straightforward task, which has been a common thread in many previous studies. This map can serve as an invaluable tool for engineers and practitioners in the implementation of ZDM, helping in the identification of the most effective approach in a given context and guiding manufacturers towards sustainable manufacturing.
In conclusion, the findings of our study, when placed in the context of wider academic discourse, reinforce the robustness and adaptability of our cost model across a variety of industrial scenarios. The insights generated by our research underscore the need for careful consideration of a multitude of factors in ZDM approach selection, adding to the body of knowledge surrounding ZDM implementation and sustainable manufacturing.
5. Concluding Remarks and Future Work
This study aimed to address a notable gap in the ZDM literature: the need for clear guidance on choosing between product-oriented and process-oriented ZDM approaches. By developing and applying a model based on 13 control parameters and utilizing the ‘design of experiments’ statistical method, we have made significant strides in understanding how these factors impact the cost-effectiveness and efficiency of ZDM implementation.
Our findings suggest that the product-oriented ZDM generally outperforms the process-oriented counterpart, offering valuable insights for manufacturers aiming to optimize their defect management strategies. Such insights could transform the way Industry 4.0 technologies are utilized, enhancing manufacturing sustainability, and resource utilization efficiency, and moving the industry closer to the goal of waste-free production.
Importantly, our study has shed light on the interactions between various factors that influence the decision between product- and process-oriented ZDM. These findings enrich our understanding of the complex dynamics at play in ZDM strategy selection, thereby addressing the identified gap in the literature.
In the context of sustainable manufacturing, the implications of our study are significant. Through the implementation of Zero Defect Manufacturing (ZDM) strategies, waste is minimized, thus conserving valuable resources. This not only serves the environment but also the economic aspect of sustainability by reducing unnecessary costs associated with defects. By integrating our cost model into their decision-making process, companies can make a more informed choice about implementing ZDM strategies that align with their sustainability goals. These decisions ultimately contribute to both the ecological and economic dimensions of sustainable manufacturing.
However, we acknowledge that our findings may not be universally applicable, as they are based on specific industrial use-case. This highlights an avenue for future research, with potential for further exploration and validation of our model across different industrial contexts. Further research could also delve deeper into situations where the process-oriented ZDM might outshine the product-oriented approach, offering a more nuanced understanding of these two strategies.
In conclusion, our study contributes to the existing body of knowledge on ZDM by providing manufacturers with a tangible tool for selecting the most suitable ZDM approach. This contribution not only fills the identified research gap but also has the potential to influence practical decision-making in the field, ultimately impacting the effectiveness of ZDM implementation in the era of Industry 4.0.
Author Contributions
Conceptualization, F.P.; methodology, F.P.; formal analysis, F.P.; investigation, F.P. and G.M.; writing—original draft preparation, F.P. and G.M.; writing—review and editing, F.P. and G.M.; All authors have read and agreed to the published version of the manuscript.
Funding
The presented work was partially supported by the projects RE4DY and PLOOTO, EU H2020 projects under grant agreements Nos. 101058384 and 101092008, accordingly.
Institutional Review Board Statement
Not applicable.
Informed Consent Statement
Not applicable.
Data Availability Statement
Data is available within the article. The authors confirm that the data supporting the findings of this study are available within the article.
Acknowledgments
The paper reflects the authors’ views, and the Commission is not responsible for any use that may be made of the information it contains.
Conflicts of Interest
The authors declare no conflict of interest.
References
- Choi, S.; Battulga, L.; Nasridinov, A.; Yoo, K.-H. A Decision Tree Approach for Identifying Defective Products in Manufacturing Process 57. Int. J. Contents 2017, 13, 57–65. [Google Scholar] [CrossRef]
- Powell, D.; Magnanini, M.C.; Colledani, M.; Myklebust, O. Advancing Zero Defect Manufacturing: A State-of-the-Art Perspective and Future Research Directions. Comput. Ind. 2022, 136, 103596. [Google Scholar] [CrossRef]
- Colledani, M.; Coupek, D.; Verl, A.; Aichele, J.; Yemane, A. Design and Evaluation of In-Line Product Repair Strategies for Defect Reduction in the Production of Electric Drives. Procedia CIRP 2014, 21, 159–164. [Google Scholar] [CrossRef] [Green Version]
- Powell, D.; Alfnes, E.; Strandhagen, J.O.; Dreyer, H. The Concurrent Application of Lean Production and ERP: Towards an ERP-Based Lean Implementation Process. Comput. Ind. 2013, 64, 324–335. [Google Scholar] [CrossRef] [Green Version]
- Cheah, S.J.; Shah, A.; Shahbudin; Fauziah. Tracking Hidden Quality Costs in a Manufacturing Company: An Action Research. Int. J. Qual. Reliab. Manag. 2011, 28, 405–425. [Google Scholar] [CrossRef]
- Tannock, J.; Saelem, S. Manufacturing Disruption Costs Due to Quality Loss. Int. J. Qual. Reliab. Manag. 2007, 24, 263–278. [Google Scholar] [CrossRef]
- Faciane, M. Reducing the Costs of Poor Quality: A Manufacturing Case Study. Ph.D. Thesis, Walden University, Minneapolis, MN, USA, 2018. [Google Scholar]
- Hofmann, E.; Rüsch, M. Industry 4.0 and the Current Status as Well as Future Prospects on Logistics. Comput. Ind. 2017, 89, 23–34. [Google Scholar] [CrossRef]
- Taidi, R.; Mbarki, M.A. Cost of Poor Quality Evaluation of the Effectiveness of “Zero Defects” Goal in Quality Management. Int. J. Innov. Res. Educ. Sci. 2016, 3, 247–252. [Google Scholar]
- Psarommatis, F.; Kiritsis, D. A Hybrid Decision Support System for Automating Decision Making in the Event of Defects in the Era of Zero Defect Manufacturing. J. Ind. Inf. Integr. 2021, 26, 100263. [Google Scholar] [CrossRef]
- Ferguson, M.; Ak, R.; Lee, Y.-T.T.; Law, K.H. Detection and Segmentation of Manufacturing Defects with Convolutional Neural Networks and Transfer Learning. ASTM Int. 2018, 2. [Google Scholar] [CrossRef]
- Psarommatis, F.; May, G.; Dreyfus, P.-A.; Kiritsis, D. Zero Defect Manufacturing: State-of-the-Art Review, Shortcomings and Future Directions in Research. Int. J. Prod. Res. 2020, 7543, 1–17. [Google Scholar] [CrossRef]
- Psarommatis, F.; Sousa, J.; Mendonça, J.P.; Kiritsis, D. Zero-Defect Manufacturing the Approach for Higher Manufacturing Sustainability in the Era of Industry 4.0: A Position Paper. Int. J. Prod. Res. 2022, 60, 73–91. [Google Scholar] [CrossRef]
- Myklebust, O. Zero Defect Manufacturing: A Product and Plant Oriented Lifecycle Approach. Procedia CIRP 2013, 12, 246–251. [Google Scholar] [CrossRef]
- Hoang, X.L.; Hildebrandt, C.; Fay, A. Product-Oriented Description of Manufacturing Resource Skills. IFAC-Pap. 2018, 51, 90–95. [Google Scholar] [CrossRef]
- Zheng, X.; Psarommatis, F.; Petrali, P.; Turrin, C.; Lu, J.; Kiritsis, D. A Quality-Oriented Digital Twin Modelling Method for Manufacturing Processes Based on A Multi-Agent Architecture. Procedia Manuf. 2020, 51, 309–315. [Google Scholar] [CrossRef]
- Psarommatis, F.; Martiriggiano, G.; Zheng, X.; Kiritsis, D. A Generic Methodology for Calculating Rescheduling Time for Multiple Unexpected Events in the Era of Zero Defect Manufacturing. Front. Mech. Eng. 2021, 7, 646507. [Google Scholar] [CrossRef]
- Psarommatis, F. A Generic Methodology and a Digital Twin for Zero Defect Manufacturing (ZDM) Performance Mapping towards Design for ZDM. J. Manuf. Syst. 2021, 59, 507–521. [Google Scholar] [CrossRef]
- Psarommatis, F.; Gharaei, A.; Kiritsis, D. Identification of the Critical Reaction Times for Re-Scheduling Flexible Job Shops for Different Types of Unexpected Events. Procedia CIRP 2020, 93, 903–908. [Google Scholar] [CrossRef]
- Psarommatis, F.; Kiritsis, D. Identification of the Inspection Specifications for Achieving Zero Defect Manufacturing. In Proceedings of the IFIP Advances in Information and Communication Technology, Trondheim, Norway, 17–21 September 2023; Springer: New York, NY, USA, 2019; Volume 566, pp. 267–273. [Google Scholar]
- Ransing, R.S.; Giannetti, C.; Ransing, M.R.; James, M.W. A Coupled Penalty Matrix Approach and Principal Component Based Co-Linearity Index Technique to Discover Product Specific Foundry Process Knowledge from in-Process Data in Order to Reduce Defects. Comput. Ind. 2013, 64, 514–523. [Google Scholar] [CrossRef]
- Psarommatis, F.; Prouvost, S.; May, G.; Kiritsis, D. Product Quality Improvement Policies in Industry 4.0: Characteristics, Enabling Factors, Barriers, and Evolution Toward Zero Defect Manufacturing. Front. Comput. Sci. 2020, 2, 26. [Google Scholar] [CrossRef]
- Eleftheriadis, R.J.; Myklebust, O. A Guideline of Quality Steps towards Zero Defect Manufacturing in Industry. In Proceedings of the 2016 International Conference on Industrial Engineering and Operations Management, Detroit, MI, USA, 23–25 September 2016; pp. 332–340. [Google Scholar]
- Mourtzis, D.; Vlachou, E.; Milas, N. Industrial Big Data as a Result of IoT Adoption in Manufacturing. Procedia CIRP 2016, 55, 290–295. [Google Scholar] [CrossRef] [Green Version]
- Siva Rama Krishna, L.; Srikanth, P.J. Evaluation of Environmental Impact of Additive and Subtractive Manufacturing Processes for Sustainable Manufacturing. Mater. Today Proc. 2021, 45, 3054–3060. [Google Scholar] [CrossRef]
- Christou, I.T.; Kefalakis, N.; Soldatos, J.K.; Despotopoulou, A.-M. End-to-End Industrial IoT Platform for Quality 4.0 Applications. Comput. Ind. 2022, 137, 103591. [Google Scholar] [CrossRef]
- Wang, K.S. Towards Zero-Defect Manufacturing (ZDM)-a Data Mining Approach. Adv. Manuf. 2013, 1, 62–74. [Google Scholar] [CrossRef]
- May, G.; Kiritsis, D. Zero Defect Manufacturing Strategies and Platform for Smart Factories of Industry 4.0. Lect. Notes Mech. Eng. 2019, 2019, 142–152. [Google Scholar] [CrossRef]
- Caiazzo, B.; Di Nardo, M.; Murino, T.; Petrillo, A.; Piccirillo, G.; Santini, S. Towards Zero Defect Manufacturing Paradigm: A Review of the State-of-the-Art Methods and Open Challenges. Comput. Ind. 2022, 134, 103548. [Google Scholar] [CrossRef]
- Martinez, P.; Al-Hussein, M.; Ahmad, R. A Cyber-Physical System Approach to Zero-Defect Manufacturing in Light-Gauge Steel Frame Assemblies. Procedia Comput. Sci. 2022, 200, 924–933. [Google Scholar] [CrossRef]
- Zhao, L.-P.; Li, B.-H.; Yao, Y.-Y. A Novel Predict-Prevention Quality Control Method of Multi-Stage Manufacturing Process towards Zero Defect Manufacturing. Adv. Manuf. 2023, 11, 280–294. [Google Scholar] [CrossRef]
- Markatos, N.G.; Mousavi, A. Manufacturing Quality Assessment in the Industry 4.0 Era: A Review. Total Qual. Manag. Bus. Excell. 2023, 1–27. [Google Scholar] [CrossRef]
- Babalola, S.A.; Mishra, D.; Dutta, S.; Murmu, N.C. In-Situ Workpiece Perception: A Key to Zero-Defect Manufacturing in Industry 4.0 Compliant Job Shops. Comput. Ind. 2023, 148, 103891. [Google Scholar] [CrossRef]
- Psarommatis, F.; May, G. A practical guide for implementing Zero Defect Manufacturing in new or existing manufacturing systems. Procedia Comput. Sci. 2023, 217, 82–90. [Google Scholar] [CrossRef]
- Mourtzis, D.; Angelopoulos, J.; Panopoulos, N. Equipment Design Optimization Based on Digital Twin under the Framework of Zero-Defect Manufacturing. Procedia Comput. Sci. 2021, 180, 525–533. [Google Scholar] [CrossRef]
- Galetto, M.; Verna, E.; Genta, G.; Franceschini, F. Uncertainty Evaluation in the Prediction of Defects and Costs for Quality Inspection Planning in Low-Volume Productions. Int. J. Adv. Manuf. Technol. 2020, 108, 3793–3805. [Google Scholar] [CrossRef]
- Dreyfus, P.A.; Kyritsis, D. A Framework Based on Predictive Maintenance, Zero-Defect Manufacturing and Scheduling under Uncertainty Tools, to Optimize Production Capacities of High-End Quality Products. In IFIP Advances in Information and Communication Technology; Springer: New York, NY, USA, 2018; Volume 536, pp. 296–303. [Google Scholar]
- Aksa, K.; Aitouche, S.; Bentoumi, H.; Sersa, I. Developing a Web Platform for the Management of the Predictive Maintenance in Smart Factories. Wirel. Pers. Commun. 2021, 119, 1469–1497. [Google Scholar] [CrossRef]
- Rahmani, D.; Ramezanian, R. A Stable Reactive Approach in Dynamic Flexible Flow Shop Scheduling with Unexpected Disruptions: A Case Study. Comput. Ind. Eng. 2016, 98, 360–372. [Google Scholar] [CrossRef]
- Kucharska, E.; Grobler-Dȩbska, K.; Rączka, K. Algebraic-Logical Meta-Model Based Approach for Scheduling Manufacturing Problem with Defects Removal. Adv. Mech. Eng. 2017, 9, 1687814017692291. [Google Scholar] [CrossRef] [Green Version]
- Psarommatis, F.; Kiritsis, D. A Scheduling Tool for Achieving Zero Defect Manufacturing (ZDM): A Conceptual Framework; Springer: Cham, Switzerland, 2018; pp. 271–278. [Google Scholar]
- Levitin, G.; Finkelstein, M.; Huang, H.Z. Scheduling of Imperfect Inspections for Reliability Critical Systems with Shock-Driven Defects and Delayed Failures. Reliab. Eng. Syst. Saf. 2019, 189, 89–98. [Google Scholar] [CrossRef]
- Psarommatis, F.; Vuichard, M.; Kiritsis, D. Improved Heuristics Algorithms for Re-Scheduling Flexible Job Shops in the Era of Zero Defect Manufacturing. Procedia Manuf. 2020, 51, 1485–1490. [Google Scholar] [CrossRef]
- Ruiz, J.C.S.; Bru, J.M.; Escoto, R.P. Smart Digital Twin for ZDM-Based Job-Shop Scheduling. In Proceedings of the 2021 IEEE International Workshop on Metrology for Industry 4.0 and IoT, MetroInd 4.0 and IoT, Rome, Italy, 7–9 June 2021; pp. 510–515. [Google Scholar] [CrossRef]
- Vandebroek, M.; Lan, L.; Knapen, K. An Experimental Diagnostic Procedure to Identify the Source of Defects in Multi-Stage and Multi-Component Production Processes. J. Qual. Technol. 2016, 48, 213–226. [Google Scholar] [CrossRef]
- Vafeiadis, T.; Ioannidis, D.; Ziazios, C.; Metaxa, I.N.; Tzovaras, D. Towards Robust Early Stage Data Knowledge-Based Inference Engine to Support Zero-Defect Strategies in Manufacturing Environment. Procedia Manuf. 2017, 11, 679–685. [Google Scholar] [CrossRef]
- Eger, F.; Reiff, C.; Brantl, B.; Colledani, M.; Verl, A. Correlation Analysis Methods in Multi-Stage Production Systems for Reaching Zero-Defect Manufacturing. Procedia CIRP 2018, 72, 635–640. [Google Scholar] [CrossRef]
- Serrano, J.C.; Mula, J.; Poler, R. Digital Twin for Supply Chain Master Planning in Zero-Defect Manufacturing. IFIP Adv. Inf. Commun. Technol. 2021, 626, 102–111. [Google Scholar] [CrossRef]
- Caccamo, C.; Eleftheriadis, R.; Magnanini, M.C.; Powell, D. Odd Myklebust a Hybrid Architecture for the Deployment of a Data Quality Management (DQM) System for Zero-Defect Manufacturing in Industry 4.0. In Proceedings of the Advances in Production Management Systems, Artificial Intelligence for Sustainable and Resilient Production Systems: IFIP WG 5.7 International Conference, APMS 2021, Nantes, France, 5–9 September 2021; pp. 71–77. [Google Scholar] [CrossRef]
- Zhao, Y.; He, Y.; Zhou, D.; Zhang, A.; Han, X.; Li, Y.; Wang, W. Functional Risk-Oriented Integrated Preventive Maintenance Considering Product Quality Loss for Multistate Manufacturing Systems. Int. J. Prod. Res. 2020, 59, 1003–1020. [Google Scholar] [CrossRef]
- Tao, F.; Zhang, M.; Liu, Y.; Nee, A.Y.C. Digital Twin Driven Prognostics and Health Management for Complex Equipment. CIRP Ann. 2018, 67, 169–172. [Google Scholar] [CrossRef]
- Stojanovic, N.; Milenovic, D. Data-Driven Digital Twin Approach for Process Optimization: An Industry Use Case. In Proceedings of the 2018 IEEE International Conference on Big Data, Big Data, Seattle, WA, USA, 10–13 December 2018; pp. 4202–4211. [Google Scholar] [CrossRef]
- Su, S.; Zhao, G.; Xiao, W.; Yang, Y.; Cao, X. An Image-Based Approach to Predict Instantaneous Cutting Forces Using Convolutional Neural Networks in End Milling Operation. Int. J. Adv. Manuf. Technol. 2021, 115, 1657–1669. [Google Scholar] [CrossRef]
- Zhang, C.W.; Pan, R.; Goh, T.N. Reliability Assessment of High-Quality New Products with Data Scarcity. Int. J. Prod. Res. 2021, 59, 4175–4187. [Google Scholar] [CrossRef]
- Guo, J.; Yang, Z.; Chen, C.; Luo, W.; Hu, W. Real-Time Prediction of Remaining Useful Life and Preventive Maintenance Strategy Based on Digital Twin. J. Comput. Inf. Sci. Eng. 2021, 21, 31003. [Google Scholar] [CrossRef]
- Al-Kharaz, M.; Ananou, B.; Ouladsine, M.; Combal, M.; Pinaton, J. Quality Prediction in Semiconductor Manufacturing Processes Using Multilayer Perceptron Feedforward Artificial Neural Network. In Proceedings of the 2019 8th International Conference on Systems and Control, ICSC, Marrakesh, Morocco, 23–25 October 2019; pp. 423–428. [Google Scholar] [CrossRef]
- García, V.; Sánchez, J.S.; Rodríguez-Picón, L.A.; Méndez-González, L.C.; Ochoa-Domínguez, H.D.J. Using Regression Models for Predicting the Product Quality in a Tubing Extrusion Process. J. Intell. Manuf. 2019, 30, 2535–2544. [Google Scholar] [CrossRef]
- Cheng, D.J.; Zhang, J.; Hu, Z.T.; Xu, S.H.; Fang, X.F. A Digital Twin-Driven Approach for On-Line Controlling Quality of Marine Diesel Engine Critical Parts. Int. J. Precis. Eng. Manuf. 2020, 21, 1821–1841. [Google Scholar] [CrossRef]
- Detzner, A.; Eigner, M. A Digital Twin for Root Cause Analysis and Product Quality Monitoring. Proc. Int. Des. Conf. Des. 2018, 4, 1547–1558. [Google Scholar] [CrossRef]
- Baturynska, I.; Martinsen, K. Prediction of Geometry Deviations in Additive Manufactured Parts: Comparison of Linear Regression with Machine Learning Algorithms. J. Intell. Manuf. 2020, 32, 179–200. [Google Scholar] [CrossRef]
- Eger, F.; Coupek, D.; Caputo, D.; Colledani, M.; Penalva, M.; Ortiz, J.A.; Freiberger, H.; Kollegger, G. Zero Defect Manufacturing Strategies for Reduction of Scrap and Inspection Effort in Multi-Stage Production Systems. Procedia CIRP 2018, 67, 368–373. [Google Scholar] [CrossRef]
- Sousa, J.; José, F.; Carlos, L.; Sarraipa, J.; Silva, J. Enhancing the Steel Tube Manufacturing Process with a Zero Defects Approach. In Proceedings of the ASME 2020 International Mechanical Engineering Congress and Exposition, Online, 16–19 November 2020; Advanced Manufacturing. Volume 2B. [Google Scholar]
- Psarommatis, F.; Kiritsis, D. Comparison Between Product and Process Oriented Zero-Defect Manufacturing (ZDM) Approaches. In Proceedings of the IFIP Advances in Information and Communication Technology, Nantes, France, 5–9 September 2021; Springer: Cham, Switzerland, 2021; pp. 105–112. [Google Scholar]
- Psarommatis, F.; Danishvar, M.; Mousavi, A.; Kiritsis, D. Cost-Based Decision Support System: A Dynamic Cost Estimation of Key Performance Indicators in Manufacturing. IEEE Trans. Eng. Manag. 2022. [Google Scholar] [CrossRef]
- Phadke, M.S. Quality Engineering Using Robust Design; Prentice Hall PTR: Hoboken, NJ, USA, 1995; ISBN 0-13-745167-9. [Google Scholar]
- Almeida, A.; Cunha, J. The Implementation of an Activity-Based Costing (ABC) System in a Manufacturing Company. Procedia Manuf. 2017, 13, 932–939. [Google Scholar] [CrossRef]
- Nik Mohd Kamil, N.N.; Abu, M.Y.; Zamrud, N.F.; Safeiee, F.L.M. Analysis of Magnetic Component Manufacturing Cost Through the Application of Time-Driven Activity-Based Costing; Springer: Singapore, 2020; pp. 74–80. [Google Scholar]
- Wouters, M.; Stecher, J. Development of Real-Time Product Cost Measurement: A Case Study in a Medium-Sized Manufacturing Company. Int. J. Prod. Econ. 2017, 183, 235–244. [Google Scholar] [CrossRef]
- Wen Zheng, C.; Yazid Abu, M. Application of Activity Based Costing for Palm Oil Plantation. J. Mod. Manuf. Syst. Technol. 2019, 2, 1–14. [Google Scholar] [CrossRef]
- Tsai, W.H.; Tsaur, T.S.; Chou, Y.W.; Liu, J.Y.; Hsu, J.L.; Hsieh, C.L. Integrating the Activity-Based Costing System and Life-Cycle Assessment into Green Decision-Making. Int. J. Prod. Res. 2015, 53, 451–465. [Google Scholar] [CrossRef]
- Haroun, A.E. Maintenance Cost Estimation: Application of Activity-Based Costing as a Fair Estimate Method. J. Qual. Maint. Eng. 2015, 21, 258–270. [Google Scholar] [CrossRef]
- Lindström, J.; Kyösti, P.; Birk, W.; Lejon, E. An Initial Model for Zero Defect Manufacturing. Appl. Sci. 2020, 10, 4570. [Google Scholar] [CrossRef]
- Mourtzis, D.; Balkamos, N. Design of Manufacturing Systems Based on Digital Shadow and Robust Engineering. Appl. Sci. 2023, 13, 5184. [Google Scholar] [CrossRef]
Figure 1.
ZDM implementation strategies [12]. Zero defect manufacturing strategies, triggering factors detect and predict action strategies repair and prevent. ZDM pairs detect-repair, detect-prevent, and predict prevent.
Figure 1.
ZDM implementation strategies [12]. Zero defect manufacturing strategies, triggering factors detect and predict action strategies repair and prevent. ZDM pairs detect-repair, detect-prevent, and predict prevent.

Figure 2.
ZDM product and process-oriented approaches [12]. Figure illustrating the two ZDM approaches, product and process oriented. In product-oriented ZDM, the product quality is monitored, and if a quality issue occurs, the health of the corresponding machine is inspected. In process-oriented ZDM, the health of the machine is inspected first, and if abnormalities are detected, the quality of the product is inspected as well. Both ways lead to ZDM.

Figure 3.
L32 linear graph. Linear graph of L32 orthogonal array illustrating the possible interactions that can be studied.
Figure 3.
L32 linear graph. Linear graph of L32 orthogonal array illustrating the possible interactions that can be studied.

Figure 4.
Factors’ main effects vs. related implementation cost. Graphs illustrating the influence of each of the defined factors vs. the implementation cost.
Figure 4.
Factors’ main effects vs. related implementation cost. Graphs illustrating the influence of each of the defined factors vs. the implementation cost.

Figure 5.
Interaction diagrams based on the L32 linear graph. Graphs illustrating the interactions imposed by the linear graph for both product- and process-oriented ZDM.
Figure 5.
Interaction diagrams based on the L32 linear graph. Graphs illustrating the interactions imposed by the linear graph for both product- and process-oriented ZDM.

Figure 6.
ANOVA results, % of influence of each factor and interaction set. Bar chart presenting the influence percentages of each factor and interaction sets for both product and process ZDM approaches.
Figure 6.
ANOVA results, % of influence of each factor and interaction set. Bar chart presenting the influence percentages of each factor and interaction sets for both product and process ZDM approaches.

Figure 7.
ZDM approaches’ performance-investment for each alternative technology combination. Bar chart presenting the ZDM implementation cost for both product- and process-oriented ZDM for the different scenarios of the industrial use case as the ratio of cost performance and investment cost.
Figure 7.
ZDM approaches’ performance-investment for each alternative technology combination. Bar chart presenting the ZDM implementation cost for both product- and process-oriented ZDM for the different scenarios of the industrial use case as the ratio of cost performance and investment cost.

Table 2.
Generic design of experiments, factor levels and assigned columns.
| Levels/ Factors | 1 | 2 | L32 Column Assignment |
|---|---|---|---|
| LV | 1000 | 10,000,000 | 30 |
| UC | 1 | 10,000 | 1 |
| DR | 0.01 | 0.12 | 15 |
| PRF | 0.05 | 3 | 28 |
| PQLR | 0.01 | 0.5 | 8 |
| PIC | 0.01 | 0.38 | 4 |
| MDAC | 0.001 | 0.3 | 2 |
| MDA | 0.7 | 0.99 | 22 |
| IA | 0.7 | 0.99 | 24 |
| RC | 0.1 | 0.8 | 20 |
| MAC | 0.1 | 0.8 | 26 |
| MAE | 0.7 | 0.99 | 16 |
| REF | 0.7 | 0.99 | 18 |
Table 3.
Technology specifications.
| Category | Technology Identifier | Parameter | Option 1 | Option 2 | Option 3 |
|---|---|---|---|---|---|
| Inspection | A | PIC | 3.7% | 5.3% | 9.2% |
| IA | 91.2% | 93.5% | 96.6% | ||
| Data analysis | B | MDAC | 0.026% | 1.2% | 2.7% |
| MDA | 94% | 97% | 99% | ||
| Rework cost | C | RC | 10% | 18% | 34% |
| Rework effectiveness | REF | 78% | 89% | 93% | |
| Mitigation action cost | D | MAC | 17% | 28% | 54% |
| Mitigation action effectiveness | MAE | 70% | 80% | 95% |
Table 4.
Systems purchase cost.
| Category | Symbol | Technology Identifier | Option 1 | Option 2 | Option 3 |
|---|---|---|---|---|---|
| Inspection | InspInvC | A | €25,400 | €43,340 | €80,260 |
| Data analysis | DatAnInvC | B | €12,000 | €36,540 | €55,210 |
| Rework | RewInvC | C | €65,320 | €89,340 | €110,030 |
| Mitigation action | MigActInvC | D | €11,300 | €24,500 | €50,230 |
Table 5.
Scenarios in which process ZDM is better than product ZDM.
| [A3, B1, C1, D1] | [A3, B1, C2, D1] | [A3, B1, C3, D1] |
| [A3, B1, C1, 2] | [A3, B1, C2, D2] | [A3, B1, C3, D2] |
| [A3, B1, C1, 3] | [A3, B1, C2, D3] | [A3, B1, C3, D3] |
Disclaimer/Publisher’s Note: The statements, opinions and data contained in all publications are solely those of the individual author(s) and contributor(s) and not of MDPI and/or the editor(s). MDPI and/or the editor(s) disclaim responsibility for any injury to people or property resulting from any ideas, methods, instructions or products referred to in the content. |
© 2023 by the authors. Licensee MDPI, Basel, Switzerland. This article is an open access article distributed under the terms and conditions of the Creative Commons Attribution (CC BY) license (https://creativecommons.org/licenses/by/4.0/).
Share and Cite
MDPI and ACS Style
Psarommatis, F.; May, G. A Systematic Analysis for Mapping Product-Oriented and Process-Oriented Zero-Defect Manufacturing (ZDM) in the Industry 4.0 Era. Sustainability 2023, 15, 12251. https://doi.org/10.3390/su151612251
AMA Style
Psarommatis F, May G. A Systematic Analysis for Mapping Product-Oriented and Process-Oriented Zero-Defect Manufacturing (ZDM) in the Industry 4.0 Era. Sustainability. 2023; 15(16):12251. https://doi.org/10.3390/su151612251
Chicago/Turabian StylePsarommatis, Foivos, and Gökan May. 2023. "A Systematic Analysis for Mapping Product-Oriented and Process-Oriented Zero-Defect Manufacturing (ZDM) in the Industry 4.0 Era" Sustainability 15, no. 16: 12251. https://doi.org/10.3390/su151612251
Note that from the first issue of 2016, this journal uses article numbers instead of page numbers. See further details here.