
Multivariate Analysis of Harvested Rainwater Quality Utilizing Sustainable Solar-Energy-Driven Water Treatment

1
Faculty of Civil Engineering, University of Engineering and Technology, Lahore 54890, Pakistan
2
Department of Civil Engineering, College of Engineering, Qassim University, Buraydah 51452, Qassim, Saudi Arabia
*
Author to whom correspondence should be addressed.
Sustainability 2023, 15(19), 14568; https://doi.org/10.3390/su151914568
Submission received: 5 September 2023
/
Revised: 28 September 2023
/
Accepted: 7 October 2023
/
Published: 8 October 2023
(This article belongs to the Special Issue Innovative Treatments for Wastewater and Natural Water: Towards a Modern and Sustainable World)
Abstract
:The rising importance of utilizing rainwater as a sustainable and viable alternative water source is evident amid increasing urbanization and the mounting global apprehensions about water scarcity. This research aims to develop a comprehensive and sustainable approach to rainwater treatment by effectively utilizing the recently constructed solar panels at the University of Engineering and Technology (UET) in Pakistan. The study’s distinctiveness lies in its comprehensive examination of treatment plant efficiency under various weather conditions in a water-scarce region. The main objective of this work is to maximize the harvested rainwater in order to provide safe drinking water while lessening the carbon footprint of treatment operations. The proposed University of Engineering and Technology water purification process (UETWPP) method involves a sequence of four essential rainwater filtration stages, namely aeration, absorption, sediment filtration, and finally, UV disinfection, all powered by solar energy. Water samples were collected monthly for a year to assess the quality of untreated and treated rainwater, including physical, chemical, and biological parameters. Multivariate analysis techniques were used to assess these parameters, including the Friedman test and principal component analyses. By reducing the initial set of twenty components down to the four most critical ones identified in the untreated water samples, the interrelationships among these components were investigated. The results indicate that the quality of treated water using the UETWPP process was found to be suitable for human consumption, aligning with the local standards as well as those established by the World Health Organization (WHO), highlighting the effectiveness of the process in transforming rainwater into potable water. Ultimately, this pilot project showcases the viability and economic efficiency of the proposed system, rendering it easily implementable in other regions.
1. Introduction
Rainwater collected from rooftops, an abundant and cost-effective water resource, can be exploited through diverse and affordable techniques to fulfill various needs such as drinking water, irrigation, and replenishing depleted aquifers [1]. Rainwater harvesting has been employed worldwide since ancient times, adapting to diverse environments and societies using various methods and technologies. Roman cities, for example, were designed to rely on rainwater harvested from house-roofs as the main drinking and domestic water source [2]. Currently, rainwater harvesting remains vital for human survival, particularly in arid regions and areas with limited water access. However, harvested rainwater intended for drinking purposes may require appropriate treatment before any human consumption [3]. Treatment of harvested rainwater for drinking purposes has become a crucial topic of discussion in a time marked by growing environmental concerns and the pressing need for responsible water-resource management [4,5].
Sustainable water treatment has become quite popular in this context, representing a fresh and progressive method of tackling the urgent problems of water scarcity, pollution, and ecological imbalance [1,6,7]. Various low-cost, high-efficiency, and environmentally friendly methods are emerging techniques used to treat water for drinking purposes, specifically focusing on their relevance in developing countries. For example, Ashraf et al. [8] proposed a renewable technique using magnetic tea biochar as a means to remove fluoride from water and ensure its suitability for drinking. Other studies conducted by Teng and Altaf [9,10] focused on the removal of highly persistent mercury from water to ensure safe drinking water and protect human health using eco-friendly techniques. Exploring alternative sources and methods for maintaining clean water access has become essential as traditional water-supply systems struggle to meet the demands of expanding populations and shifting climatic trends.
Rainwater, frequently considered an untapped resource, has enormous potential as a sustainable water supply [11,12]. Particularly in areas with limited access to fresh water, its collection and purification have been used for generations [13,14,15]. However, modern attention to sustainability and the incorporation of cutting-edge technologies have changed how rainwater treatment is perceived and used. Sustainable rainwater treatment takes cues from natural processes, aiming to improve the built-in purification mechanisms that function within the hydrological cycle, in contrast to conventional treatment processes that heavily rely on energy-intensive infrastructure and chemical interventions [16,17].
This strategy adheres to the fundamentals of environmental management and offers a wide range of advantages that go far beyond simple water purification. Sustainable rainwater treatment includes a comprehensive approach that solves issues with both water quality and quantity by easing the burden on traditional water sources, lowering the energy footprint of treatment facilities, and limiting the effects of stormwater runoff on regional ecosystems [16,18,19,20]. Additionally, it promotes a change in public perceptions of water, deepening understanding of its value and the significance of its efficient use. There is an urgent need to investigate novel strategies that not only purify accessible water sources but also lessen the carbon footprint of treatment operations, as water scarcity and contamination continue to pose a threat to conventional water-delivery systems [21,22,23]. Utilizing solar energy and rainwater treatment together offers a creative solution that emphasizes resource saving and encourages the delivery of clean and potable water [24,25,26,27,28]. The foundation of public health and wellbeing is the quality of drinking water, which is closely related to overall life quality and the prevention of waterborne diseases [29,30,31,32,33,34]. When other water supplies are short, rainwater has historically been collected for various uses, including residential and agricultural irrigation. The use of solar energy, however, raises rainwater treatment to new levels, making it an environmentally responsible and cutting-edge tactic for guaranteeing the safety of drinking water. An indication of humanity’s desire to use nature’s rich resources without upsetting its delicate balance is the use of solar energy in the context of rainwater treatment. The strategy harmonizes with resource optimization and environmental conservation tenets by utilizing solar energy’s renewable and sustainable qualities [26,35,36,37,38,39,40]. Solar energy’s ability to power and improve each stage of the treatment process from collection to disinfection enhances the very nature of rainwater treatment, which takes advantage of the Earth’s natural water cycle.
This study is centered around the University of Engineering and Technology (UET) building, and its primary focus is assessing the quality of stored rainwater. The investigation employs a multivariate analysis approach to evaluate thoroughly the essential components present within the collected rainwater. Within the past two years, UET has successfully implemented a 1 MW solar power plant. Recognizing the potential of harnessing this solar power for future water-treatment endeavors, the study introduces a water-treatment design. Consequently, the research proposes an innovative approach by developing a sustainable, automated University of Engineering and Technology water purification process (UETWPP) driven by solar energy. This sustainable process is designed to efficiently treat the gathered rainwater, capitalizing on the available solar energy infrastructure. The ultimate objective of this initiative is to meet the future drinking water requirements of the study area while also establishing the applicability of this proposal to address water scarcity in various regions with limited access to water resources.
2. Methodology
2.1. Design of the Proposed UETWPP
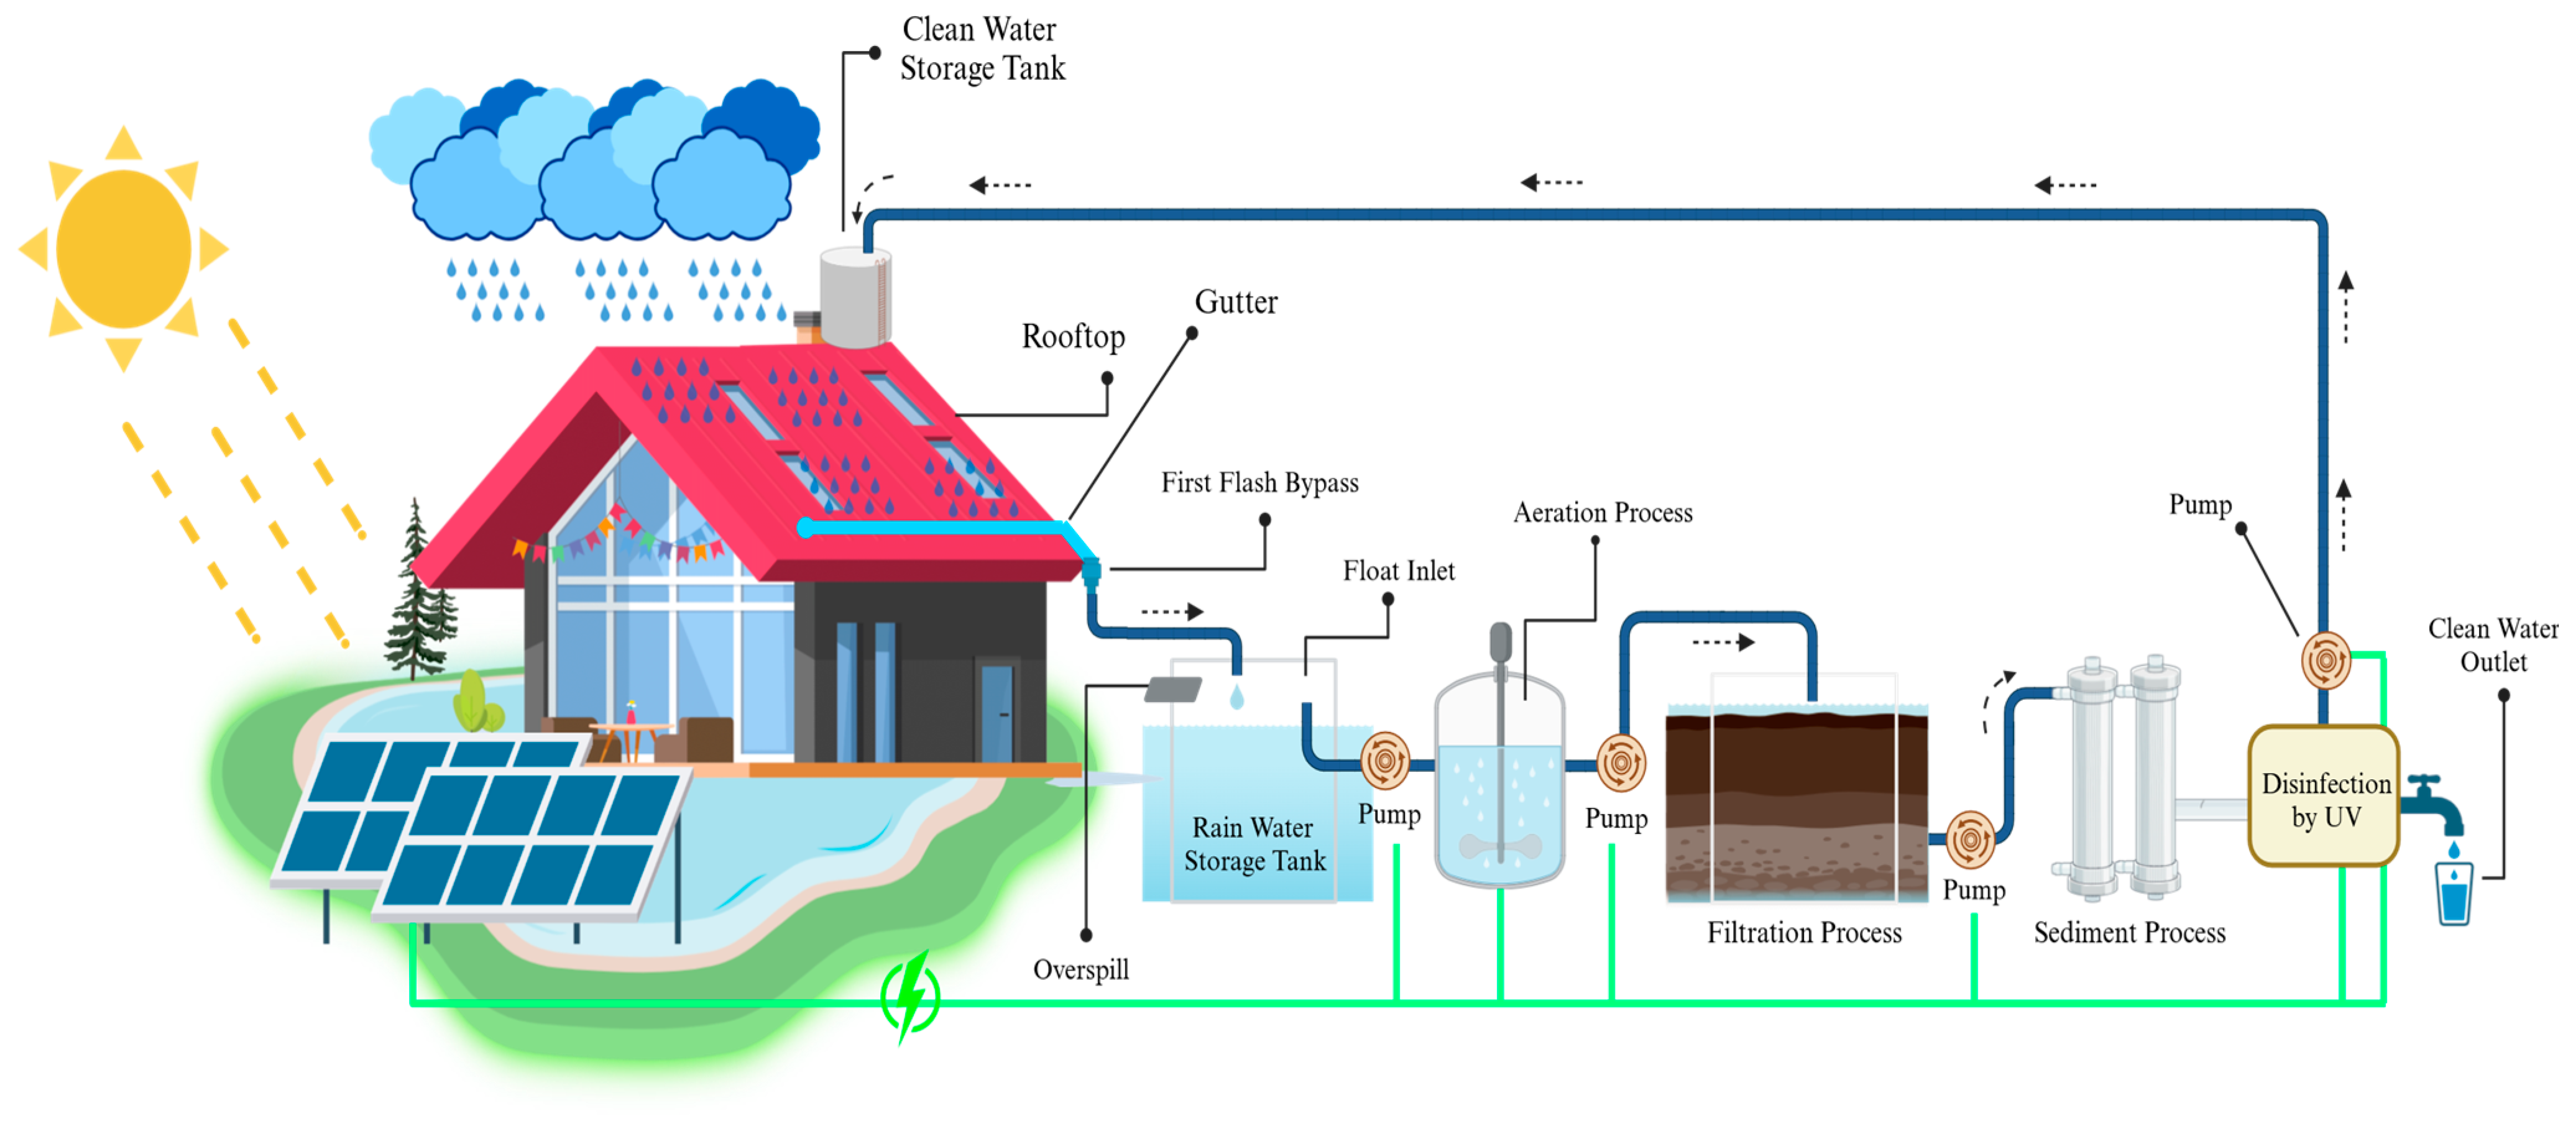
A schematic representation outlining the sequential progression of proposed unit operations within the UETWPP is illustrated in Figure 1. The main components of the system are a collection system, a conveyance system, a storage facility, and a solar-energy-driven water treatment system. The proposed system consists of the following operation units:
- Rooftop surfaces of different buildings within the campus of UET to harvest rainwater and connected to a conveyance system of gutters and downpipes,
- A rainwater storage tank to collect and store rainwater runoff from rooftops and other surfaces to ensure a constant supply of water during dry periods,
- The aeration process unit to improve water quality by removing dissolved gases (such as carbon dioxide) and volatile organic compounds (VOCs). Aeration also helps prevent the growth of anaerobic bacteria, which can produce unpleasant odors and affect water quality,
- The absorption and sediment filtrations, refering to the use of materials like zeolite to remove contaminants such as heavy metals, organic matter, and some chemicals from the rainwater. Zeolites are crystalline aluminosilicate minerals with a porous structure. Common types of zeolites used in water filtration include clinoptilolite. The specific type of zeolite used in rainwater filtration is based on factors such as availability, cost, and performance characteristics [41]. Clinoptilolite is a type of zeolite with unique properties, and its effectiveness in treating rainwater can vary depending on the circumstances. The clinoptilolite type is selected because it is known for its ability to adsorb ammonium ions and its advantages in removing heavy metals [42,43,44]. This process also helps to prevent the clogging of pipes and filters downstream and ensures that the water is clear and free from visible contaminants,
- UV (Ultraviolet) disinfection to kill or inactivate harmful microorganisms, including bacteria, viruses, and protozoa, present in rainwater. The wavelength used for UV disinfection in rainwater treatment is around 254 nm, because this is particularly effective at damaging the DNA of microorganisms, rendering them unable to reproduce or cause infections.
Commencing the treatment procedure is the extraction of untreated water from the rainwater storage tank, facilitated by an automated rainwater-pump system. The initial unit process involves aeration to deal with secondary water-quality aspects like odor and flavor by eliminating gases stemming from biological processes in the rainwater storage tank. Table 1 shows a comprehensive overview of the specifications associated with each unit operation.
2.2. Sampling Collection
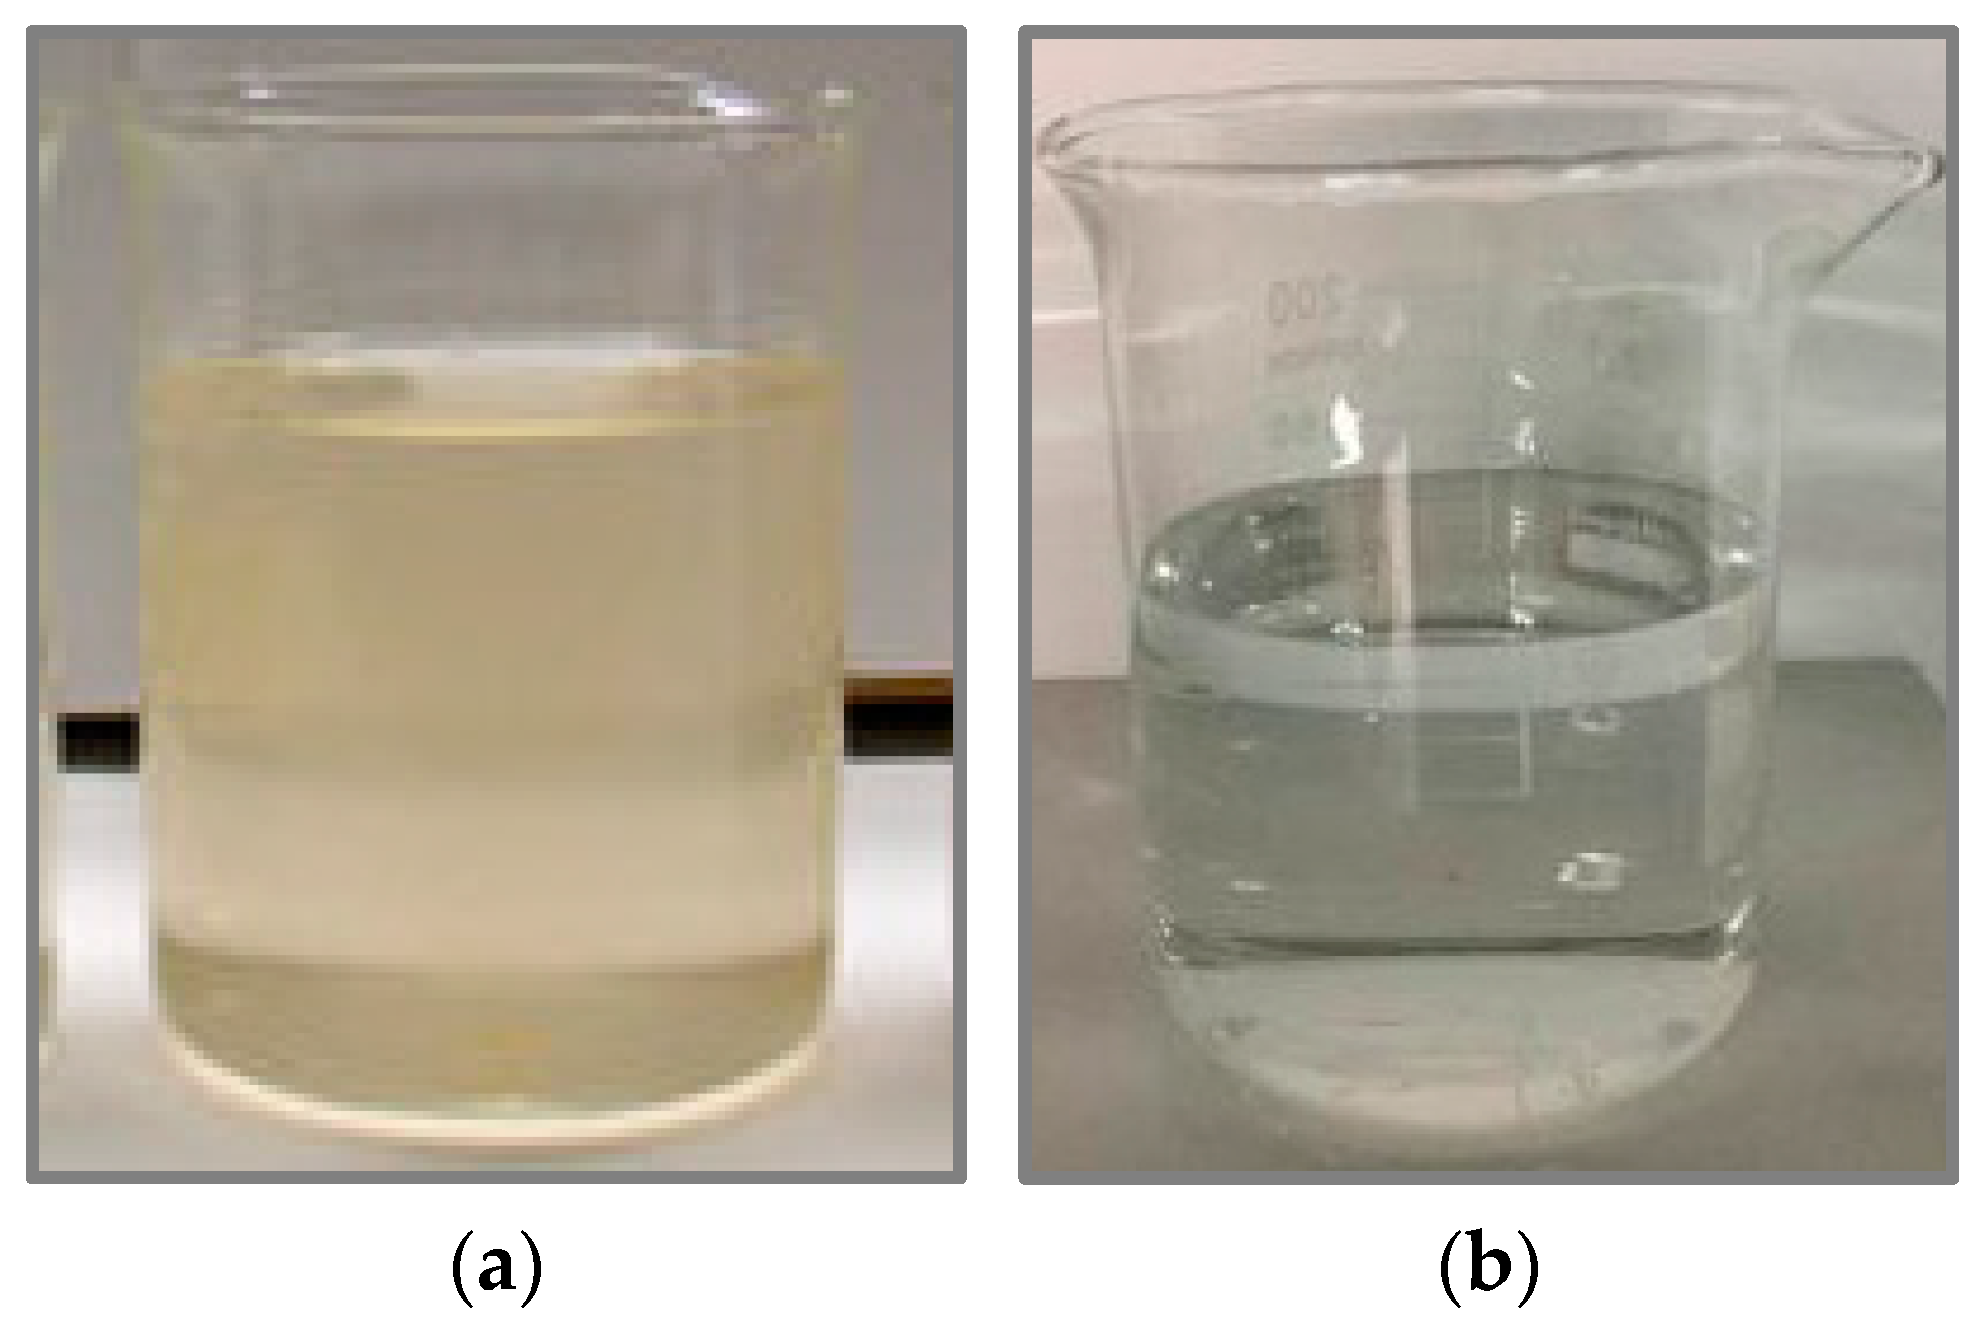
The UETWPP is introduced in a pilot showcase to fulfil the drinking water requirements of a building accommodating a population of 130 individuals, accounting for each individual’s daily drinking demand of 3 L. Throughout the period spanning from July 2022 to June 2023, a total of 24 samples were collected. Specifically, 12 samples were obtained at the beginning of each month from untreated water, as seen in Figure 2a, and an additional 12 samples were drawn from treated water, as seen in Figure 2b.
2.3. Water Quality Assessment
Descriptive statistical analysis was performed on both treated and untreated water samples to ensure compliance with the drinking water quality standards set by the Pakistan Council of Research in Water Resource (PCRWR) and the World Health Organization (WHO). The physical, chemical, and biological parameters included in this investigation were ammoniacal nitrogen, nitrite nitrogen content, nitrate nitrogen content, sulfur, iron, lead, arsenic, manganese, mercury, cadmium, selenium, chromium, nickel, sulfate, total dissolved solids (TDS), zinc, potential hydrogen, hardness, turbidity, coliform, E. coli, and odor.
To identify the most influential pollutants in the samples, principal component analysis (PCA) was utilized. PCA is a statistical technique used for data exploration that is commonly employed to identify patterns and relationships within a dataset. PCA transforms a high-dimensional dataset into a lower-dimensional space while retaining most of the original information. This involved constructing a scree plot illustrating eigenvalues plotted against twenty-two water-quality parameters. By closely examining the PCA chart, the contribution of each variable was scrutinized to comprehend its impact. Variables with eigenvalues surpassing 1 were identified as having a significant role in elucidating the overall variability within the dataset. Subsequently, component loading analysis was conducted to classify the attributes within the water samples into specific categories. For the untreated samples, pairwise comparisons were performed to investigate the relationships between different components. In line with some previous studies, PCA was utilized to assess the groundwater’s quality [45]. Fan et al. [46] conducted a study across three regions in India and demonstrated the variables that contributed the maximum variance in the water quality. They also utilized the latent factors contributing the maximum total variance in water quality at high and low flows of water. However, Zhang, et al. [47] conducted an analysis of different sampling sites and, through the application of PCA, reduced them to minimally distinct sites characterized by similar water quality. In the study conducted by Jia et al. [48], PCA and cluster analysis were utilized to investigate the sources of groundwater pollution. A similar study by Ashraf et al. [49] utilized the PCA method to assess the presence of heavy metals in water and identify the major contributors that impact water quality.
Furthermore, the Friedman test was utilized to analyze differences among multiple samples and rank the components in both untreated and treated rainwater samples, considering their mean values. The Friedman test ranks the observations within each sample and then compares the average ranks across samples. It determines whether there are significant differences among the samples, based on the ranks. If the Friedman test yields statistically significant results, it indicates that at least one of the samples differs significantly from the others, but it does not specify which group(s) differ.
3. Results and Discussion
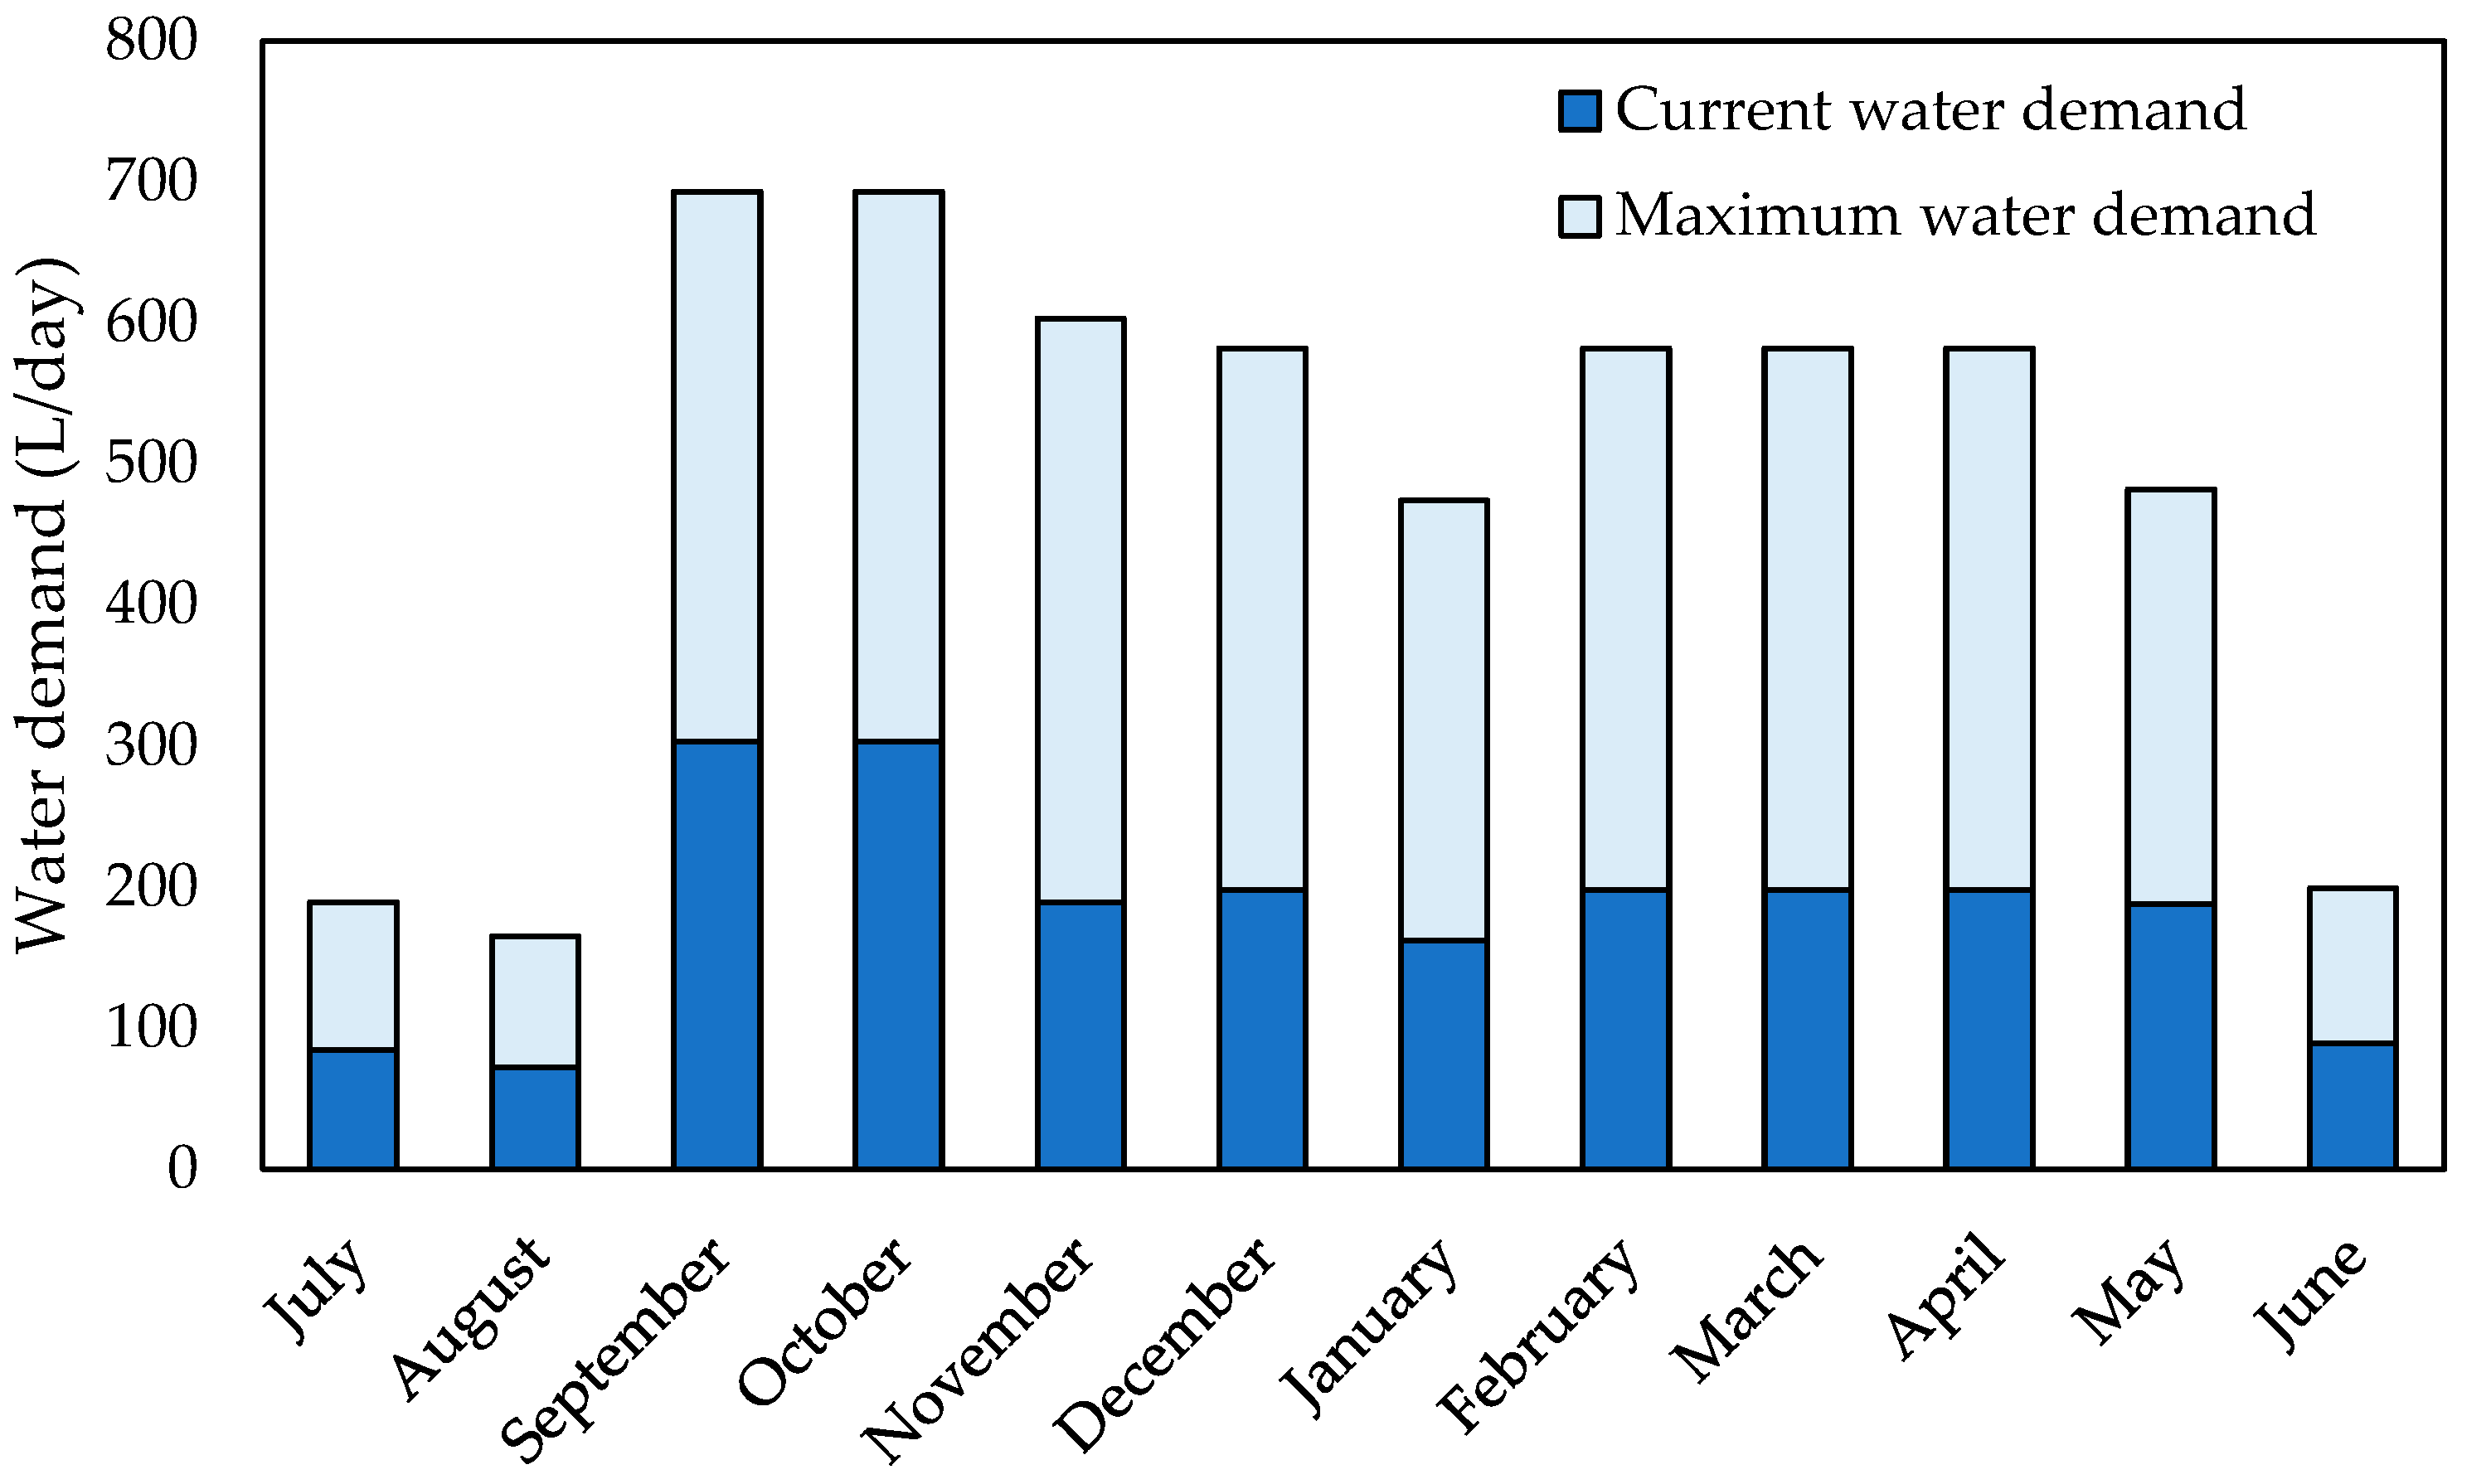
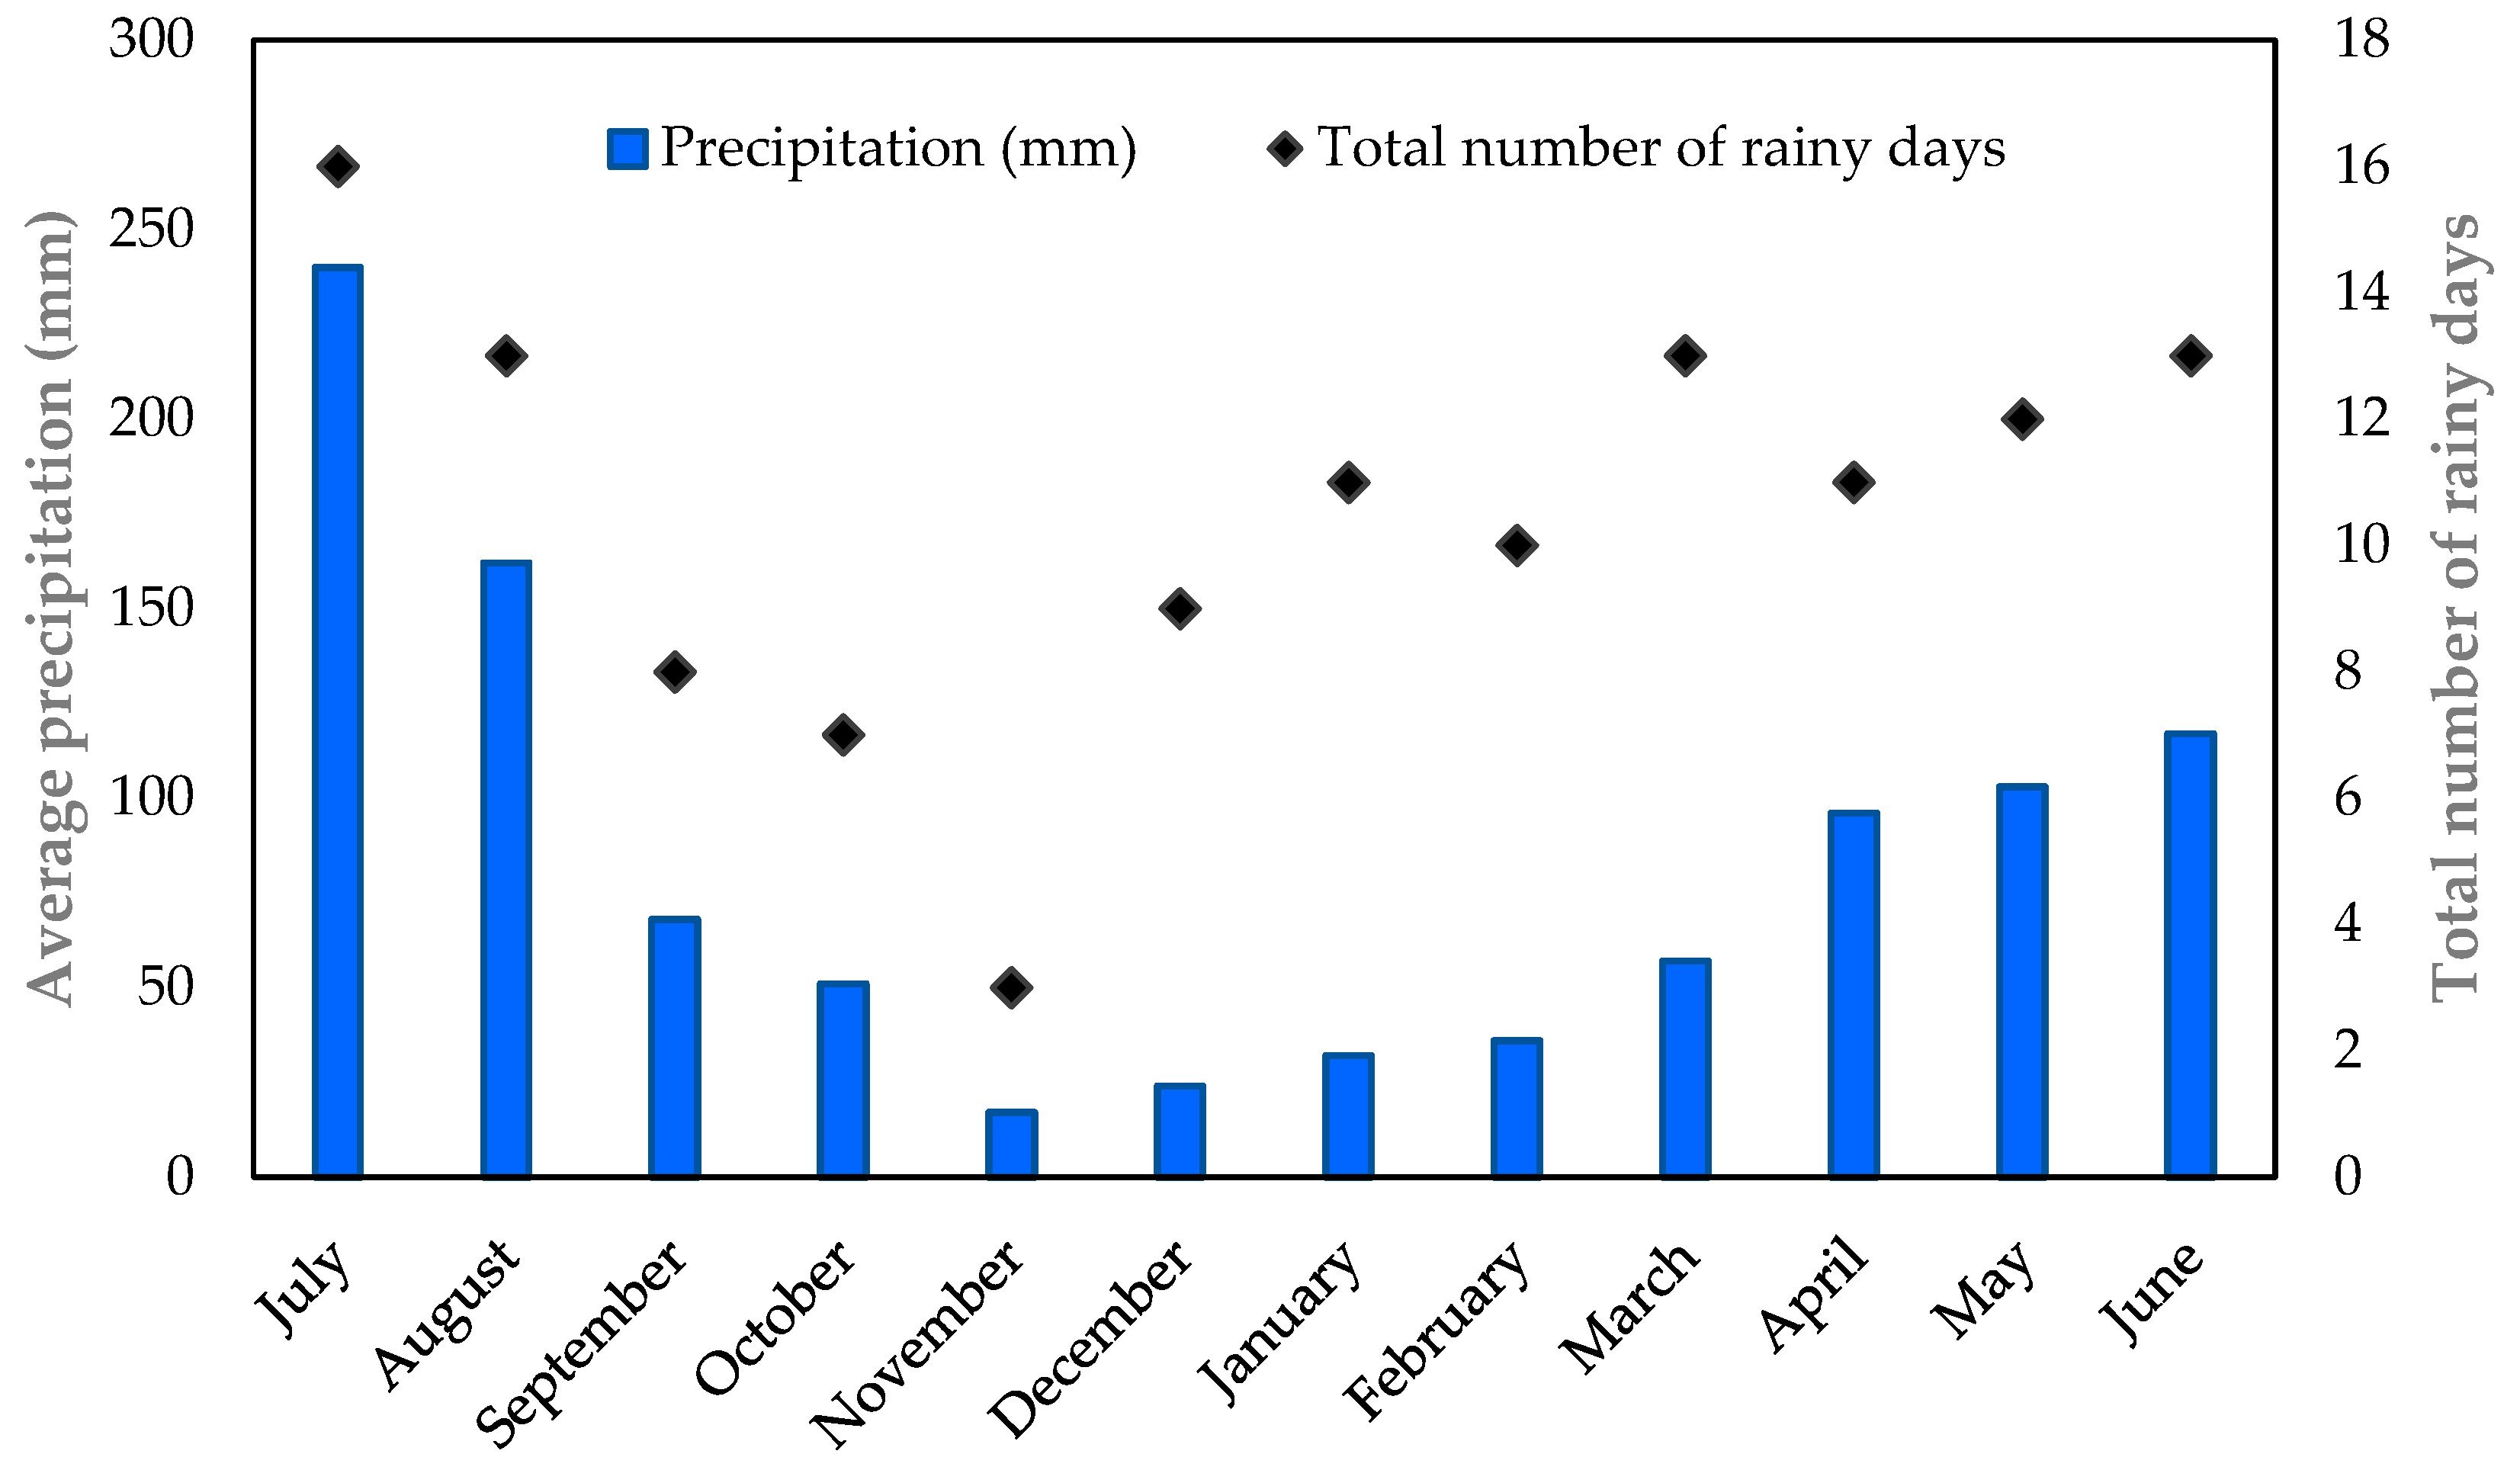
The UETWPP has been designed with a capacity of 570 L per day. Depicted in Figure 3 is the fluctuation between the potential maximum water demand and the actual water demand for the building. Anticipating the highest number of occupants, including students and faculty members (totaling 130), the projected maximum demand for drinking water was estimated at 390 L per day. Notably, due to new admissions and the commencement of a new academic session, the UET building experienced increased utilization by students and external individuals. This led to the peak demand occurring in September and October. Conversely, the period between June and August saw a reduction in water demand, coinciding with the summer break for students and faculty. During this phase, water demand decreased as only administrative staff and shift-based workers were present. Figure 4 graphically presents the monthly precipitation levels from July 2022 to June 2023. The data were obtained from the Pakistan Meteorological Department. The most significant levels of rainfall were recorded in July and August, coinciding with the monsoon season. On the other hand, the period from November to February is typically regarded as the cold and dry season. Nevertheless, March and April exhibit varying temperatures. Lastly, May and June are characterized by hot and arid weather conditions. The selection of water sources (rainwater or network supply) to meet water demand is automated, based on predetermined criteria. For example, if the rainwater storage level is above a certain threshold, the system uses rainwater. If it falls below that threshold, it switches to the network supply.
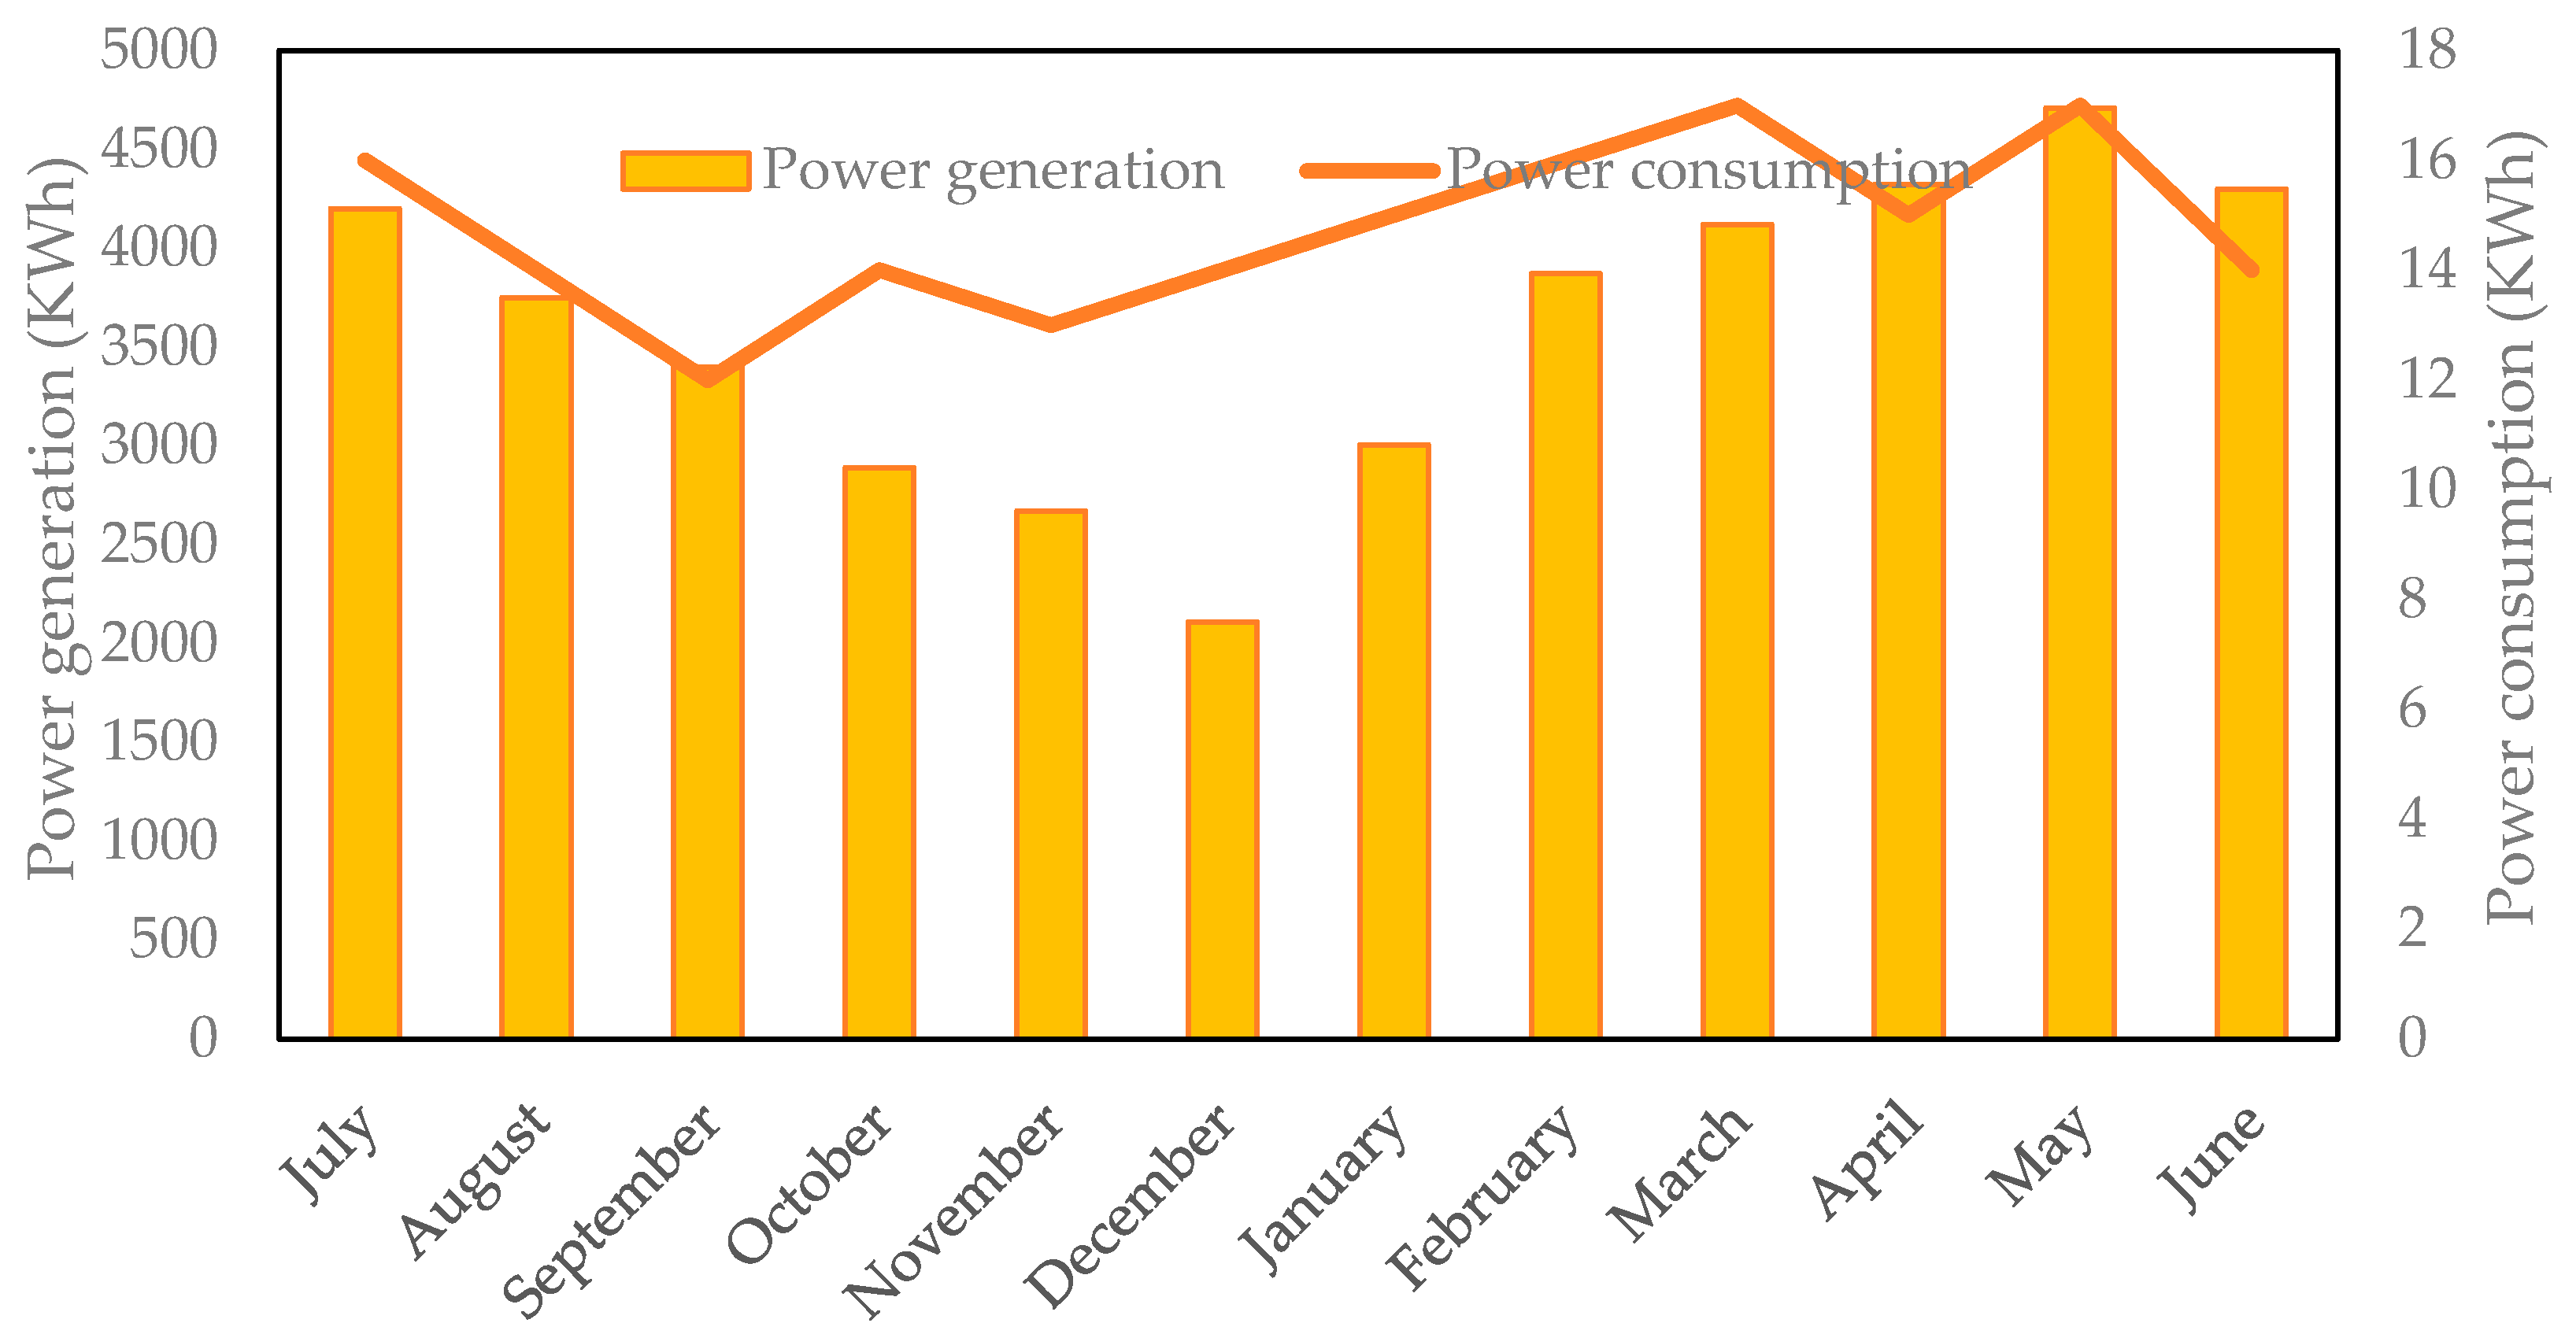
A solar power system with a capacity of 30 kW, comprising 120 solar panels, was successfully installed on the rooftop of the UET building in 2019. Figure 5 shows the real-time monthly power generation of the building. On average, the building generated approximately 3612 kWh of power per month. Notably, the peak power production was achieved in May, reaching a maximum of 4710 kWh per month. Subsequently, this production gradually diminished, reaching its lowest point of 2110 kWh per month in December. However, the average monthly power consumption is approximately 14.75 KWh. The maximum power consumption was observed in May due to the summer season, while the minimum power consumption was observed in December due to winter and vacation. The envisaged UETWPP unit is designed to operate between 8 a.m. and 4 p.m., exclusively on working days. This operational schedule ensures a consistent pattern of power consumption throughout the year, promoting stability in the system’s energy usage.
3.1. Untreated Rainwater Quality
3.1.1. Descriptive Analysis
The descriptive statistics for the various parameters found in the untreated water samples are presented in Table 2. Coliform emerges with the highest average value, measuring 1684 CFU/100 mL, spanning a range from 130 to 9800 CFU/100 mL. Conversely, sulfate exhibits the least contribution. Ammoniacal nitrogen (NH3-N) was recorded at 0.4692 mg/L on average, fluctuating between 0.04 to 0.87 mg/L. Selenium (Se), nickel (Ni), and chromium (Cr) each display an average value of 0.01 mg/L. The average potential hydrogen (PH) value stands at 7.7, encompassing a range from 7.1 to 8.4. Iron (Fe) was reported at an average of 0.0525 mg/L, with values spanning between 0.02 to 0.08 mg/L. The average odor score is 6, while lead (Pb) was recorded at an average of 0.002 mg/L, ranging from 0.001 to 0.004 mg/L. Total dissolved solids exhibit an average of 132 mg/L, with a range spanning from 28 to 409 mg/L. Average nitrite (NO2) and nitrate (NO3) nitrogen content values are 0.41392 and 3.0992 mg/L, respectively. Hardness averages at 15.92 mg/L, varying between 7 to 21 mg/L. Mercury’s (Hg) average concentration is 0.0002 mg/L, spanning a range from 0.0001 to 0.0003 mg/L. Zinc’s (Zn) average stands at 0.4125 mg/L, within a range from 0.04 to 1.51 mg/L. Arsenic (Ar) maintains an average of 0.0009 mg/L, spanning from 0 to 0.005 mg/L. Turbidity is reported at an average of 1.1 nephelometric turbidity units (NTU), with a range between 0.49 to 1.41 mg/L. Cadmium’s (Cd) average concentration is 0.0003 mg/L. Manganese (Mg) exhibits an average of 0.01 mg/L, ranging from 0.001 to 0.02 mg/L. The average sulfur (S) concentration is 0.025 mg/L, varying from 0.02 to 0.04 mg/L. The average concentration of E. coli is 456 CFU/100 mL, ranging from 6 to 2900 CFU/100 mL.
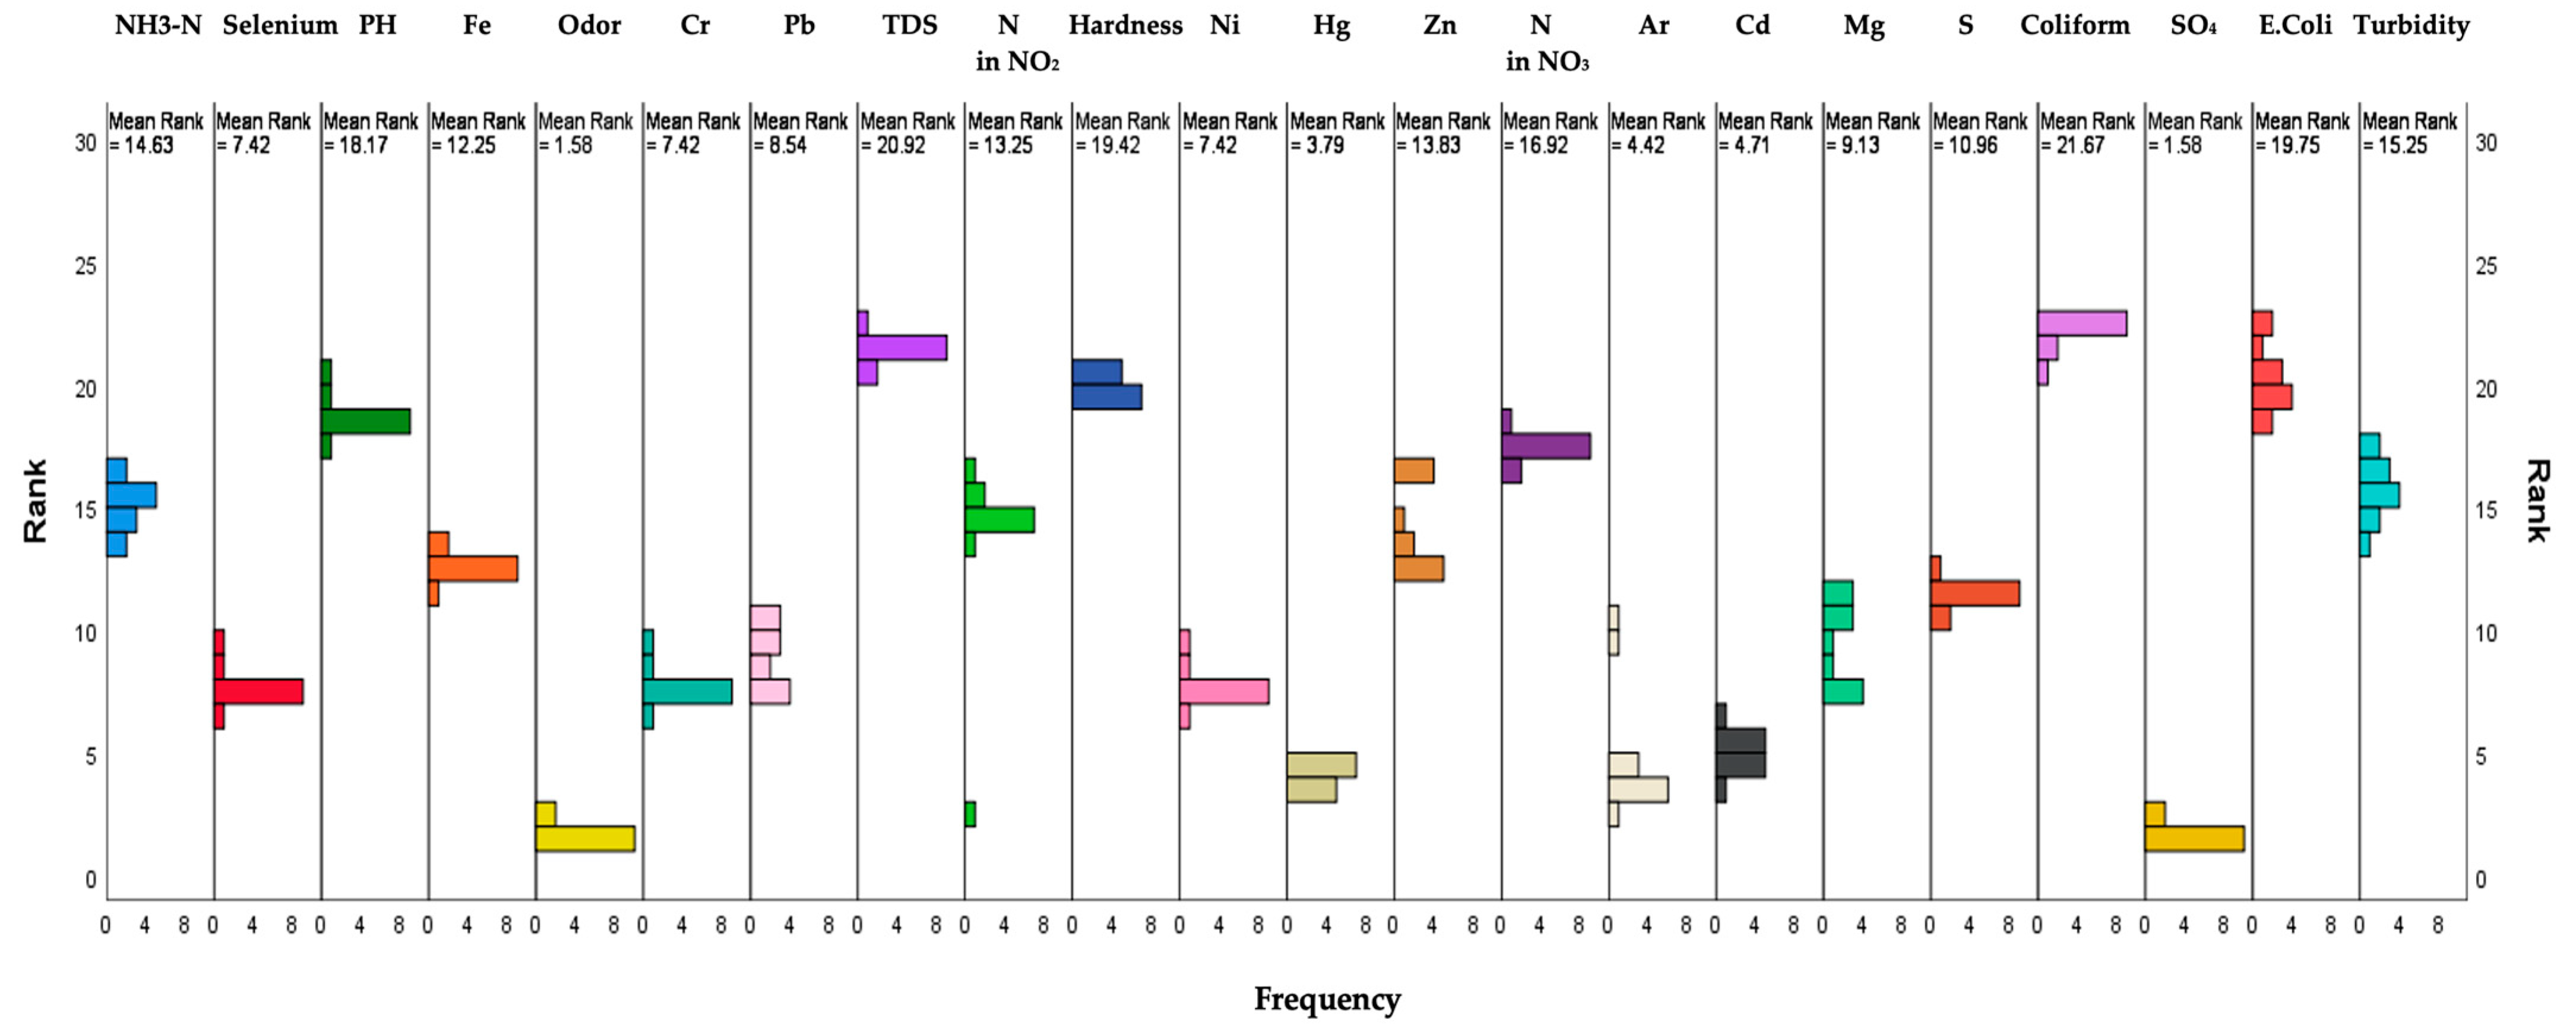
Figure 6 illustrates the outcome of Friedman’s descriptive analysis. Each component is denoted by a point on the graph, with its mean value positioned along the horizontal axis and its corresponding rank along the vertical axis. The ranking is established based on mean values, attributing lower ranks to components with higher mean values and vice versa. Effectively, the graph provides insight into how the components relate to one another in terms of mean values and ranks. Higher mean values and lower ranks signify components with greater significance or influence, while those with lower mean values and higher ranks have relatively lower importance. Coliform has the highest mean value (Figure 6), which shows a greater influence on rainwater quality.
3.1.2. Principal Component Analysis (PCA)
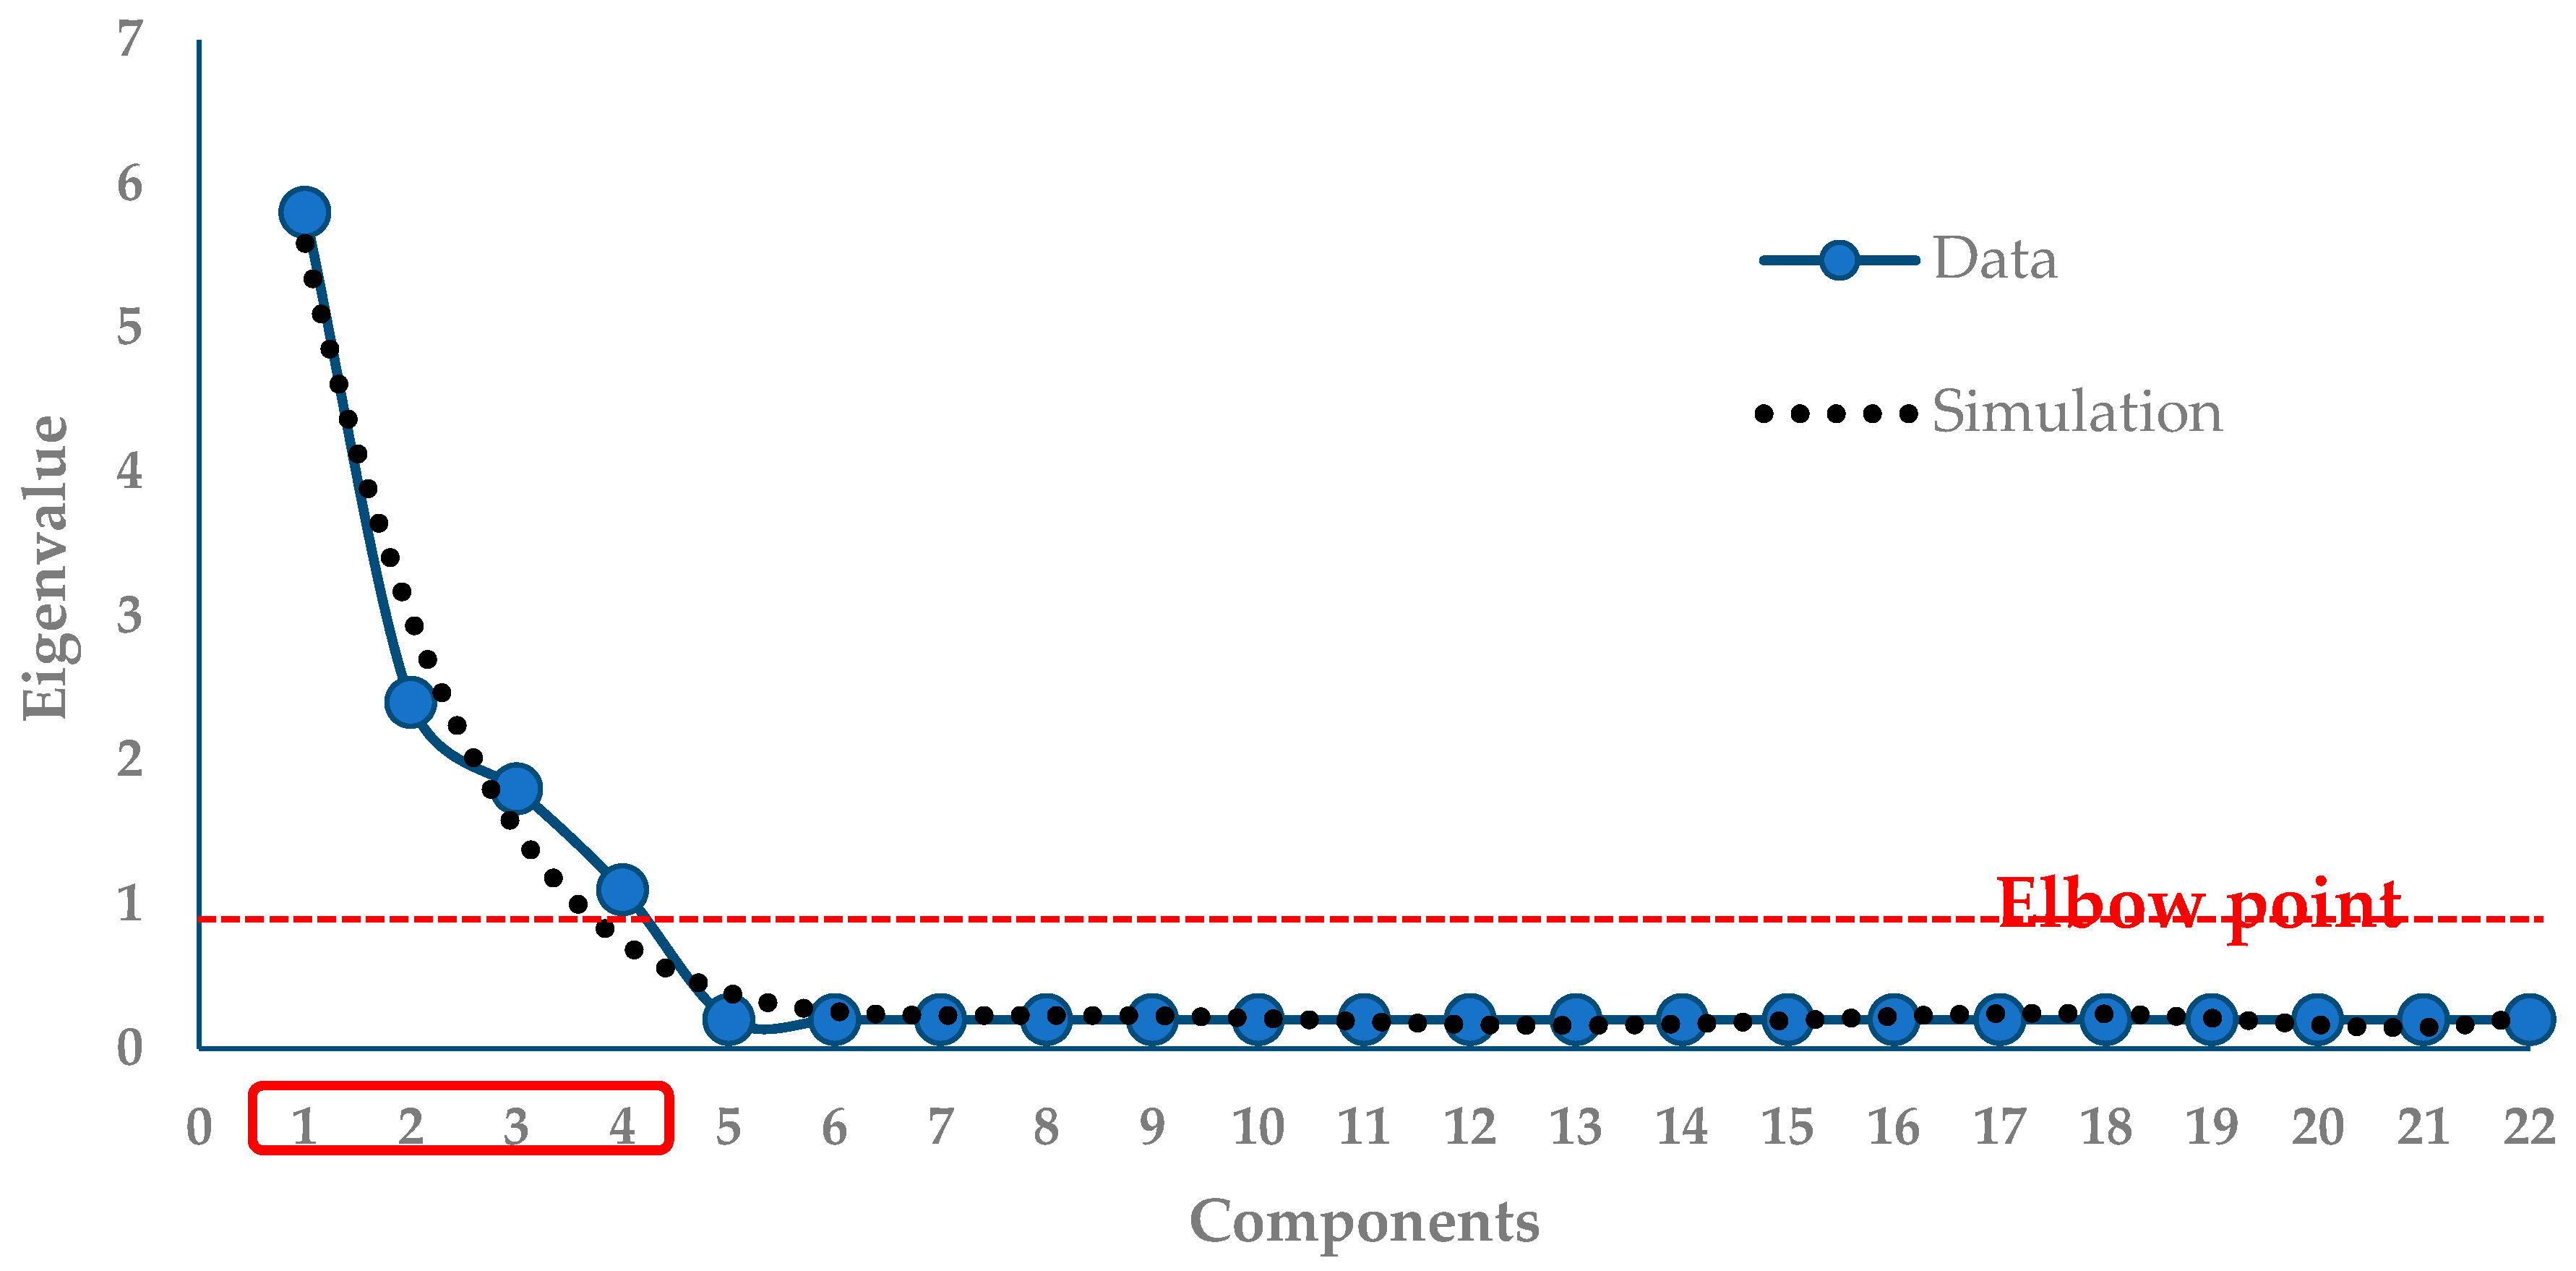
Table 3 presents the transformation of twenty-two variables into four primary factors, each making substantial contributions. Component 1 contributes to a cumulative total of 39.075%, component 2 accounts for a cumulative total of 55.038%, component 3 contributes to a cumulative total of 67.160%, and component 4 contributes to a cumulative total of 86.810%. Collectively, these four components account for a significant portion of approximately 86.810% of the variance observed in the untreated rainwater samples. In Figure 7, the x-axis corresponds to the principal component number, while the y-axis represents the eigenvalues. It is noteworthy that four components exhibit eigenvalues surpassing 1. This crucial point, often referred to as the “elbow point”, signifies where these components distinctly contribute to the overall variance, becoming pivotal in the analysis.
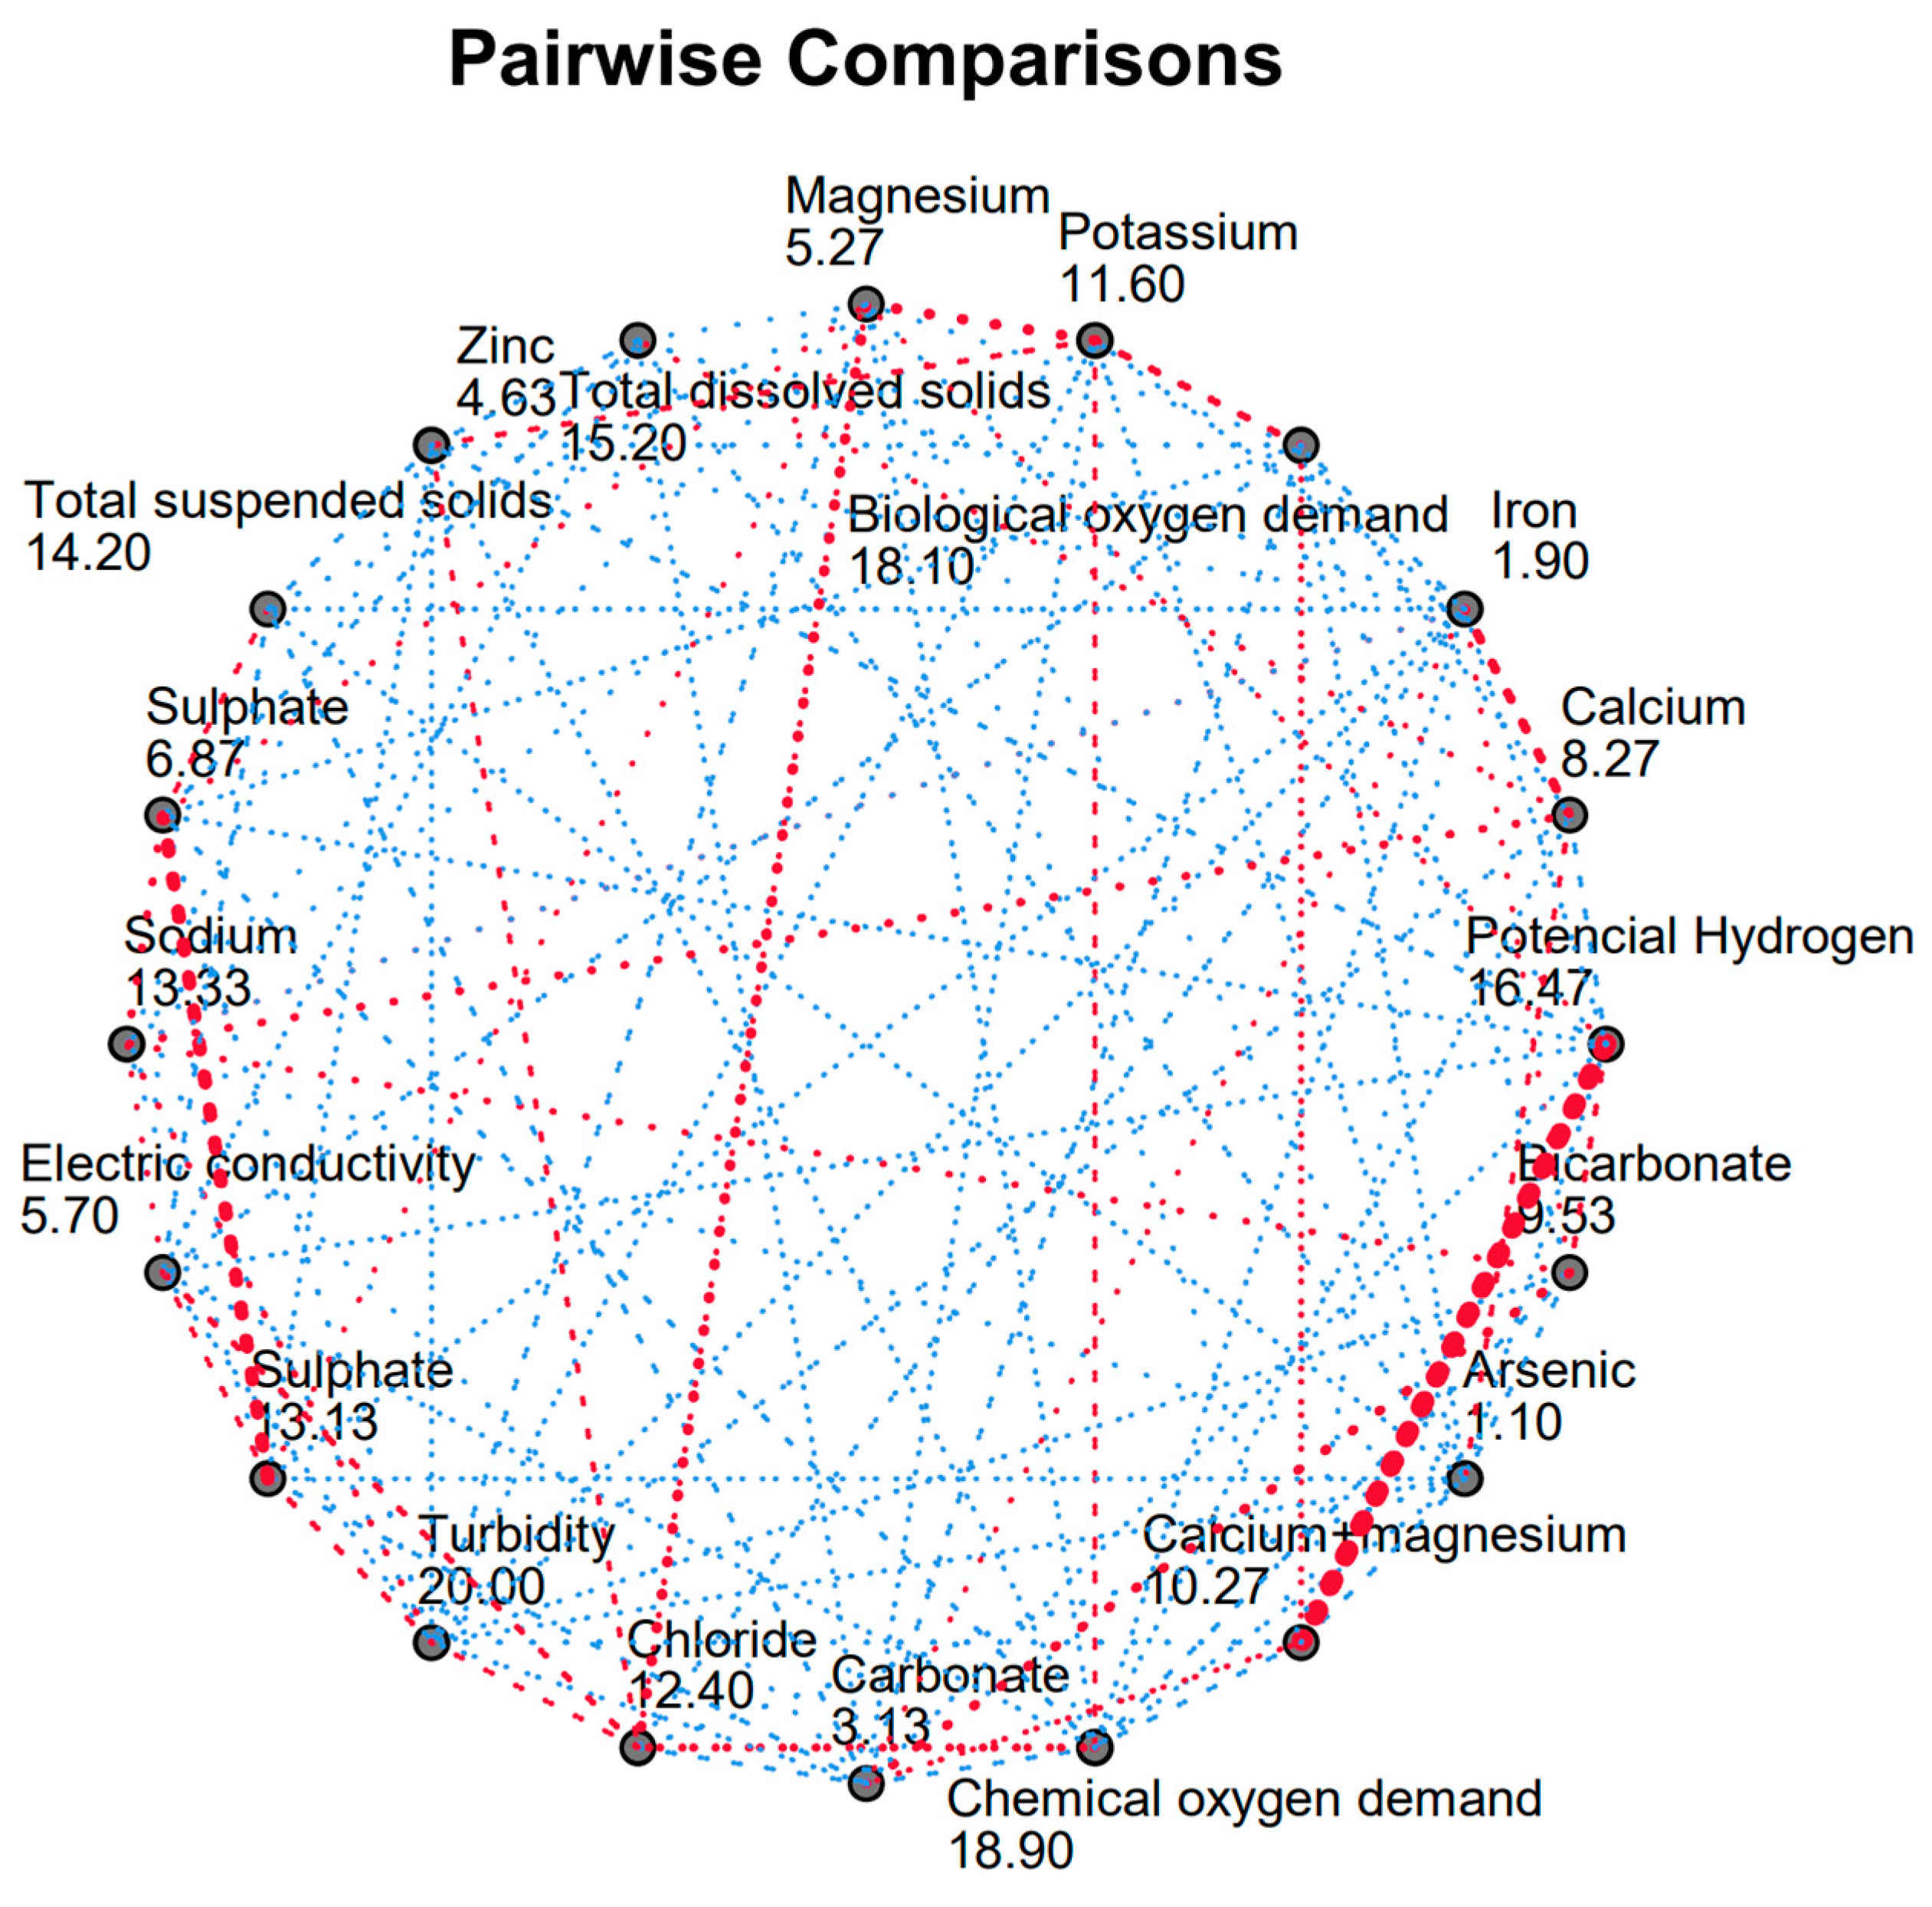
In the context of untreated rainwater, the analysis presented in Figure 8 involves a pairwise comparison of its components. This comparison aims to assess the significance of the relationships between different components. The results are visually represented using lines on the graph. Components that exhibit a significant relationship with each other are denoted by a blue line, indicating their strong correlation. Conversely, components that lack a significant relationship are represented by a red line, suggesting the absence of a meaningful connection between these variables.
Table 4 illustrates the loading of various components onto four distinct factors. Factor 1 encompasses zinc, ammoniacal nitrogen, nitrite-bound nitrogen, sulfur, nitrate-bound nitrogen, iron, lead, arsenic, manganese, mercury, cadmium, selenium, chromium, nickel, and sulfate. This factor contributes to a cumulative variance of 39.075%. Factor 2 includes total dissolved solids, pH (potential hydrogen), hardness, and turbidity, collectively contributing to a total variance of 55.058%. Factor 3 involves coliform bacteria and E. coli, contributing to a total variance of 77.150%, and factor 4 predominantly contains the element of odor, which contributes to 86.810% of the overall variance. Factor 1 consolidates the loading of 15 metal components, factor 2 synthesizes the loading of 4 inorganic elements, and factor 3 condenses the loading of 2 microbiological elements. Factor 4 is primarily associated with the secondary parameter of odor.
3.2. Treated Rainwater Quality
Descriptive Analysis
Table 5 provides a comprehensive overview of the descriptive statistics for the various components present in the treated water samples. Notably, the highest average value is attributed to total dissolved solids, measuring 25.167 mg/L after undergoing treatment. This parameter’s range spans from 14 to 38 mg/L post-treatment. Remarkably, the removal of odor, E. coli, and coliform was complete in the treated water. Ammoniacal nitrogen demonstrates an average value of 0.133 mg/L, exhibiting variations from 0.02 to 0.46 mg/L. Similarly, selenium, lead, and chromium each exhibit an average concentration of 0.01 mg/L. Nickel’s average concentration measures at 0.0002 mg/L, fluctuating between 0.0001 to 0.0003 mg/L. The average potential hydrogen (pH) value of the treated water stands at 7.09, encompassing a range from 6.4 to 7.6. Iron is reported at an average concentration of 0.0225 mg/L, with values ranging from 0.01 to 0.04 mg/L. Nitrite and nitrate nitrogen content display average values of 0.11358 and 1.3943 mg/L, respectively. Water hardness averages 13.33 mg/L, with variations between 9 to 17 mg/L. Mercury exhibits an average concentration of 0.0002 mg/L, spanning a range from 0.0001 to 0.0003 mg/L, while zinc’s average concentration is 0.0275 mg/L, within a range from 0.01 to 0.04 mg/L. Arsenic maintains an average concentration of 0.002900 mg/L, spanning from 0.0004 to 0.008 mg/L. Turbidity is reported at an average of 0.4917 NTU, with a range between 0.24 to 0.74 NTU. Manganese exhibits an average concentration of 0.01075 mg/L, ranging from 0.001 to 0.023 mg/L. Lastly, the average sulfur concentration is 0.0225 mg/L, varying from 0.02 to 0.03 mg/L. Figure 9 depicts the application of Friedman’s descriptive analysis to the treated water sample. Notably, the highest mean rank was found in the category of total dissolved solids. The graph is organized based on these mean ranks, highlighting the comparative ranking of different components within the treated water sample. Table 6 illustrates the quality benchmarks for drinking water, which have been harmonized with both the PCRWR and the guidelines established by the WHO. A thorough analysis of the table reveals that the treated water not only meets all the specifications outlined by Pakistan’s drinking-water-quality standards but also aligns seamlessly with the criteria established by the WHO. This alignment underscores the effectiveness of a sustainable treatment approach in ensuring the fulfillment of these stringent quality requirements. Regular and meticulous inspection and cleaning of gutters and downpipes are necessary.
Naddeo et al. [50] conducted a study that yielded similar findings, examining the treatment of rainwater through filtration and absorption techniques. Their research focused on the use of granular activated carbon (GAC) as a filter medium to achieve maximum removal of turbidity, E. coli, and coliform from rainwater. Santos and Urbanetz Junior [51] investigated the quality of rainwater after passing it through an ultraviolet germicidal (UV) lamp and using a descent filter. Their results demonstrated a 100% removal of coliform from the rainwater. Pineda et al. [52] utilized Illite as a filter medium for rainwater treatment and analyzed its effectiveness in removing coliform, iron, and E. coli through UV disinfection. Furthermore, a comparative study was conducted on UV and UV self-doped nanotubes, revealing that UV self-doped nanotubes exhibited the highest efficiency in rainwater treatment [53]. Do Couto et al. [54] employed an anaerobic filter in the absorption unit along with UV disinfection for rainwater treatment, achieving satisfactory results suitable for drinking purposes.
4. Conclusions
The proposed UETWPP approach effectively addresses the requirement for high-quality drinking water within the building, catering to the needs of a population of 130 individuals. This achievement is made possible through the utilization of stored rainwater as the primary water source, with solar power as an external source of energy. The comprehensive evaluation conducted using multivariate analysis techniques identified several key components that play a significant role in the composition of untreated rainwater. These components include metals, inorganic elements, microbiological parameters, and secondary elements. These constituents collectively influence the overall quality of the rainwater before it undergoes purification. The remarkable efficacy of the UETWPP becomes evident when assessing its impact on enhancing water quality. The treatment process effectively targets and mitigates the presence of the identified components—metals, inorganic elements, microbiological parameters, and secondary elements—thereby aligning the treated rainwater with the stringent water-quality standards established by both the national regulatory authorities in Pakistan and the globally recognized World Health Organization (WHO) guidelines.
This underscores the process’s efficiency and its capability to successfully elevate untreated rainwater to a level of portability that meets established international benchmarks. Despite being limited to a pilot project demonstration, this approach possesses the capability to yield substantial outcomes in addressing the difficulties posed by water scarcity in regions with restricted availability of this invaluable resource.
The study’s limitations encompass several key considerations. Firstly, the seasonal nature of rainfall could pose challenges in ensuring a consistent year-round water supply, particularly in regions with distinct dry seasons. Secondly, rainwater collected from surfaces may be exposed to contaminants such as bird droppings, dust, and microorganisms, necessitating rigorous treatment methods to ensure its safety for drinking purposes. Additionally, the reliance on solar energy for treatment may face reliability issues in adverse weather conditions (cloudy weather), suggesting the need for energy storage or backup power solutions. Lastly, in urban areas like Lahore, known for its pollution, rainwater quality can vary, adding a significant dimension to the challenges faced in rainwater harvesting. These limitations provide valuable insights for guiding future research and practical solutions in this domain.
It is crucial to conduct comprehensive studies to understand the long-term performance and reliability of the suggested solar-driven water-treatment system across various environmental conditions. By monitoring these systems over a long time period and under different climatic scenarios, invaluable insights into their practicality and resilience can be gained. Moreover, future research efforts should be directed toward the effectiveness of water-treatment processes to address specific challenges to water quality in diverse regions. This involves considering the removal of contaminants that are unique to each area and optimizing treatment protocols to meet local water-quality standards. Comparative studies conducted in different geographic locations can help identify the best practices and adapt technologies accordingly. Furthermore, integrating data analytics and artificial intelligence (AI) in analyzing harvested rainwater quality and solar-driven water-treatment systems should be explored. Developing AI models that can predict fluctuations in water quality based on weather patterns, pollution sources, and treatment parameters can significantly enhance system efficiency and reliability. Further investigation is also crucial to evaluate the economic feasibility and potential return on investment of the rainwater harvesting system.
Author Contributions
Formal analysis, B.K.; software, B.K.; writing—original draft preparation, B.K.; validation, B.K. and A.A.; Conceptualization, B.K. and A.A.; methodology, B.K. and A.A.; investigation, B.K. and A.A.; resources, A.A.; data curation, B.K. and A.A.; writing—review and editing, A.A.; visualization B.K. and A.A. All authors have read and agreed to the published version of the manuscript.
Funding
This research received no external funding.
Institutional Review Board Statement
Not applicable.
Informed Consent Statement
Not applicable.
Data Availability Statement
All data are presented in the manuscript.
Acknowledgments
Researchers would like to thank the Deanship of Scientific Research, Qassim University for funding publication of this project.
Conflicts of Interest
The authors declare no conflict of interest.
References
- Richards, S.; Rao, L.; Connelly, S.; Raj, A.; Raveendran, L.; Shirin, S.; Jamwal, P.; Helliwell, R. Sustainable water resources through harvesting rainwater and the effectiveness of a low-cost water treatment. J. Environ. Manag. 2021, 286, 112223. [Google Scholar]
- Ertop, H.; Kocięcka, J.; Atilgan, A.; Liberacki, D.; Niemiec, M.; Rolbiecki, R. The Importance of Rainwater Harvesting and Its Usage Possibilities: Antalya Example (Turkey). Water 2023, 15, 2194. [Google Scholar]
- Bañas, K.; Robles, M.E.; Maniquiz-Redillas, M. Stormwater Harvesting from Roof Catchments: A Review of Design, Efficiency, and Sustainability. Water 2023, 15, 1774. [Google Scholar]
- Rubio-Arias, H.; Contreras-Caraveo, M.; Quintana, R.M.; Saucedo-Teran, R.A.; Pinales-Munguia, A. An overall water quality index (WQI) for a man-made aquatic reservoir in Mexico. Int. J. Environ. Res. Public Health 2012, 9, 1687–1698. [Google Scholar] [CrossRef] [PubMed]
- Grant, S.B.; Saphores, J.-D.; Feldman, D.L.; Hamilton, A.J.; Fletcher, T.D.; Cook, P.L.; Stewardson, M.; Sanders, B.F.; Levin, L.A.; Ambrose, R.F. Taking the “waste” out of “wastewater” for human water security and ecosystem sustainability. Science 2012, 337, 681–686. [Google Scholar]
- Chu, H.-J.; Liu, C.-Y.; Wang, C.-K. Identifying the relationships between water quality and land cover changes in the tseng-wen reservoir watershed of Taiwan. Int. J. Environ. Res. Public Health 2013, 10, 478–489. [Google Scholar] [CrossRef]
- Llopart-Mascaró, A.; Ruiz, R.; Martínez, M.; Malgrat, P.; Rusiñol, M.; Gil, A.; Suárez, J.; Puertas, J.; del Rio, H.; Paraira, M. Analysis of rainwater quality. Towards a sustainable rainwater management in urban environments-Sostaqua Project. In Proceedings of the Novatech 2010-7ème Conférence Internationale sur les Techniques et Stratégies Durables pour la Gestion des eaux Urbaines par Temps de pluie/7th International Conference on Sustainable Techniques and Strategies for Urban Water Management, Lyon, France, 27 June–1 July 2010; pp. 1–10. [Google Scholar]
- Ashraf, I.; Li, R.; Chen, B.; Al-Ansari, N.; Rizwan Aslam, M.; Altaf, A.R.; Elbeltagi, A. Nanoarchitectonics and Kinetics Insights into Fluoride Removal from Drinking Water Using Magnetic Tea Biochar. Int. J. Environ. Res. Public Health 2022, 19, 13092. [Google Scholar] [CrossRef]
- Teng, H.; Altaf, A.R. Elemental mercury (Hg0) emission, hazards, and control: A brief review. J. Hazard. Mater. Adv. 2022, 5, 100049. [Google Scholar]
- Altaf, A.R.; Teng, H.; Zheng, M.; Ashraf, I.; Arsalan, M.; Rehman, A.U.; Gang, L.; Pengjie, W.; Yongqiang, R.; Xiaoyu, L. One-step synthesis of renewable magnetic tea-biochar derived from waste tea leaves for the removal of Hg0 from coal-syngas. J. Environ. Chem. Eng. 2021, 9, 105313. [Google Scholar]
- Birhanu, B.Z.; Tabo, R. Shallow wells, the untapped resource with a potential to improve agriculture and food security in southern Mali. Agric. Food Secur. 2016, 5, 5. [Google Scholar]
- Rockström, J.; Karlberg, L.; Wani, S.P.; Barron, J.; Hatibu, N.; Oweis, T.; Bruggeman, A.; Farahani, J.; Qiang, Z. Managing water in rainfed agriculture—The need for a paradigm shift. Agric. Water Manag. 2010, 97, 543–550. [Google Scholar]
- Wu, Y.-Y.; Ma, Y.-Z.; Cui, H.-X.; Liu, J.-X.; Sun, Y.-R.; Shang, B.; Su, X. Radon concentrations in drinking water in Beijing City, China and contribution to radiation dose. Int. J. Environ. Res. Public Health 2014, 11, 11121–11131. [Google Scholar] [CrossRef] [PubMed]
- Boers, T.M.; Ben-Asher, J. A review of rainwater harvesting. Agric. Water Manag. 1982, 5, 145–158. [Google Scholar]
- Li, Z.; Boyle, F.; Reynolds, A. Rainwater harvesting and greywater treatment systems for domestic application in Ireland. Desalination 2010, 260, 1–8. [Google Scholar] [CrossRef]
- Rahman, S.; Khan, M.; Akib, S.; Din, N.B.C.; Biswas, S.; Shirazi, S. Sustainability of rainwater harvesting system in terms of water quality. Sci. World J. 2014, 2014, 721357. [Google Scholar] [CrossRef]
- Makropoulos, C.K.; Butler, D. Distributed water infrastructure for sustainable communities. Water Resour. Manag. 2010, 24, 2795–2816. [Google Scholar] [CrossRef]
- Piro, P.; Turco, M.; Palermo, S.A.; Principato, F.; Brunetti, G. A comprehensive approach to stormwater management problems in the next generation drainage networks. In The Internet of Things for Smart Urban Ecosystems; Spring: Berlin/Heidelberg, Germany, 2019; pp. 275–304. [Google Scholar]
- Hashemi, S.S.G.; Mahmud, H.B.; Ashraf, M.A. Performance of green roofs with respect to water quality and reduction of energy consumption in tropics: A review. Renew. Sustain. Energy Rev. 2015, 52, 669–679. [Google Scholar]
- Jury, W.A.; Vaux, H., Jr. The role of science in solving the world’s emerging water problems. Proc. Natl. Acad. Sci. USA 2005, 102, 15715–15720. [Google Scholar] [CrossRef]
- Sizirici, B.; Fseha, Y.; Cho, C.-S.; Yildiz, I.; Byon, Y.-J. A review of carbon footprint reduction in construction industry, from design to operation. Materials 2021, 14, 6094. [Google Scholar]
- Parece, T.E.; Grossman, L.; Geller, E.S. Reducing carbon footprint of water consumption: A case study of water conservation at a university campus. Clim. Change Water Resour. 2013, 25, 199–218. [Google Scholar]
- Cosgrove, W.J.; Loucks, D.P. Water management: Current and future challenges and research directions. Water Resour. Res. 2015, 51, 4823–4839. [Google Scholar] [CrossRef]
- Helmreich, B.; Horn, H. Opportunities in rainwater harvesting. Desalination 2009, 248, 118–124. [Google Scholar] [CrossRef]
- Ya’acob, M.E.; Zulkifli, S.A.; Zulkifli, N.; Iskandar, A.N.; Othman, M.H.; Zaidi, M.L.A. GIS Mapping for Rainwater Harvesting in Ground-mounted Large Scale Solar PV Farms. In Proceedings of the 2022 IEEE International Conference in Power Engineering Application (ICPEA), Shah Alam, Malaysia, 7–8 March 2022; pp. 1–6. [Google Scholar]
- Kaya, M. Evaluation of the existing solar energy and rainwater potential in the Total roof area of buildings: Izmit District example. Adv. Mater. Sci. Eng. 2020, 2020, 8167402. [Google Scholar]
- Elasaad, H.; Bilton, A.; Kelley, L.; Duayhe, O.; Dubowsky, S. Field evaluation of a community scale solar powered water purification technology: A case study of a remote Mexican community application. Desalination 2015, 375, 71–80. [Google Scholar] [CrossRef]
- Kumar, K.R.; Kulgod, S.P.; Surendran, A. Simulation and analysis of energy harvesting from Grey water and rain water in high rises. In Proceedings of the 2016 IEEE Region 10 Symposium (TENSYMP), Bali, Indonesia, 9–11 May 2016; pp. 404–409. [Google Scholar]
- Levallois, P.; Villanueva, C.M. Drinking water quality and human health: An editorial. Int. J. Environ. Res. Public Health 2019, 16, 631. [Google Scholar] [CrossRef]
- Davies, G.I.; McIver, L.; Kim, Y.; Hashizume, M.; Iddings, S.; Chan, V. Water-borne diseases and extreme weather events in Cambodia: Review of impacts and implications of climate change. Int. J. Environ. Res. Public Health 2015, 12, 191–213. [Google Scholar] [CrossRef] [PubMed]
- Praveen, P.K.; Ganguly, S.; Wakchaure, R.; Para, P.A.; Mahajan, T.; Qadri, K.; Kamble, S.; Sharma, R.; Shekhar, S.; Dalai, N. Water-borne diseases and its effect on domestic animals and human health: A Review. Int. J. Emerg. Technol. Adv. Eng. 2016, 6, 242–245. [Google Scholar]
- World Health Organization. Guidelines for Drinking-Water Quality; World Health Organization: Geneva, Switzerland, 2004; Volume 1. [Google Scholar]
- Karanis, P.; Kourenti, C.; Smith, H. Waterborne transmission of protozoan parasites: A worldwide review of outbreaks and lessons learnt. J. Water Health 2007, 5, 1–38. [Google Scholar] [CrossRef]
- Edition, F. Guidelines for drinking-water quality. WHO Chron. 2011, 38, 104–108. [Google Scholar]
- Sanders, K.T.; King, C.W.; Stillwell, A.S.; Webber, M.E. Clean energy and water: Assessment of Mexico for improved water services and renewable energy. Environ. Dev. Sustain. 2013, 15, 1303–1321. [Google Scholar]
- Chiu, Y.-R.; Tsai, Y.-L.; Chiang, Y.-C. Designing rainwater harvesting systems cost-effectively in a urban water-energy saving scheme by using a GIS-simulation based design system. Water 2015, 7, 6285–6300. [Google Scholar] [CrossRef]
- Dobrowsky, P.; Carstens, M.; De Villiers, J.; Cloete, T.; Khan, W. Efficiency of a closed-coupled solar pasteurization system in treating roof harvested rainwater. Sci. Total Environ. 2015, 536, 206–214. [Google Scholar] [CrossRef] [PubMed]
- Amin, M.T.; Han, M. Roof-harvested rainwater for potable purposes: Application of solar disinfection (SODIS) and limitations. Water Sci. Technol. 2009, 60, 419–431. [Google Scholar] [CrossRef] [PubMed]
- Patange, S.D.; Nimbkar, N.; Rajvanshi, A.K. Low cost drinking water technology–rainwater harvesting with solar purification. Curr. Sci. 2020, 118, 872. [Google Scholar] [CrossRef]
- Chen, S.; Wang, H.; Yang, W.; Zhang, D. Research on City Energy Conservation Basing Rainwater Utilization. Procedia Environ. Sci. 2012, 12, 72–78. [Google Scholar] [CrossRef]
- Palanivell, P.; Ahmed, O.H.; Susilawati, K.; Ab Majid, N.M. Mitigating ammonia volatilization from urea in waterlogged condition using clinoptilolite zeolite. Int. J. Agric. Biol. 2015, 17, 149–155. [Google Scholar]
- Vassileva, P.; Voikova, D. Investigation on natural and pretreated Bulgarian clinoptilolite for ammonium ions removal from aqueous solutions. J. Hazard. Mater. 2009, 170, 948–953. [Google Scholar] [CrossRef]
- Sprynskyy, M.; Buszewski, B.; Terzyk, A.P.; Namieśnik, J. Study of the selection mechanism of heavy metal (Pb2+, Cu2+, Ni2+, and Cd2+) adsorption on clinoptilolite. J. Colloid Interface Sci. 2006, 304, 21–28. [Google Scholar] [CrossRef]
- Zendelska, A.; Golomeova, M.; Jakupi, S.; Lisichkov, K.; Kuvendziev, S.; Marinkovski, M. Characterization and application of clinoptilolite for removal of heavy metal ions from water resources. Geol. Maced. 2018, 32, 21–32. [Google Scholar]
- Alam, A.; Singh, A. Groundwater quality assessment using SPSS based on multivariate statistics and water quality index of Gaya, Bihar (India). Environ. Monit. Assess. 2023, 195, 687. [Google Scholar] [CrossRef]
- Fan, X.; Cui, B.; Zhao, H.; Zhang, Z.; Zhang, H. Assessment of river water quality in Pearl River Delta using multivariate statistical techniques. Procedia Environ. Sci. 2010, 2, 1220–1234. [Google Scholar] [CrossRef]
- Zhang, Y.; Guo, F.; Meng, W.; Wang, X.-Q. Water quality assessment and source identification of Daliao river basin using multivariate statistical methods. Environ. Monit. Assess. 2009, 152, 105–121. [Google Scholar] [CrossRef] [PubMed]
- Jia, C.; Altaf, A.R.; Li, F.; Ashraf, I.; Zafar, Z.; Nadeem, A.A. Comprehensive assessment on groundwater quality, pollution characteristics, and ecological health risks under seasonal thaws: Spatial insights with Monte Carlo simulations. Groundw. Sustain. Dev. 2023, 22, 100952. [Google Scholar]
- Ashraf, I.; Ahmad, F.; Sharif, A.; Altaf, A.R.; Teng, H. Heavy metals assessment in water, soil, vegetables and their associated health risks via consumption of vegetables, District Kasur, Pakistan. SN Appl. Sci. 2021, 3, 552. [Google Scholar] [CrossRef]
- Naddeo, V.; Scannapieco, D.; Belgiorno, V. Enhanced drinking water supply through harvested rainwater treatment. J. Hydrol. 2013, 498, 287–291. [Google Scholar] [CrossRef]
- Santos, F.d.R.; Urbanetz Junior, J. Rain Water Treatment by Ultraviolet Radiation Using Photovoltaic Energy. Braz. Arch. Biol. Technol. 2022, 65. [Google Scholar] [CrossRef]
- Pineda, E.; Guaya, D.; Rivera, G.; García-Ruiz, M.; Osorio, F. Rainwater treatment: An approach for drinking water provision to indigenous people in Ecuadorian Amazon. Int. J. Environ. Sci. Technol. 2022, 19, 8769–8782. [Google Scholar] [CrossRef]
- Wu, Z.; Ye, Y.; Cai, T.; Jiang, W.; Ren, Y.; Liu, D.; Zhang, T.; Zhang, Y. Synergistic Effect of Self-Doped TiO2 Nanotube Arrays and Ultraviolet (UV) on Enhanced Disinfection of Rainwater. Water Air Soil Pollut. 2022, 233, 416. [Google Scholar] [CrossRef]
- Do Couto, E.d.A.; Calijuri, M.L.; Assemany, P.P.; da Fonseca Santiago, A.; Lopes, L.S. Greywater treatment in airports using anaerobic filter followed by UV disinfection: An efficient and low cost alternative. J. Clean. Prod. 2015, 106, 372–379. [Google Scholar] [CrossRef]
Figure 1.
Layout of the proposed UETWPP. Arrows indicate the water flow within the system.

Figure 2.
Samples of (a) untreated collected rainwater; and (b) rainwater treated by UETWPP.

Figure 3.
Current and maximum monthly water demand of UET building.

Figure 4.
Monthly precipitation patterns in the study area from July 2022 to June 2023 (source: Pakistan Meteorological Department, 2023).
Figure 4.
Monthly precipitation patterns in the study area from July 2022 to June 2023 (source: Pakistan Meteorological Department, 2023).

Figure 5.
Monthly power generation and consumption by solar panels between July 2022 until June 2023.
Figure 5.
Monthly power generation and consumption by solar panels between July 2022 until June 2023.

Figure 6.
Mean ranks of components present in untreated rainwater, based on Freidman’s test.

Figure 7.
Scree plot diagram. The red box indicates the number of components that can be retained.

Figure 8.
Pairwise comparison analysis.

Figure 9.
Mean rank of components in treated rainwater, based on Friedman’s test.


Table 1.
Specifications of operation units in the proposed UETWPP.
| Operation Unit | Specifications |
|---|---|
| Aeration unit | Height: 950 mm |
| Consumption of power: 55 W | |
| Volume: 190 L | |
| Retention time: 75 min | |
| Width: 360 mm | |
| Filtration unit | Height: 450 mm |
| Diameter of particle: 1.3–1.5 mm | |
| Width: 350 mm | |
| Filter: Zeolite (clinoptilolite) | |
| Surface area of filter media: 350–400 m2/g | |
| Supplier: Lahore industrial filters supplier | |
| Nature: Mild acidic | |
| Weight: 41.5 kg | |
| Sedimentation unit | Temperature: 0–45 °C |
| Rating of micron: 3 micron | |
| Height: 230 mm | |
| Width: 80 mm | |
| Disinfection unit of UV | Temperature: 5–40 °C |
| Flow rate: 2 L/min | |
| Consumption of power: 25 W Wavelength: 254 nm |
Table 2.
Descriptive statistics of untreated rainwater components.
| Minimum Statistic | Maximum Statistic | Mean | Std. Deviation Statistic | Variance Statistic | ||
|---|---|---|---|---|---|---|
| Statistic | Std. Error | |||||
| Ammoniacal nitrogen (mg L−1) | 0.04 | 0.87 | 0.4692 | 0.06890 | 0.23869 | 0.057 |
| Selenium (mg L−1) | 0.001 | 0.001 | 0.00100 | 0.000000 | 0.000000 | 0.000 |
| Potential hydrogen (pH) | 7.1 | 8.4 | 7.708 | 0.1145 | 0.3965 | 0.157 |
| Iron (mg L−1) | 0.02 | 0.08 | 0.0525 | 0.00538 | 0.01865 | 0.000 |
| Odor | 3 | 7 | 6 | 0.0045 | 0.00541 | 0.000 |
| Chromium (mg L−1) | 0.001 | 0.001 | 0.00100 | 0.000000 | 0.000000 | 0.000 |
| Lead (mg L−1) | 0.001 | 0.004 | 0.00200 | 0.000369 | 0.001279 | 0.000 |
| Total dissolved solids (TDS) (mg L−1) | 28.2 | 409.7 | 132.192 | 35.3146 | 122.3334 | 14,965.455 |
| Amount of N in nitrite (mg L−1) | 0.046 | 1.407 | 0.41392 | 0.111271 | 0.385456 | 0.149 |
| Hardness (mg L−1 CaCO3) | 7 | 21 | 15.92 | 1.104 | 3.825 | 14.629 |
| Nickel (mg L−1) | 0.001 | 0.001 | 0.00100 | 0.000000 | 0.000000 | 0.000 |
| Mercury (mg L−1) | 0.0001 | 0.0003 | 0.000200 | 0.0000213 | 0.0000739 | 0.000 |
| Zinc (mg L−1) | 0.04 | 1.51 | 0.4125 | 0.15761 | 0.54598 | 0.298 |
| Amount of N in nitrate (mg L−1) | 0.30 | 8.30 | 3.0992 | 0.83389 | 2.88867 | 8.344 |
| Arsenic (mg L−1) | 0.0000 | 0.0050 | 0.000942 | 0.0005478 | 0.0018976 | 0.000 |
| Turbidity (NTU) | 0.49 | 1.41 | 1.1 | 0.0138 | 0.3145 | 0.139 |
| Cadmium (mg L−1) | 0.0003 | 0.0003 | 0.000300 | 0.0000000 | 0.0000000 | 0.000 |
| Manganese (mg L−1) | 0.001 | 0.023 | 0.01075 | 0.002975 | 0.010306 | 0.000 |
| Sulfur (mg L−1) | 0.02 | 0.04 | 0.0250 | 0.00230 | 0.00798 | 0.000 |
| Coliform (CFU/100 mL) | 130 | 9800 | 1684.17 | 829.417 | 2873.185 | 8,255,190.152 |
| Sulfate (mg L−1) | 0.00001 | 0.00002 | 0.00001 | 0.0000341 | 0.0112 | 0.000 |
| E. coli (CFU/100 mL) | 6.00 | 2900.00 | 456.0833 | 249.96956 | 865.91995 | 749,817.356 |
Table 3.
Total variance of components.
| Component | Initial Eigenvalues | Extraction Sums of Squared Loadings | ||||
|---|---|---|---|---|---|---|
| Total | % of Variance | Cumulative % | Total | % of Variance | Cumulative % | |
| 1 | 5.861 | 39.075 | 39.075 | 5.861 | 39.075 | 39.075 |
| 2 | 2.394 | 15.963 | 55.038 | 2.394 | 15.963 | 55.038 |
| 3 | 1.817 | 12.112 | 77.150 | 1.817 | 12.112 | 67.150 |
| 4 | 1.449 | 9.660 | 86.810 | 1.449 | 9.660 | 76.810 |
| 5 | 1.083 | 7.219 | 87.028 | |||
| 6 | 0.885 | 5.903 | 89.931 | |||
| 7 | 0.656 | 4.373 | 94.304 | |||
| 8 | 0.487 | 3.247 | 97.551 | |||
| 9 | 0.209 | 1.396 | 98.947 | |||
| 10 | 0.133 | 0.886 | 99.833 | |||
| 11 | 0.025 | 0.167 | 100.000 | |||
| 12 | 4.937 × 10⁻¹⁶ | 3.291 × 10⁻¹⁵ | 100.000 | |||
| 13 | 3.842 × 10⁻¹⁶ | 2.561 × 10⁻¹⁵ | 100.000 | |||
| 14 | −2.715 × 10⁻¹⁶ | −2.030 × 10⁻¹⁵ | 100.000 | |||
| 15 | −1.895 × 10⁻¹⁶ | −1.870 × 10⁻¹⁵ | 100.000 | |||
| 16 | −1.755 × 10⁻¹⁶ | −1.170 × 10⁻¹⁵ | 100.000 | |||
| 17 | −1.623 × 10⁻¹⁶ | −1.618 × 10⁻¹⁵ | 100.000 | |||
| 18 | −1.371 × 10⁻¹⁶ | −1.351 × 10⁻¹⁵ | 100.000 | |||
| 19 | −1.355 × 10⁻¹⁶ | −1.370 × 10⁻¹⁵ | 100.000 | |||
| 20 | −1.229 × 10⁻¹⁷ | −1.519 × 10⁻¹⁶ | 100.000 | |||
| 21 | −1.156 × 10⁻¹⁶ | −1.170 × 10⁻¹⁵ | 100.000 | |||
| 22 | −1.008 × 10⁻¹⁶ | −1.016 × 10⁻¹⁵ | 100.000 | |||
Table 4.
Components Loading in PCA.
| Component | Uniqueness | |||||
|---|---|---|---|---|---|---|
| 1 | 2 | 3 | 4 | |||
| 1 | Zinc | 0.830 | 0.0855 | |||
| 2 | Ammoniacal nitrogen | 0.819 | 0.1583 | |||
| 3 | Amount of N in nitrite | 0.765 | 0.2439 | |||
| 4 | Sulfur | 0.764 | 0.3136 | |||
| 5 | Amount of N in nitrate | 0.763 | 0.2590 | |||
| 6 | Iron | 0.690 | 0.3077 | |||
| 7 | Lead | 0.516 | 0.2912 | |||
| 8 | Arsenic | 0.514 | 0.2344 | |||
| 9 | Manganese | 0.511 | 0.2819 | |||
| 10 | Mercury | 0.507 | 0.2911 | |||
| 11 | Cadmium | 0.505 | 0.3123 | |||
| 12 | Selenium | 0.504 | 0.2983 | |||
| 13 | Chromium | 0.503 | 0.2136 | |||
| 14 | Nickel | 0.503 | 0.2482 | |||
| 15 | Sulfate | 0.501 | 0.2889 | |||
| 16 | Total dissolved solids | 0.860 | 0.2256 | |||
| 17 | Potential hydrogen | 0.807 | 0.1607 | |||
| 18 | Hardness | 0.793 | 0.2148 | |||
| 19 | Turbidity | 0.541 | 0.3585 | |||
| 20 | Coliform | 0.764 | 0.2535 | |||
| 21 | E.coli | 0.705 | 0.3894 | |||
| 22 | Odor | 0.605 | 0.3466 | |||
Table 5.
Descriptive statistics of the physical and chemical elements obtained from treated rainwater samples.
Table 5.
Descriptive statistics of the physical and chemical elements obtained from treated rainwater samples.
| Minimum Statistic | Maximum Statistic | Mean | Std. Deviation Statistic | Variance Statistic | ||
|---|---|---|---|---|---|---|
| Statistic | Std. Error | |||||
| Ammoniacal nitrogen (mg L−1) | 0.02 | 0.46 | 0.1333 | 0.04115 | 0.14253 | 0.020 |
| Selenium (mg L−1) | 0.001 | 0.003 | 0.00167 | 0.000188 | 0.000651 | 0.000 |
| Potential hydrogen | 6.4 | 7.6 | 7.092 | 0.0839 | 0.2906 | 0.084 |
| Iron (mg L−1) | 0.01 | 0.04 | 0.0225 | 0.00305 | 0.01055 | 0.000 |
| Odor | No odor | No odor | No odor | - | - | - |
| Chromium (mg L−1) | 0.001 | 0.001 | 0.00100 | 0.000000 | 0.000000 | 0.000 |
| Lead (mg L−1) | 0.001 | 0.002 | 0.00133 | 0.000142 | 0.000492 | 0.000 |
| Total dissolved solids (mg L−1) | 14.0 | 38.0 | 25.167 | 2.4116 | 8.3539 | 69.788 |
| Amount of N in nitrite (mg L−1) | 0.012 | 0.287 | 0.11358 | 0.027103 | 0.093889 | 0.009 |
| Hardness (mg L−1 CaCO3) | 9 | 17 | 13.33 | 0.711 | 2.462 | 6.061 |
| Nickel (mg L−1) | 0.0001 | 0.0003 | 0.000217 | 0.0000297 | 0.0001030 | 0.000 |
| Mercury (mg L−1) | 0.0001 | 0.0003 | 0.000200 | 0.0000213 | 0.0000739 | 0.000 |
| Zinc (mg L−1) | 0.01 | 0.04 | 0.0275 | 0.00329 | 0.01138 | 0.000 |
| Amount of N in nitrate (mg L−1) | 0.09 | 2.14 | 1.3943 | 0.23101 | 0.80024 | 0.640 |
| Arsenic (mg L−1) | 0.0004 | 0.0080 | 0.002900 | 0.0008191 | 0.0028374 | 0.000 |
| Turbidity (NTU) | 0.24 | 0.74 | 0.4917 | 0.05405 | 0.18722 | 0.035 |
| Cadmium (mg L−1) | 0.0001 | 0.0002 | 0.000133 | 0.0000142 | 0.0000492 | 0.000 |
| Manganese (mg L−1) | 0.001 | 0.023 | 0.01075 | 0.002975 | 0.010306 | 0.000 |
| Sulfur (mg L−1) | 0.02 | 0.03 | 0.0225 | 0.00131 | 0.00452 | 0.000 |
| Coliform (CFU/100 mL) | 0 | 0 | 0.00 | 0.000 | 0.000 | 0.000 |
| Sulfate (mg L−1) | 0.20 | 0.80 | 0.3333 | 0.06435 | 0.22293 | 0.050 |
| E.coli (CFU/100 mL) | 0.00 | 0.00 | 0.0000 | 0.00000 | 0.00000 | 0.000 |
Table 6.
Drinking water standards per the Pakistan water quality standards and the WHO.
| Standards | Requirements Met According to Pakistan Standards | Requirements Met According to WHO Standards | ||
|---|---|---|---|---|
| Pakistan (PCRWR) | WHO | |||
| Metals | ||||
| Zinc (mg L−1) | 3 | - | ✓ | - |
| Ammoniacal nitrogen (mg L−1) | 3 | - | ✓ | - |
| Amount of N in nitrite (mg L−1) | 1 | 3 | ✓ | ✓ |
| Sulfur (mg L−1) | 0.05 | - | ✓ | - |
| Amount of N in nitrate (mg L−1) | 50 | 50 | ✓ | ✓ |
| Iron (mg L−1) | 0.3 | 0.1 | ✓ | ✓ |
| Lead (mg L−1) | 0.02 | 0.01 | ✓ | ✓ |
| Arsenic (mg L−1) | 0.01 | 0.01 | ✓ | ✓ |
| Manganese (mg L−1) | 0.3 | 0.05 | ✓ | ✓ |
| Mercury (mg L−1) | 0.005 | 0.006 | ✓ | ✓ |
| Cadmium (mg L−1) | 0.003 | 0.003 | ✓ | ✓ |
| Selenium (mg L−1) | 0.01 | 0.01 | ✓ | ✓ |
| Chromium (mg L−1) | 0.05 | 0.05 | ✓ | ✓ |
| Nickel (mg L−1) | 0.05 | 0.07 | ✓ | ✓ |
| Sulfate (mg L−1) | 250 | - | ✓ | - |
| Inorganic miscellaneous | ||||
| Total dissolved solids (mg L−1) | 500 | - | ✓ | - |
| Potential hydrogen | 6.5–8.5 | 8.2–8.8 | ✓ | ✓ |
| Hardness (mg L−1 CaCO3) | 200 | - | ✓ | - |
| Turbidity (NTU) | 2 | 1.5 | ✓ | ✓ |
| Microbiological elements | ||||
| Coliform (CFU/100 mL) | 0 | 0 | ✓ | ✓ |
| E.coli (CFU/100 mL) | 0 | 0 | ✓ | ✓ |
| Secondary parameters | ||||
| Odor | No odor | - | ✓ | - |
Disclaimer/Publisher’s Note: The statements, opinions and data contained in all publications are solely those of the individual author(s) and contributor(s) and not of MDPI and/or the editor(s). MDPI and/or the editor(s) disclaim responsibility for any injury to people or property resulting from any ideas, methods, instructions or products referred to in the content. |
© 2023 by the authors. Licensee MDPI, Basel, Switzerland. This article is an open access article distributed under the terms and conditions of the Creative Commons Attribution (CC BY) license (https://creativecommons.org/licenses/by/4.0/).
Share and Cite
MDPI and ACS Style
Khalid, B.; Alodah, A. Multivariate Analysis of Harvested Rainwater Quality Utilizing Sustainable Solar-Energy-Driven Water Treatment. Sustainability 2023, 15, 14568. https://doi.org/10.3390/su151914568
AMA Style
Khalid B, Alodah A. Multivariate Analysis of Harvested Rainwater Quality Utilizing Sustainable Solar-Energy-Driven Water Treatment. Sustainability. 2023; 15(19):14568. https://doi.org/10.3390/su151914568
Chicago/Turabian StyleKhalid, Bisma, and Abdullah Alodah. 2023. "Multivariate Analysis of Harvested Rainwater Quality Utilizing Sustainable Solar-Energy-Driven Water Treatment" Sustainability 15, no. 19: 14568. https://doi.org/10.3390/su151914568
Note that from the first issue of 2016, this journal uses article numbers instead of page numbers. See further details here.