
Remote Sensing Image Information Quality Evaluation via Node Entropy for Efficient Classification


1
School of Electrical Automation and Information Engineering, Tianjin University, Tianjin 300072, China
2
College of Mechanical and Electrical Engineering, Shihezi University, Shihezi 832003, China
3
Department of Horticulture, Faculty of Agriculture, Ataturk University, Erzurum 25240, Turkey
*
Author to whom correspondence should be addressed.
Remote Sens. 2022, 14(17), 4400; https://doi.org/10.3390/rs14174400
Submission received: 28 July 2022
/
Revised: 27 August 2022
/
Accepted: 1 September 2022
/
Published: 4 September 2022
(This article belongs to the Special Issue 3D Information Recovery and 2D Image Processing for Remotely Sensed Optical Images)
Abstract
:Combining remote sensing images with deep learning algorithms plays an important role in wide applications. However, it is difficult to have large-scale labeled datasets for remote sensing images because of acquisition conditions and costs. How to use the limited acquisition budget to obtaina better remote sensing image dataset is a problem worth studying. In response to this problem, this paper proposes a remote sensing image quality evaluation method based on node entropy, which can be combined with active learning to provide low-cost guidance for remote sensing image collection and labeling. The method includes a node selection module and a remote sensing image quality evaluation module. The function of the node selection module is to select representative images, and the remote sensing image quality evaluation module evaluates the remote sensing image information quality by calculating the node entropy of the images. The image at the decision boundary of the existing images has a higher information quality. To validate the method proposed in this paper, experiments are performed on two public datasets. The experimental results confirm the superiority of this method compared with other methods.
1. Introduction
Aerial scene classification aims to label aerial images with specific semantic categories and is a fundamental problem in understanding high-resolution remote sensing images [1]. In recent years, the combination of remote sensing image understanding and advanced methods such as deep learning has greatly improved the perception effect [2,3]. However, deep learning algorithms have a large demand for data. Traditional image classification datasets can easily have large amounts of labeled data. CIFAR-10 [4] has a total of 60,000 images with 6000 images in each class. In 2016, the ImageNet [5] dataset even had over 10 million images. However, for remote sensing images, it is not a good choice to blindly expand the dataset. Because blindly expanding will bring the problem of increasing the cost of collection, labeling, and training [6,7]. The remote sensing image information quality evaluation method is needed to guide the collection and labeling of remote sensing datasets, so that less costs can be used to achieve better intelligent perception effect.
In recent years, in order to reduce the required number of labeled images and reduce the cost, active learning [8] has been developed. The core idea of active learning is according to the sample selection strategy, the model actively selects samples from the pool set for label inquiry and adds these samples to the training set after being labeled by experts. This model can obtain similar or even better results than using a large number of randomly selected samples for training. The design of the sample selection strategy is the key to active learning. The goal is to select samples that are more helpful to the task performance of model training, that is, to select samples with higher sample information quality. Existing active learning algorithms can be roughly divided into uncertainty-based, diversity-based, and model parameter variation-based methods [9]. In the uncertainty-based method, the core idea is to select data that are not easily discriminated by the network to participate in training [10]; in the diversity-based method, the core idea is that the selected data should be distributed as discretely as possible to avoid excessive redundant data being selected [11]; in the model parameter variation-based method, the core idea is that the selected data have more impact on the model. For example, selecting data that can reduce the loss value more [12].
In essence, active learning is to evaluate the information quality of the data, and then the model selects the data with high data information quality for label query [13]. Different from the traditional human-oriented quality evaluation, what is needed here is a network model-oriented data information quality evaluation method. Most of the previous data information quality evaluation methods are based on a single point of view, and the selected data have limitations, such as only considering uncertainty or only diversity, and do not integrate multiple methods. The improvement of model performance is often unsatisfactory. Aiming at the above problems, this paper proposes a method for evaluating the information quality of remote sensing images via node entropy. On the one hand, the information quality evaluation method of node entropy considers the representativeness of the data and avoids labeling too many redundant data. On the other hand, considering the diversity and uncertainty of the data, the selected data should locate at the representative boundary of each node image as much as possible, that is, at the center of the image nodes. On the basis of the remote sensing images information quality evaluation method via node entropy, we combined this method with the active learning strategy to realize the guidance of remote sensing image collection and labeling.
Our contributions are as follows:
- (1)
- Propose a new remote sensing image information quality evaluation method, which can effectively distinguish the information quality of remote sensing images. Combine this method with the active learning strategy can save the image collection cost.
- (2)
- Propose a image node selection method and an image information quality evaluation module via node entropy. The combination of these two methods can effectively consider the uncertainty and diversity of image collection while reducing the redundancy of image collection.
- (3)
- On two public datasets, it achieves better results than other active learning methods on the task of aerial scene classification.
2. Related Work
Aerial scene classification provides an important basis for earth observation [14] and provides great help for urban planning [15], land use [16], and environmental monitoring [17]. The aerial scene classification technologies in the past decades can be roughly divided into three classes: methods based on low-level feature descriptors, methods based on middle-level visual representations, and methods based on deep learning [18]. The methods based on low-level feature descriptors mainly distinguish aerial scenes based on low-level visual features such as color and texture [19]. This method has limited performance in classifying aerial scene images with complex semantics. The methods based on middle-level visual representations mainly combine the local visual features extracted by the low-level feature method into a high-order statistical mode to construct the overall representation of the aviation scene [20]. This method needs artificially aided design and has poor generalization ability in the face of a large number of classified images of aerial scenes. The methods based on deep learning use neural networks to test the images after training, which can effectively solve the problems caused by the two methods mentioned above [2,21,22,23]. However, the methods based on deep learning have a fatal problem; that is, the amount of data required for network training is huge, which may not be obvious for the classification of ordinary images, but it is particularly prominent in the field of aerial scene classification, which is a high-cost and time-consuming field of image acquisition.
In order to solve the problem that methods based on deep learning need a large amount of data, but it is difficult to obtain data in some fields, few-shot learning is being widely studied. The research direction of few-shot learning can be summarized in two aspects: from the perspective of model and from the perspective of data. Researchers who focus on the network model of few-shot learning have proposed a prototype network [24] and a relational network [25]. Some researchers also pay attention to the data and put forward a variety of active learning strategies. Active learning is a technology in which the network independently selects data for label query and adds data to training [26]. The key to active learning is the design of the query method, that is, what kind of data are considered to be the most worthy for labeling, which can greatly improve the performance of the network after labeling. The existing methods are based on uncertainty, diversity, and model parameter change. In another way, we can also think that the design of the active learning query method is also a method to evaluate the information quality of data. For example, many scholars use entropy to evaluate the robustness, uncertainty, and diversity of data. They put forward some methods to evaluate the information quality of data [27,28,29]. However, the existing methods do not comprehensively consider a variety of indicators of data, and the existing remote sensing image information quality evaluation methods are still relatively limited. They cannot provide good guidance for image collection and labeling, so there is still a lot of research space for active learning technology based on aerial scene image information quality evaluation.
Our work is to design an active learning method for remote sensing image information quality evaluation based on node entropy. The method is from the perspective of remote sensing image information quality, comprehensively considering the diversity and representativeness of remote sensing image selection. It is a useful attempt to evaluate the information quality of remote sensing images.The method can provide a reference for the remote sensing image collection and labeling.
3. The Proposed Method
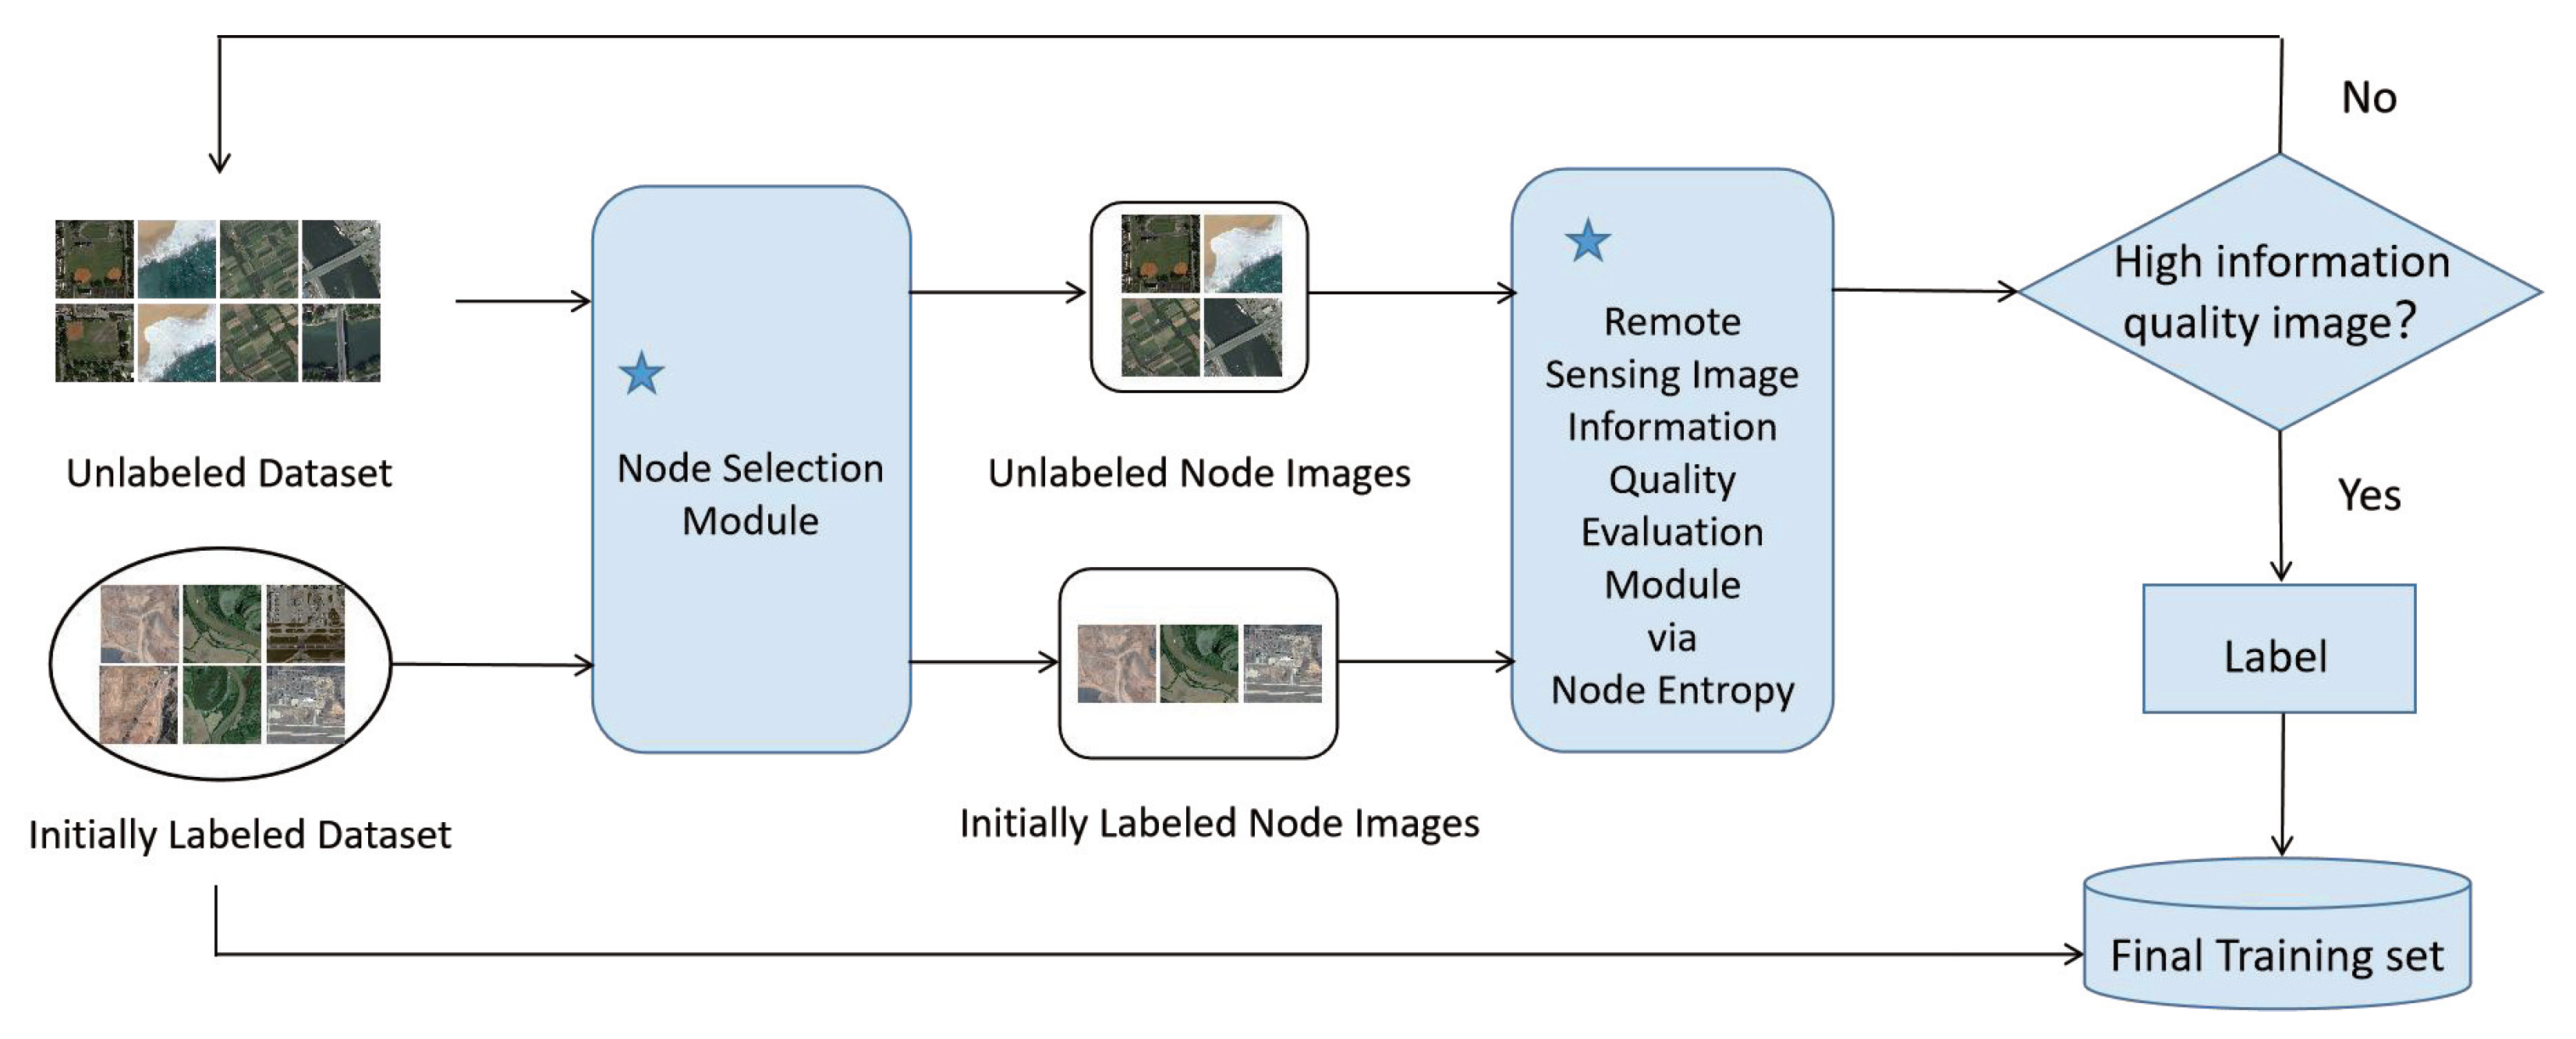
The remote sensing image information quality evaluation method via node entropy includes two modules. The first module is the node selection module, which is used to select the nodes of the initially labeled dataset. The second module is the remote sensing image quality evaluation module based on node entropy, which is used to select representative remote sensing images with high information quality. The node selection module lays the foundation for the subsequent remote sensing image quality evaluation module via node entropy, and the two together constitute the remote sensing image quality evaluation method via node entropy.
When evaluating the information quality of remote sensing images, the specific implementation steps are as follows. First, the initially labeled dataset is fed into the node selection module to obtain initially labeled node images. Then, through the remote sensing image information quality evaluation module via node entropy, the information quality of unlabeled images is obtained by using the initially labeled node images.
When this method is combined with the active learning image selection strategy, the initially labeled dataset and unlabeled dataset need to be input into the node selection module, respectively, to obtain the initially labeled node images and unlabeled node images. Then, it is not necessary to obtain the information quality of each unlabeled image, but only the information quality of each unlabeled node image needs to be obtained. Finally, the node image with high information quality is labeled, and together with the initially labeled data, the final training set is formed. The node image with low information quality is put back into the unlabeled dataset.
The method overview is shown in Figure 1. Section 3.1 introduces the node selection module, and Section 3.2 introduces the remote sensing image information quality evaluation module via node entropy.
3.1. The Node Selection Module
Before introducing the node selection module, we introduce the concept of nodes. A node can be understood as a representative image point or as a point that can represent more images. To distinguish the concept of nodes, we define each image point as a child point. The following is the node selection method:
First, use the embeddings , ,⋯, of each image , ,⋯, in the dataset to calculate the distance between each image:
where and are the embeddings of the ResNet-18 feature vector after training, and is the Euclidean distance between them.
Then, form the distances between the images into a numerically ascending sequence:
Next, use the quartile method to calculate the threshold for identifying nodes in the dataset:
where q is the index in the ascending sequence D.
The equation for q is:
For each image, if the distance from other images is less than the threshold , the two child points are considered to be connected to each other, and the number of connections between the two images is:
The number of connections for each image is the sum of the number of connections between it and each image:
The number of connections of the i-th image can be understood as the number of images (including the image itself) that the i-th image can represent.
The steps of node selection are as follows: firstly, calculate the connection number of each image in the dataset to be selected; secondly, select the image with the largest connection number in the dataset to be selected as the node image; thirdly, clear the child points connected with the node image from the dataset to be selected (these child points are no longer considered as node images). Repeat the above three steps until there is no image in the dataset.
3.2. Remote Sensing Image Information Quality Evaluation Module via Node Entropy
The remote sensing image quality evaluation via node entropy is to use the existing m labeled image nodes to calculate and evaluate the image information quality.
First, calculate the distance from the image to each labeled image node:
Then, normalize the data of the distance between the labeled node images and the images:
Finally, use these distances to calculate the node entropy of the image:
The calculation result of node entropy is the result of remote sensing image quality evaluation proposed in this paper. The image with large node entropy contains high quality information.
The steps of selecting high information quality images into the training set are as follows: first, the node selection module is used to calculate the node images in the initially labeled dataset; second, the node selection module is used to calculate the node images in the unlabeled dataset; third, the node image with the largest node entropy in the unlabeled dataset is labeled and added to the training set; fourth, the child points connected with the images selected in the third step from the unlabeled dataset are temporarily removed. Repeat the process of the third step and the fourth step until the budget is exhausted or the unlabeled dataset is empty. If the budget is not exhausted, and there are no other images in the unlabeled dataset, consider selecting the images with large node entropy from the images removed in the fourth step. This can ensure as much as possible that there are fewer similar images in the training set.
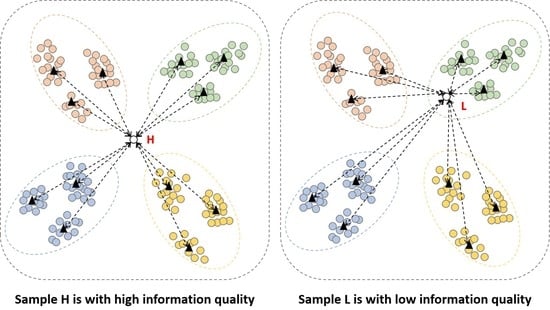
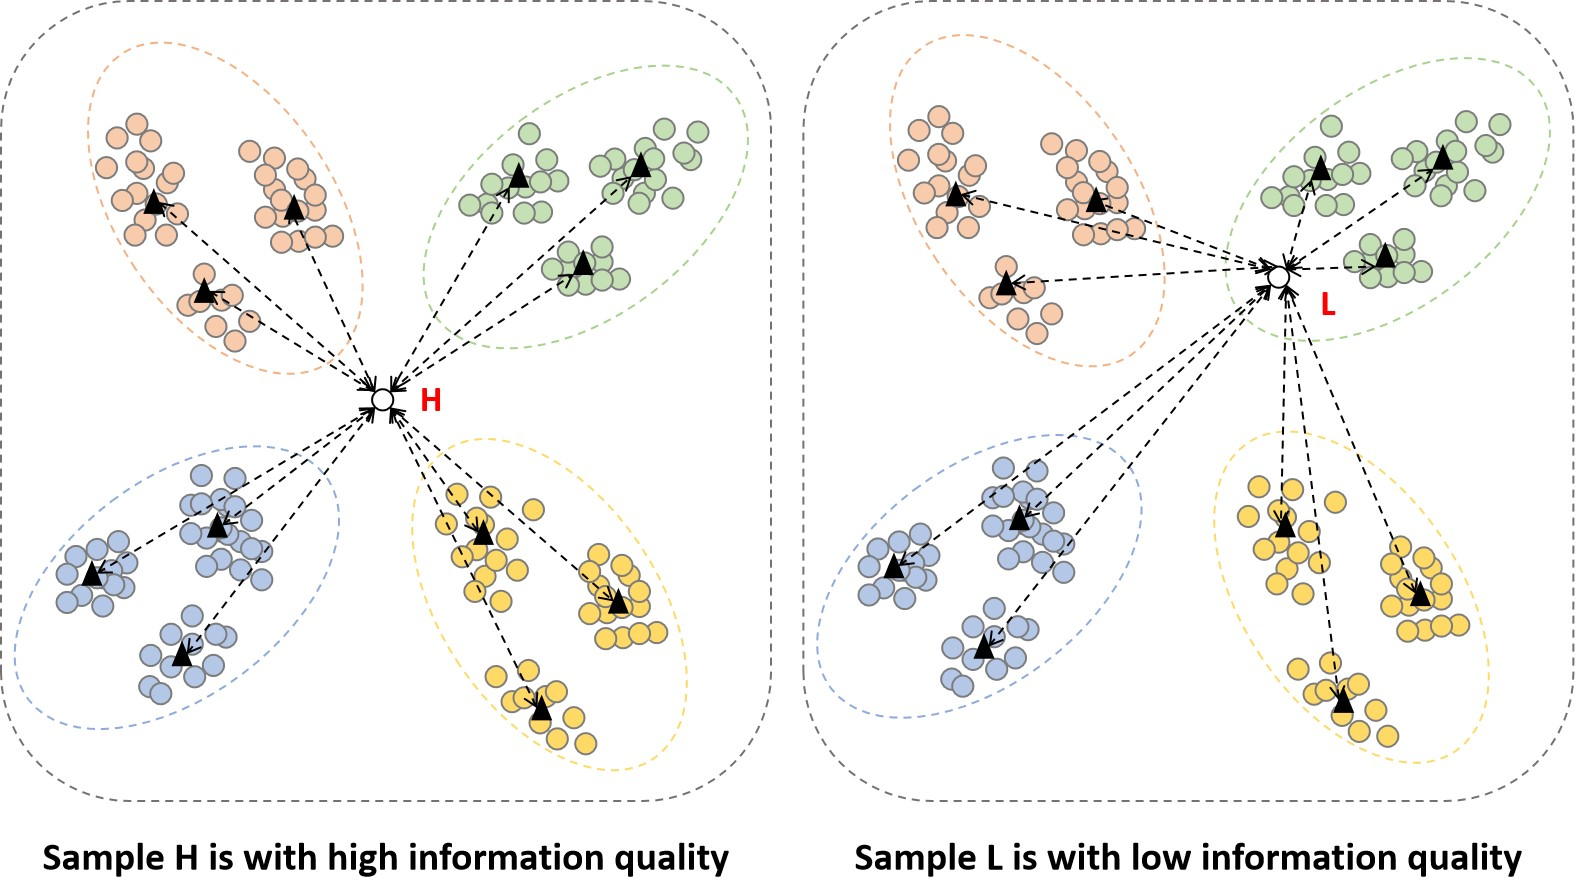
When labeling the collection images, the node images with high node entropy are first added to the training set. This is determined by the calculation formula of node entropy, as Equation (9). are the normalized values, as Equation (8). In this case, node entropy is maximum only when the values of are close or even equal. That is, when the distance between the image and each node image is close or equal. If the node entropy is large, the image is located close to a decision boundary.
If the remote sensing information quality evaluation method is combined with the active learning image screening strategy, this module should evaluate the unlabeled node images and add the node images with large node entropy to the training set. It is not necessary to calculate the node entropy of all images, which can avoid adding a large number of similar images to the training set at the same time.
4. Experiments
In this paper, we conduct extensive experiments using the ResNet-18 [30] network on two public remote sensing datasets, AID [18] and RSSCN7 [31]. The method proposed in this paper is compared with the experimental results of random selection and the existing methods based on entropy [28] and learning loss [12]. The results prove the effectiveness of the method proposed in this paper.
4.1. Datasets and Segmentation
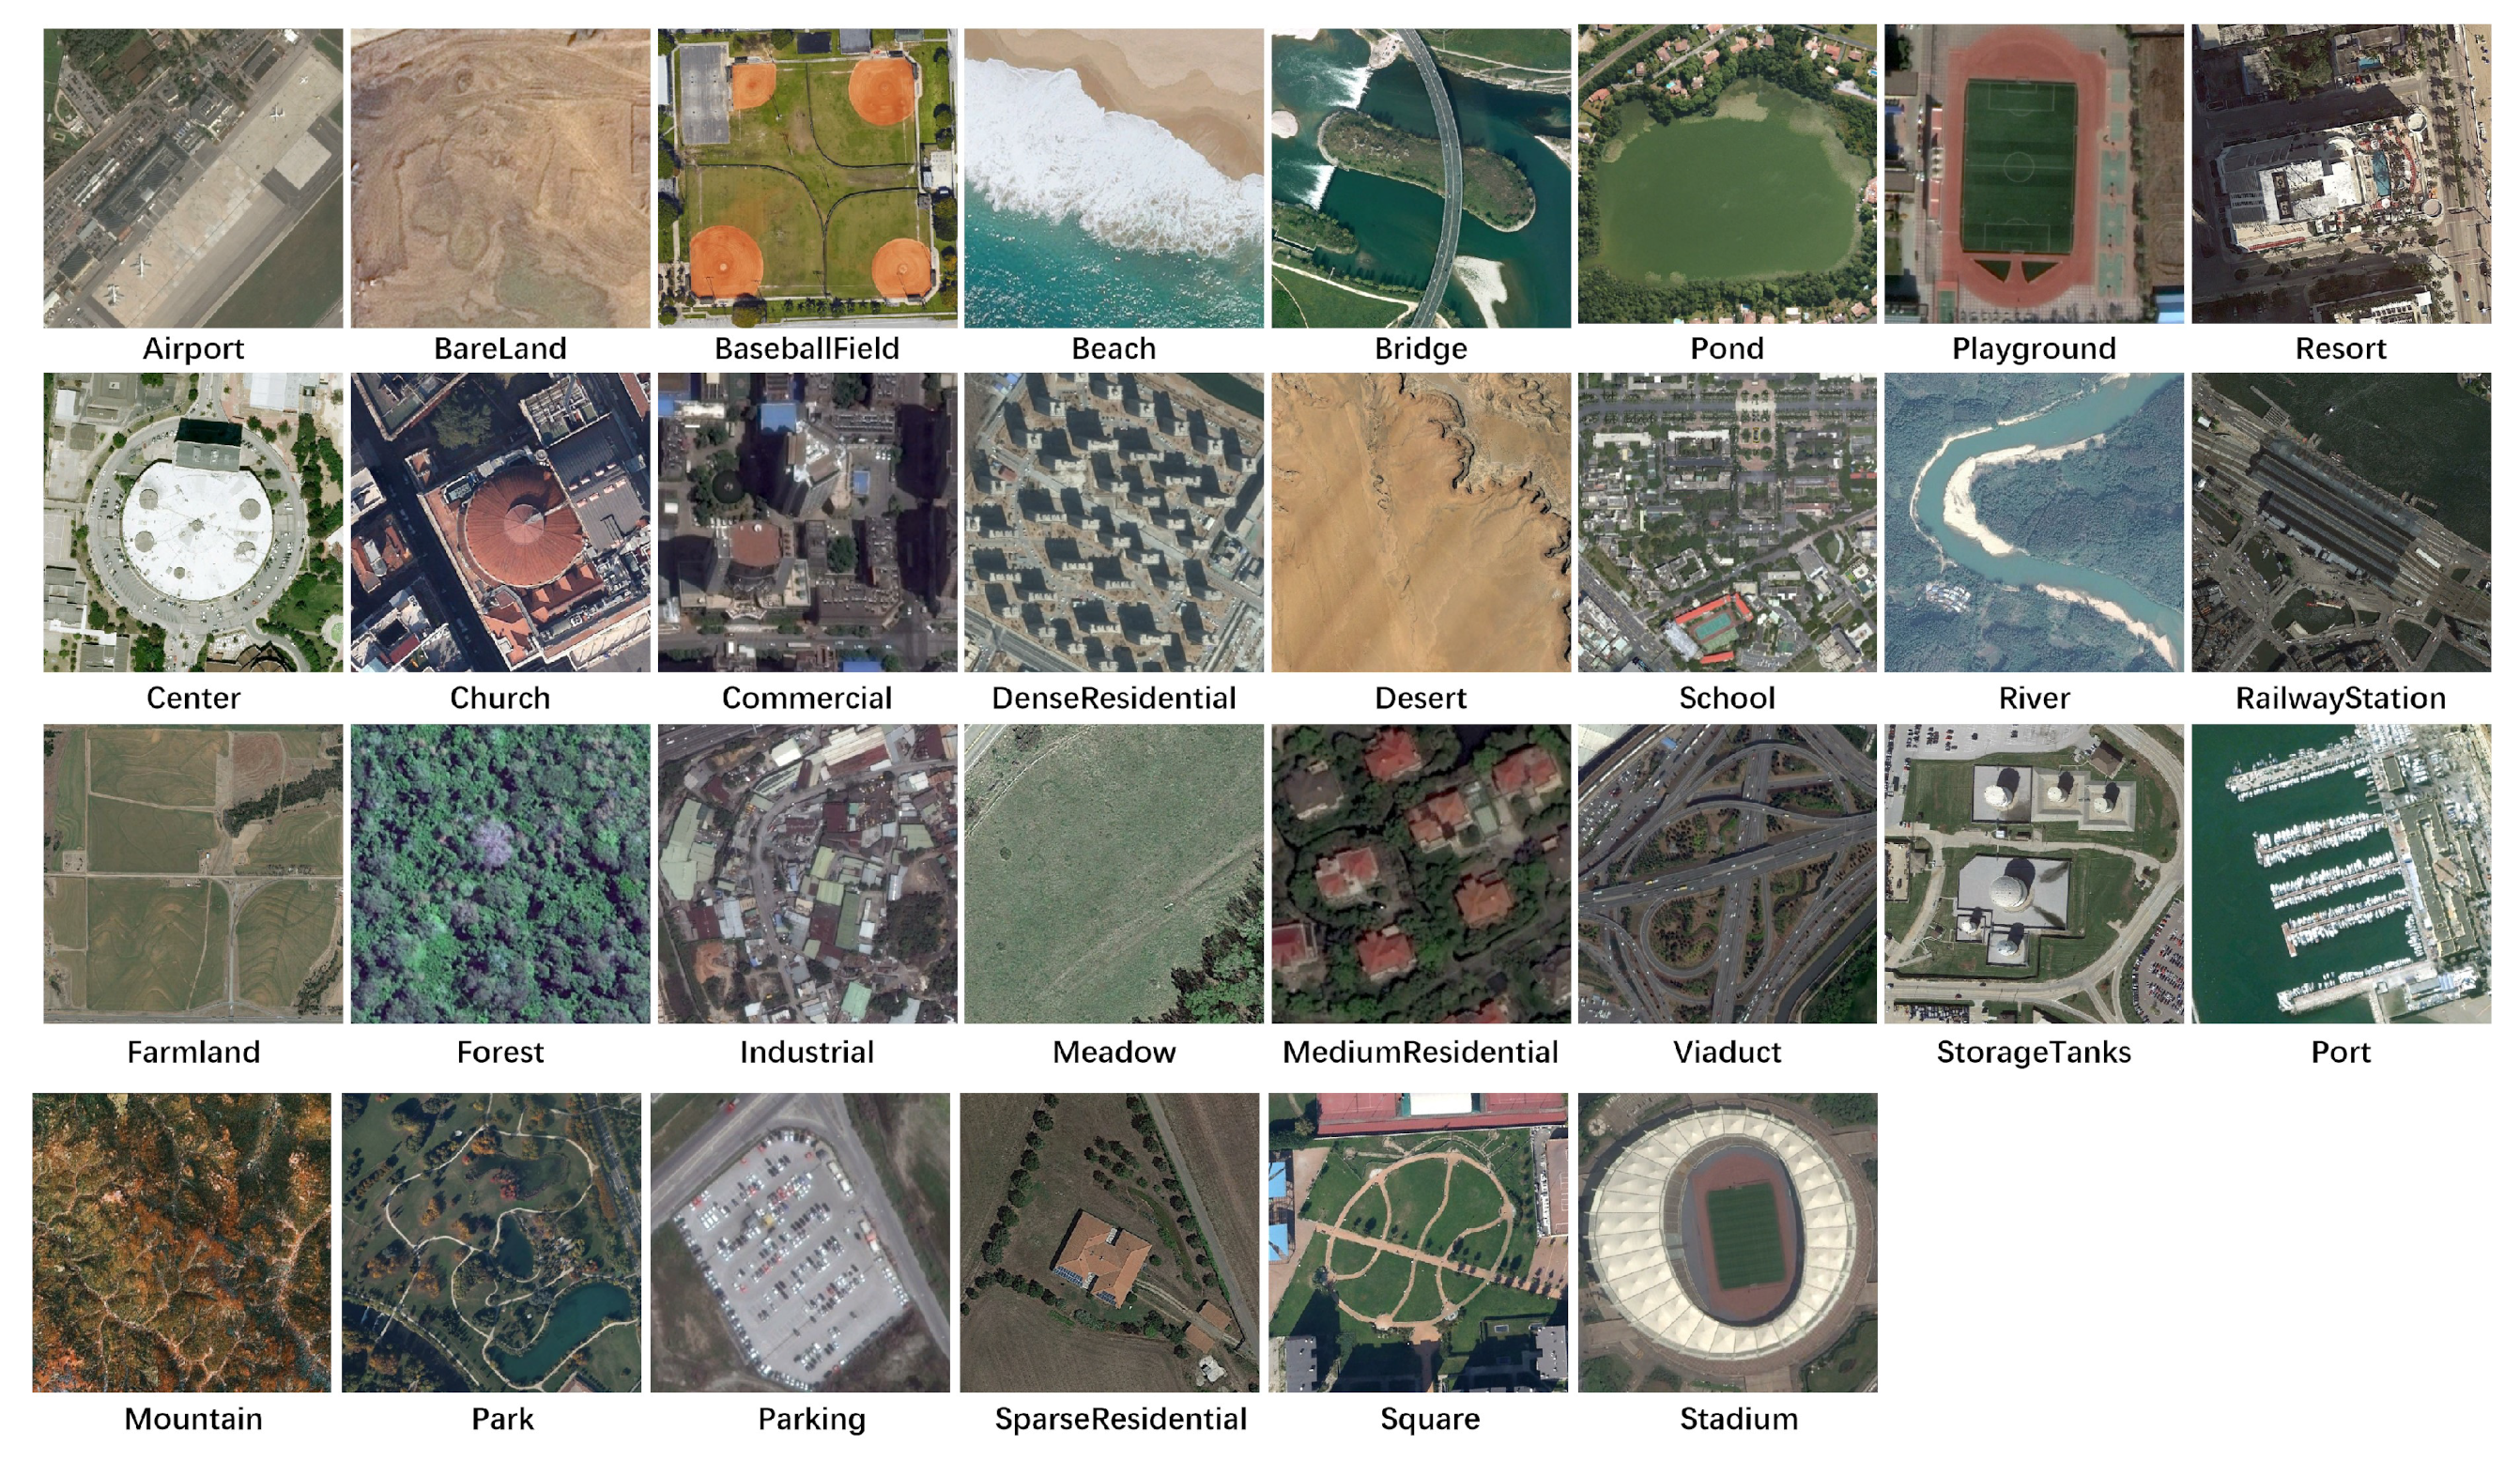
In this paper, we use two public remote sensing datasets AID and RSSCN7. The AID dataset contains a total of 30 classes of images, each class contains 200–400 images, with a total of 10,000 images. The pixels of each image are 600 × 600.
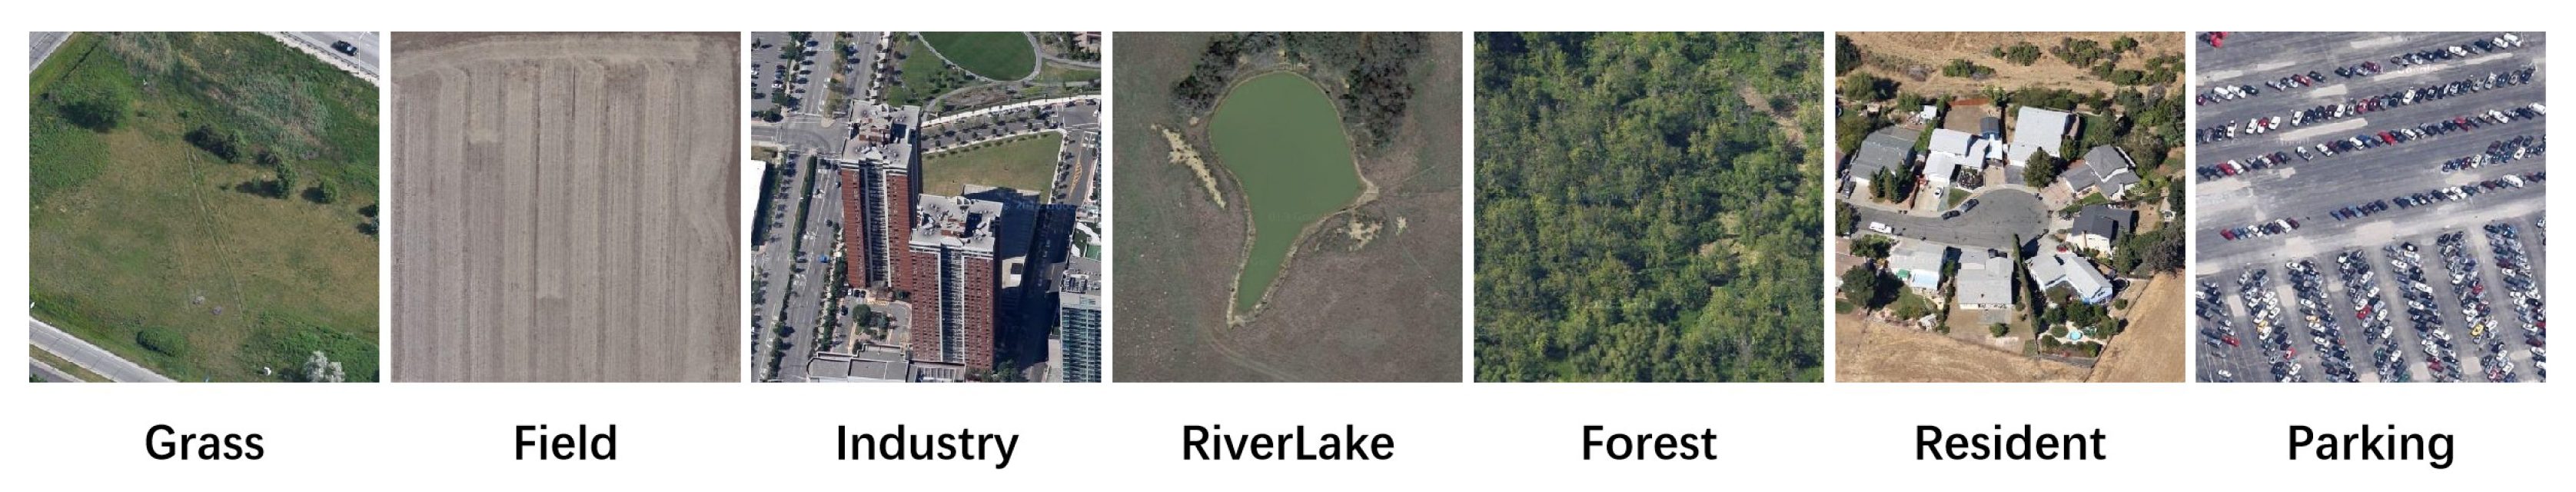
Some images are shown in Figure 2. The RSSCN7 dataset contains a total of 7 classes of images, each class of images contains 400 images, a total of 2800 images, and the pixels of each image are 400 × 400. Some images are shown in Figure 3.
When conducting the validation experiments, we adopt the commonly used dataset segmentation method. First, the dataset is divided into the training set and testing set roughly according to the ratio of 4:1, and the number of images of each class is equal. The AID testing set has 70 images per class, for a total of 2100 images. The RSSCN7 testing set has 80 images per class, for a total of 560 images. Regard the training set as the pool set, and 20% of the pool set images are used as the initially labeled dataset. The budget for each image collection and addition is 20% of the pool set images.
4.2. Experimental Settings
In this paper, training is carried out on a 3.2-GHz CPU and a Titan Xp GPU. In each cycle, the model is trained for 200 epochs with the cosine annealing learning rate. ResNet-18 is selected for both feature extraction network and training network. Ensure the batch size and the training data augmentation method in the experiment are consistent. These settings can ensure the validity of the experiments. Finally choose to start 200 rounds of training from zero like most active learning methods [32] because this can avoid the uncertainty of transfer learning. In this way, the comparative experiment and ablation experiment will be more rigorous.
4.3. Comparative Experiment
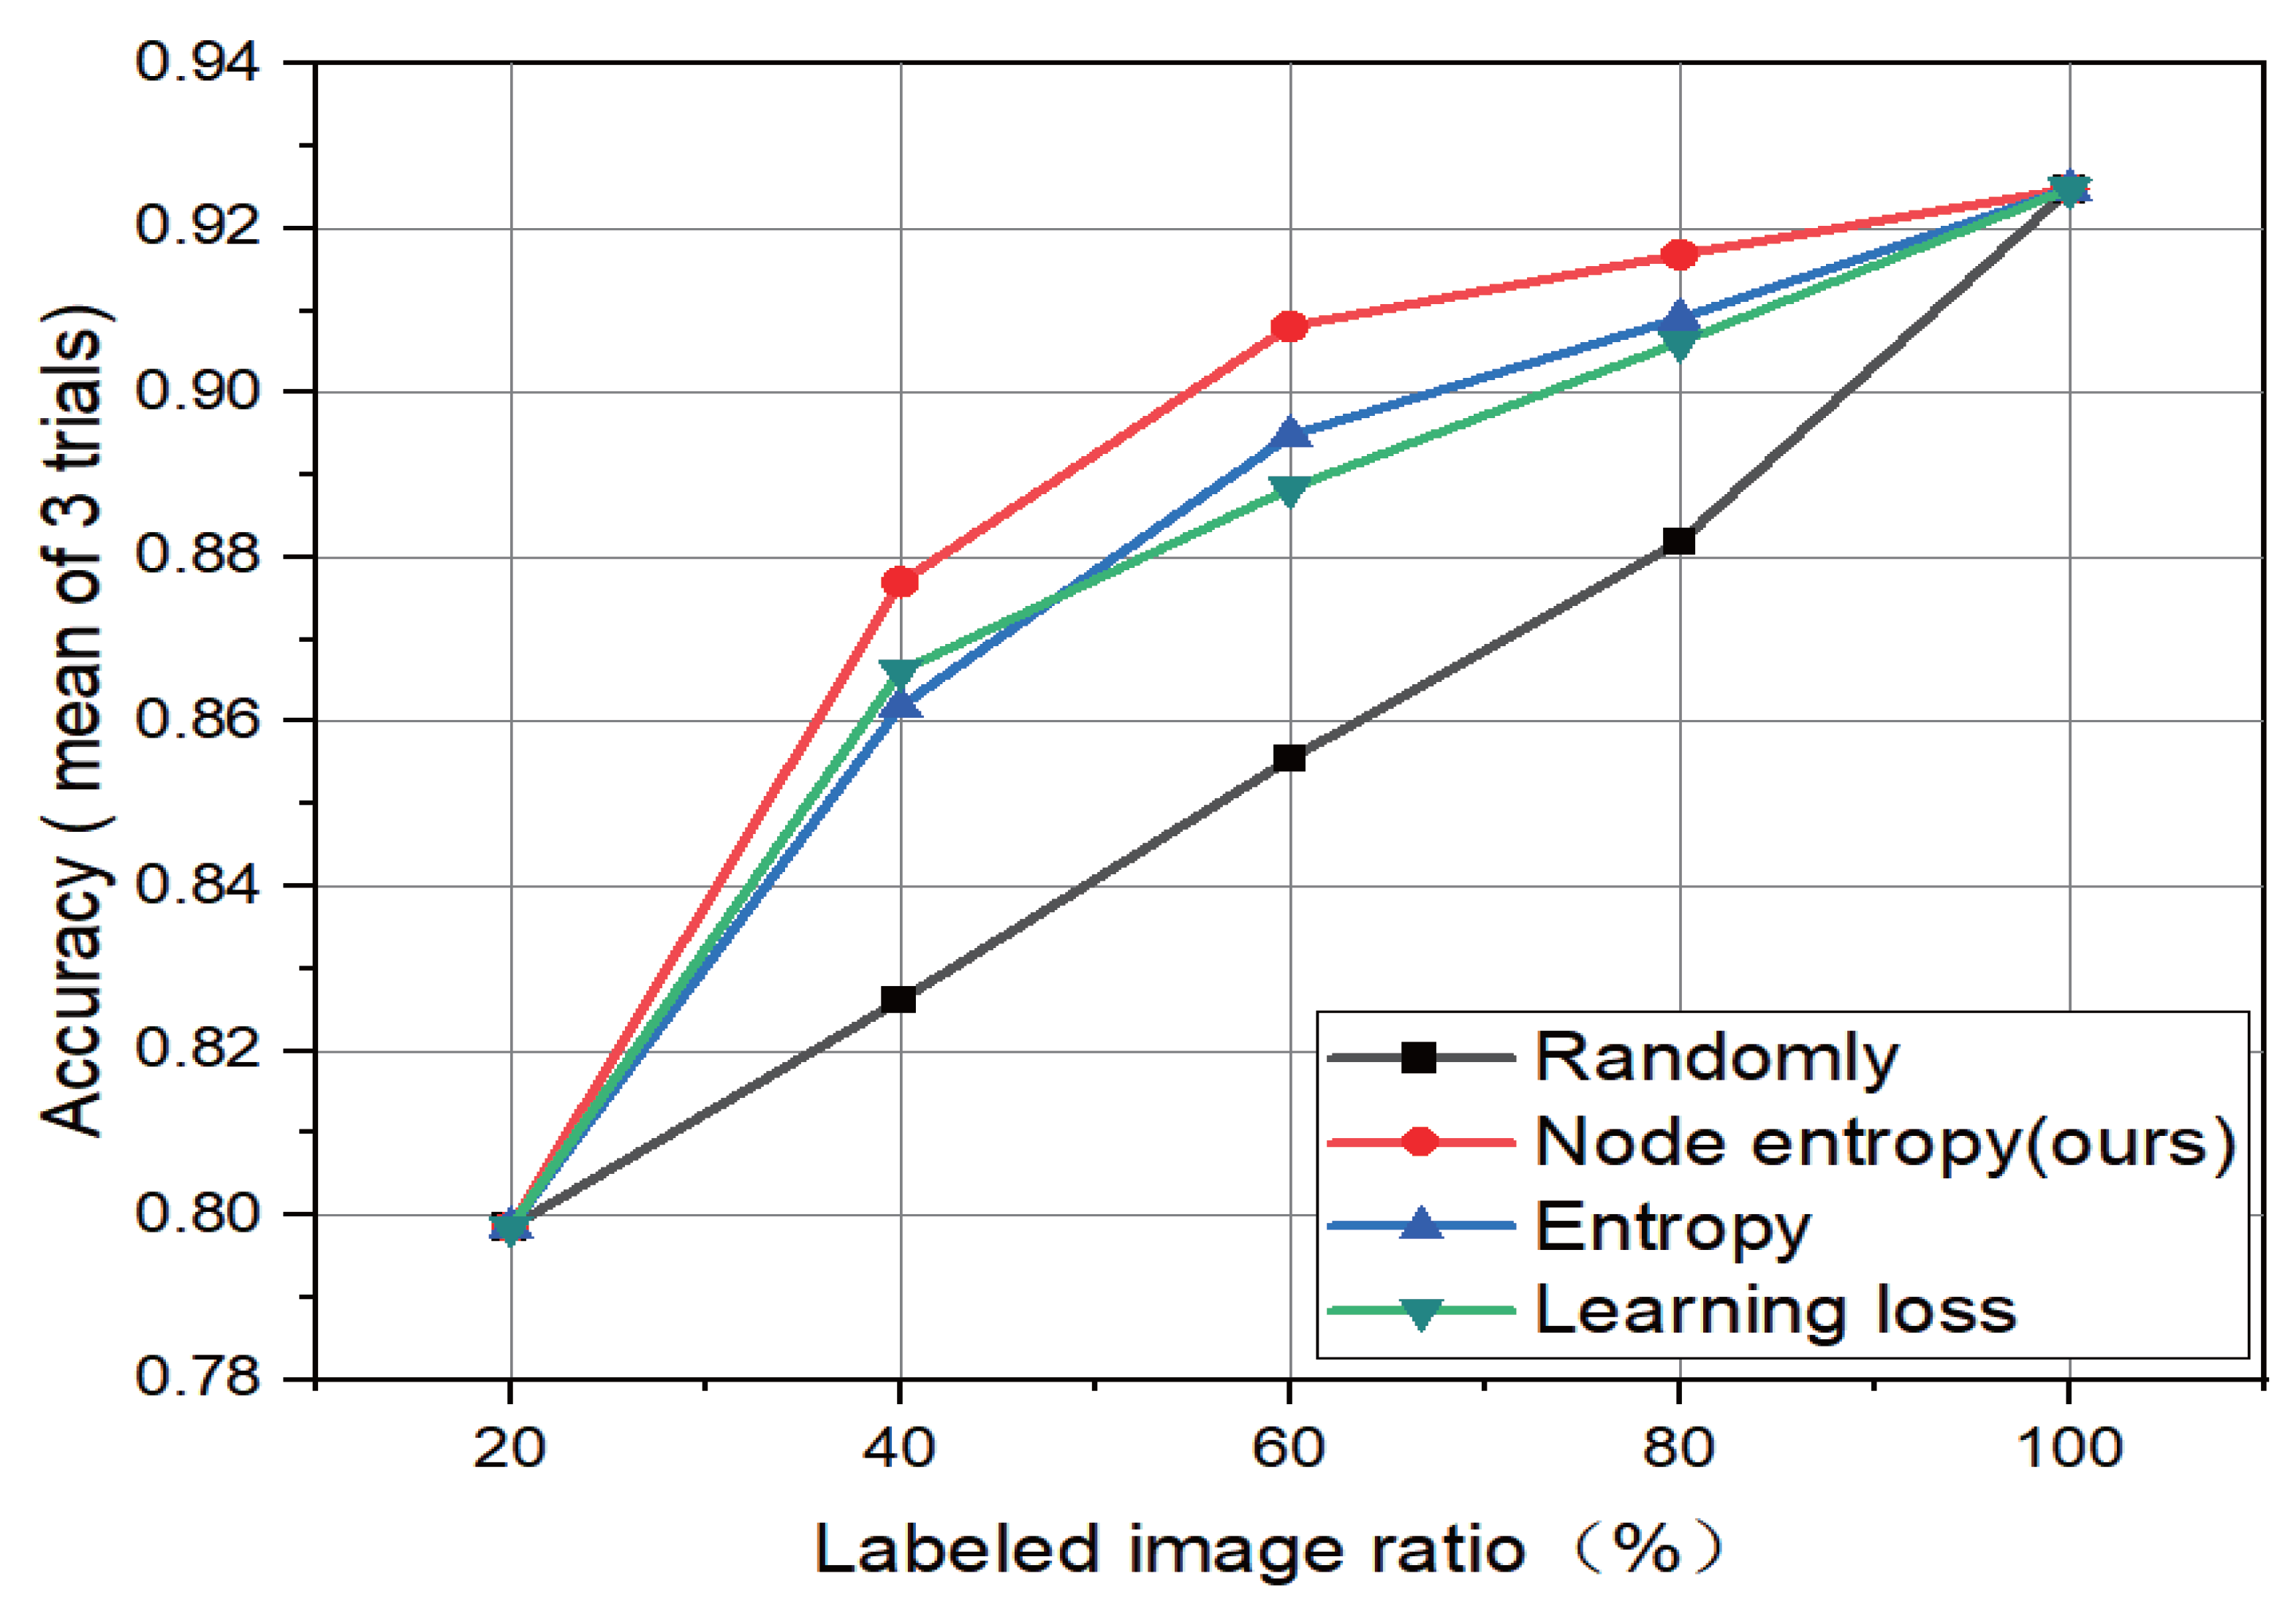
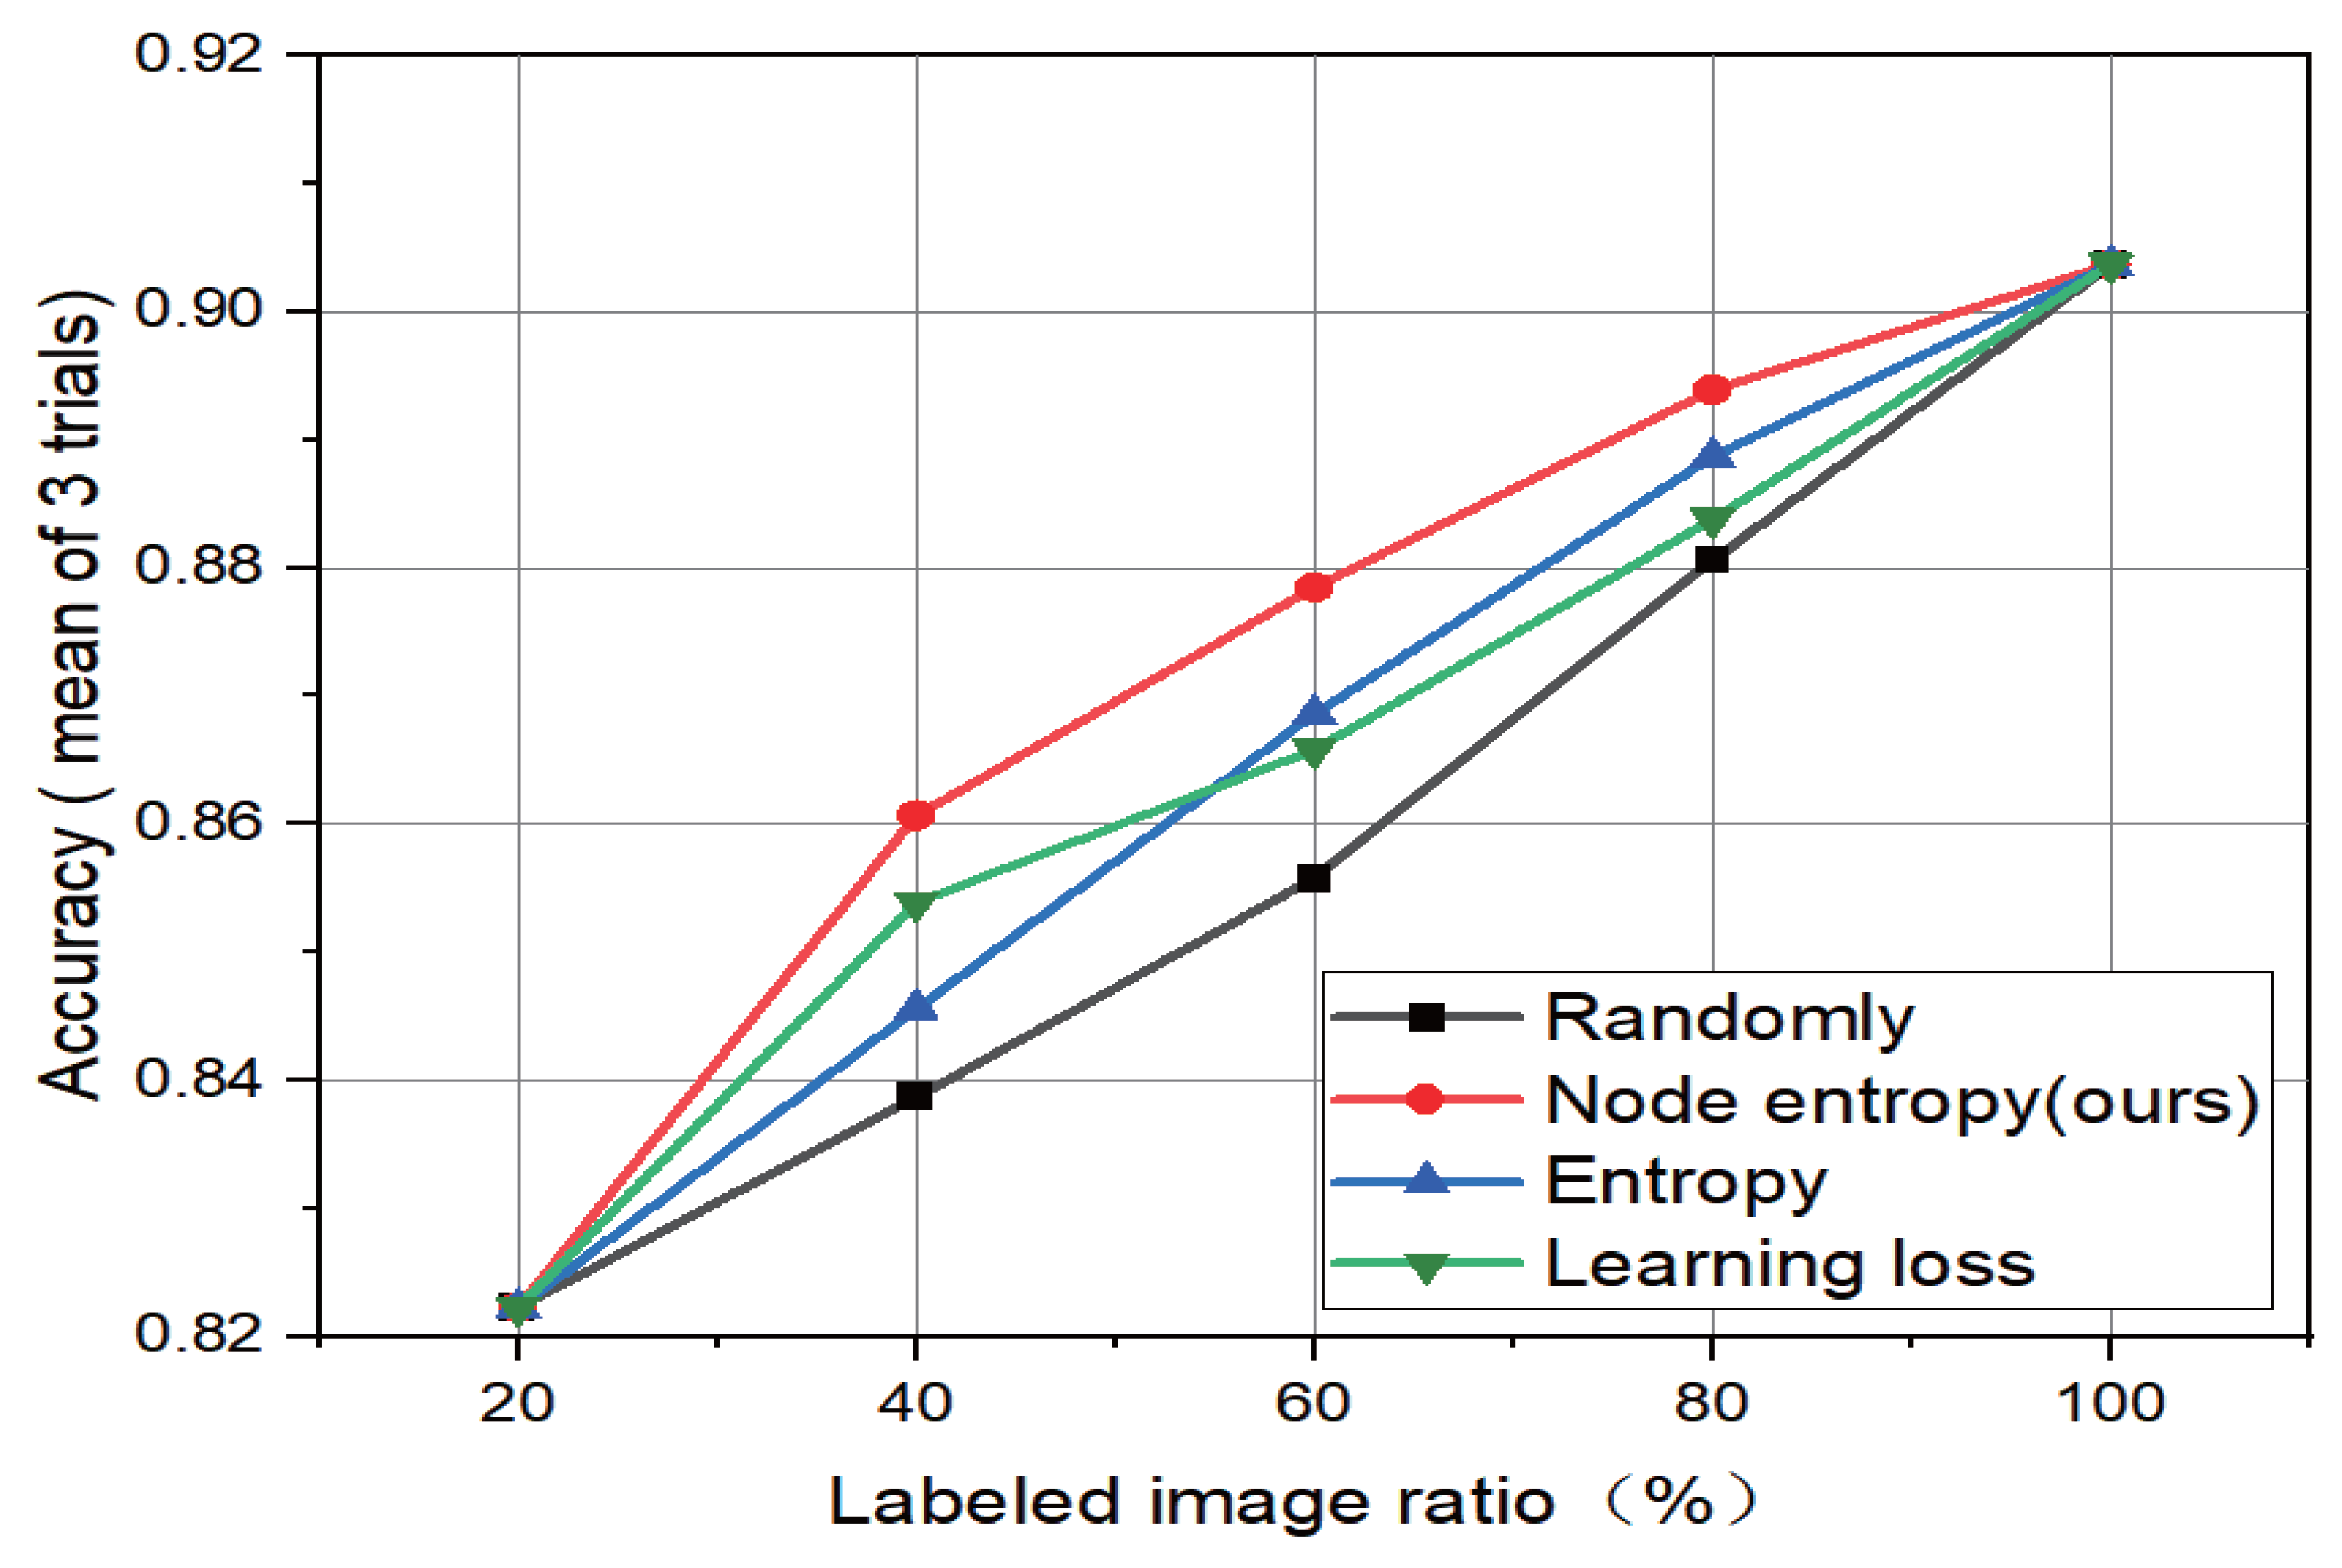
Based on the remote sensing image information quality evaluation method, this paper combines it with the active learning strategy. To verify the effectiveness of the combined active learning method, we compare the method proposed in this paper with the currently widely used active learning image selection methods. Comparable methods include the entropy-based method [28], and the learning-loss method [12]. The comparative experimental results are shown in Figure 4 and Figure 5.
From the experimental results, all active learning methods outperform randomly selected ones. Compared with the existing active learning methods, the strategy formed by the combination of remote sensing image information quality evaluation method proposed in this paper and active learning image selection has certain advantages.
4.4. Ablation Experiment
We conducted ablation research to check the effectiveness of the two modules of the proposed method, including the node selection module and the remote sensing image quality evaluation module via node entropy. The ablation variants we consider are: (1) eliminate the node selection module in the pool set; and (2) eliminate the remote sensing image quality evaluation module via node entropy. We conducted experiments on the above two public datasets, and the experimental results are shown in Table 1 and Table 2.
From the ablation experimental results, the elimination of the node selection module in the pool set, the elimination of the remote sensing image quality evaluation module via node entropy, and the complete module have better experimental results than the randomly selected experimental results, of which the complete module has the best experimental results. The reason for such experimental results is that the node selection module in the pool set can select representative data in the pool set to avoid too many redundant data being selected and added. The remote sensing image quality evaluation module based on node entropy can select the node images in the pool set that are as far away as possible from the node images in the initially labeled dataset. Such node images are easier to be located at the decision boundary of various images and have greater uncertainty. Therefore, the experimental effect of the complete model considering multiple indexes is better than that of the ablation variant model considering only a single index, and both of them will be better than that of the random select experiment.
5. Discussion
In the discussion part, we will discuss the motivation, reasons, limitations, and future prospects.
5.1. Motivation
The existing remote sensing public datasets generally have a limited amount of data, which is caused by the high cost and time-consuming process of acquisition. In this case, the information quality evaluation method of remote sensing images is needed to guide the collection and annotation of remote sensing images.
5.2. Reasons
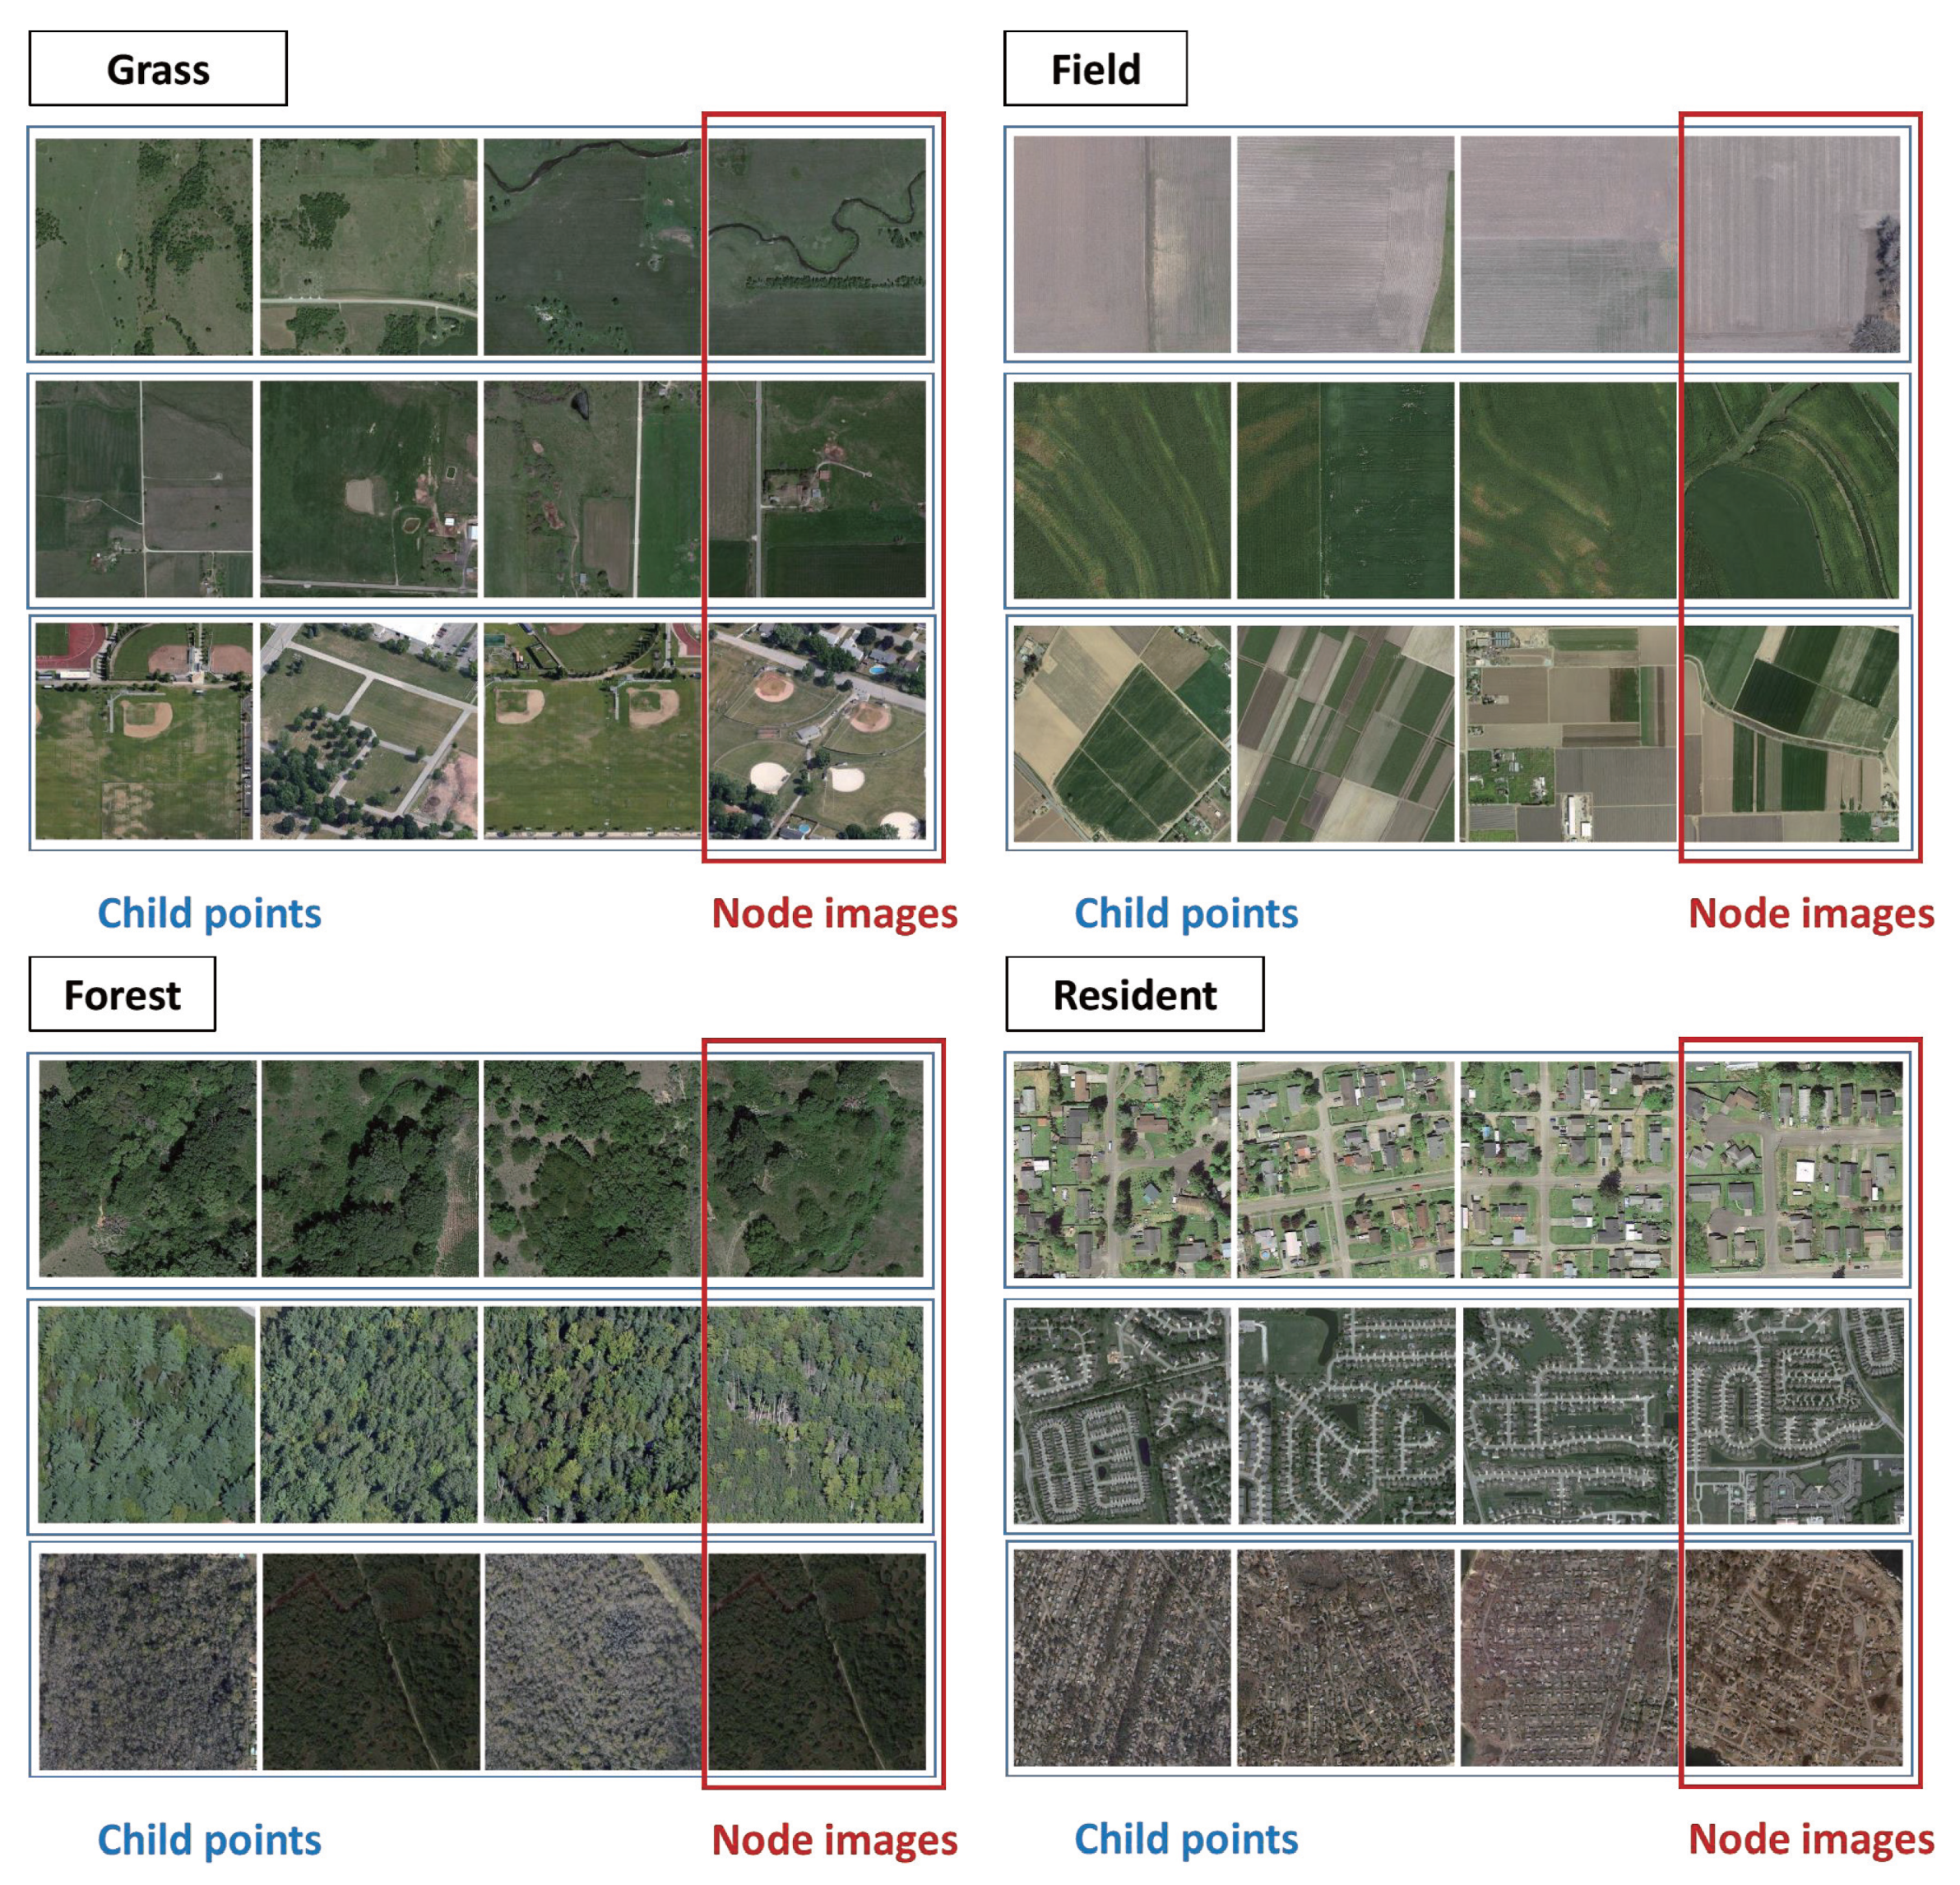
The method in this paper achieved good experimental results in image selection for two reasons. The first reason is that the node selection module can select representative node images, reducing the redundancy of images. For the convenience of understanding and explanation, we show some nodes and child points in the RSSCN7 initial datasets, as shown in Figure 6. The number of nodes selected in our experiment is related to the characteristics of the dataset to be selected.
It can be seen from the figure that there is an obvious similarity between the node images and the connected child points, and the child points connected by different node images can be significantly different. Selecting the node images can effectively reduce data redundancy. The results prove that the node images selected by our node selection module are representative.
The second reason is that the remote sensing image information quality evaluation module via node entropy can select the samples that are as far away from the existing nodes as possible, making the images easier to appear on the decision boundary, taking into account the uncertainty of sample selection and the diversity of samples in the training set.
Calculating node images in a large amount of unlabeled images can avoid a large number of similar images being selected into the training set. When calculating the node entropy, the distance between the unlabeled node image and the initially labeled node images needs to be calculated. Unlabeled node images with the same distance from each initially labeled node image as far as possible are considered to be located on their boundaries. Such images have a large node entropy. Adding these images to the training set can provide a larger amount of information. This can refer to the data with similar confidence levels of each class in the classification task, which are more unable to determine which class they belong to. Such data have a larger amount of information.
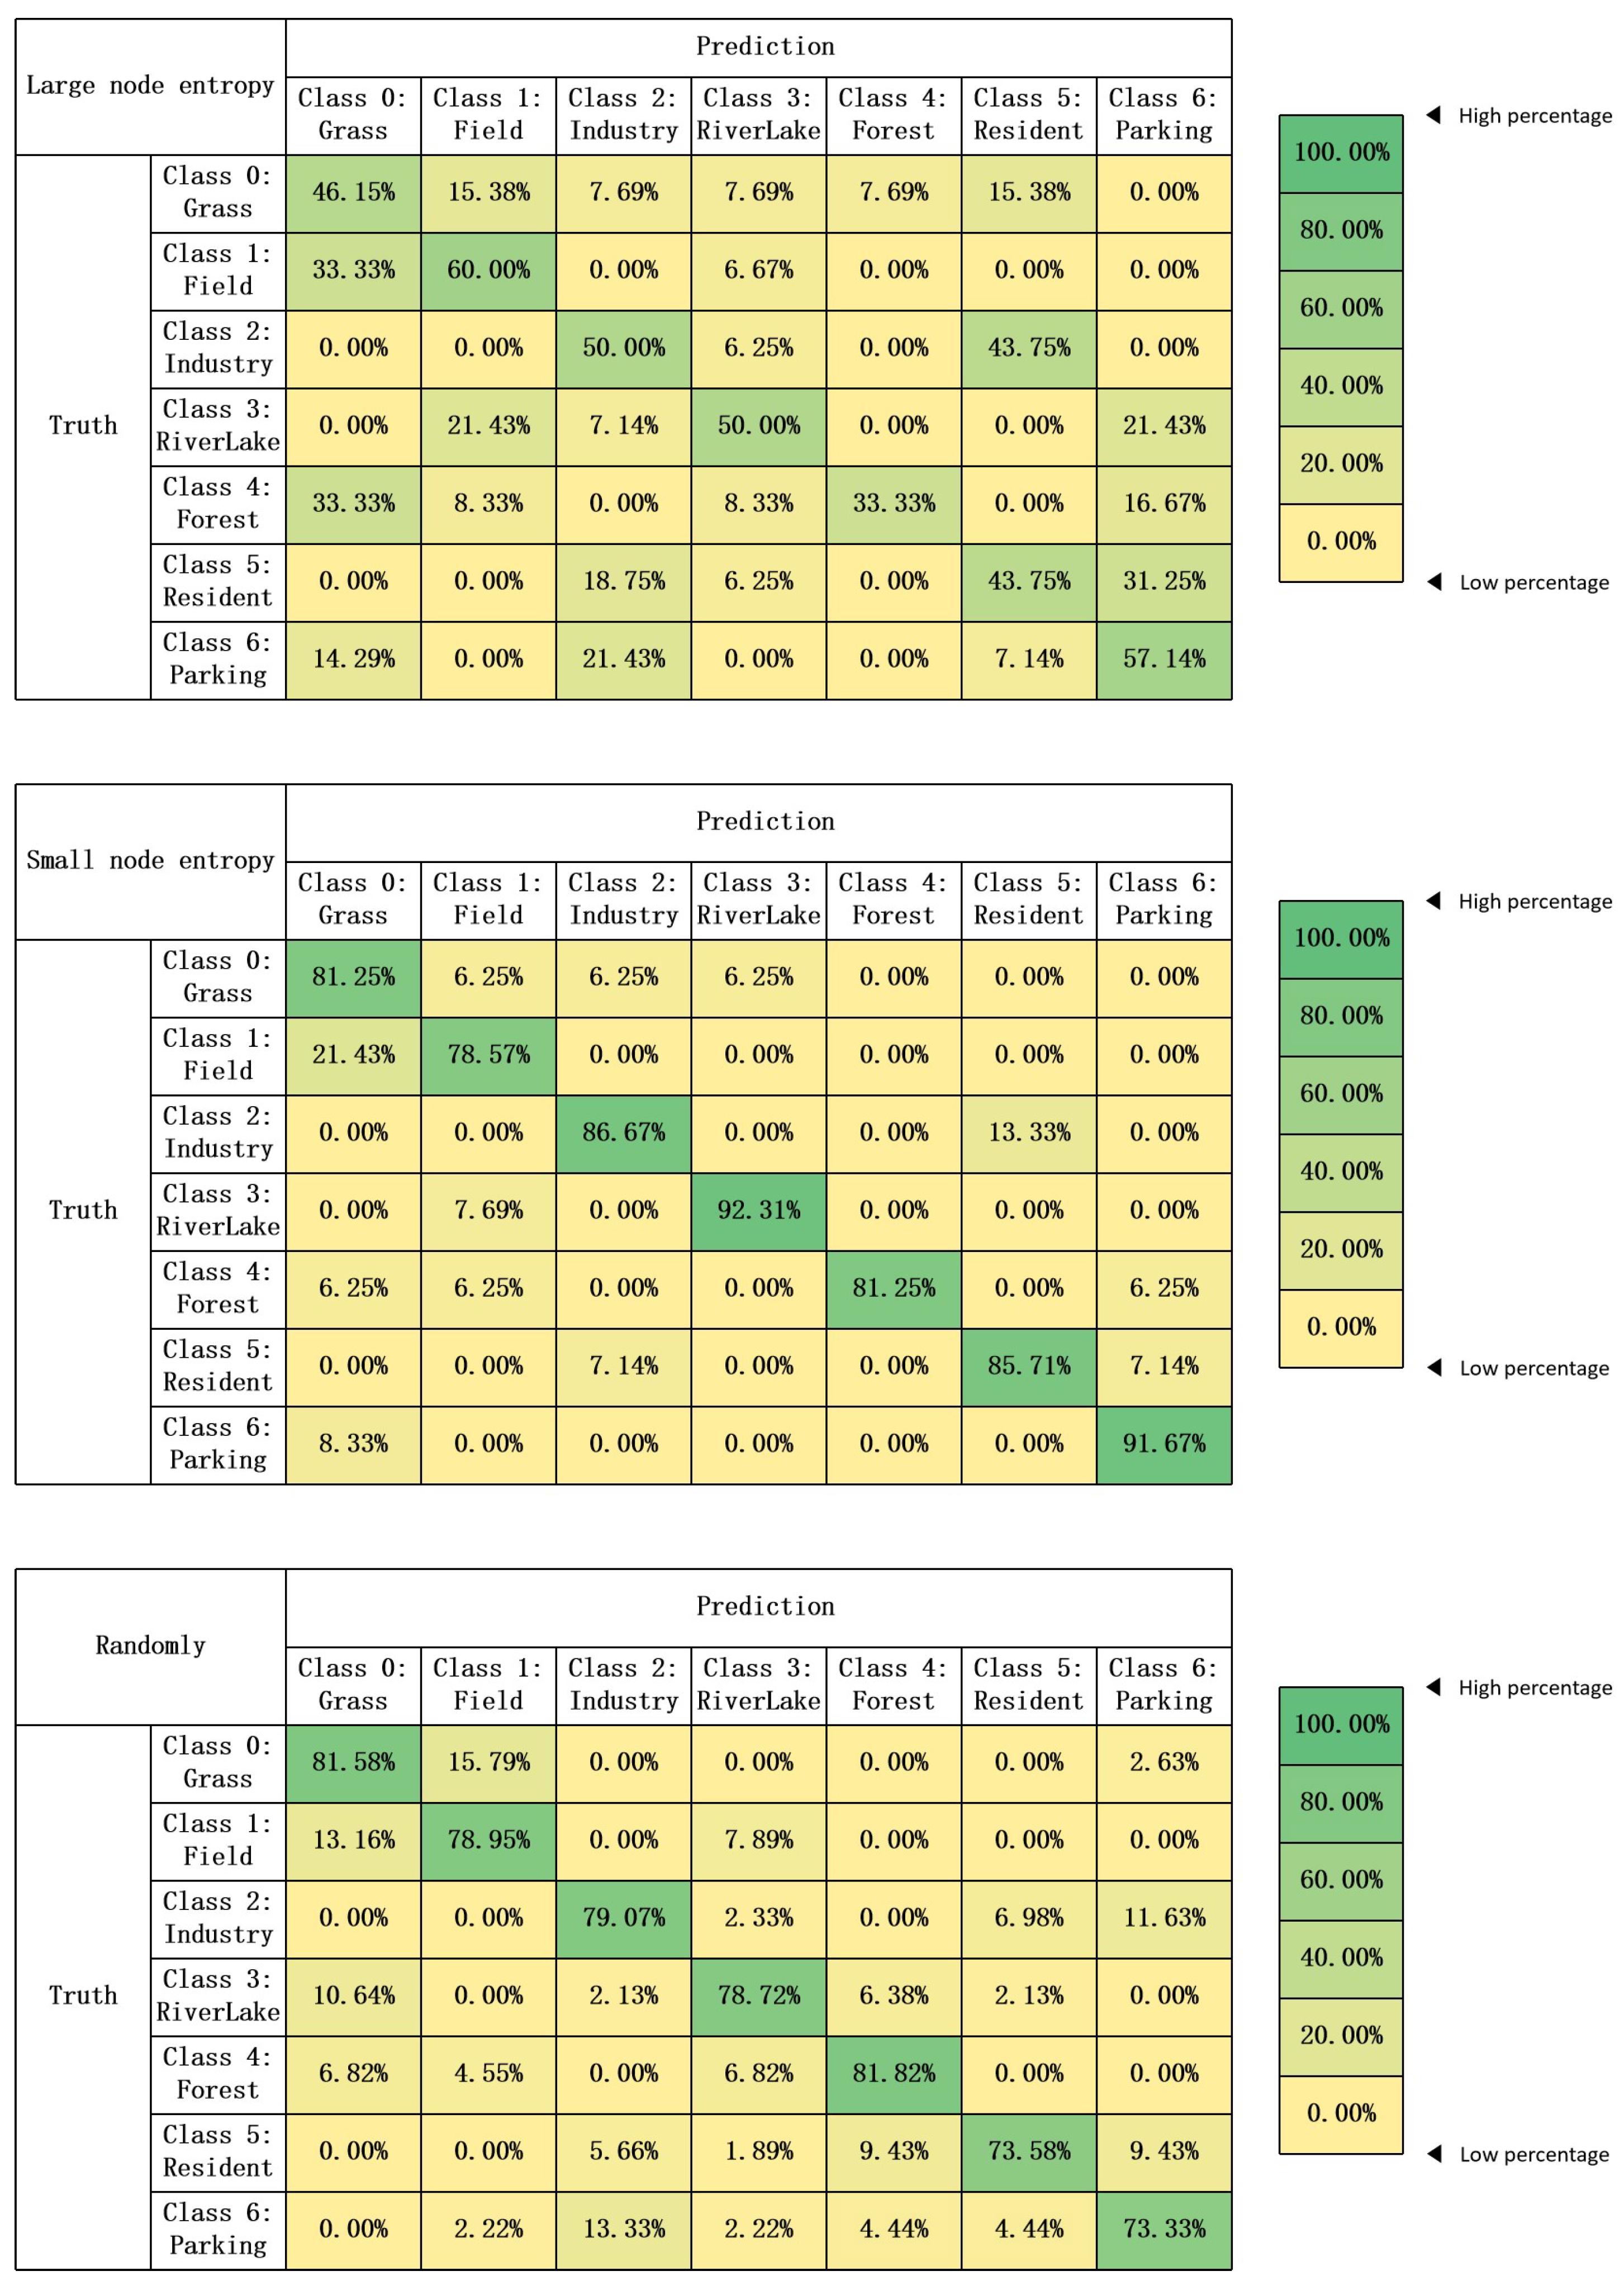
To confirm this, we show the results of the following experiments in the discussion. We select 100 images with large node entropy, 100 images with small node entropy, and 100 images randomly selected from the unlabeled dataset for testing. The model used for testing is the model trained with the initially labeled dataset. The confusion matrix results are shown in Figure 7.
From the analysis of the test results, it can be seen that the test results of images with large node entropy are lower than those of images with small node entropy, and the test results of randomly selected images are in the middle of them. In addition, some images with high node entropy can be correctly classified for the following reasons. The first point is that the classification ability of the network is relatively strong, and the test results can reach 82% in the randomly selected testing set. The second point is that there are differences in the similarity between classes, and there are differences in the recognition accuracy of images on the classification boundary. From the confusion matrix, the recognition accuracy of the first, second, third, fifth, and sixth classes of images is higher, and the recognition accuracy of the zeroth and fourth classes of images is lower. Because there are large differences between the first, second, third, fifth, and sixth classes of images and other classes of images, this is consistent with the situation in the sample diagram in Figure 3.
5.3. Limitations and Future Prospects
This paper mainly presents a method to evaluate the information quality of remote sensing images. In order to verify the effectiveness of the evaluation method, the method is combined with the active learning image selection strategy.
The method in this manuscript takes into account the similarity between remote sensing images and the situation on the decision boundary, so it can effectively improve the experimental effect of classification tasks. The specific application can be reflected in datasets such as aerial scene classification. For the segmentation task and the regression prediction task [33,34], we need to propose some new methods to evaluate the information quality of remote sensing data, which also provides a new direction for our research. In the future, we will expand our research to these aspects and propose some new information quality evaluation methods. We will propose more quantitative evaluation indicators to guide the remote sensing data collection and labeling process and effectively reduce the cost of data collection.
6. Conclusions
In this paper, we propose a new method for evaluating the information quality of remote sensing images based on node entropy. This method is set as an active learning image selection strategy, which can comprehensively consider the diversity and uncertainty of image selection and focus on reducing the redundancy of image selection. Experiments are conducted on two public remote sensing image datasets, and it is proved that the proposed method can achieve better aerial scene classification results than existing methods under the same budget. In the future, we will continue to study remote sensing image information quality evaluation methods, strive to achieve better results with less collection and labeling budget, and provide efficient sampling guidance in areas with high data collection and labeling costs.
Author Contributions
Conceptualization, J.Y. and Y.Y.; methodology, Y.Y. and Y.L.; software, Y.Y. and J.W.; validation, Y.Y. and S.E.; formal analysis, J.Y., Y.Y. and Y.L.; resources, data curation, and writing original draft preparation, Y.Y.; writing review and editing, Y.Y. and Y.L.; visualization, supervision, project administration, funding acquisition, J.Y. and J.W. All authors have read and agreed to the published version of the manuscript.
Funding
This work was supported by the National Natural Science Foundation of China (No. 32101612).
Data Availability Statement
The experiment of this paper uses the public remote sensing datasets AID and RSSCN7, which have been cited in this paper. The source code is released on GitHub, and the link is as follows: https://github.com/YangYue729/node-entropy (accessed on 27 July 2022).
Acknowledgments
The authors would like to thank Tianjin University Laboratory of Artificial Intelligence and Marine Information Processing for support on paper.
Conflicts of Interest
The authors declare no conflict of interest.
References
- Hu, D.; Li, X.; Mou, L.; Jin, P.; Chen, D.; Jing, L.; Zhu, X.; Dou, D. Cross-task transfer for geotagged audiovisual aerial scene recognition. In European Conference on Computer Vision; Springer: Berlin/Heidelberg, Germany, 2020; pp. 68–84. [Google Scholar]
- Cheng, G.; Yang, C.; Yao, X.; Guo, L.; Han, J. When deep learning meets metric learning: Remote sensing image scene classification via learning discriminative cnns. IEEE Trans. Geosci. Remote 2018, 56, 2811–2821. [Google Scholar] [CrossRef]
- Li, J.; Lin, D.; Wang, Y.; Xu, G.; Zhang, Y.; Ding, C.; Zhou, Y. Deep discriminative representation learning with attention map for scene classification. Remote Sens. 2020, 12, 1366. [Google Scholar] [CrossRef]
- Krizhevsky, A.; Hinton, G. Learning Multiple Layers of Features from Tiny Images; Citeseer: Princeton, NJ, USA, 2009. [Google Scholar]
- Vinyals, O.; Blundell, C.; Lillicrap, T.; Wierstra, D. Matching networks for one shot learning. Adv. Neural Inf. Process. Syst. 2016, 29, 1–12. [Google Scholar]
- Zhao, L.; Luo, W.; Liao, Q.; Chen, S.; Wu, J. Hyperspectral image classification with contrastive self-supervised learning under limited labeled samples. IEEE Geosci. Remote Sens. Lett. 2022, 19, 1–5. [Google Scholar] [CrossRef]
- Zhang, P.; Bai, Y.; Wang, D.; Bai, B.; Li, Y. Few-shot classification of aerial scene images via meta-learning. Remote Sens. 2021, 13, 108. [Google Scholar] [CrossRef]
- Kalita, I.; Kumar, R.N.; Roy, M. Deep learning-based cross-sensor domain adaptation under active learning for land cover classification. IEEE Geosci. Remote Sens. Lett. 2021, 19, 1–5. [Google Scholar] [CrossRef]
- Tang, Y.P.; Huang, S.J. Self-paced active learning: Query the right thing at the right time. Proc. AAAI Conf. Artif. Intell. 2019, 33, 5117–5124. [Google Scholar] [CrossRef]
- Wang, H.; Zhou, R.; Shen, Y.D. Bounding uncertainty for active batch selection. Proc. AAAI Conf. Artif. 2019, 33, 5240–5247. [Google Scholar] [CrossRef]
- Siddiqui, Y.; Valentin, J.; Nießner, M. Viewal: Active learning with viewpoint entropy for semantic segmentation. In Proceedings of the IEEE/CVF Conference on Computer Vision and Pattern Recognition, Seattle, WA, USA, 14 June 2020; pp. 9433–9443. [Google Scholar]
- Yoo, D.; Kweon, I.S. Learning loss for active learning. In Proceedings of the IEEE/CVF Conference on Computer Vision and Pattern Recognition, Long beach, CA, USA, 18 June 2019; pp. 93–102. [Google Scholar]
- Li, Y.; Chao, X. Toward sustainability: Trade-off between data quality and quantity in crop pest recognition. Front. Plant Sci. 2021, 12, 811241. [Google Scholar] [CrossRef]
- Hu, Q.; Wu, W.; Xia, T.; Yu, Q.; Yang, P.; Li, Z.; Song, Q. Exploring the use of google earth imagery and object-based methods in land use/cover mapping. Remote Sens. 2013, 5, 6026–6042. [Google Scholar] [CrossRef]
- Pham, H.M.; Yamaguchi, Y.; Bui, T.Q. A case study on the relation between city planning and urban growth using remote sensing and spatial metrics. Landsc. Urban Plan. 2011, 100, 223–230. [Google Scholar] [CrossRef]
- Cheng, G.; Guo, L.; Zhao, T.; Han, J.; Li, H.; Fang, J. Automatic landslide detection from remote-sensing imagery using a scene classification method based on bovw and plsa. Int. J. Remote Sens. 2013, 34, 45–59. [Google Scholar] [CrossRef]
- Manfreda, S.; McCabe, M.F.; Miller, P.E.; Lucas, R.; Madrigal, V.P.; Mallinis, G.; Dor, E.B.; Helman, D.; Estes, L.; Ciraolo, G. On the use of unmanned aerial systems for environmental monitoring. Remote Sens. 2018, 10, 641. [Google Scholar] [CrossRef]
- Xia, G.S.; Hu, J.; Hu, F.; Shi, B.; Bai, X.; Zhong, Y.; Zhang, L.; Lu, X. Aid: A benchmark data set for performance evaluation of aerial scene classification. IEEE Trans. Geosci. Remote Sens. 2017, 55, 3965–3981. [Google Scholar] [CrossRef]
- Lowe, D.G. Distinctive image features from scale-invariant keypoints. Int. J. Comput. Vis. 2004, 60, 91–110. [Google Scholar] [CrossRef]
- Lazebnik, S.; Schmid, C.; Ponce, J. Beyond bags of features: Spatial pyramid matching for recognizing natural scene categories. In Proceedings of the 2006 IEEE Computer Society Conference on Computer Vision and Pattern Recognition (CVPR’06), New York, NY, USA, 17–22 June 2006; pp. 2169–2178. [Google Scholar]
- Li, Y.; Chao, X. Semi-supervised few-shot learning approach for plant diseases recognition. Plant Methods 2021, 17, 68. [Google Scholar] [CrossRef]
- Yang, Y.; Li, Y.; Yang, J.; Wen, J. Dissimilarity-based active learning for embedded weed identification. Turk. J. Agric. For. 2022, 46, 390–401. [Google Scholar] [CrossRef]
- Li, Y.; Nie, J.; Chao, X. Do we really need deep cnn for plant diseases identification? Comput. Electron. Agric. 2020, 178, 105803. [Google Scholar] [CrossRef]
- Snell, J.; Swersky, K.; Zemel, R. Prototypical networks for few-shot learning. Adv. Neural Inf. Process. Syst. 2017, 30, 1–11. [Google Scholar]
- Sung, F.; Yang, Y.; Zhang, L.; Xiang, T.; Torr, P.H.; Hospedales, T.M. Learning to compare: Relation network for few-shot learning. In Proceedings of the IEEE Conference on Computer Vision and Pattern Recognition, Salt Lake City, UT, USA, 18 June 2018; pp. 1199–1208. [Google Scholar]
- Yang, J.; Guo, X.; Li, Y.; Marinello, F.; Ercisli, S.; Zhang, Z. A survey of few-shot learning in smart agriculture: Developments, applications, and challenges. Plant Methods 2022, 18, 28. [Google Scholar] [CrossRef]
- Li, Y.; Chao, X.; Ercisli, S. Disturbed-entropy: A simple data quality assessment approach. ICT Express 2022, in press. [Google Scholar] [CrossRef]
- Li, Y.; Yang, J.; Wen, J. Entropy-based redundancy analysis and information screening. Digit. Commun. Netw. 2021, in press. [Google Scholar] [CrossRef]
- Li, Y.; Chao, X. Distance-entropy: An effective indicator for selecting informative data. Front. Plant Sci. 2021, 12, 818895. [Google Scholar] [CrossRef] [PubMed]
- He, K.; Zhang, X.; Ren, S.; Sun, J. Deep residual learning for image recognition. In Proceedings of the IEEE Conference on Computer Vision and Pattern Recognition, Las Vegas, NV, USA, 26 June 2016; pp. 770–778. [Google Scholar]
- Zou, Q.; Ni, L.; Zhang, T.; Wang, Q. Deep learning based feature selection for remote sensing scene classification. IEEE Geosci. Remote Sens. Lett. 2015, 12, 2321–2325. [Google Scholar] [CrossRef]
- Li, Y.; Yang, J.; Zhang, Z.; Wen, J.; Kumar, P. Healthcare data quality assessment for cybersecurity intelligence. IEEE Trans. Ind. Inform. 2022, 1–8. [Google Scholar] [CrossRef]
- Decuyper, M.; Chávez, R.O.; Čufar, K.; Estay, S.A.; Clevers, J.G.; Prislan, P.; Gričar, J.; Črepinšek, Z.; Merela, M.; Luis, M.D. Spatio-temporal assessment of beech growth in relation to climate extremes in slovenia—An integrated approach using remote sensing and tree-ring data. Agric. For. Meteorol. 2020, 287, 107925. [Google Scholar] [CrossRef]
- Shen, X.; Liu, B.; Henderson, M.; Wang, L.; Jiang, M.; Lu, X. Vegetation greening, extended growing seasons, and temperature feedbacks in warming temperate grasslands of china. J. Clim. 2022, 1–51. [Google Scholar] [CrossRef]
Figure 1.
Method overview. Combine the remote sensing image information quality evaluation method via node entropy with the active learning image selection strategy. The node selection module selects the node images in the initially labeled dataset and the unlabeled dataset. The remote sensing image information quality evaluation module evaluates the information quality of the node images according to the node entropy in the unlabeled datasets. Initially, labeled datasets and high information quality node images from unlabeled datasets are selected to form the final training set. The marking parts of the pentagram are the key modules of this research.

Figure 2.
AID dataset. The AID dataset contains 30 classes of images, each class contains 200–400 images. Some of the images are shown in the figure.
Figure 2.
AID dataset. The AID dataset contains 30 classes of images, each class contains 200–400 images. Some of the images are shown in the figure.

Figure 3.
RSSCN7 dataset. The RSSCN7 dataset contains 7 classes of images, each class contain 400 images. Some of the images are shown in the figure.
Figure 3.
RSSCN7 dataset. The RSSCN7 dataset contains 7 classes of images, each class contain 400 images. Some of the images are shown in the figure.

Figure 4.
Comparative experiment on AID dataset.

Figure 5.
Comparative experiment on RSSCN7 dataset.

Figure 6.
Node images on RSSCN7 dataset.The figure shows four classes in the RSSCN7 dataset: Grass, Field, Forest, and Resident. In each class, three node images and child points connected with them are displayed.
Figure 6.
Node images on RSSCN7 dataset.The figure shows four classes in the RSSCN7 dataset: Grass, Field, Forest, and Resident. In each class, three node images and child points connected with them are displayed.

Figure 7.
The test results of 100 images with large node entropy, 100 images with small node entropy, and 100 images randomly selected from the RSSCN7 unlabeled dataset.
Figure 7.
The test results of 100 images with large node entropy, 100 images with small node entropy, and 100 images randomly selected from the RSSCN7 unlabeled dataset.


Table 1.
Ablation study on AID.
| Method | 20% | 40% | 60% | 80% | 100% |
|---|---|---|---|---|---|
| Randomly | 79.86% | 82.62% | 85.55% | 88.19% | 92.48% |
| Eliminating the node selection module | 87.05% | 89.12% | 90.84% | ||
| Eliminating image quality evaluation module | 87.53% | 88.52% | 90.31% | ||
| Complete module | 87.70% | 90.81% | 91.68% |
Table 2.
Ablation study on RSSCN7.
| Method | 20% | 40% | 60% | 80% | 100% |
|---|---|---|---|---|---|
| Randomly | 82.23% | 83.87% | 85.58% | 88.06% | 90.37% |
| Eliminating the node selection module | 84.52% | 86.81% | 88.58% | ||
| Eliminating image quality evaluation module | 85.21% | 86.39% | 88.23% | ||
| Complete module | 86.07% | 87.85% | 89.39% |
Publisher’s Note: MDPI stays neutral with regard to jurisdictional claims in published maps and institutional affiliations. |
© 2022 by the authors. Licensee MDPI, Basel, Switzerland. This article is an open access article distributed under the terms and conditions of the Creative Commons Attribution (CC BY) license (https://creativecommons.org/licenses/by/4.0/).
Share and Cite
MDPI and ACS Style
Yang, J.; Yang, Y.; Wen, J.; Li, Y.; Ercisli, S. Remote Sensing Image Information Quality Evaluation via Node Entropy for Efficient Classification. Remote Sens. 2022, 14, 4400. https://doi.org/10.3390/rs14174400
AMA Style
Yang J, Yang Y, Wen J, Li Y, Ercisli S. Remote Sensing Image Information Quality Evaluation via Node Entropy for Efficient Classification. Remote Sensing. 2022; 14(17):4400. https://doi.org/10.3390/rs14174400
Chicago/Turabian StyleYang, Jiachen, Yue Yang, Jiabao Wen, Yang Li, and Sezai Ercisli. 2022. "Remote Sensing Image Information Quality Evaluation via Node Entropy for Efficient Classification" Remote Sensing 14, no. 17: 4400. https://doi.org/10.3390/rs14174400
Note that from the first issue of 2016, this journal uses article numbers instead of page numbers. See further details here.