
Differentiating Glioblastomas from Solitary Brain Metastases: An Update on the Current Literature of Advanced Imaging Modalities

Abstract
:Simple Summary
Abstract
1. Introduction
2. Magnetic Resonance Imaging
3. Perfusion Magnetic Resonance Imaging
3.1. Dynamic Susceptibility Contrast-Enhanced Perfusion
3.2. Dynamic Contrast-Enhanced Magnetic Resonance Perfusion
3.3. Arterial Spin Labeling
4. Diffusion Imaging
4.1. Diffusion-Weighted Imaging—Measurement of Apparent Diffusion Coefficient
4.2. Diffusion-Weighted Imaging—Exponential Measurements
4.3. Diffusion Tensor Imaging
4.4. Neurite Orientation Dispersion and Density Imaging
5. Metabolic Imaging
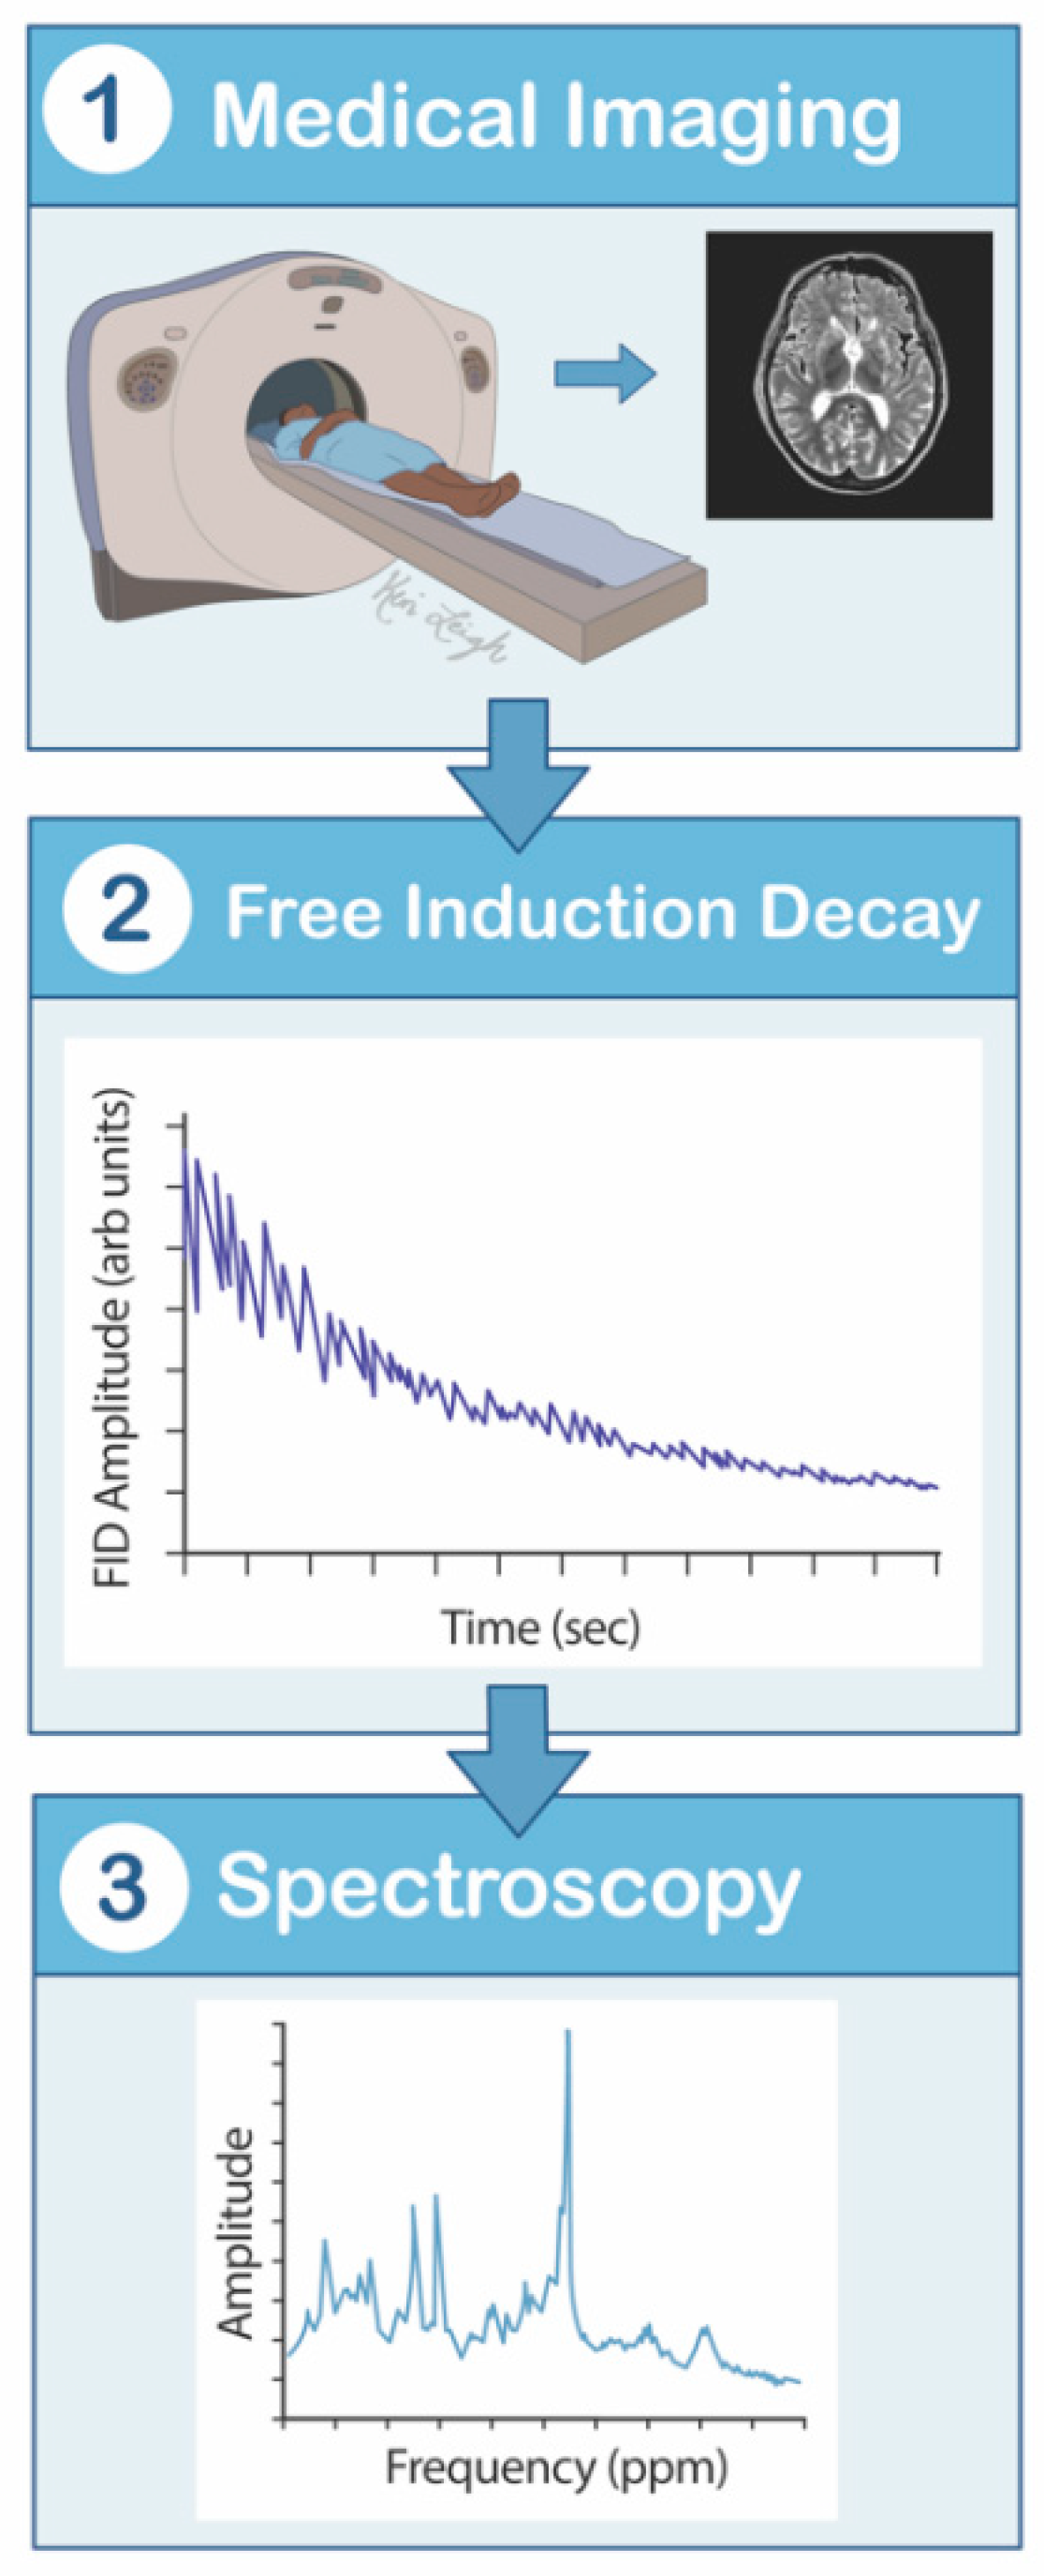
5.1. Magnetic Resonance Spectroscopy
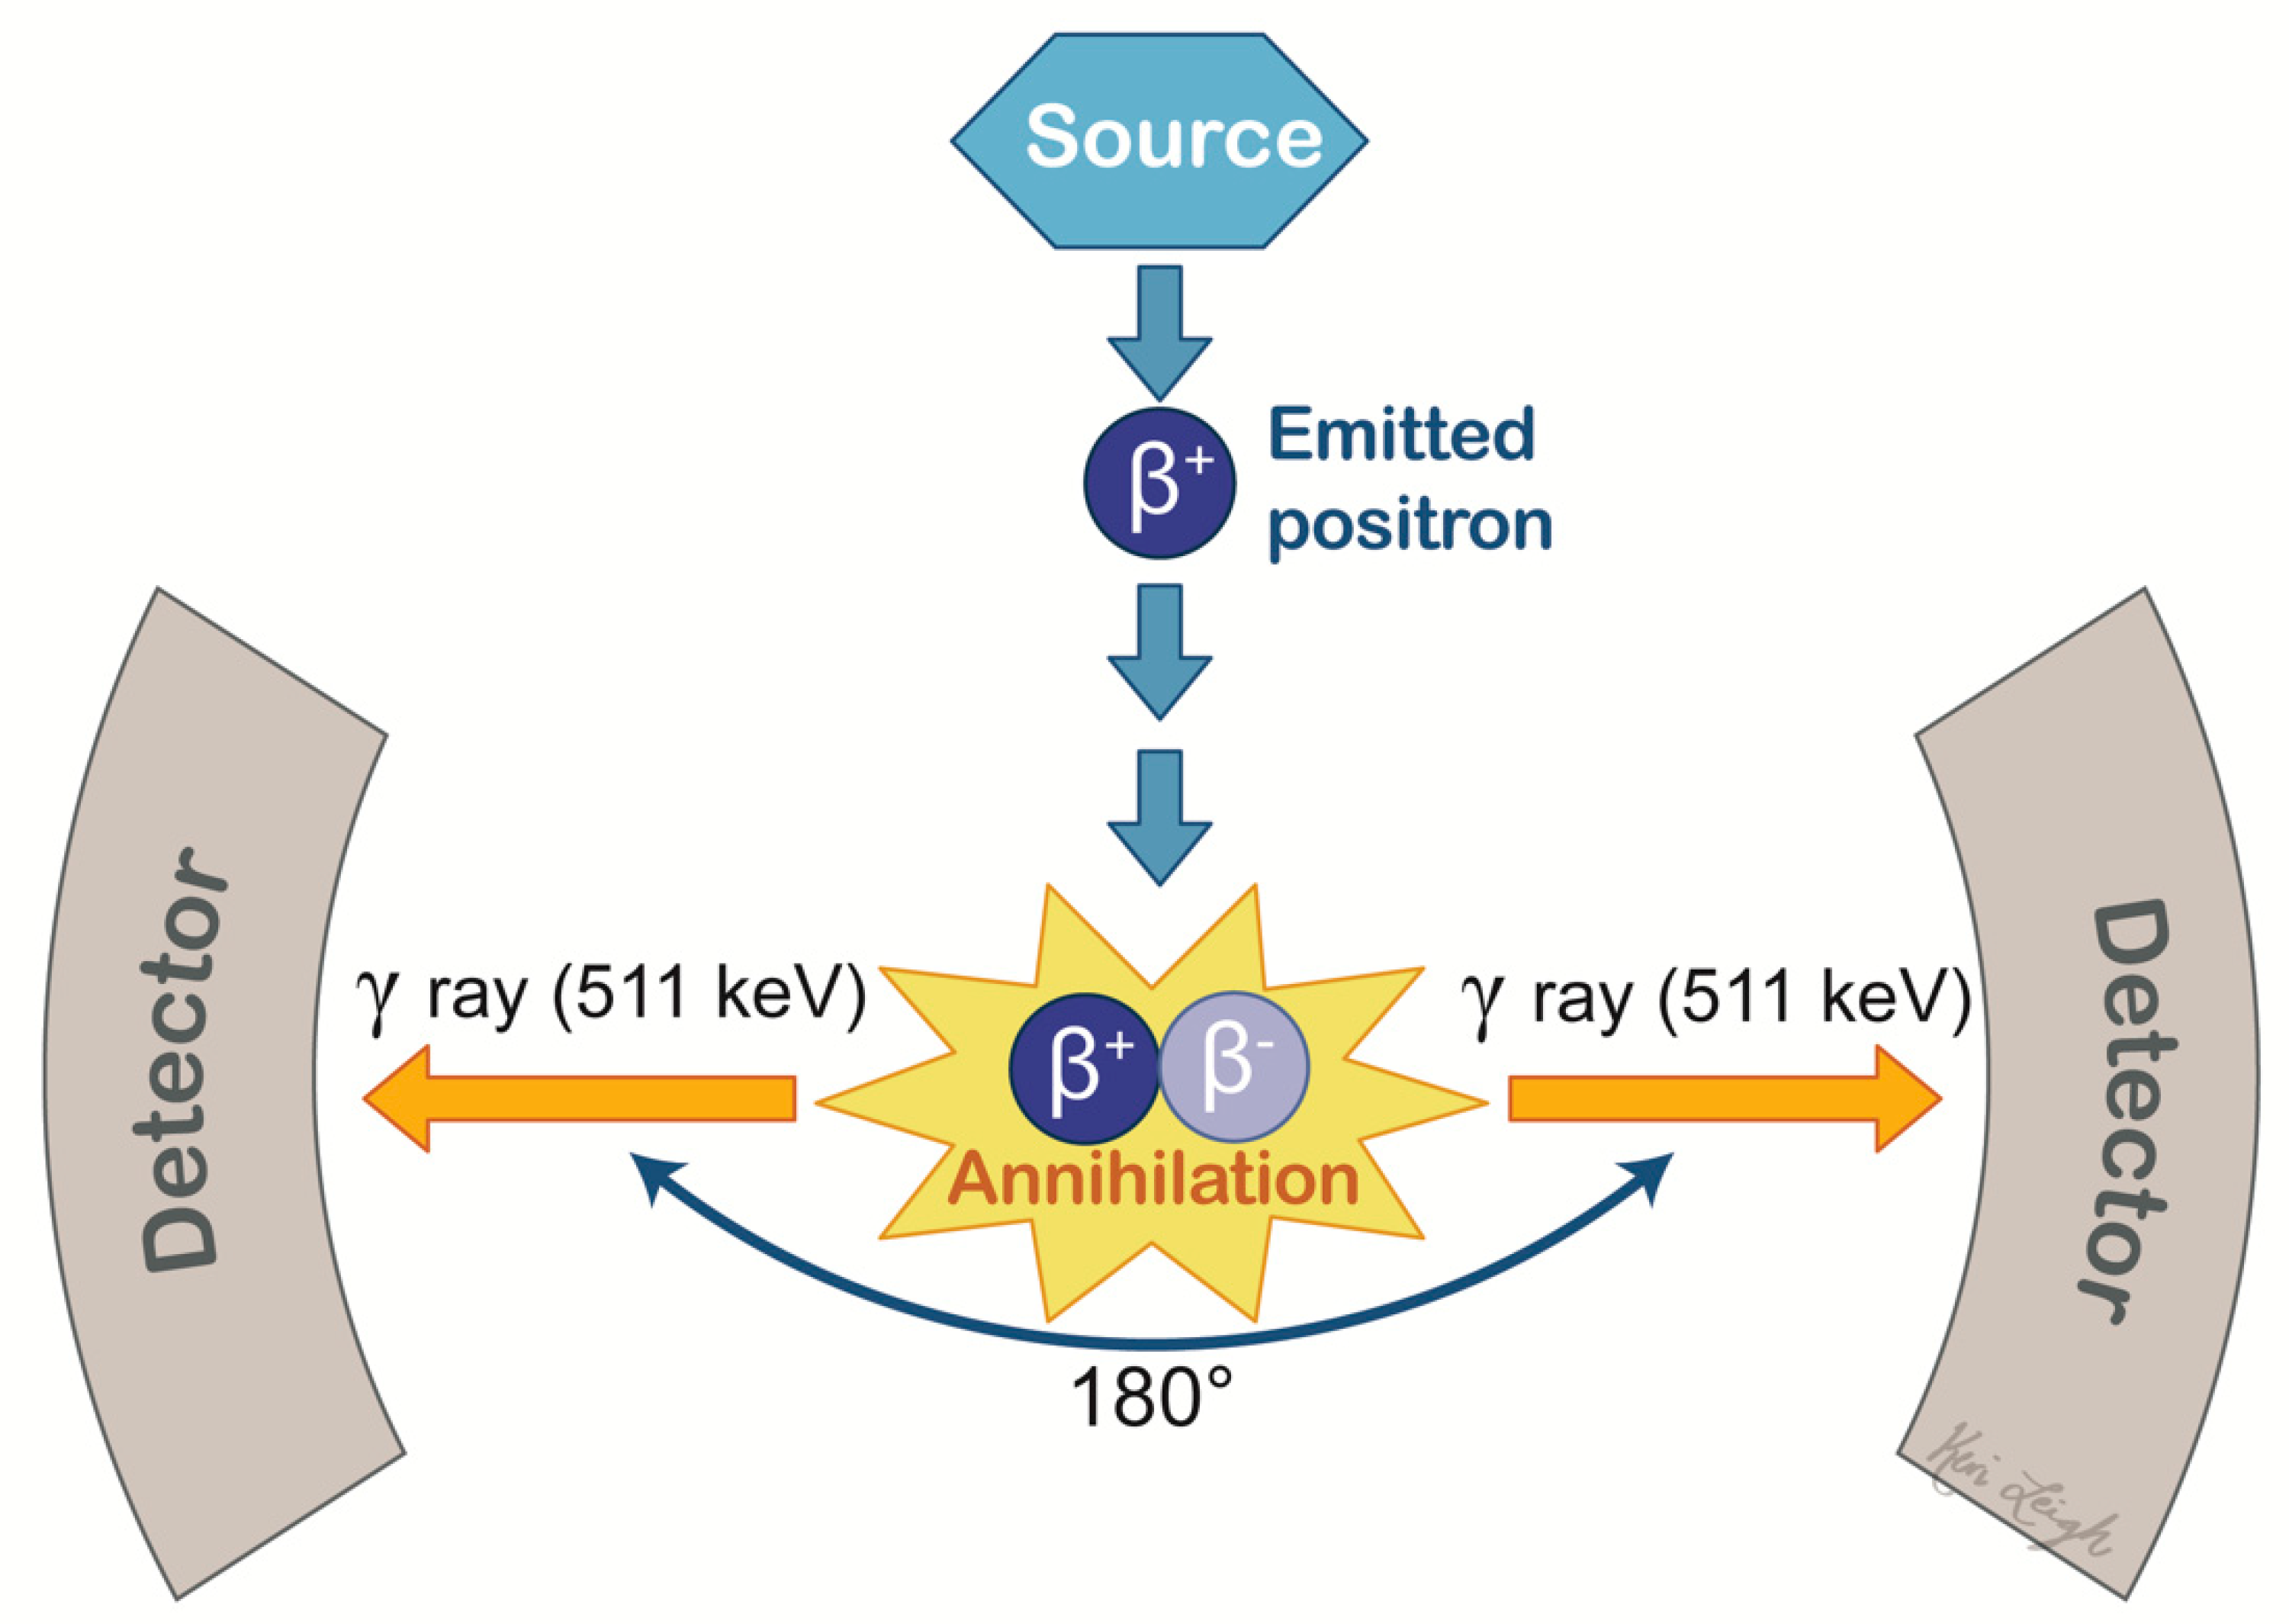
5.2. Positron Emission Tomography
5.3. Single-Photon Emission Computed Tomography
6. Phase Difference-Enhanced Imaging
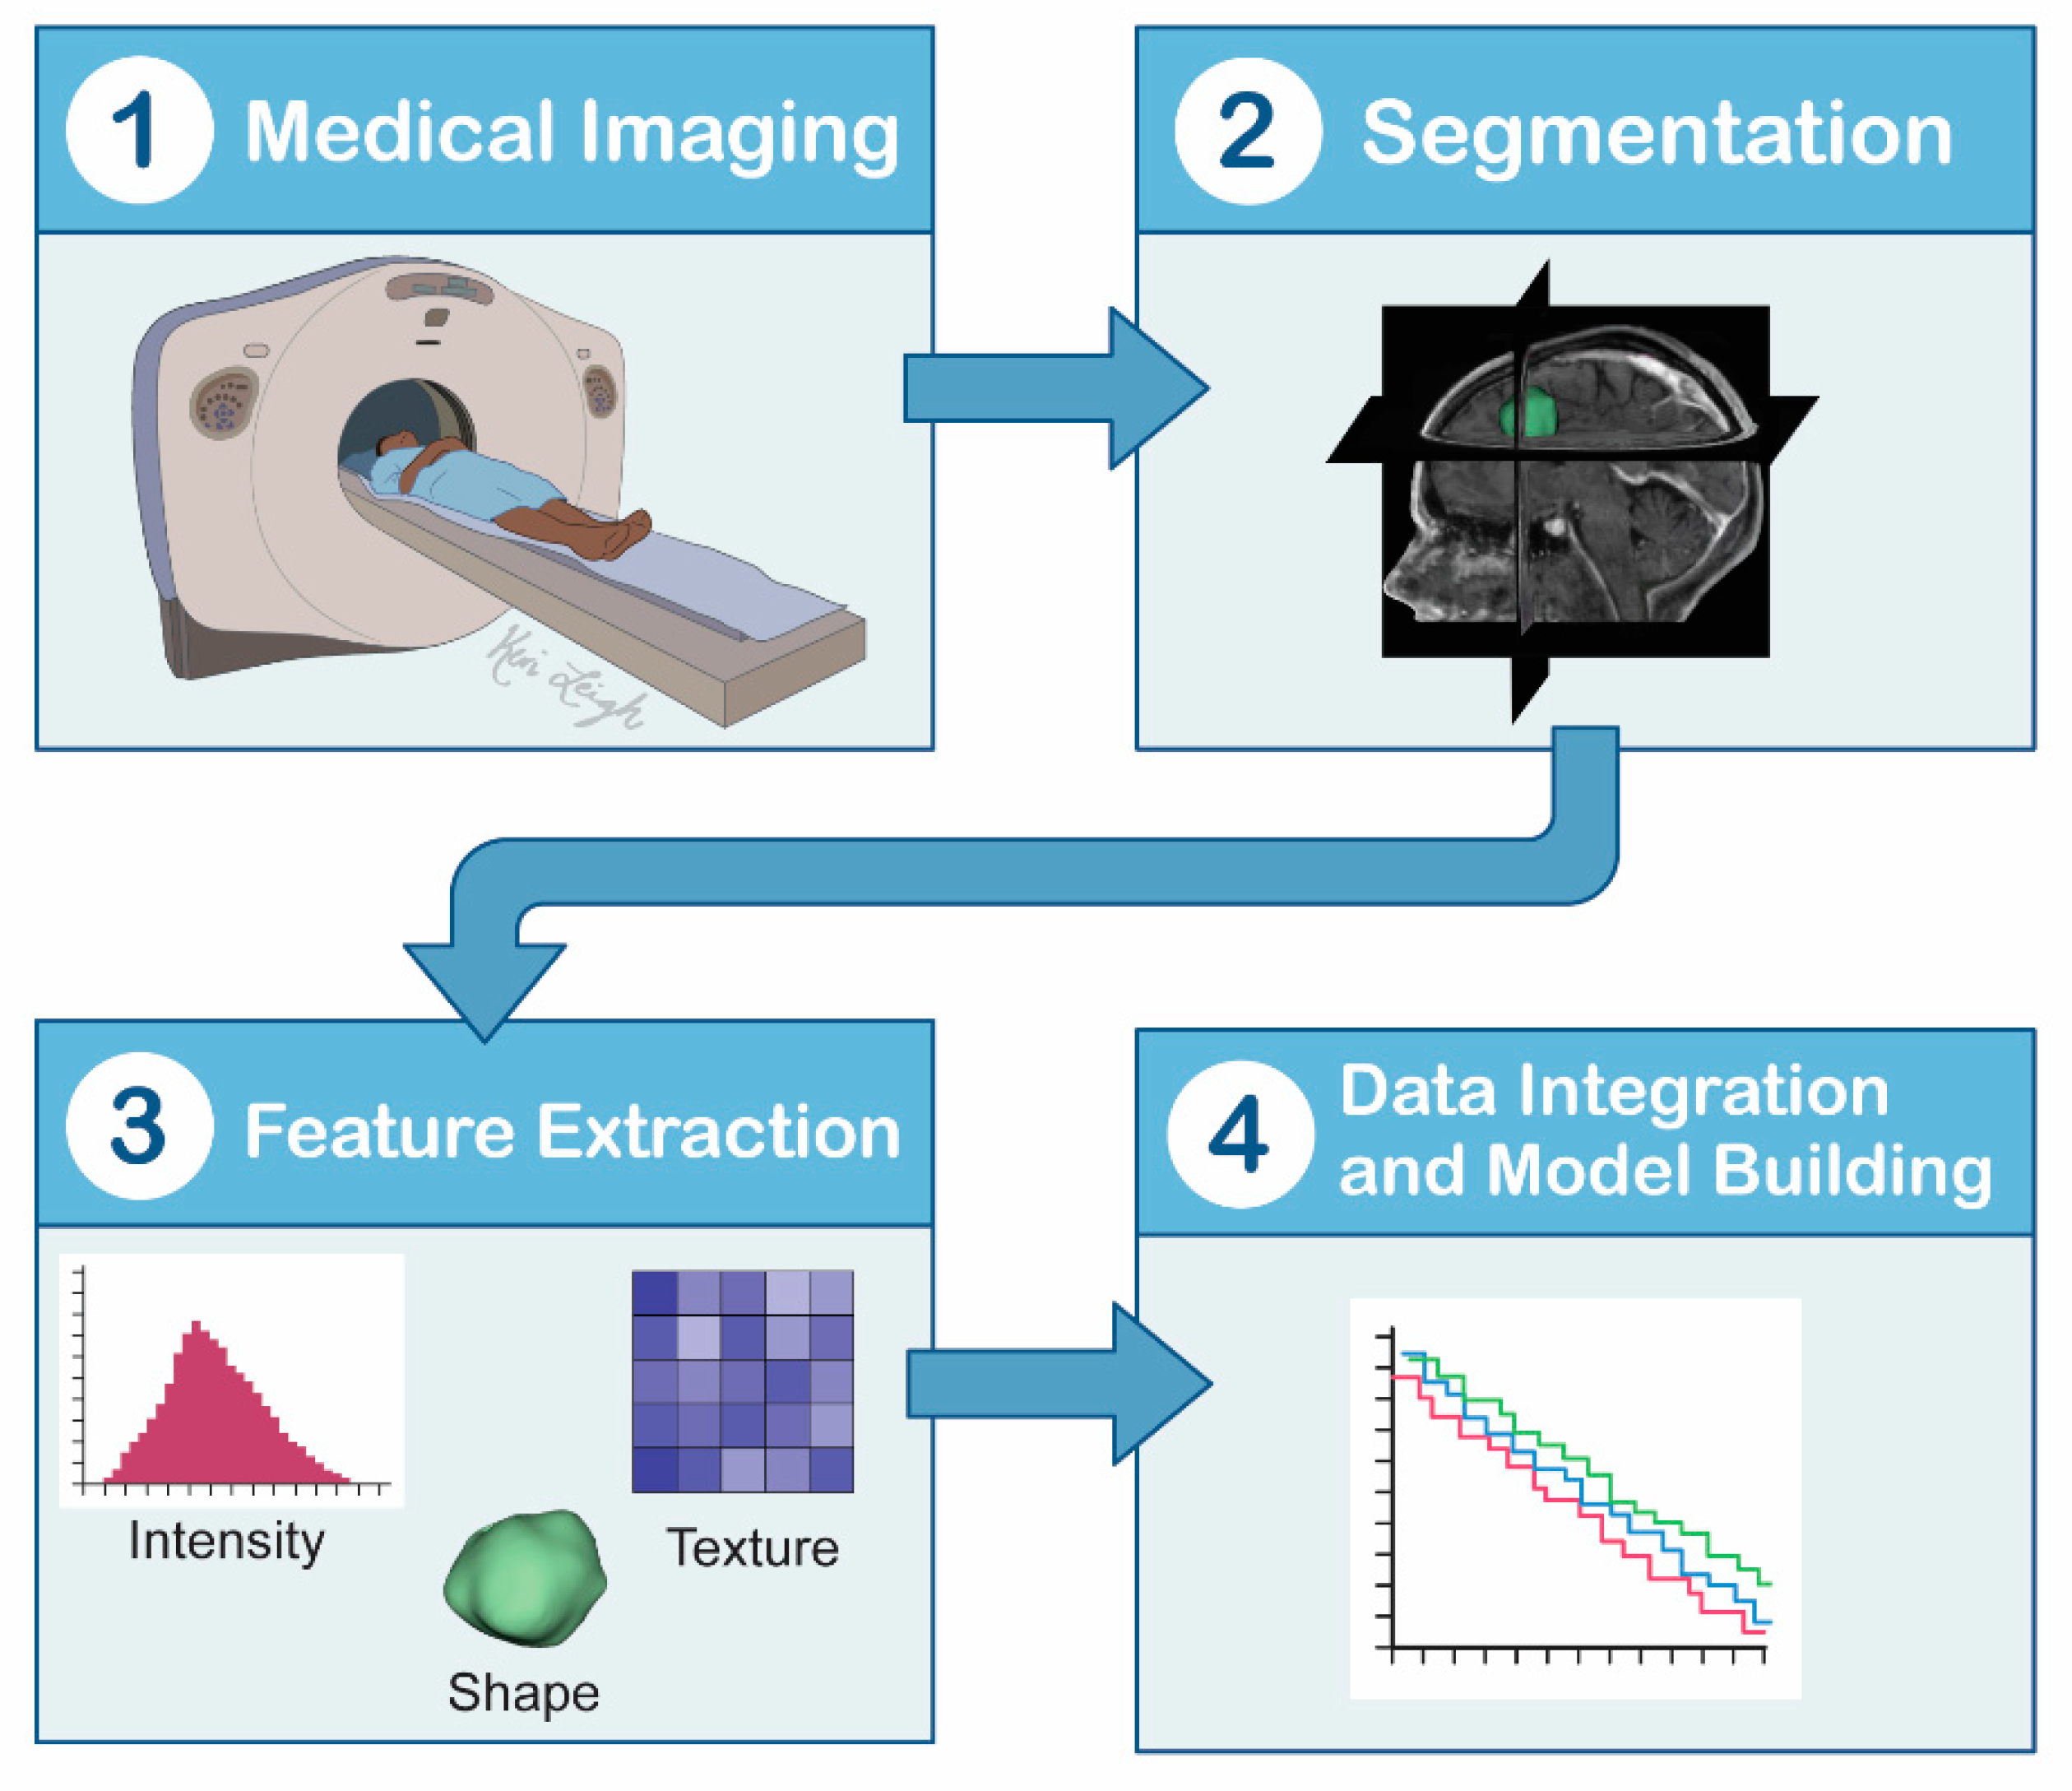
7. Radiomics-Based Machine Learning
8. Conclusions
Author Contributions
Funding
Institutional Review Board Statement
Informed Consent Statement
Data Availability Statement
Conflicts of Interest
References
- Ostrom, Q.T.; Gittleman, H.; Liao, P.; Rouse, C.; Chen, Y.; Dowling, J.; Wolinsky, Y.; Kruchko, C.; Barnholtz-Sloan, J. CBTRUS Statistical Report: Primary brain and central nervous system tumors diagnosed in the United States in 2007–2011. Neuro Oncol. 2014, 16, 1–63. [Google Scholar]
- Fox, B.D.; Cheung, V.J.; Patel, A.J.; Suki, D.; Rao, G. Epidemiology of Metastatic Brain Tumors. Neurosurg. Clin. N. Am. 2011, 22, 1–6. [Google Scholar] [CrossRef]
- Patchell, R.A.; Tibbs, P.A.; Walsh, J.W.; Dempsey, R.J.; Maruyama, Y.; Kryscio, R.J.; Markesbery, W.R.; Macdonald, J.S.; Young, B. A randomized trial of surgery in the treatment of single metastases to the brain. N. Engl. J. Med. 1990, 322, 494–500. [Google Scholar]
- Gavrilovic, I.T.; Posner, J.B. Brain metastases: Epidemiology and pathophysiology. Neurooncology 2005, 75, 5–14. [Google Scholar] [CrossRef]
- Lee, E.J.; Ahn, K.J.; Lee, E.K.; Lee, Y.S.; Kim, D.B. Potential role of advanced MRI techniques for the peritumoural region in differentiating glioblastoma multiforme and solitary metastatic lesions. Clin. Radiol. 2013, 68, 689–697. [Google Scholar]
- Weller, M.; van den Bent, M.; Hopkins, K.; Tonn, J.C.; Stupp, R.; Falini, A.; Cohen-Jonathan-Moyal, E.; Frappaz, D.; Henriksson, R.; Balana, C.; et al. EANO Guideline for the diagnosis and treatment of anaplastic gliomas and glioblastoma. Lancet Oncol. 2014, 15, 395–403. [Google Scholar] [CrossRef] [Green Version]
- Lin, X.; DeAngelis, L.M. Treatment of brain metastases. J. Clin. Oncol. 2015, 33, 3475–3484. [Google Scholar] [CrossRef] [PubMed]
- Oh, J.; Cha, S.; Aiken, A.H.; Han, E.T.; Crane, J.C.; Stainsby, J.A.; Wright, G.A.; Dillon, W.P.; Nelson, S.J. Quantitative apparent diffusion coefficients and T2 relaxation times in characterizing contrast enhancing brain tumors and regions of peritumoral edema. J. Magn. Reson. Imaging 2005, 21, 701–708. [Google Scholar] [PubMed]
- Lu, S.; Ahn, D.; Johnson, G.; Cha, S. Peritumoral diffusion tensor imaging of high-grade gliomas and metastatic brain tumors. Am. J. Neuroradiol. 2003, 24, 937–941. [Google Scholar] [PubMed]
- Tang, Y.M.; Ngai, S.; Stuckey, S. The solitary enhancing cerebral lesion: Can FLAIR aid the differentiation between glioma and metastasis. Am. J. Neuroradiol. 2006, 27, 609–611. [Google Scholar] [PubMed]
- Chiang, I.C.; Kuo, Y.T.; Lu, C.Y.; Yeung, K.W.; Lin, W.C.; Sheu, F.O.; Liu, G.C. Distinction between high-grade gliomas and solitary metastases using peritumoral 3-T magnetic resonance spectroscopy, diffusion, and perfusion imagings. Neuroradiology 2004, 46, 619–627. [Google Scholar] [CrossRef] [PubMed]
- Bulakbasi, N.; Kocaoglu, M.; Ors, F.; Tayfun, C.; Ucoz, T. Combination of single-voxel proton MR spectroscopy and apparent diffusion coefficient calculation in the evaluation of common brain tumors. Am. J. Neuroradiol. 2003, 24, 225–233. [Google Scholar] [PubMed]
- Law, M.; Cha, S.; Knopp, E.A.; Johnson, G.; Arnett, J.; Litt, A.W. High-grade gliomas and solitary metastases: Differentiation by using perfusion and proton spectroscopic MR imaging. Radiology 2002, 222, 715–721. [Google Scholar] [CrossRef]
- Mukundan, S.; Holder, C.; Olson, J.J. Neuroradiological assessment of newly diagnosed glioblastoma. J. Neurooncol. 2008, 89, 259–269. [Google Scholar] [CrossRef]
- Cha, S. Neuroimaging in Neuro-Oncology. Neurotherapeutics 2009, 6, 465–477. [Google Scholar] [CrossRef]
- Magnetic Resonance Imaging (MRI). Available online: https://www.nibib.nih.gov/science-education/science-topics/magnetic-resonance-imaging-mri (accessed on 12 April 2021).
- Stuckey, S.L.; Wijedeera, R. Multicentric/multifocal cerebral lesions: Can fluid-attenuated inversion recovery aid the differentiation between glioma and metastases? J. Med. Imaging Radiat. Oncol. 2008, 52, 134–139. [Google Scholar] [CrossRef]
- Maurer, M.H.; Synowitz, M.; Badakshi, H.; Lohkamp, L.N.; Wüstefeld, J.; Schäfer, M.L.; Wiener, E. Glioblastoma multiforme versus solitary supratentorial brain metastasis: Differentiation based on morphology and magnetic resonance signal characteristics. RoFo Fortschritte auf dem Gebiet der Rontgenstrahlen und der Bildgeb 2013, 185, 235–240. [Google Scholar] [CrossRef] [PubMed] [Green Version]
- Suh, C.H.; Kim, H.S.; Jung, S.C.; Choi, C.G.; Kim, S.J. MRI findings in tumefactive demyelinating lesions: A systematic review and meta-analysis. Am. J. Neuroradiol. 2018, 39, 1643–1649. [Google Scholar] [CrossRef] [PubMed] [Green Version]
- Suh, C.H.; Kim, H.S.; Jung, S.C.; Kim, S.J. Diffusion-Weighted Imaging and Diffusion Tensor Imaging for Differentiating High-Grade Glioma from Solitary Brain Metastasis: A Systematic Review and Meta-Analysis. AJNR. Am. J. Neuroradiol. 2018, 39, 1208–1214. [Google Scholar] [CrossRef] [PubMed]
- Kadota, Y.; Hirai, T.; Azuma, M.; Hattori, Y.; Khant, Z.A.; Hori, M.; Saito, K.; Yokogami, K.; Takeshima, H. Differentiation between glioblastoma and solitary brain metastasis using neurite orientation dispersion and density imaging. J. Neuroradiol. 2020, 47, 197–202. [Google Scholar] [CrossRef] [PubMed]
- Bauer, A.H.; Erly, W.; Moser, F.G.; Maya, M.; Nael, K. Differentiation of solitary brain metastasis from glioblastoma multiforme: A predictive multiparametric approach using combined MR diffusion and perfusion. Neuroradiology 2015, 57, 697–703. [Google Scholar] [CrossRef] [PubMed]
- Crisi, G.; Orsingher, L.; Filice, S. Lipid and macromolecules quantitation in differentiating glioblastoma from solitary metastasis: A short-echo time single-voxel magnetic resonance spectroscopy study at 3 T. J. Comput. Assist. Tomogr. 2013, 37, 265–271. [Google Scholar] [CrossRef] [PubMed]
- Kamson, D.O.; Mittal, S.; Buth, A.; Muzik, O.; Kupsky, W.J.; Robinette, N.L.; Barger, G.R.; Juhász, C. Differentiation of glioblastomas from metastatic brain tumors by tryptophan uptake and kinetic analysis: A positron emission tomographic study with magnetic resonance imaging comparison. Mol. Imaging 2013, 12, 327–337. [Google Scholar] [CrossRef] [PubMed]
- Meier, R.; Pahud de Mortanges, A.; Wiest, R.; Knecht, U. Exploratory Analysis of Qualitative MR Imaging Features for the Differentiation of Glioblastoma and Brain Metastases. Front. Oncol. 2020, 10, 2576. [Google Scholar] [CrossRef]
- Yang, G.; Jones, T.L.; Barrick, T.R.; Howe, F.A. Discrimination between glioblastoma multiforme and solitary metastasis using morphological features derived from the p: Q tensor decomposition of diffusion tensor imaging. NMR Biomed. 2014, 27, 1103–1111. [Google Scholar] [CrossRef]
- Wahsner, J.; Gale, E.M.; Rodríguez-Rodríguez, A.; Caravan, P. Chemistry of MRI contrast agents: Current challenges and new frontiers. Chem. Rev. 2019, 119, 957–1057. [Google Scholar] [CrossRef]
- Runge, V.M. Critical questions regarding gadolinium deposition in the brain and body after injections of the gadolinium-based contrast agents, safety, and clinical recommendations in consideration of the EMA’s pharmacovigilance and risk assessment committee recommendation for suspension of the marketing authorizations for 4 linear agents. Investig. Radiol. 2017, 52, 317–323. [Google Scholar]
- Wang, S.; Kim, S.; Chawla, S.; Wolf, R.L.; Knipp, D.E.; Vossough, A.; O’Rourke, D.M.; Judy, K.D.; Poptani, H.; Melhem, E.R. Differentiation between glioblastomas, solitary brain metastases, and primary cerebral lymphomas using diffusion tensor and dynamic susceptibility contrast-enhanced MR imaging. Am. J. Neuroradiol. 2011, 32, 507–514. [Google Scholar] [CrossRef] [Green Version]
- Van Dijken, B.R.J.; van Laar, P.J.; Smits, M.; Dankbaar, J.W.; Enting, R.H.; van der Hoorn, A. Perfusion MRI in treatment evaluation of glioblastomas: Clinical relevance of current and future techniques. J. Magn. Reson. Imaging 2019, 49, 11–22. [Google Scholar] [CrossRef] [Green Version]
- Neska-Matuszewska, M.; Bladowska, J.; Sąsiadek, M.; Zimny, A. Differentiation of glioblastoma multiforme, metastases and primary central nervous system lymphomas using multiparametric perfusion and diffusion MR imaging of a tumor core and a peritumoral zone—Searching for a practical approach. PLoS ONE 2018, 13, e0191341. [Google Scholar]
- Dickerson, E.; Srinivasan, A. Multicenter Survey of Current Practice Patterns in Perfusion MRI in Neuroradiology: Why, When, and How Is It Performed? Am. J. Roentgenol. 2016, 207, 406–410. [Google Scholar] [CrossRef]
- Essig, M.; Shiroishi, M.S.; Nguyen, T.B.; Saake, M.; Provenzale, J.M.; Enterline, D.; Anzalone, N.; Dörfler, A.; Rovira, À.; Wintermark, M.; et al. Perfusion MRI: The five most frequently asked technical questions. Am. J. Roentgenol. 2013, 200, 24–34. [Google Scholar] [CrossRef] [Green Version]
- Suh, C.H.; Kim, H.S.; Jung, S.C.; Choi, C.G.; Kim, S.J. Perfusion MRI as a diagnostic biomarker for differentiating glioma from brain metastasis: A systematic review and meta-analysis. Eur. Radiol. 2018, 28, 3819–3831. [Google Scholar] [CrossRef] [PubMed]
- Chaudhry, I.H.; O’Donovan, D.G.; Brenchley, P.E.C.; Reid, H.; Roberts, I.S.D. Vascular endothelial growth factor expression correlates with tumour grade and vascularity in gliomas. Histopathology 2001, 39, 409–415. [Google Scholar] [CrossRef] [PubMed]
- Askaner, K.; Rydelius, A.; Engelholm, S.; Knutsson, L.; Lätt, J.; Abul-Kasim, K.; Sundgren, P.C. Differentiation between glioblastomas and brain metastases and regarding their primary site of malignancy using dynamic susceptibility contrast MRI at 3T. J. Neuroradiol. 2019, 46, 367–372. [Google Scholar] [CrossRef]
- Wetzel, S.G.; Cha, S.; Johnson, G.; Lee, P.; Law, M.; Kasow, D.L.; Pierce, S.D.; Xue, X. Relative cerebral blood volume measurements in intracranial mass lesions: Interobserver and intraobserver reproducibility study. Radiology 2002, 224, 797–803. [Google Scholar] [CrossRef] [PubMed]
- Blasel, S.; Jurcoane, A.; Franz, K.; Morawe, G.; Pellikan, S.; Hattingen, E. Elevated peritumoural rCBV values as a mean to differentiate metastases from high-grade gliomas. Acta Neurochir. 2010, 152, 1893–1899. [Google Scholar] [CrossRef]
- Claes, A.; Idema, A.J.; Wesseling, P. Diffuse glioma growth: A guerilla war. Acta Neuropathol. 2007, 114, 443–458. [Google Scholar] [CrossRef] [Green Version]
- Blasel, S.; Franz, K.; Mittelbronn, M.; Morawe, G.; Jurcoane, A.; Pellikan, S.; Zanella, F.; Hattingen, E. The striate sign: Peritumoural perfusion pattern of infiltrative primary and recurrent gliomas. Neurosurg. Rev. 2010, 33, 193–204. [Google Scholar] [CrossRef]
- Cha, S.; Knopp, E.A.; Johnson, G.; Wetzel, S.G.; Litt, A.W.; Zagzag, D. Intracranial mass lesions: Dynamic contrast-enhanced susceptibility-weighted echo-planar perfusion MR imaging. Radiology 2002, 223, 11–29. [Google Scholar] [CrossRef]
- Machein, M.R.; Plate, K.H. VEGF in brain tumors. J. Neurooncol. 2000, 50, 109–120. [Google Scholar] [CrossRef] [PubMed]
- Hakyemez, B.; Erdogan, C.; Bolca, N.; Yildirim, N.; Gokalp, G.; Parlak, M. Evaluation of different cerebral mass lesions by perfusion-weighted MR imaging. J. Magn. Reson. Imaging 2006, 24, 817–824. [Google Scholar] [CrossRef] [PubMed]
- Server, A.; Orheim, T.E.D.; Graff, B.A.; Josefsen, R.; Kumar, T.; Nakstad, P.H. Diagnostic examination performance by using microvascular leakage, cerebral blood volume, and blood flow derived from 3-T dynamic susceptibility-weighted contrast-enhanced perfusion MR imaging in the differentiation of glioblastoma multiforme and brain metastasis. Neuroradiology 2011, 53, 319–330. [Google Scholar] [PubMed]
- Zhang, M.; Olsson, Y. Hematogenous metastases of the human brain—Characteristics of peritumoral brain changes: A review. J. Neurooncol. 1997, 35, 81–89. [Google Scholar] [CrossRef] [PubMed]
- Park, J.E.; Kim, H.S.; Lee, J.; Cheong, E.N.; Shin, I.; Ahn, S.S.; Shim, W.H. Deep-learned time-signal intensity pattern analysis using an autoencoder captures magnetic resonance perfusion heterogeneity for brain tumor differentiation. Sci. Rep. 2020, 10, 21485. [Google Scholar] [CrossRef] [PubMed]
- Coban, G.; Mohan, S.; Kural, F.; Wang, S.; O’Rourke, D.M.; Poptani, H. Prognostic Value of Dynamic Susceptibility Contrast-Enhanced and Diffusion-Weighted MR Imaging in Patients with Glioblastomas. Am. J. Neuroradiol. 2015, 36, 1247–1252. [Google Scholar] [CrossRef] [Green Version]
- Burth, S.; Kickingereder, P.; Eidel, O.; Tichy, D.; Bonekamp, D.; Weberling, L.; Wick, A.; Löw, S.; Hertenstein, A.; Nowosielski, M.; et al. Clinical parameters outweigh diffusion- and perfusion-derived MRI parameters in predicting survival in newly diagnosed glioblastoma. Neuro Oncol. 2016, 18, 1673–1679. [Google Scholar] [CrossRef] [PubMed]
- Cha, S.; Lupo, J.M.; Chen, M.H.; Lamborn, K.R.; McDermott, M.W.; Berger, M.S.; Nelson, S.J.; Dillon, W.P. Differentiation of glioblastoma multiforme and single brain metastasis by peak height and percentage of signal intensity recovery derived from dynamic susceptibility-weighted contrast-enhanced perfusion MR imaging. Am. J. Neuroradiol. 2007, 28, 1078–1084. [Google Scholar] [CrossRef] [PubMed] [Green Version]
- Cindil, E.; Sendur, H.N.; Cerit, M.N.; Dag, N.; Erdogan, N.; Celebi, F.E.; Oner, Y.; Tali, T. Validation of combined use of DWI and percentage signal recovery-optimized protocol of DSC-MRI in differentiation of high-grade glioma, metastasis, and lymphoma. Neuroradiology 2021, 63, 331–342. [Google Scholar] [CrossRef]
- Hu, L.S.; Baxter, L.C.; Smith, K.A.; Feuerstein, B.G.; Karis, J.P.; Eschbacher, J.M.; Coons, S.W.; Nakaji, P.; Yeh, R.F.; Debbins, J.; et al. Relative cerebral blood volume values to differentiate high-grade glioma recurrence from posttreatment radiation effect: Direct correlation between image-guided tissue histopathology and localized dynamic susceptibility-weighted contrast-enhanced perfusion MR imaging measurements. Am. J. Neuroradiol. 2009, 30, 552–558. [Google Scholar]
- Wintermark, M.; Sesay, M.; Barbier, E.; Borbély, K.; Dillon, W.P.; Eastwood, J.D.; Glenn, T.C.; Grandin, C.B.; Pedraza, S.; Soustiel, J.F.; et al. Comparative Overview of Brain Perfusion Imaging Techniques. Stroke 2005, 36, 83–99. [Google Scholar] [CrossRef]
- Keston, P.; Murray, A.D.; Jackson, A. Cerebral perfusion imaging using contrast-enhanced MRI. Clin. Radiol. 2003, 58, 505–513. [Google Scholar] [CrossRef]
- Carroll, T.; Haughton, V.; Rowley, H.; Cordes, D. Confounding effect of large vessels on MR perfusion images analyzed with independent component analysis. Am. J. Neuroradiol. 2002, 23, 1007–1012. [Google Scholar] [PubMed]
- Reber, P.J.; Wong, E.C.; Buxton, R.B.; Frank, L.R. Correction of off resonance-related distortion in echo-planar imaging using EPI-based field maps. Magn. Reson. Med. 1998, 39, 328–330. [Google Scholar] [CrossRef]
- Halshtok Neiman, O.; Sadetzki, S.; Chetrit, A.; Raskin, S.; Yaniv, G.; Hoffmann, C. Perfusion-weighted imaging of peritumoral edema can aid in the differential diagnosis of glioblastoma multiforme versus brain metastasis. Isr. Med. Assoc. J. 2013, 15, 103–105. [Google Scholar] [PubMed]
- Welker, K.; Boxerman, J.; Kalnin, A.; Kaufmann, T.; Shiroishi, M.; Wintermark, M. ASFNR recommendations for clinical performance of MR dynamic susceptibility contrast perfusion imaging of the brain. Am. J. Neuroradiol. 2015, 36, 41–51. [Google Scholar] [CrossRef] [PubMed] [Green Version]
- Akella, N.S.; Twieg, D.B.; Mikkelsen, T.; Hochberg, F.H.; Grossman, S.; Cloud, G.A.; Nabors, L.B. Assessment of brain tumor angiogenesis inhibitors using perfusion magnetic resonance imaging: Quality and analysis results of a phase I trial. J. Magn. Reson. Imaging 2004, 20, 913–922. [Google Scholar] [CrossRef]
- Larsson, H.B.W.; Stubgaard, M.; Frederiksen, J.L.; Jensen, M.; Henriksen, O.; Paulson, O.B. Quantitation of blood-brain barrier defect by magnetic resonance imaging and gadolinium-DTPA in patients with multiple sclerosis and brain tumors. Magn. Reson. Med. 1990, 16, 117–131. [Google Scholar] [CrossRef]
- Sourbron, S.P.; Buckley, D.L. Classic models for dynamic contrast-enhanced MRI. NMR Biomed. 2013, 26, 1004–1027. [Google Scholar] [CrossRef]
- Erlemann, R.; Reiser, M.F.; Peters, P.E.; Vasallo, P.; Nommensen, B.; Kusnierz-Glaz, C.R.; Ritter, J.; Roessner, A. Musculoskeletal neoplasms: Static and dynamic Gd-DTPA-enhanced MR imaging. Radiology 1989, 171, 767–773. [Google Scholar] [CrossRef]
- Jahng, G.H.; Li, K.L.; Ostergaard, L.; Calamante, F. Perfusion magnetic resonance imaging: A comprehensive update on principles and techniques. Korean J. Radiol. 2014, 15, 554–577. [Google Scholar] [CrossRef] [PubMed] [Green Version]
- Tofts, P.S.; Brix, G.; Buckley, D.L.; Evelhoch, J.L.; Henderson, E.; Knopp, M.V.; Larsson, H.B.W.; Lee, T.Y.; Mayr, N.A.; Parker, G.J.M.; et al. Estimating kinetic parameters from dynamic contrast-enhanced T1- weighted MRI of a diffusable tracer: Standardized quantities and symbols. J. Magn. Reson. Imaging 1999, 10, 223–232. [Google Scholar] [CrossRef]
- Jackson, A.; Jayson, G.C.; Li, K.L.; Zhu, X.P.; Checkley, D.R.; Tessier, J.J.L.; Waterton, J.C. Reproducibility of quantitative dynamic contrast-enhanced MRI in newly presenting glioma. Br. J. Radiol. 2003, 76, 153–162. [Google Scholar] [CrossRef] [PubMed]
- Jung, B.C.; Arevalo-Perez, J.; Lyo, J.K.; Holodny, A.I.; Karimi, S.; Young, R.J.; Peck, K.K. Comparison of Glioblastomas and Brain Metastases using Dynamic Contrast-Enhanced Perfusion MRI. J. Neuroimaging 2016, 26, 240–246. [Google Scholar] [CrossRef] [Green Version]
- Zhao, J.; Yang, Z.; Luo, B.; Yang, J.; Chu, J. Quantitative Evaluation of Diffusion and Dynamic Contrast-Enhanced MR in Tumor Parenchyma and Peritumoral Area for Distinction of Brain Tumors. PLoS ONE 2015, 10, e0138573. [Google Scholar] [CrossRef] [Green Version]
- Williams, D.S.; Detre, J.A.; Leigh, J.S.; Koretsky, A.P. Magnetic resonance imaging of perfusion using spin inversion of arterial water. Proc. Natl. Acad. Sci. USA 1992, 89, 212–216. [Google Scholar] [CrossRef] [PubMed] [Green Version]
- White, C.M.; Pope, W.B.; Zaw, T.; Qiao, J.; Naeini, K.M.; Lai, A.; Nghiemphu, P.L.; Wang, J.J.; Cloughesy, T.F.; Ellingson, B.M. Regional and Voxel-Wise Comparisons of Blood Flow Measurements Between Dynamic Susceptibility Contrast Magnetic Resonance Imaging (DSC-MRI) and Arterial Spin Labeling (ASL) in Brain Tumors. J. Neuroimaging 2014, 24, 23–30. [Google Scholar] [CrossRef]
- Schmid, S.; Petersen, E.T.; Van Osch, M.J.P. Insight into the labeling mechanism of acceleration selective arterial spin labeling. Magn. Reson. Mater. Phys. Biol. Med. 2017, 30, 165–174. [Google Scholar] [CrossRef] [Green Version]
- Lehmann, P.; Monet, P.; De Marco, G.; Saliou, G.; Perrin, M.; Stoquart-Elsankari, S.; Bruniau, A.; Vallée, J.N. A comparative study of perfusion measurement in brain tumours at 3 tesla MR: Arterial spin labeling versus dynamic susceptibility contrast-enhanced MRI. Eur. Neurol. 2010, 64, 21–26. [Google Scholar] [CrossRef] [Green Version]
- Noguchi, T.; Yoshiura, T.; Hiwatashi, A.; Togao, O.; Yamashita, K.; Nagao, E.; Shono, T.; Mizoguchi, M.; Nagata, S.; Sasaki, T.; et al. Perfusion imaging of brain tumors using arterial spin-labeling: Correlation with histopathologic vascular density. Am. J. Neuroradiol. 2008, 29, 688–693. [Google Scholar] [CrossRef] [Green Version]
- Järnum, H.; Steffensen, E.G.; Knutsson, L.; Fründ, E.T.; Simonsen, C.W.; Lundbye-Christensen, S.; Shankaranarayanan, A.; Alsop, D.C.; Jensen, F.T.; Larsson, E.M. Perfusion MRI of brain tumours: A comparative study of pseudo-continuous arterial spin labelling and dynamic susceptibility contrast imaging. Neuroradiology 2010, 52, 307–317. [Google Scholar] [CrossRef] [PubMed] [Green Version]
- Warmuth, C.; Günther, M.; Zimmer, C. Quantification of blood flow in brain tumors: Comparison of arterial spin labeling and dynamic susceptibility-weighted contrast-enhanced MR imaging. Radiology 2003, 228, 523–532. [Google Scholar] [CrossRef] [PubMed] [Green Version]
- Buck, J.; Larkin, J.R.; Simard, M.A.; Khrapitchev, A.A.; Chappell, M.A.; Sibson, N.R. Sensitivity of multiphase pseudocontinuous arterial spin labelling (MP pCASL) magnetic resonance imaging for measuring brain and tumour blood flow in mice. Contrast Media Mol. Imaging 2018, 2018, 4580919. [Google Scholar] [CrossRef] [Green Version]
- Gryazov, A.B.; Medvedovska, Y.V.; Gryazov, A.A. Differential diagnostics of a radionecrosis and local tumoral recurrence according to arterial spin labelling after radiosurgery treatment of malignant gliomas of a brain. Wiad. Lek. 2020, 73, 2160–2164. [Google Scholar] [CrossRef] [PubMed]
- Di, N.; Cheng, W.; Chen, H.; Zhai, F.; Liu, Y.; Mu, X.; Chu, Z.; Lu, N.; Liu, X.; Wang, B. Utility of arterial spin labelling MRI for discriminating atypical high-grade glioma from primary central nervous system lymphoma. Clin. Radiol. 2019, 74, 1–9. [Google Scholar] [CrossRef] [PubMed]
- You, S.H.; Yun, T.J.; Choi, H.J.; Yoo, R.E.; Kang, K.M.; Choi, S.H.; Kim, J.H.; Sohn, C.H. Differentiation between primary CNS lymphoma and glioblastoma: Qualitative and quantitative analysis using arterial spin labeling MR imaging. Eur. Radiol. 2018, 28, 3801–3810. [Google Scholar] [CrossRef]
- Lin, L.; Xue, Y.; Duan, Q.; Sun, B.; Lin, H.; Huang, X.; Chen, X. The role of cerebral blood flow gradient in peritumoral edema for differentiation of glioblastomas from solitary metastatic lesions. Oncotarget 2016, 7, 69051–69059. [Google Scholar] [CrossRef] [Green Version]
- Abdel Razek, A.A.K.; Talaat, M.; El-Serougy, L.; Abdelsalam, M.; Gaballa, G. Differentiating Glioblastomas from Solitary Brain Metastases Using Arterial Spin Labeling Perfusion− and Diffusion Tensor Imaging−Derived Metrics. World Neurosurg. 2019, 127, 593–598. [Google Scholar] [CrossRef] [PubMed]
- Ganbold, M.; Harada, M.; Khashbat, D.; Abe, T.; Kageji, T.; Nagahiro, S. Differences in high-intensity signal volume between arterial spin labeling and contrast-enhanced T1-weighted imaging may be useful for differentiating glioblastoma from brain metastasis. J. Med. Investig. 2017, 64, 58–63. [Google Scholar] [CrossRef] [Green Version]
- Le Bihan, D. Diffusion MRI: What water tells us about the brain. EMBO Mol. Med. 2014, 6, 569–573. [Google Scholar] [CrossRef]
- Tournier, J.D.; Mori, S.; Leemans, A. Diffusion tensor imaging and beyond. Magn. Reson. Med. 2011, 65, 1532–1556. [Google Scholar] [CrossRef] [Green Version]
- Yamasaki, F.; Kurisu, K.; Satoh, K.; Arita, K.; Sugiyama, K.; Ohtaki, M.; Takaba, J.; Tominaga, A.; Hanaya, R.; Yoshioka, H.; et al. Apparent diffusion coefficient of human brain tumors at MR imaging. Radiology 2005, 235, 985–991. [Google Scholar] [CrossRef]
- Baliyan, V.; Das, C.J.; Sharma, R.; Gupta, A.K. Diffusion weighted imaging: Technique and applications. World J. Radiol. 2016, 8, 785. [Google Scholar] [CrossRef] [PubMed]
- Serai, S.D. Basics of magnetic resonance imaging and quantitative parameters T1, T2, T2*, T1rho and diffusion-weighted imaging. Pediatr. Radiol. 2021. [Google Scholar] [CrossRef]
- Mannelli, L.; Nougaret, S.; Vargas, H.A.; Do, R.K.G. Advances in Diffusion-Weighted Imaging. Radiol. Clin. N. Am. 2015, 53, 569–581. [Google Scholar] [PubMed] [Green Version]
- Calli, C.; Kitis, O.; Yunten, N.; Yurtseven, T.; Islekel, S.; Akalin, T. Perfusion and diffusion MR imaging in enhancing malignant cerebral tumors. Eur. J. Radiol. 2006, 58, 394–403. [Google Scholar] [CrossRef] [PubMed]
- Kono, K.; Inoue, Y.; Nakayama, K.; Shakudo, M.; Morino, M.; Ohata, K.; Wakasa, K.; Yamada, R. The role of diffusion-weighted imaging in patients with brain tumors. Am. J. Neuroradiol. 2001, 22, 1081–1088. [Google Scholar]
- Krabbe, K.; Gideon, P.; Wagn, P.; Hansen, U.; Thomsen, C.; Madsen, F. MR diffusion imaging of human intracranial tumours. Neuroradiology 1997, 39, 483–489. [Google Scholar] [CrossRef]
- Stadnik, T.W.; Chaskis, C.; Michotte, A.; Shabana, W.M.; van Rompaev, K.; Luypaert, R.; Budinsky, L.; Jellus, V.; Osteaux, M. Diffusion-weighted MR imaging of intracerebral masses: Comparison with conventional MR imaging and histologic findings. Am. J. Neuroradiol. 2001, 22, 969–976. [Google Scholar]
- Tepe, M.; Saylisoy, S.; Toprak, U.; Inan, I. The Potential Role of Peritumoral Apparent Diffusion Coefficient Evaluation in Differentiating Glioblastoma and Solitary Metastatic Lesions of the Brain. Curr. Med. Imaging 2021, 17. [Google Scholar] [CrossRef]
- Zhang, G.; Chen, X.; Zhang, S.; Ruan, X.; Gao, C.; Liu, Z.; Wei, X. Discrimination Between Solitary Brain Metastasis and Glioblastoma Multiforme by Using ADC-Based Texture Analysis: A Comparison of Two Different ROI Placements. Acad. Radiol. 2019, 26, 1466–1472. [Google Scholar] [CrossRef]
- Pavlisa, G.; Rados, M.; Pavlisa, G.; Pavic, L.; Potocki, K.; Mayer, D. The differences of water diffusion between brain tissue infiltrated by tumor and peritumoral vasogenic edema. Clin. Imaging 2009, 33, 96–101. [Google Scholar] [CrossRef] [PubMed]
- Rollin, N.; Guyotat, J.; Streichenberger, N.; Honnorat, J.; Tran Minh, V.A.; Cotton, F. Clinical relevance of diffusion and perfusion magnetic resonance imaging in assessing intra-axial brain tumors. Neuroradiology 2006, 48, 150–159. [Google Scholar] [CrossRef] [PubMed]
- Lee, E.J.; TerBrugge, K.; Mikulis, D.; Choi, D.S.; Bae, J.M.; Lee, S.K.; Moon, S.Y. Diagnostic value of peritumoral minimum apparent diffusion coefficient for differentiation of glioblastoma multiforme from solitary metastatic lesions. Am. J. Roentgenol. 2011, 196, 71–76. [Google Scholar] [CrossRef] [PubMed]
- Provenzale, J.M.; Engelter, S.T.; Petrella, J.R.; Smith, J.S.; MacFall, J.R. Use of MR exponential diffusion-weighted images to eradicate T2 “shine- through” effect. Am. J. Roentgenol. 1999, 172, 537–539. [Google Scholar] [CrossRef] [Green Version]
- Hakyemez, B.; Erdogan, C.; Gokalp, G.; Dusak, A.; Parlak, M. Solitary metastases and high-grade gliomas: Radiological differentiation by morphometric analysis and perfusion-weighted MRI. Clin. Radiol. 2010, 65, 15–20. [Google Scholar] [CrossRef] [PubMed]
- Basser, P.J.; Mattiello, J.; LeBihan, D. MR diffusion tensor spectroscopy and imaging. Biophys. J. 1994, 66, 259–267. [Google Scholar] [CrossRef] [Green Version]
- Beaulieu, C. The basis of anisotropic water diffusion in the nervous system—A technical review. NMR Biomed. 2002, 15, 435–455. [Google Scholar] [CrossRef]
- Soares, J.M.; Marques, P.; Alves, V.; Sousa, N. A hitchhiker’s guide to diffusion tensor imaging. Front. Neurosci. 2013, 7, 31. [Google Scholar] [CrossRef] [Green Version]
- Hagmann, P.; Jonasson, L.; Maeder, P.; Thiran, J.P.; Van Wedeen, J.; Meuli, R. Understanding diffusion MR imaging techniques: From scalar diffusion-weighted imaging to diffusion tensor imaging and beyond. Radiographics 2006, 26, 205–223. [Google Scholar] [CrossRef] [Green Version]
- Le Bihan, D.; Mangin, J.-F.; Poupon, C.; Clark, C.A.; Pappata, S.; Molko, N.; Chabriat, H. Diffusion Tensor Imaging: Concepts and Applications. J Magn. Reson. Imaging 2001, 13, 534–546. [Google Scholar] [CrossRef] [PubMed]
- Thaler, H.T.; Ferber, P.W.; Rottenberg, D.A. A Statistical Method for Determining the Proportions of Gray Matter, White Matter, and CSF using Computed Tomography. Neuroradiology 1978, 16, 133–135. [Google Scholar] [CrossRef] [PubMed]
- Basser’, P.J. New Histological and Physiological Stains Derived from Diffusion-Tensor MR Images. Ann. N. Y. Acad. Sci. 1997, 820, 123–138. [Google Scholar] [CrossRef] [PubMed]
- Pierpaoli, C.; Basser, P.J. Toward a Quantitative Assessment of Diffusion Anisotropy. Magn. Reson. Med. 1996, 36, 893–906. [Google Scholar] [CrossRef] [PubMed]
- Makris, N.; Worth, A.J.; Sorensen, A.G.; Papadimitriou, G.M.; Reese, T.G.; Wedeen, V.J.; Davis, T.L.; W Stakes, S.J.; Caviness, V.S.; Kaplan, E.; et al. Morphometry of In Vivo Human White Matter Association Pathways with Diffusion-Weighted Magnetic Resonance Imaging. Ann. Neurol. 1997, 42, 951–962. [Google Scholar] [CrossRef]
- Chanraud, S.; Zahr, N.; Sullivan, E.V.; Pfefferbaum, A. MR Diffusion Tensor Imaging: A Window into White Matter Integrity of the Working Brain. Neuropsychol. Rev. 2010, 20, 209–225. [Google Scholar] [CrossRef] [PubMed] [Green Version]
- Thomason, M.E.; Dougherty, R.F.; Colich, N.L.; Perry, L.M.; Rykhlevskaia, E.I.; Louro, H.M.; Hallmayer, J.F.; Waugh, C.E.; Bammer, R.; Glover, G.H.; et al. COMT genotype affects prefrontal white matter pathways in children and adolescents. Neuroimage 2010, 53, 926–934. [Google Scholar] [CrossRef] [Green Version]
- Gupta, A.; Shah, A.; Young, R.J.; Holodny, A.I. Imaging of brain tumors: Functional magnetic resonance imaging and diffusion tensor imaging. Neuroimaging Clin. N. Am. 2010, 20, 379–400. [Google Scholar] [CrossRef]
- Byrnes, T.J.D.; Barrick, T.R.; Bell, B.A.; Clark, C.A. Diffusion tensor imaging discriminates between glioblastoma and cerebral metastases in vivo. NMR Biomed. 2011, 24, 54–60. [Google Scholar] [CrossRef]
- Sinha, S.; Bastin, M.E.; Whittle, I.R.; Wardlaw, J.M. Diffusion tensor MR imaging of high-grade cerebral gliomas. Am. J. Neuroradiol. 2002, 23, 520–527. [Google Scholar]
- Beppu, T.; Inoue, T.; Shibata, Y.; Kurose, A.; Arai, H.; Ogasawara, K.; Ogawa, A.; Nakamura, S.; Kabasawa, H. Measurement of fractional anisotropy using diffusion tensor MRI in supratentorial astrocytic tumors. J. Neurooncol. 2003, 63, 109–116. [Google Scholar] [CrossRef]
- White, M.L.; Zhang, Y.; Yu, F.; Jaffar Kazmi, S.A. Diffusion tensor MR imaging of cerebral gliomas: Evaluating fractional anisotropy characteristics. Am. J. Neuroradiol. 2011, 32, 374–381. [Google Scholar] [CrossRef] [Green Version]
- Toh, C.H.; Castillo, M.; Wong, A.M.C.; Wei, K.C.; Wong, H.F.; Ng, S.H.; Wan, Y.L. Primary cerebral lymphoma and glioblastoma multiforme: Differences in diffusion characteristics evaluated with diffusion tensor imaging. Am. J. Neuroradiol. 2008, 29, 471–475. [Google Scholar] [CrossRef] [Green Version]
- Stadlbauer, A.; Ganslandt, O.; Buslei, R.; Hammen, T.; Gruber, S.; Moser, E.; Buchfelder, M.; Salomonowitz, E.; Nimsky, C. Gliomas: Histopathologic evaluation of changes in directionality and magnitude of water diffusion at diffusion-tensor MR imaging. Radiology 2006, 240, 803–810. [Google Scholar] [CrossRef] [PubMed]
- Wang, W.; Steward, C.E.; Desmond, P.M. Diffusion tensor imaging in glioblastoma multiforme and brain metastases: The role of p, q, L, and fractional anisotropy. Am. J. Neuroradiol. 2009, 30, 203–208. [Google Scholar] [CrossRef] [PubMed] [Green Version]
- Lu, S.; Ahn, D.; Johnson, G.; Law, M.; Zagzag, D.; Grossman, R.I. Diffusion-tensor MR imaging of intracranial neoplasia and associated peritumoral edema: Introduction of the tumor infiltration index. Radiology 2004, 232, 221–228. [Google Scholar] [CrossRef] [PubMed]
- Tsuchiya, K.; Fujikawa, A.; Nakajima, M.; Honya, K. Differentiation between solitary brain metastasis and high-grade glioma by diffusion tensor imaging. Br. J. Radiol. 2005, 78, 533–537. [Google Scholar] [CrossRef] [PubMed]
- Jiang, R.; Du, F.Z.; He, C.; Gu, M.; Ke, Z.W.; Li, J.H. The value of diffusion tensor imaging in differentiating high-grade gliomas from brain metastases: A systematic review and meta-analysis. PLoS ONE 2014, 9, e112550. [Google Scholar] [CrossRef]
- Skogen, K.; Schulz, A.; Helseth, E.; Ganeshan, B.; Dormagen, J.B.; Server, A. Texture analysis on diffusion tensor imaging: Discriminating glioblastoma from single brain metastasis. Acta Radiol. 2019, 60, 356–366. [Google Scholar] [CrossRef] [PubMed]
- Tsolaki, E.; Svolos, P.; Kousi, E.; Kapsalaki, E.; Fountas, K.; Theodorou, K.; Tsougos, I. Automated differentiation of glioblastomas from intracranial metastases using 3T MR spectroscopic and perfusion data. Int. J. Comput. Assist. Radiol. Surg. 2013, 8, 751–761. [Google Scholar] [CrossRef]
- Jespersen, S.N.; Bjarkam, C.R.; Nyengaard, J.R.; Chakravarty, M.M.; Hansen, B.; Vosegaard, T.; Østergaard, L.; Yablonskiy, D.; Nielsen, N.C.; Vestergaard-Poulsen, P. Neurite density from magnetic resonance diffusion measurements at ultrahigh field: Comparison with light microscopy and electron microscopy. NeuroImage 2010, 49, 205–216. [Google Scholar] [CrossRef] [Green Version]
- Zhang, H.; Schneider, T.; Wheeler-Kingshott, C.A.; Alexander, D.C. NODDI: Practical in vivo neurite orientation dispersion and density imaging of the human brain. Neuroimage 2012, 61, 1000–1016. [Google Scholar] [CrossRef]
- Kaden, E.; Knösche, T.R.; Anwander, A. Parametric spherical deconvolution: Inferring anatomical connectivity using diffusion MR imaging. Neuroimage 2007, 37, 474–488. [Google Scholar] [CrossRef] [Green Version]
- Jacobs, B.; Driscoll, L.; Schall, M. Life-span dendritic and spine changes in areas 10 and 18 of human cortex: A quantitative golgi study. J. Comp. Neurol. 1997, 386, 661–680. [Google Scholar] [CrossRef]
- Nyúl, L.G.; Udupa, J.K. MR image analysis in multiple sclerosis. Neuroimaging Clin. N. Am. 2000, 10, 799–815. [Google Scholar]
- Bruijn, L.I.; Miller, T.M.; Cleveland, D.W. Unraveling the mechanisms involved in motor neuron degeneration in ALS. Annu. Rev. Neurosci. 2004, 27, 723–749. [Google Scholar] [CrossRef] [PubMed] [Green Version]
- Paula-Barbosa, M.M.; Mota Cardoso, R.; Guimaraes, M.L.; Cruz, C. Dendritic degeneration and regrowth in the cerebral cortex of patients with Alzheimer’s disease. J. Neurol. Sci. 1980, 45, 129–134. [Google Scholar] [CrossRef]
- Mao, J.; Zeng, W.; Zhang, Q.; Yang, Z.; Yan, X.; Zhang, H.; Wang, M.; Yang, G.; Zhou, M.; Shen, J. Differentiation between high-grade gliomas and solitary brain metastases: A comparison of five diffusion-weighted MRI models. BMC Med. Imaging 2020, 20, 124. [Google Scholar] [CrossRef] [PubMed]
- Jensen, J.H.; Helpern, J.A. MRI quantification of non-Gaussian water diffusion by kurtosis analysis. NMR Biomed. 2010, 23, 698–710. [Google Scholar] [CrossRef]
- Buonocore, M.H.; Maddock, R.J. Magnetic resonance spectroscopy of the brain: A review of physical principles and technical methods. Rev. Neurosci. 2015, 26, 609–632. [Google Scholar] [CrossRef] [PubMed]
- Thomsen, C.; Jensen, K.E.; Achten, E.; Henriksen, O. In vivo magnetic resonance imaging and 31P spectroscopy of large human brain tumours at 1.5 tesla. Acta Radiol. 1988, 29, 77–82. [Google Scholar] [CrossRef]
- Opstad, K.S.; Murphy, M.M.; Wilkins, P.R.; Bell, B.A.; Griffiths, J.R.; Howe, F.A. Differentiation of metastases from high-grade gliomas using short echo time 1H spectroscopy. J. Magn. Reson. Imaging 2004, 20, 187–192. [Google Scholar] [CrossRef] [PubMed]
- Tsougos, I.; Svolos, P.; Kousi, E.; Fountas, K.; Theodorou, K.; Fezoulidis, I.; Kapsalaki, E. Differentiation of glioblastoma multiforme from metastatic brain tumor using proton magnetic resonance spectroscopy, diffusion and perfusion metrics at 3 T. Cancer Imaging 2012, 12, 423–436. [Google Scholar] [CrossRef]
- Knopp, E.A.; Cha, S.; Johnson, G.; Mazumdar, A.; Golfinos, J.G.; Zagzag, D.; Miller, D.C.; Kelly, P.J.; Kricheff, I.I. Glial neoplasms: Dynamic contrast-enhanced T2*-weighted MR imaging. Radiology 1999, 211, 791–798. [Google Scholar] [CrossRef] [PubMed]
- Cho, S.K.; Na, D.G.; Ryoo, J.W.; Roh, H.G.; Moon, C.H.; Byun, H.S.; Kim, J.H. Perfusion MR Imaging: Clinical Utility for the Differential Diagnosis of Various Brain Tumors. Korean J. Radiol. 2002, 3, 171–179. [Google Scholar] [CrossRef] [PubMed]
- Ishimaru, H.; Morikawa, M.; Iwanaga, S.; Kaminogo, M.; Ochi, M.; Hayashi, K. Differentiation between high-grade glioma and metastatic brain tumor using single-voxel proton MR spectroscopy. Eur. Radiol. 2001, 11, 1784–1791. [Google Scholar] [CrossRef] [PubMed]
- Kimura, T.; Sako, K.; Gotoh, T.; Tanaka, K.; Tanaka, T. In vivo single-voxel proton MR spectroscopy in brain lesions with ring-like enhancement. NMR Biomed. 2001, 14, 339–349. [Google Scholar] [CrossRef] [PubMed]
- McBride, D.Q.; Miller, B.L.; Nikas, D.L.; Buchthal, S.; Chang, L.; Chiang, F.; Booth, R.A. Analysis of brain tumors using 1H magnetic resonance spectroscopy. Surg. Neurol. 1995, 44, 137–144. [Google Scholar] [CrossRef]
- Bruhn, H.; Frahm, J.; Gyngell, M.L.; Merboldt, K.D.; Hanincke, W.; Sauter, R.; Hamburger, C. Noninvasive differentiation of tumors with use of localized H-1 MR spectroscopy in vivo: Initial experience in patients with cerebral tumors. Radiology 1989, 172, 541–548. [Google Scholar] [CrossRef]
- Al-Okaili, R.N.; Krejza, J.; Wang, S.; Woo, J.H.; Melhem, E.R. Advanced MR imaging techniques in the diagnosis of intraaxial brain tumors in adults. Radiographics 2006, 26, 173–189. [Google Scholar] [CrossRef]
- Sijens, P.E.; Knopp, M.V.; Brunetti, A.; Wicklow, K.; Alfano, B.; Bachert, P.; Sanders, J.A.; Stillman, A.E.; Kett, H.; Sauter, R.; et al. 1H MR Spectroscopy in Patients with Metastatic Brain Tumors: A Multicenter Study. Magn. Reson. Med. 1995, 33, 818–826. [Google Scholar] [CrossRef]
- Poptani, H.; Gupta, R.K.; Roy, R.; Pandey, R.; Jain, V.K.; Chhabra, D.K. Characterization of Intracranial Mass Lesions with In Vivo Proton MR Spectroscopy. Am. J. Neuroradiol. 1995, 16, 1593–1603. [Google Scholar] [PubMed]
- Fulham, M.J.; Bizzi, A.; Dietz, M.J.; Shih, H.H.L.; Raman, R.; Sobering, G.S.; Frank, J.A.; Dwyer, A.J.; Alger, J.R.; Di Chiro, G. Mapping of brain tumor metabolites with proton MR spectroscopic imaging: Clinical relevance. Radiology 1992, 185, 675–686. [Google Scholar] [CrossRef]
- Dikaios, N. Deep learning magnetic resonance spectroscopy fingerprints of brain tumours using quantum mechanically synthesised data. NMR Biomed. 2021, 34, e4479. [Google Scholar] [CrossRef] [PubMed]
- Lameka, K.; Farwell, M.D.; Ichise, M. Positron Emission Tomography. Handb. Clin. Neurol. 2016, 135, 209–227. [Google Scholar] [PubMed] [Green Version]
- Spanoudaki, V.C.; Levin, C.S. Photo-detectors for time of flight positron emission tomography (ToF-PET). Sensors 2010, 10, 10484–10505. [Google Scholar] [CrossRef]
- Purandare, N.C.; Puranik, A.; Shah, S.; Agrawal, A.; Gupta, T.; Moiyadi, A.; Shetty, P.; Shridhar, E.; Jalali, R.; Rangarajan, V. Common malignant brain tumors: Can 18 F-FDG PET/CT aid in differentiation? Nucl. Med. Commun. 2017, 38, 1109–1116. [Google Scholar] [CrossRef] [PubMed]
- Holzgreve, A.; Albert, N.L.; Galldiks, N.; Suchorska, B. Use of pet imaging in neuro-oncological surgery. Cancers 2021, 13, 2093. [Google Scholar] [CrossRef]
- Rahmim, A.; Zaidi, H. PET versus SPECT: Strengths, limitations and challenges. Nucl. Med. Commun. 2008, 29, 193–207. [Google Scholar] [CrossRef] [Green Version]
- Beauchesne, P.; Soler, C.; Mosnier, J.F. Diffuse vertebral body metastasis from a glioblastoma multiforme: A technetium-99m Sestamibi single-photon emission computerized tomography study: Case report. J. Neurosurg. 2000, 93, 887–890. [Google Scholar] [CrossRef]
- Doishita, S.; Sakamoto, S.; Yoneda, T.; Uda, T.; Tsukamoto, T.; Yamada, E.; Yoneyama, M.; Kimura, D.; Katayama, Y.; Tatekawa, H.; et al. Differentiation of brain metastases and gliomas based on color map of phase difference enhanced imaging. Front. Neurol. 2018, 9, 788. [Google Scholar] [CrossRef]
- Sachdeva, J.; Kumar, V.; Gupta, I.; Khandelwal, N.; Ahuja, C.K. Segmentation, feature extraction, and multiclass brain tumor classification. J. Digit. Imaging 2013, 26, 1141–1150. [Google Scholar] [CrossRef] [PubMed] [Green Version]
- Zacharaki, E.; Wang, S.; Chawla, S.; Yoo, D.S.; Wolf, R.; Melhem, E.R.; Davatzikos, C. Classification of brain tumor type and grade using MRI texture and shape in a machine learning scheme. Magn. Reson. Med. 2009, 62, 1609–1618. [Google Scholar] [CrossRef] [Green Version]
- Yamashita, K.; Yoshiura, T.; Arimura, H.; Mihara, F.; Noguchi, T.; Hiwatashi, A.; Togao, O.; Yamashita, Y.; Shono, T.; Kumazawa, S.; et al. Performance evaluation of radiologists with artificial neural network for differential diagnosis of intra-axial cerebral tumors on MR images. Am. J. Neuroradiol. 2008, 29, 1153–1158. [Google Scholar] [CrossRef] [Green Version]
- Alcaide-Leon, P.; Dufort, P.; Geraldo, A.F.; Alshafai, L.; Maralani, P.J.; Spears, J.; Bharatha, A. Differentiation of enhancing glioma and primary central nervous system lymphoma by texture-based machine learning. Am. J. Neuroradiol. 2017, 38, 1145–1150. [Google Scholar] [CrossRef] [PubMed] [Green Version]
- Artzi, M.; Bressler, I.; Ben Bashat, D. Differentiation between glioblastoma, brain metastasis and subtypes using radiomics analysis. J. Magn. Reson. Imaging 2019, 50, 519–528. [Google Scholar] [CrossRef] [PubMed]
- Bae, S.; An, C.; Soo Ahn, S.; Kim, H.; Han, K.; Wook Kim, S.; Eun Park, J.; Sung Kim, H.; Lee, S.-K. Robust performance of deep learning for distinguishing glioblastoma from single brain metastasis using radiomic features: Model development and validation. Sci. Rep. 2020, 10, 12110. [Google Scholar] [CrossRef] [PubMed]
- Dong, F.; Li, Q.; Jiang, B.; Zhu, X.; Zeng, Q.; Huang, P.; Chen, S.; Zhang, M. Differentiation of supratentorial single brain metastasis and glioblastoma by using peri-enhancing oedema region–derived radiomic features and multiple classifiers. Eur. Radiol. 2020, 30, 3015–3022. [Google Scholar] [CrossRef] [PubMed]
- Qian, Z.; Li, Y.; Wang, Y.; Li, L.; Li, R.; Wang, K.; Li, S.; Tang, K.; Zhang, C.; Fan, X.; et al. Differentiation of glioblastoma from solitary brain metastases using radiomic machine-learning classifiers. Cancer Lett. 2019, 451, 128–135. [Google Scholar] [CrossRef]
- Tateishi, M.; Nakaura, T.; Kitajima, M.; Uetani, H.; Nakagawa, M.; Inoue, T.; Kuroda, J.I.; Mukasa, A.; Yamashita, Y. An initial experience of machine learning based on multi-sequence texture parameters in magnetic resonance imaging to differentiate glioblastoma from brain metastases. J. Neurol. Sci. 2020, 410, 116514. [Google Scholar] [CrossRef]
- Swinburne, N.C.; Schefflein, J.; Sakai, Y.; Oermann, E.K.; Titano, J.J.; Chen, I.; Tadayon, S.; Aggarwal, A.; Doshi, A.; Nael, K. Machine learning for semi automated classification of glioblastoma, brain metastasis and central nervous system lymphoma using magnetic resonance advanced imaging. Ann. Transl. Med. 2019, 7, 232. [Google Scholar] [CrossRef]
- Petrujkić, K.; Milošević, N.; Rajković, N.; Stanisavljević, D.; Gavrilović, S.; Dželebdžić, D.; Ilić, R.; Di Ieva, A.; Maksimović, R. Computational quantitative MR image features—A potential useful tool in differentiating glioblastoma from solitary brain metastasis. Eur. J. Radiol. 2019, 119, 108634. [Google Scholar] [CrossRef] [PubMed]
- Yang, G.; Jones, T.L.; Howe, F.A.; Barrick, T.R. Morphometric model for discrimination between glioblastoma multiforme and solitary metastasis using three-dimensional shape analysis. Magn. Reson. Med. 2016, 75, 2505–2516. [Google Scholar] [CrossRef] [PubMed] [Green Version]
- Turcan, S.; Rohle, D.; Goenka, A.; Walsh, L.A.; Fang, F.; Yilmaz, E.; Campos, C.; Fabius, A.W.M.; Lu, C.; Ward, P.S.; et al. IDH1 mutation is sufficient to establish the glioma hypermethylator phenotype. Nature 2012, 483, 479–483. [Google Scholar] [CrossRef] [PubMed]
- Noorani, I.; De La Rosa, J.; Choi, Y.; Strong, A.; Ponstingl, H.; Vijayabaskar, M.S.; Lee, J.; Lee, E.; Richard-Londt, A.; Friedrich, M.; et al. PiggyBac mutagenesis and exome sequencing identify genetic driver landscapes and potential therapeutic targets of EGFR-mutant gliomas. Genome Biol. 2020, 21, 1–36. [Google Scholar]
- Rathore, S.; Akbari, H.; Rozycki, M.; Abdullah, K.G.; Nasrallah, M.P.; Binder, Z.A.; Davuluri, R.V.; Lustig, R.A.; Dahmane, N.; Bilello, M.; et al. Radiomic MRI signature reveals three distinct subtypes of glioblastoma with different clinical and molecular characteristics, offering prognostic value beyond IDH1. Sci. Rep. 2018, 8, 5087. [Google Scholar] [CrossRef] [PubMed]
- Bakas, S.; Akbari, H.; Pisapia, J.; Martinez-Lage, M.; Rozycki, M.; Rathore, S.; Dahmane, N.; O’Rourke, D.M.; Davatzikos, C. In vivo detection of EGFRvIII in glioblastoma via perfusion magnetic resonance imaging signature consistent with deep peritumoral infiltration: The φ-index. Clin. Cancer Res. 2017, 23, 4724–4734. [Google Scholar] [CrossRef] [PubMed] [Green Version]


| Imaging Technique | Sensitivity | Specificity | Accuracy |
|---|---|---|---|
| Traditional MRI with ratio of peritumoral area to enhancing mass with a cutoff value of 2.35 [18] | 84% | 45% | 68% |
| Decrease in FLAIR signal in glioblastoma compared with metastasis [10] | 44% | 91% | |
| Dynamic susceptibility contrast perfusion using rCBV [19] | 90% | 91% | |
| Both DWI and DTI [20] | 79.8% | 80.9% | |
| Diffusion tensor imaging using a VEC threshold of 0.48 [21] | 100% | 83.3% | |
| DTI parameters with DSC [22] | 60–91% | 55–100% | 98% |
| MRS with LM13 class lipids and cutoff of 81 mM [23] | 81% | 78% | 85% |
| PET imaging with α [11C] methyl-l-tryptophan with kinetic tracer analysis [24] | 93% | ||
| Machine learning algorithm with MRS and DSC data [25] | 98% | ||
| Two-dimensional morphological feature extraction for DTI [26] | 97.9% |
Publisher’s Note: MDPI stays neutral with regard to jurisdictional claims in published maps and institutional affiliations. |
© 2021 by the authors. Licensee MDPI, Basel, Switzerland. This article is an open access article distributed under the terms and conditions of the Creative Commons Attribution (CC BY) license (https://creativecommons.org/licenses/by/4.0/).
Share and Cite
Fordham, A.-J.; Hacherl, C.-C.; Patel, N.; Jones, K.; Myers, B.; Abraham, M.; Gendreau, J. Differentiating Glioblastomas from Solitary Brain Metastases: An Update on the Current Literature of Advanced Imaging Modalities. Cancers 2021, 13, 2960. https://doi.org/10.3390/cancers13122960
Fordham A-J, Hacherl C-C, Patel N, Jones K, Myers B, Abraham M, Gendreau J. Differentiating Glioblastomas from Solitary Brain Metastases: An Update on the Current Literature of Advanced Imaging Modalities. Cancers. 2021; 13(12):2960. https://doi.org/10.3390/cancers13122960
Chicago/Turabian StyleFordham, Austin-John, Caitlin-Craft Hacherl, Neal Patel, Keri Jones, Brandon Myers, Mickey Abraham, and Julian Gendreau. 2021. "Differentiating Glioblastomas from Solitary Brain Metastases: An Update on the Current Literature of Advanced Imaging Modalities" Cancers 13, no. 12: 2960. https://doi.org/10.3390/cancers13122960