
A Comparative Study on the Mechanical Properties of Open-Hole Carbon Fiber-Reinforced Thermoplastic and Thermosetting Composite Materials


Abstract
:1. Introduction
2. Constitutive Model and Experiment
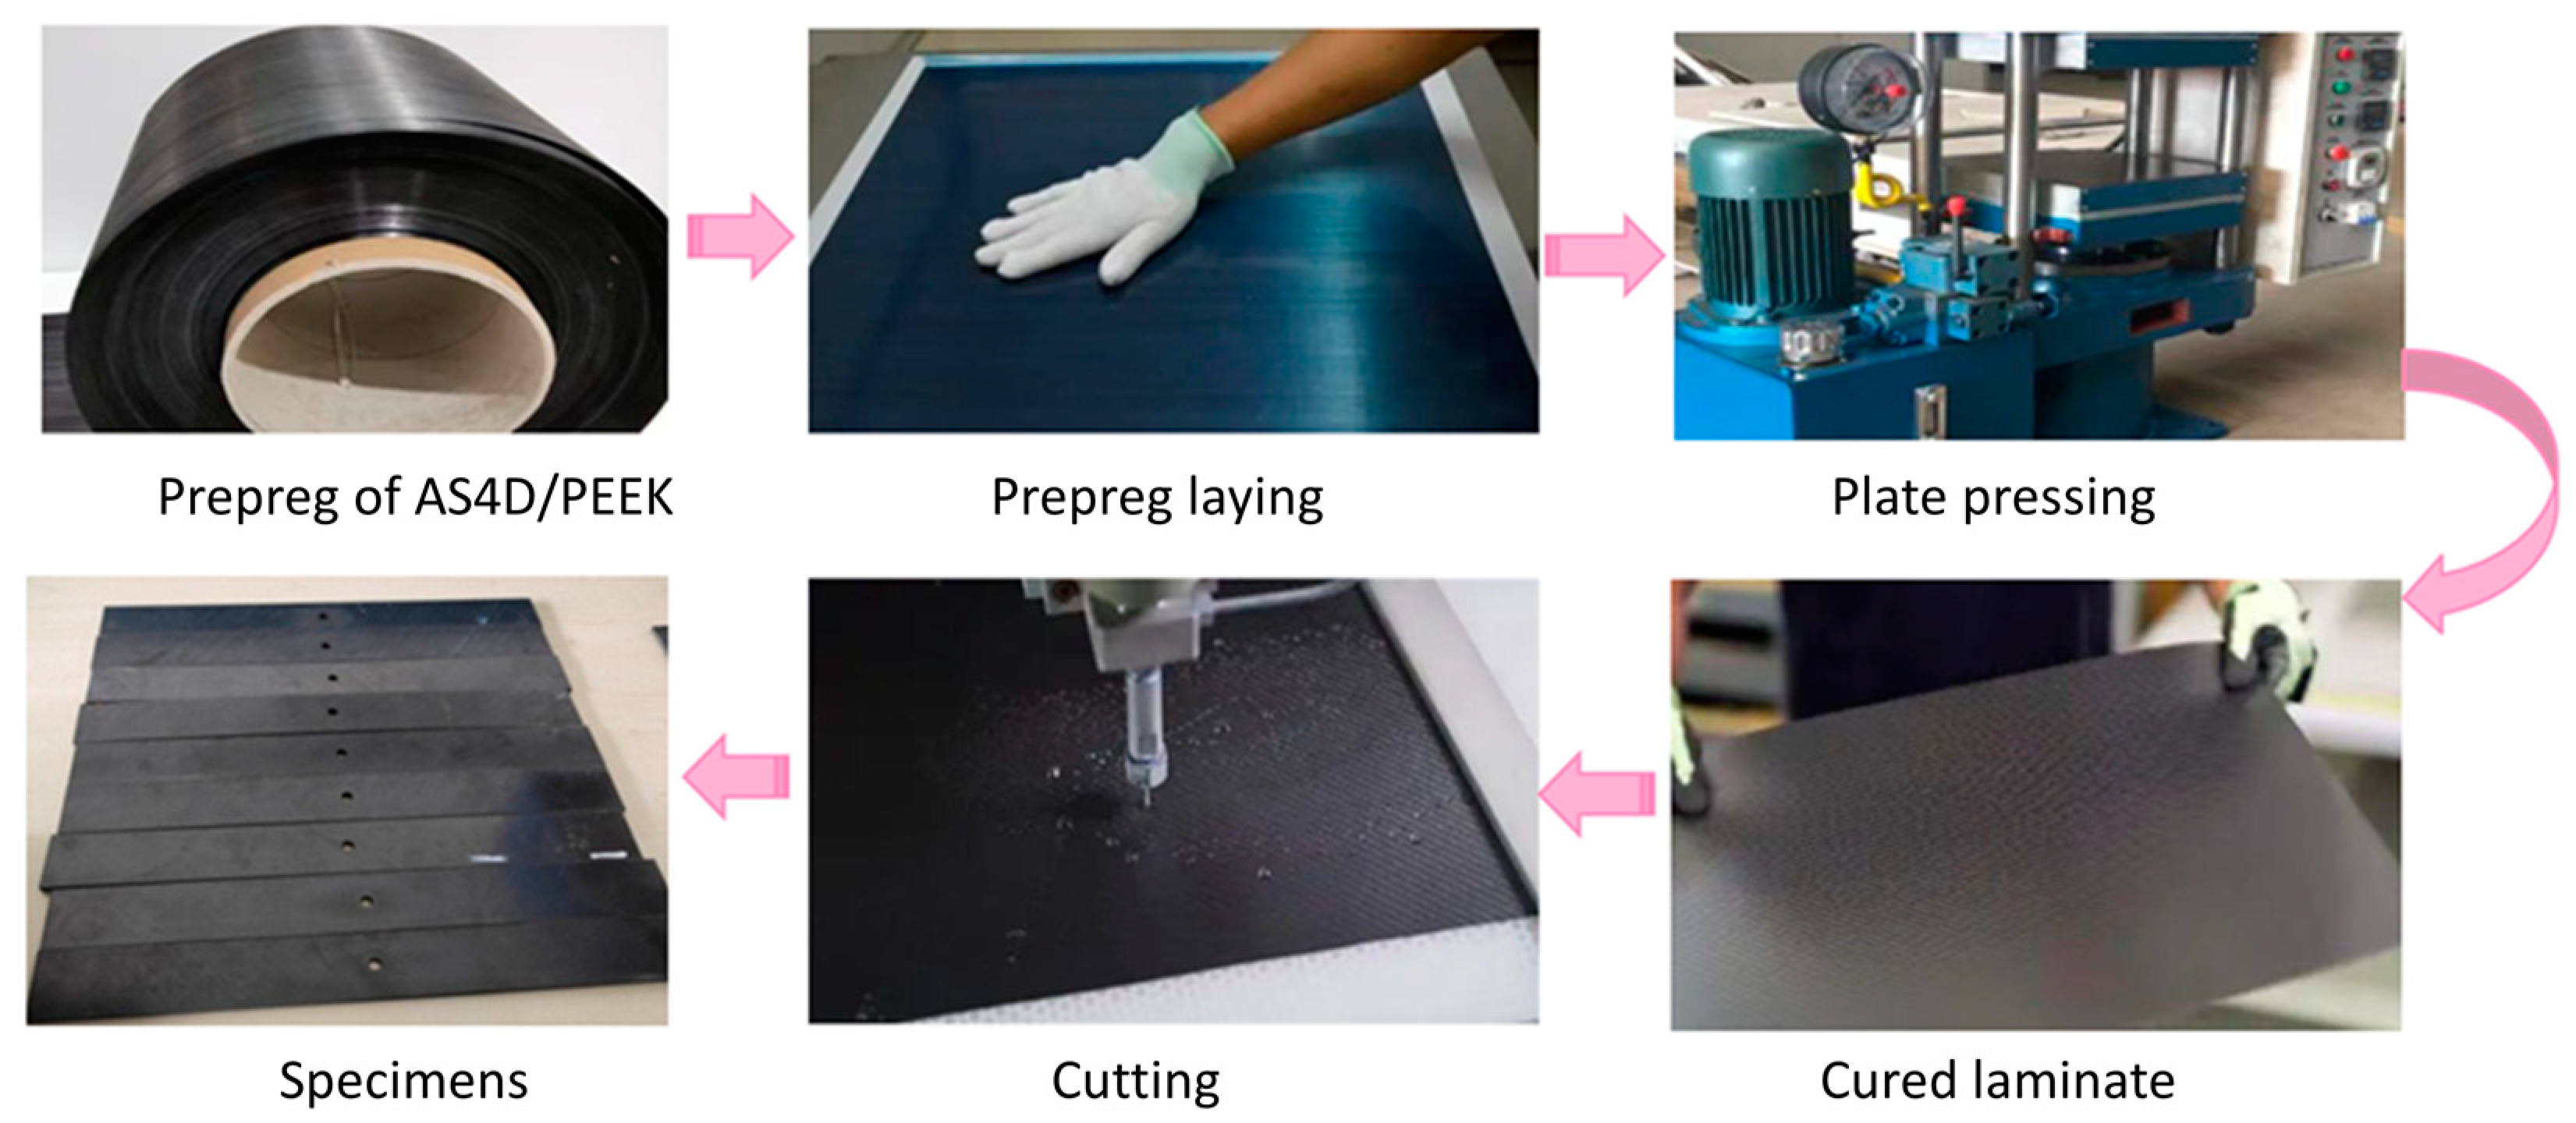
2.1. Material and Samples
2.2. Experimental
2.3. Simulation
2.3.1. Damage Constitutive
2.3.2. Damage Initiation Criteria
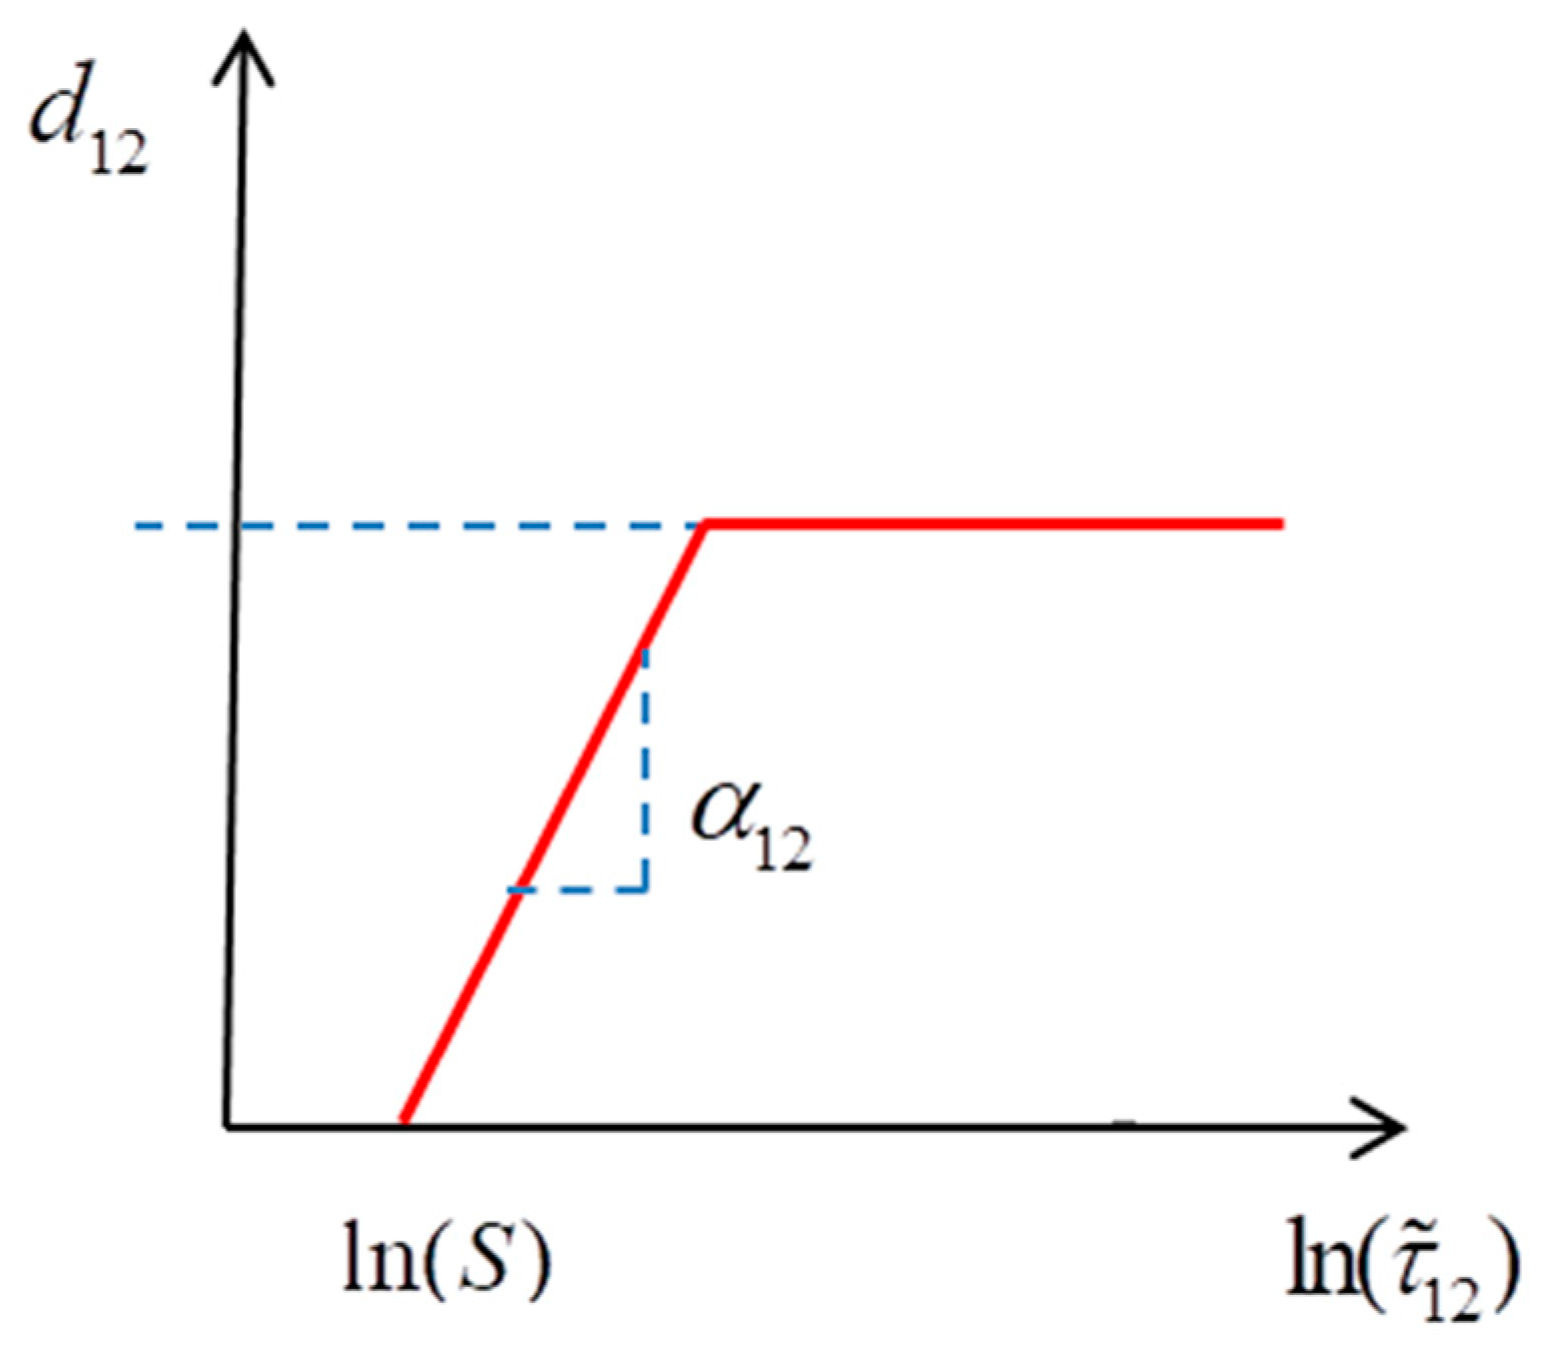
2.3.3. Damage Propagation
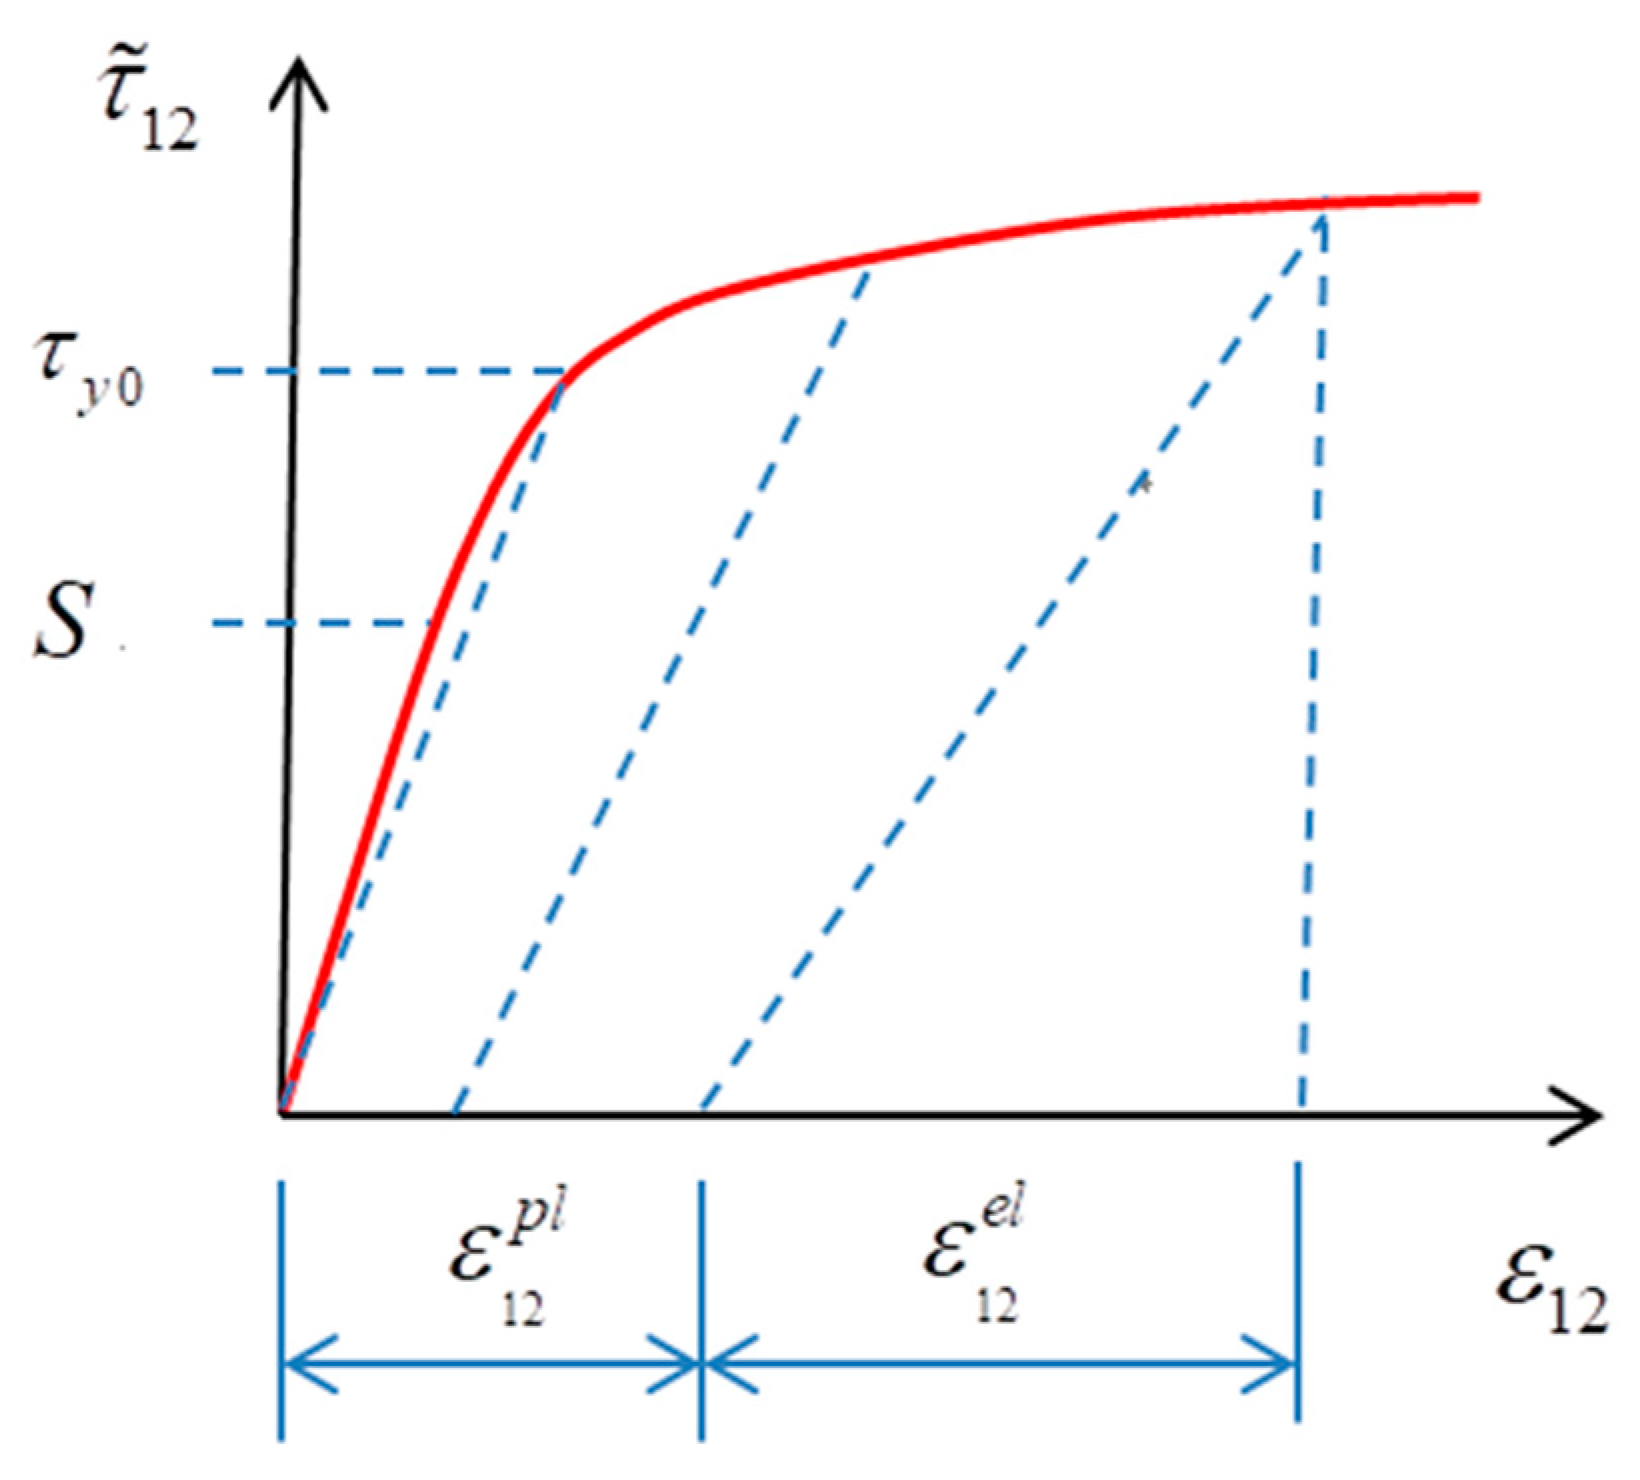
2.3.4. Elastic–Plastic Shear Failure Criterion
2.3.5. Delamination Failure Criteria
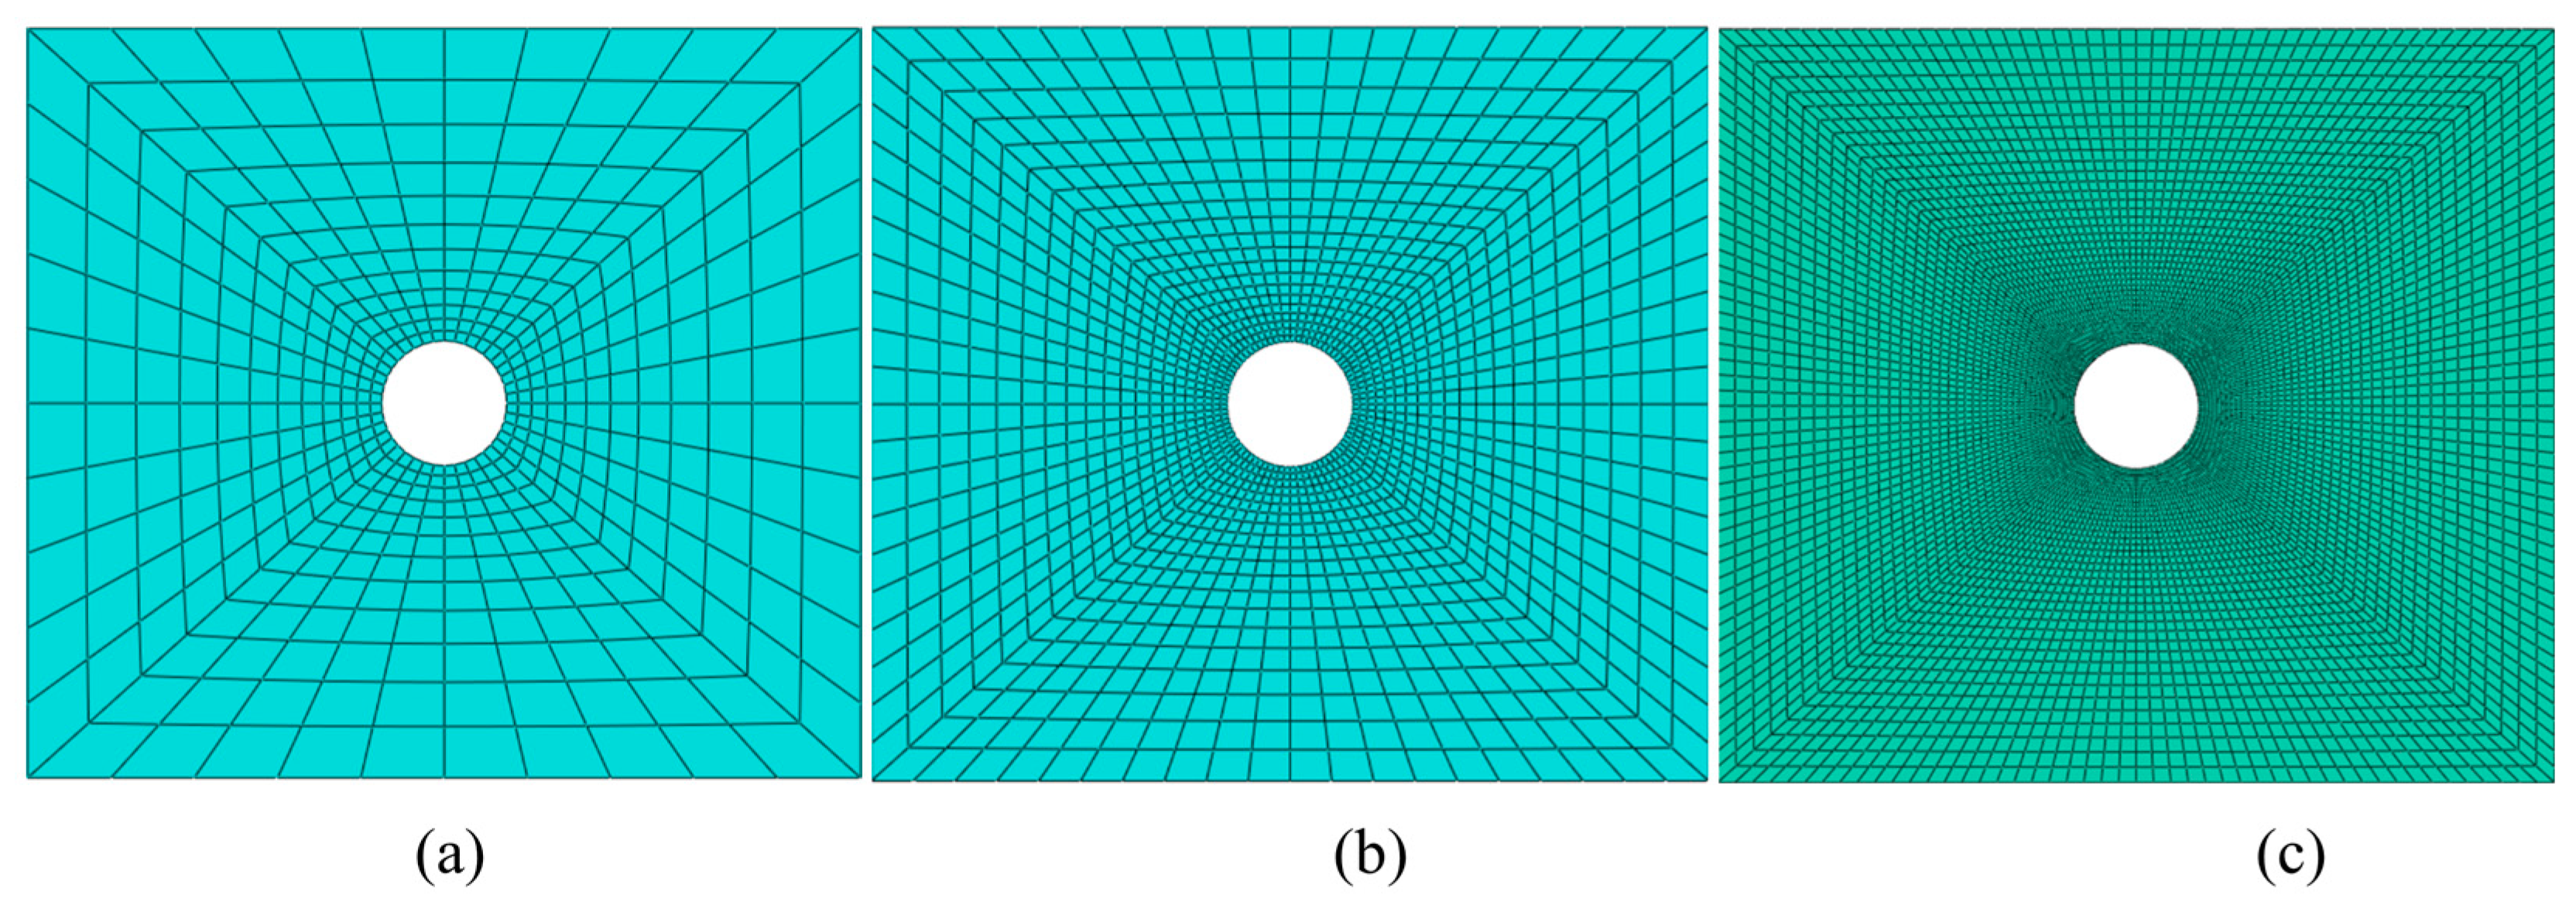
2.3.6. Reliability Verification
3. Results and Discussion
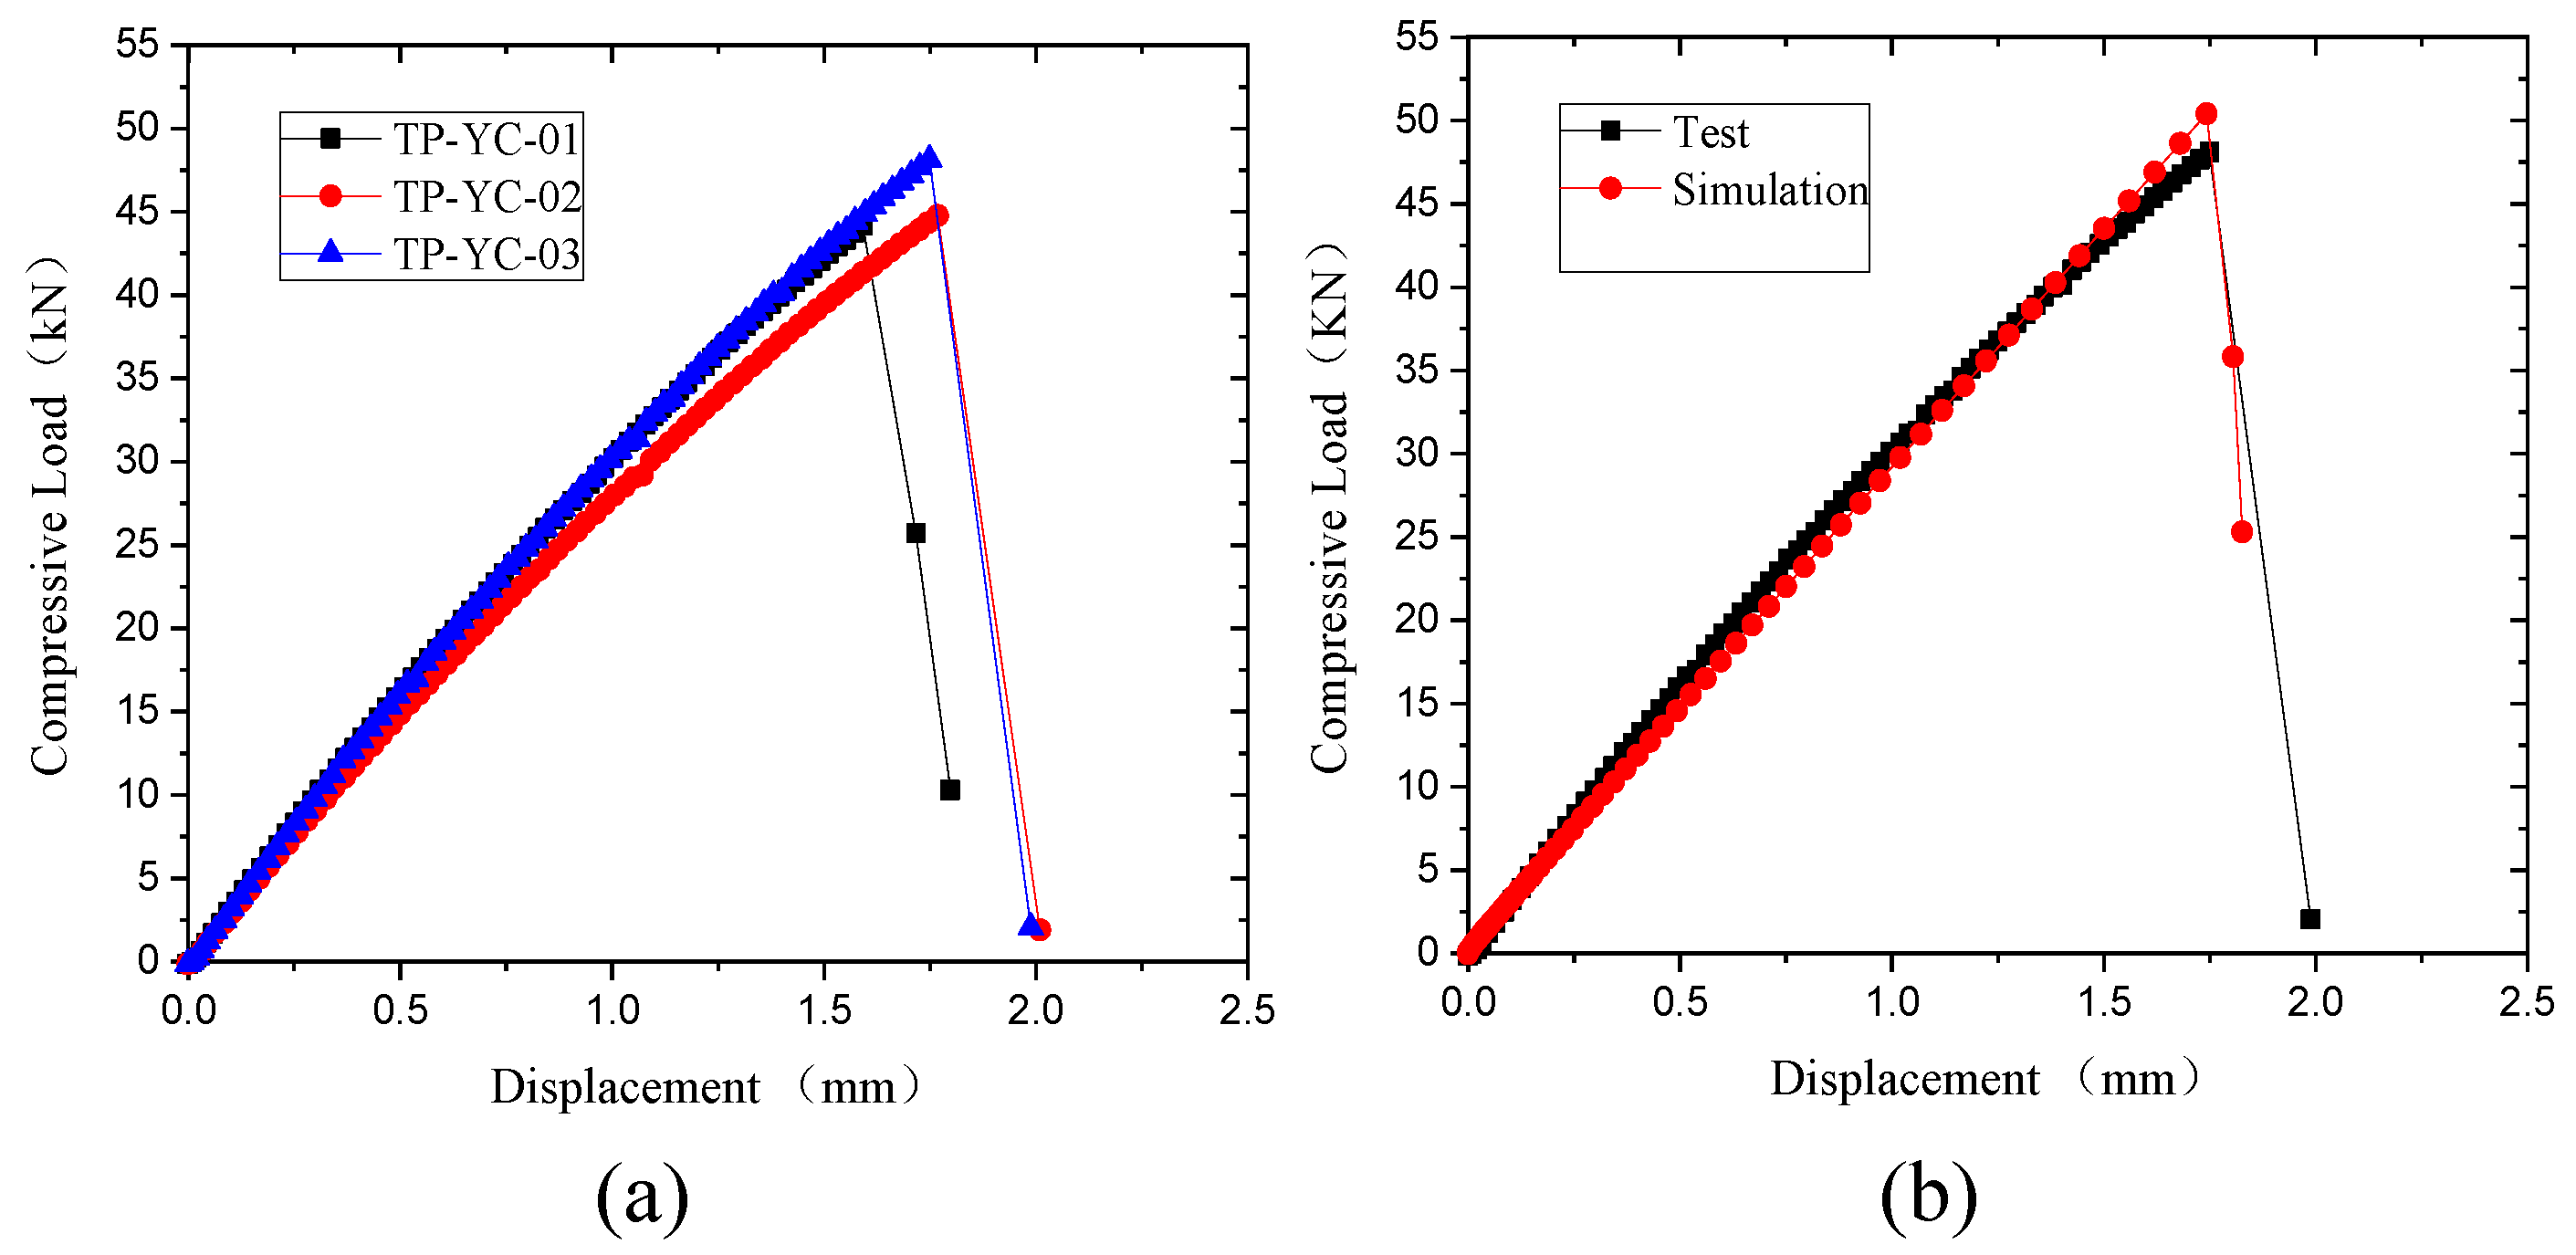
3.1. Compressive Behavior
3.1.1. Experimental Results Comparison
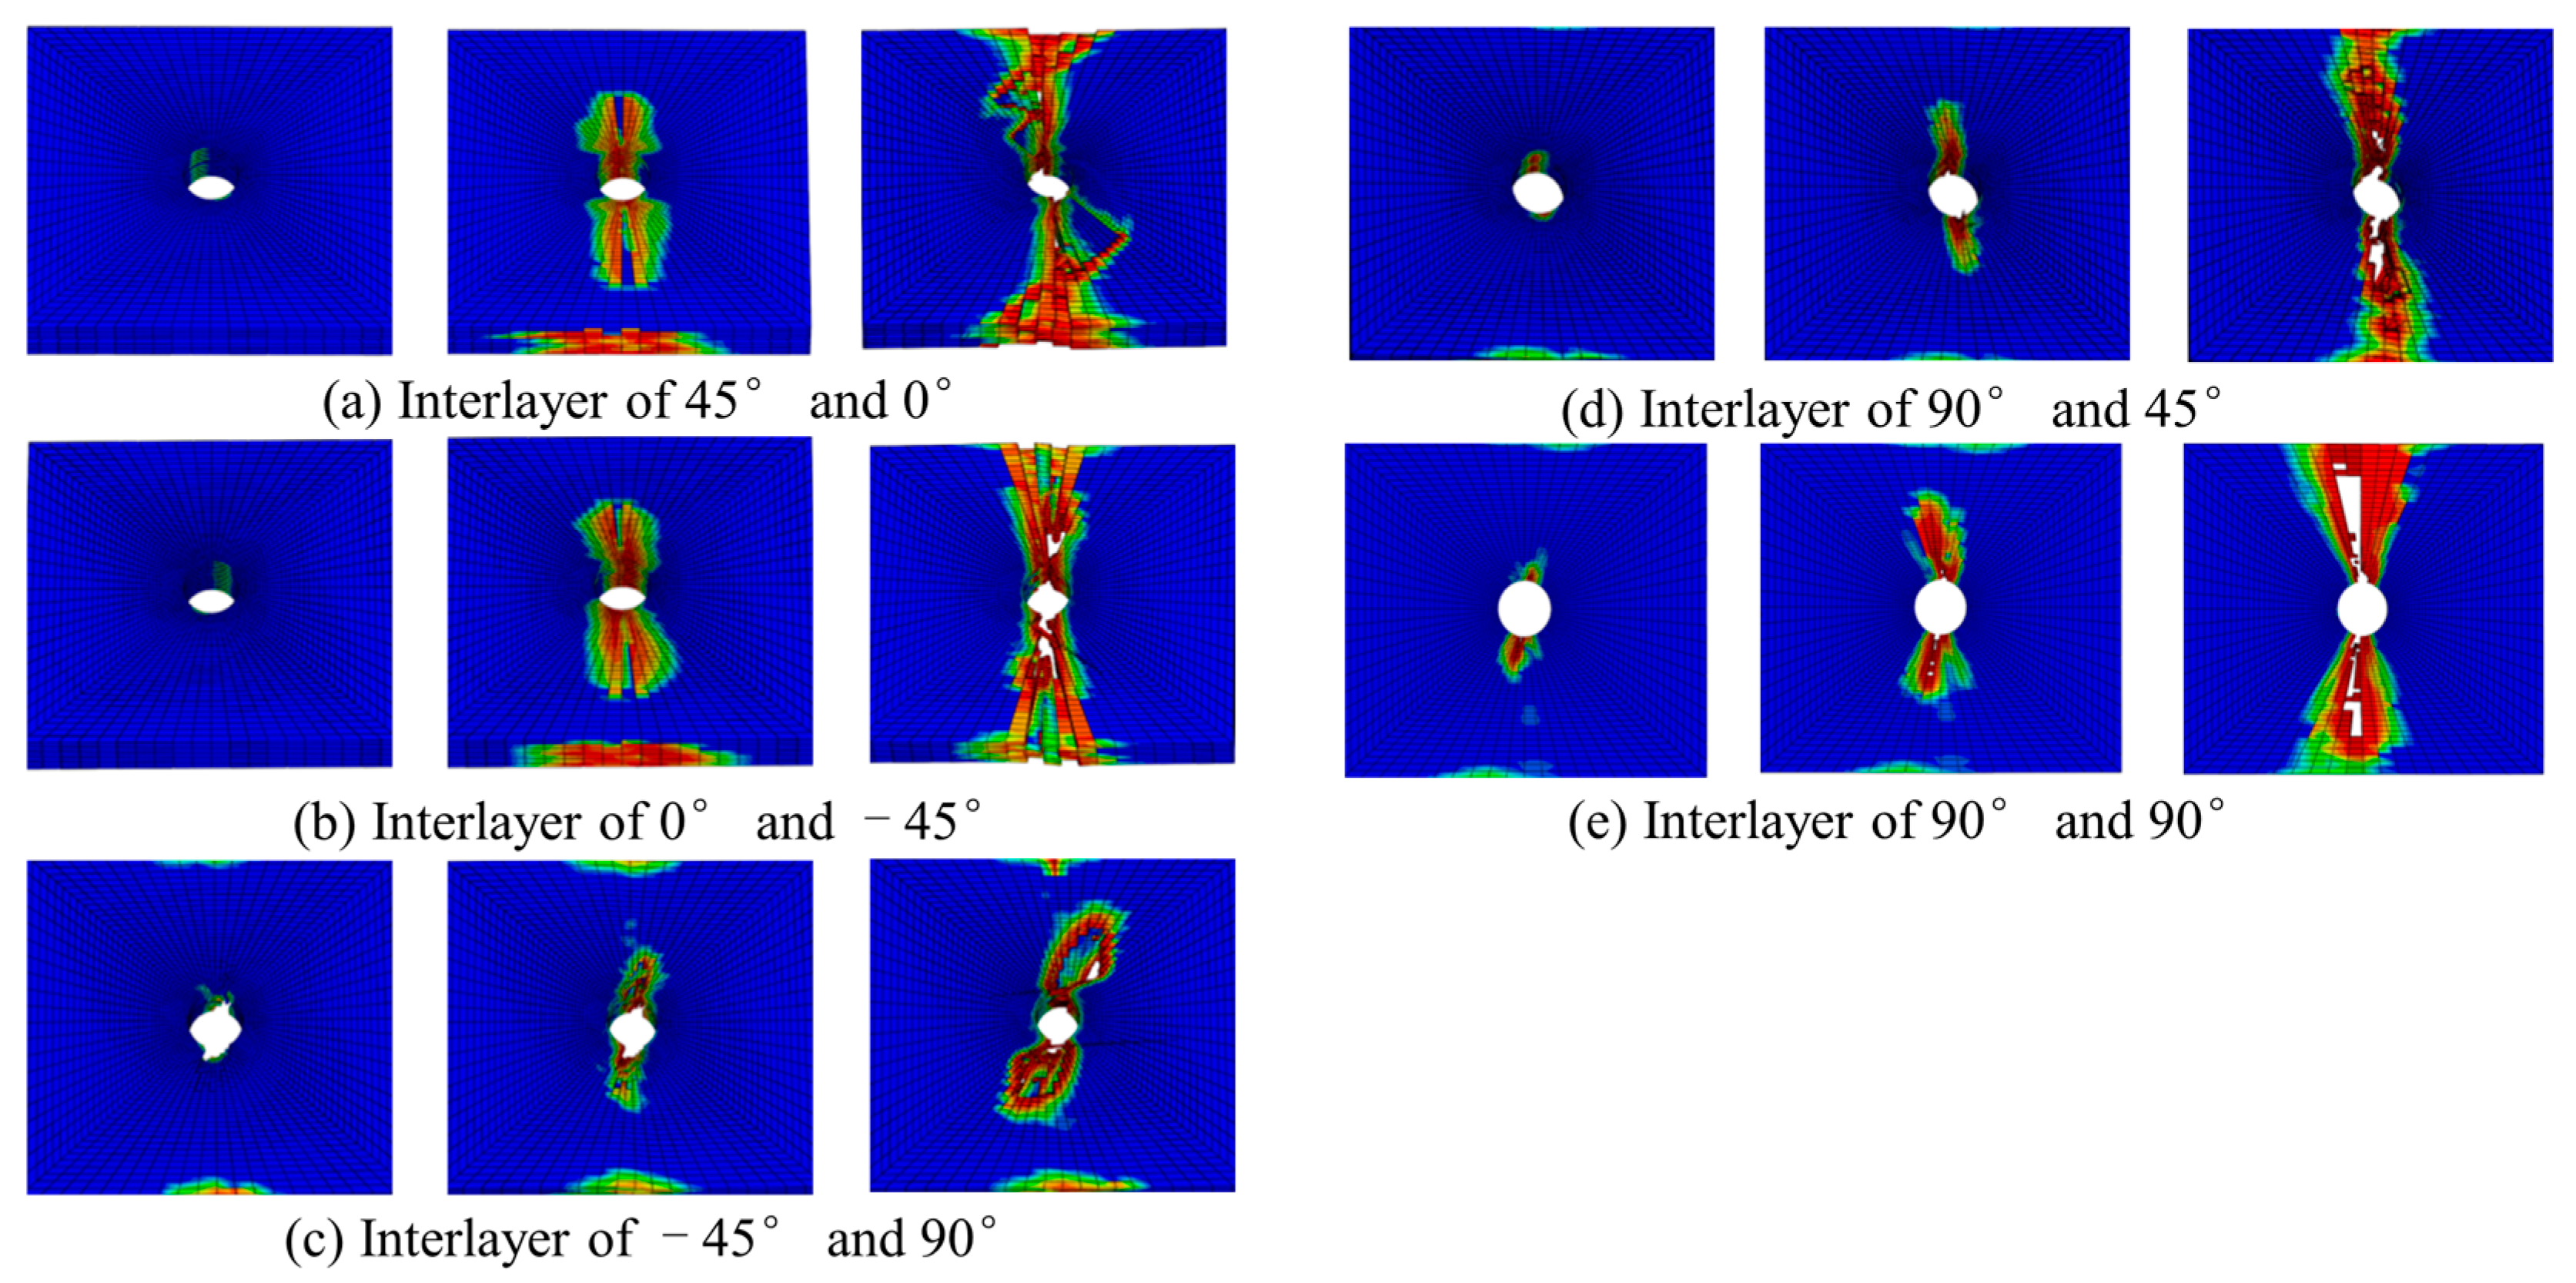
3.1.2. Failure Modes and Mechanisms
3.2. Tensile Performance
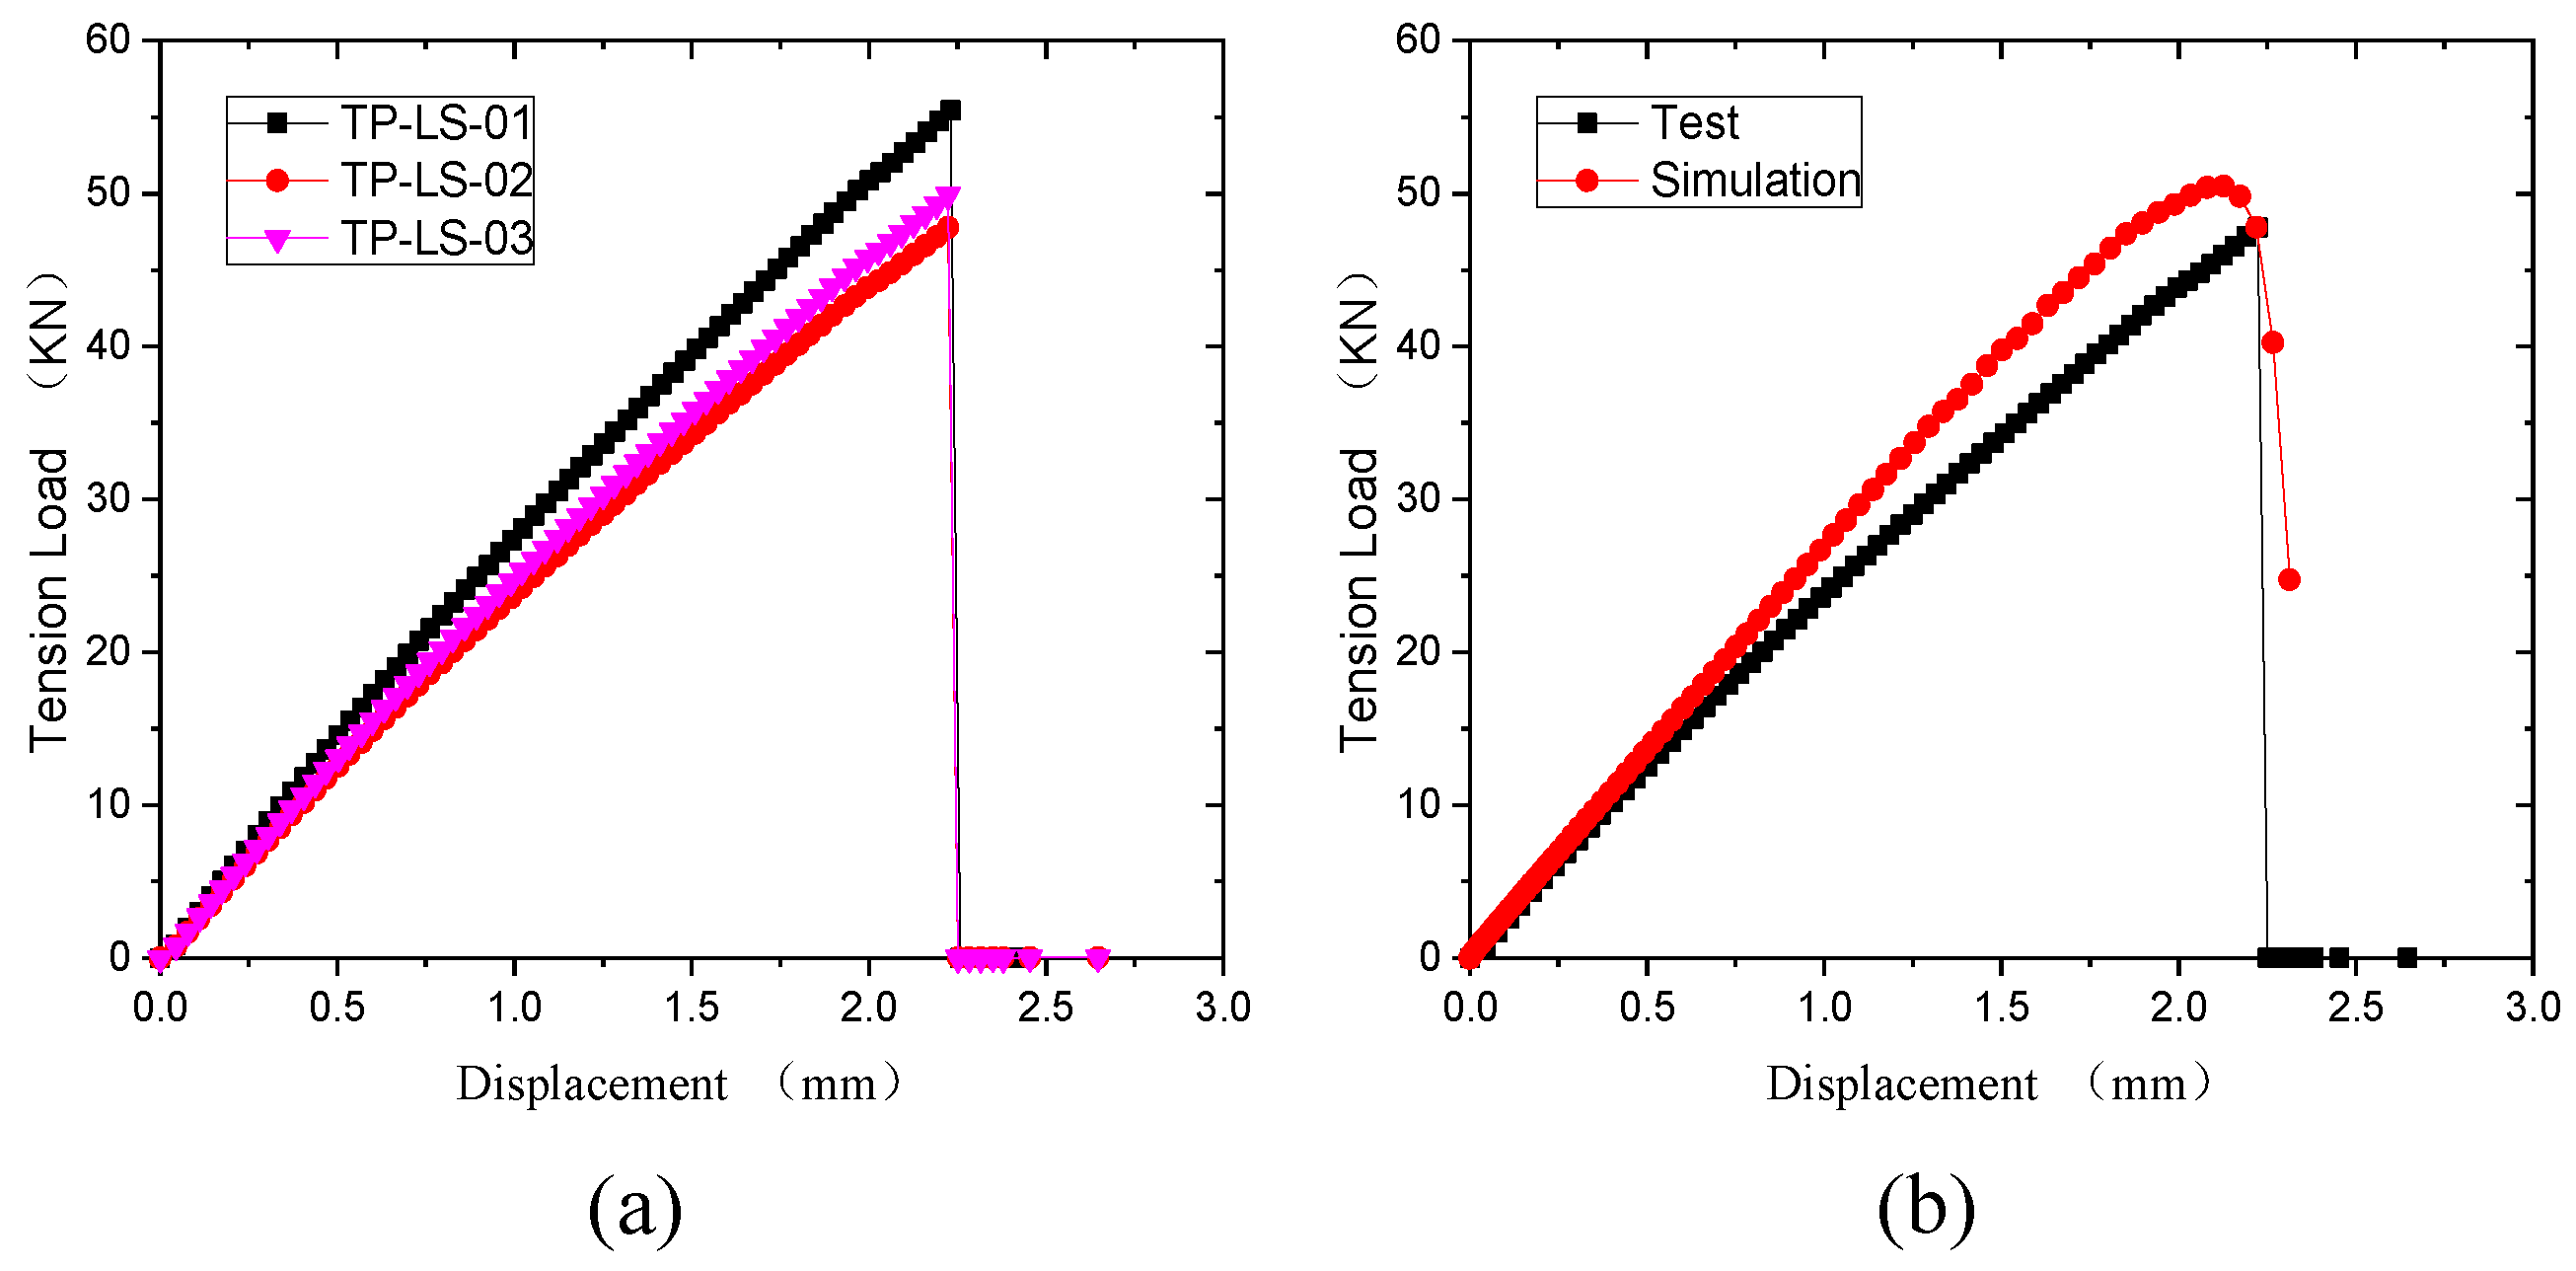
3.2.1. Experimental Results Comparison
3.2.2. Failure Modes and Mechanisms
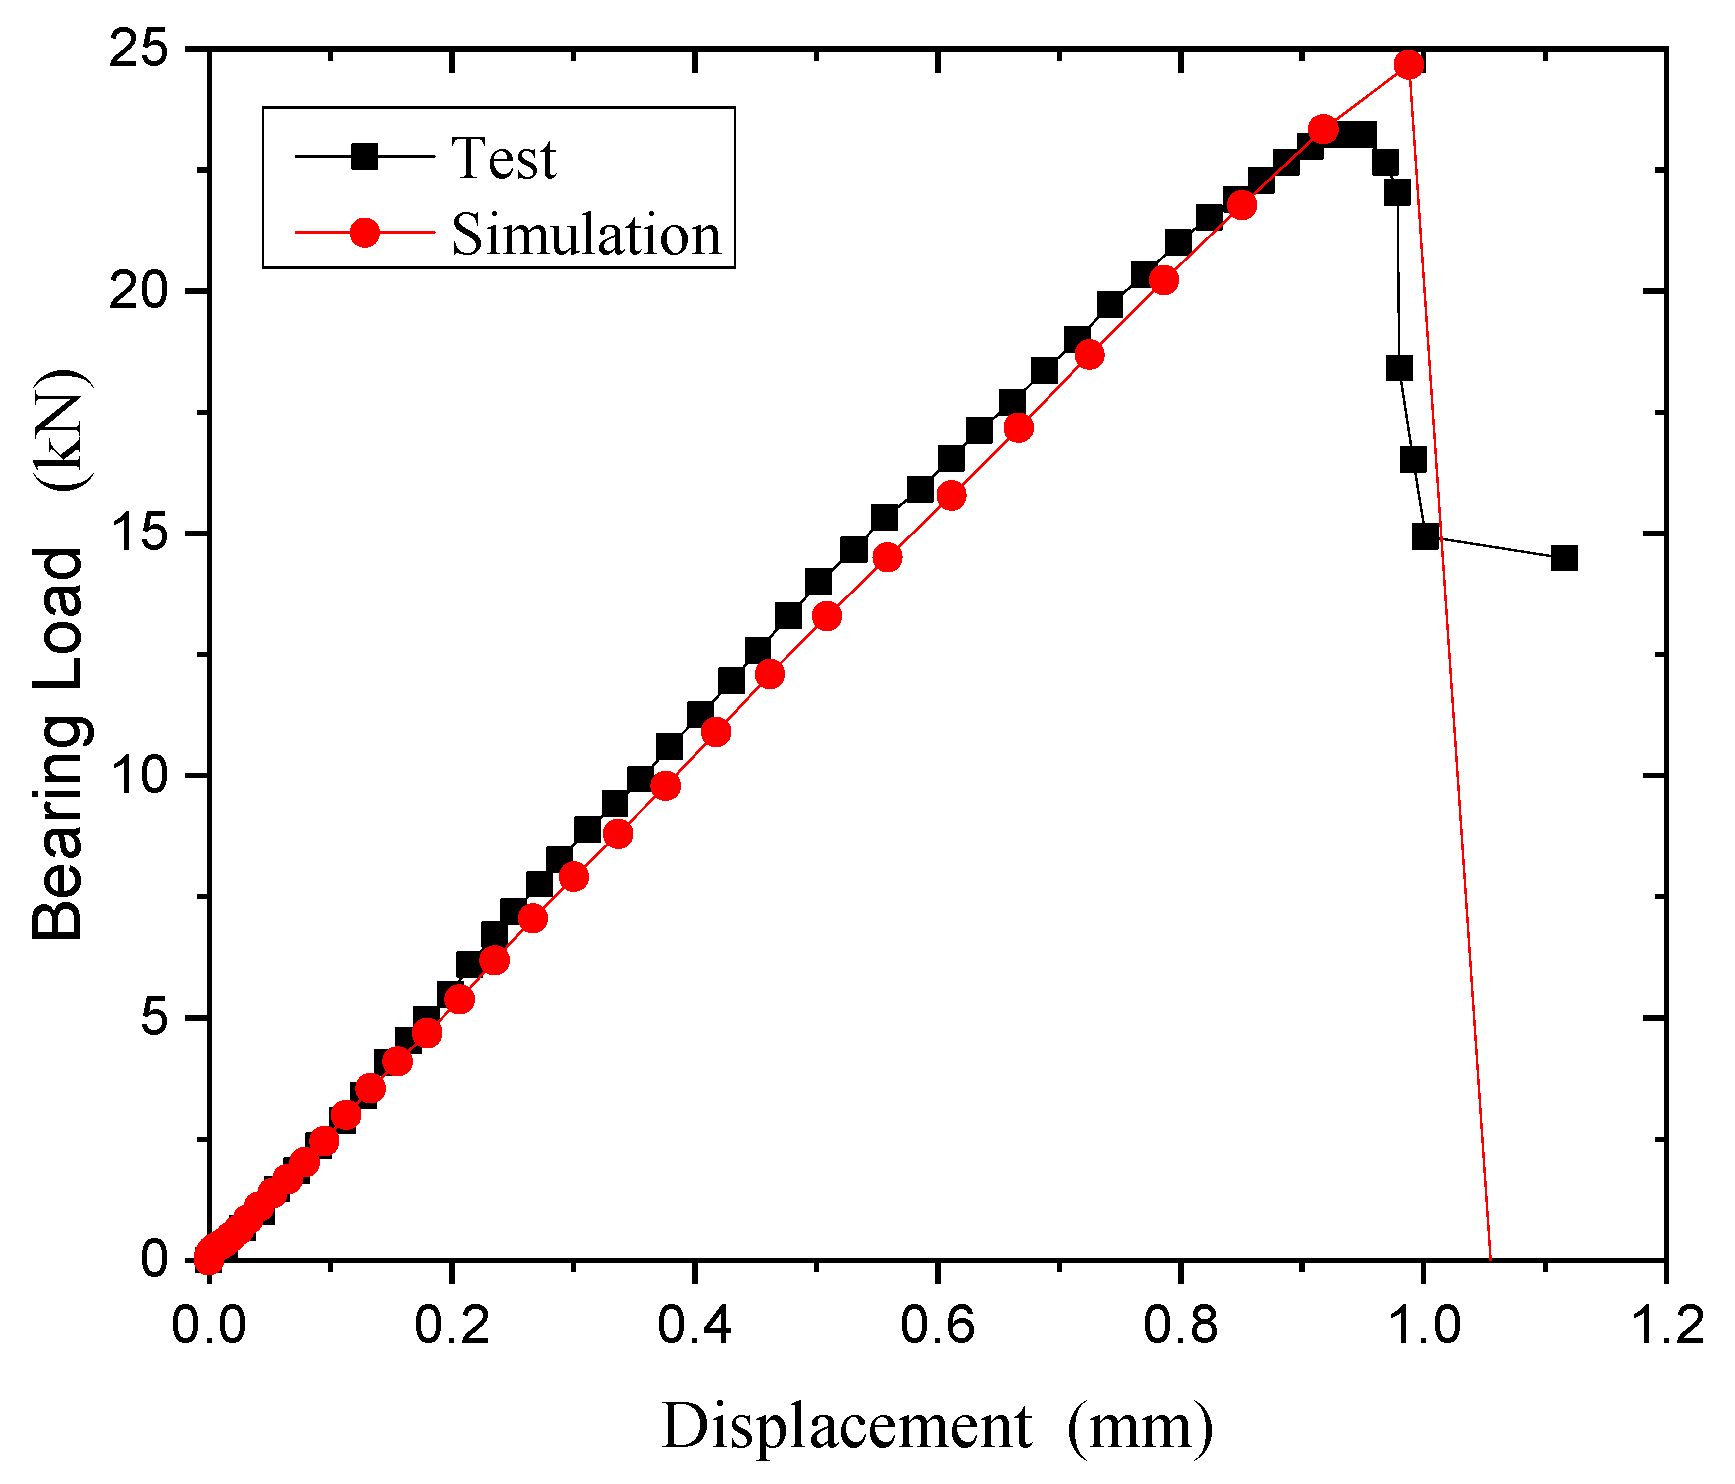
3.3. Bearing Property
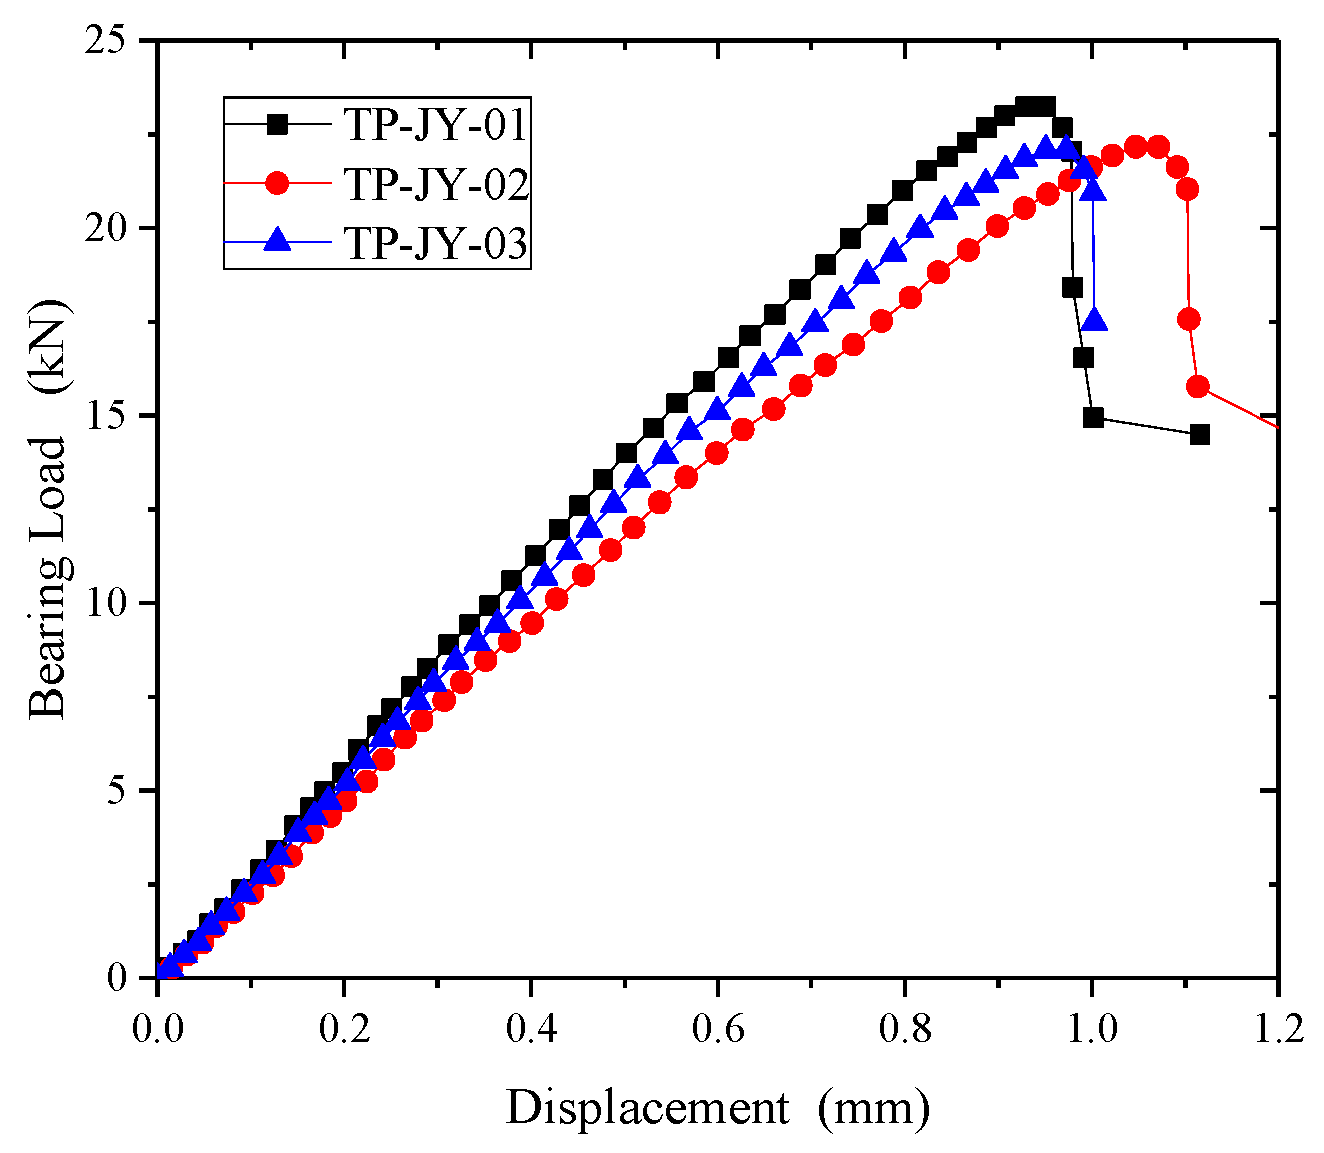
3.3.1. Deformation Processes
3.3.2. Failure Modes and Mechanisms
4. Conclusions
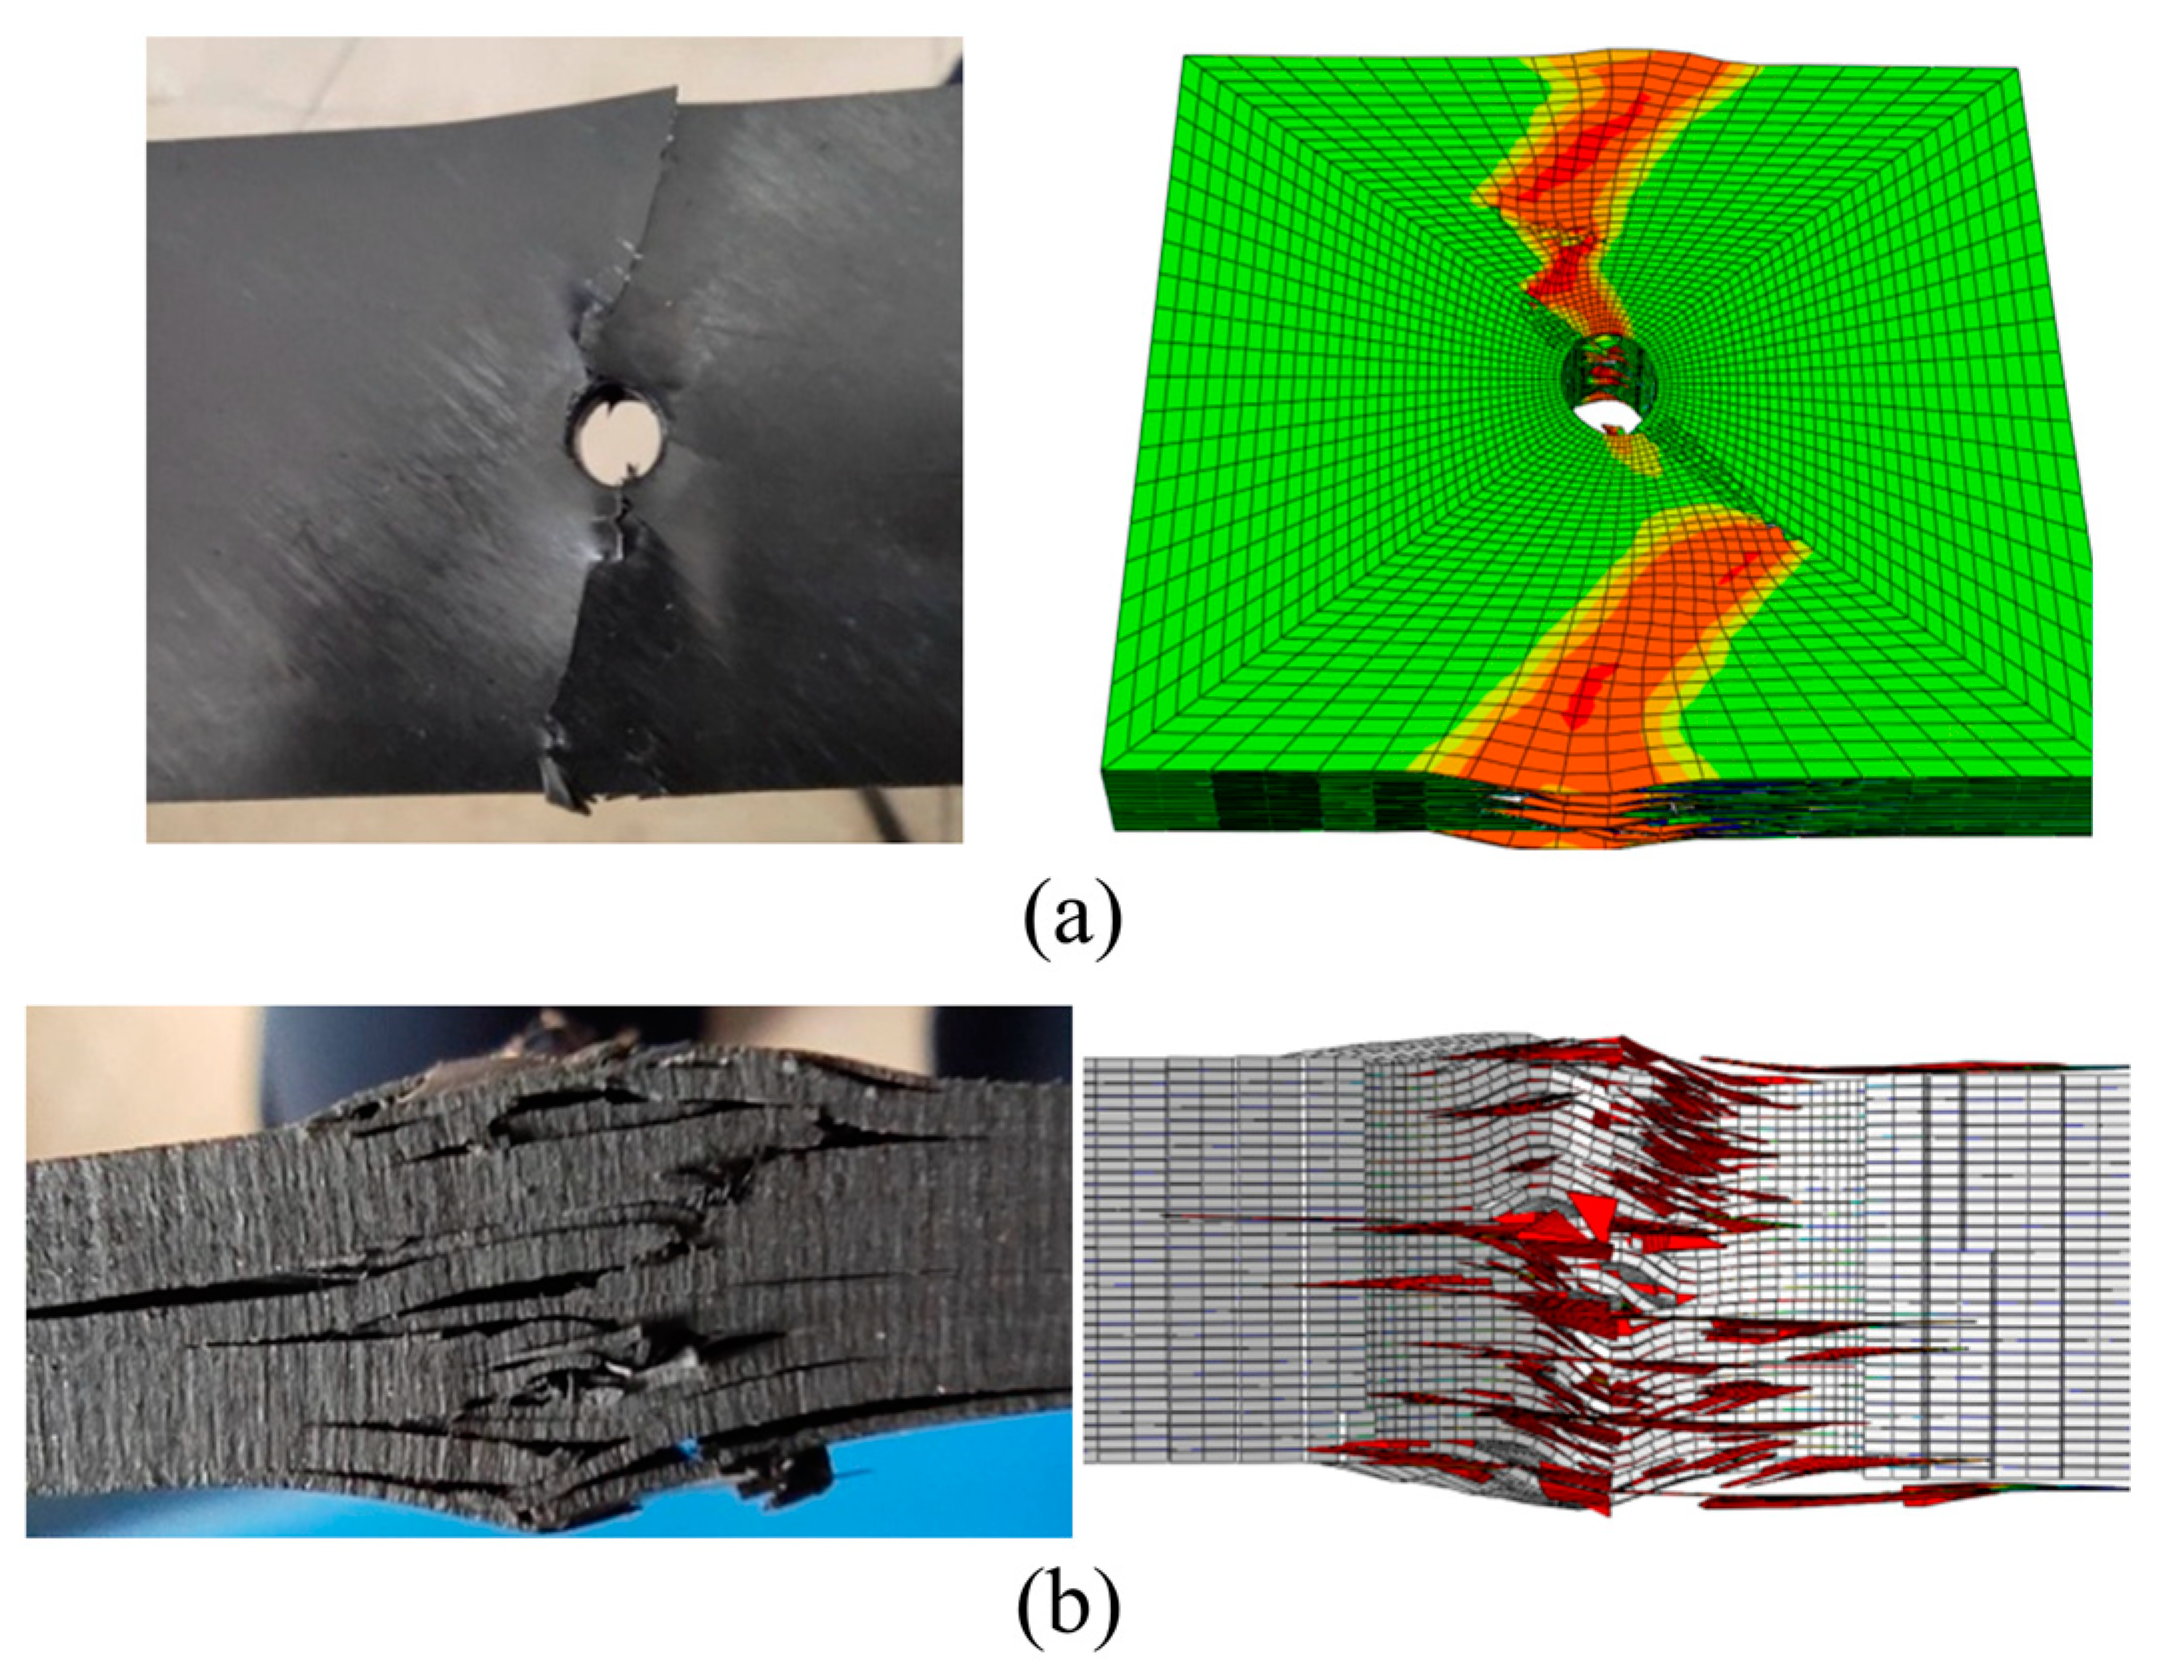
- (a)
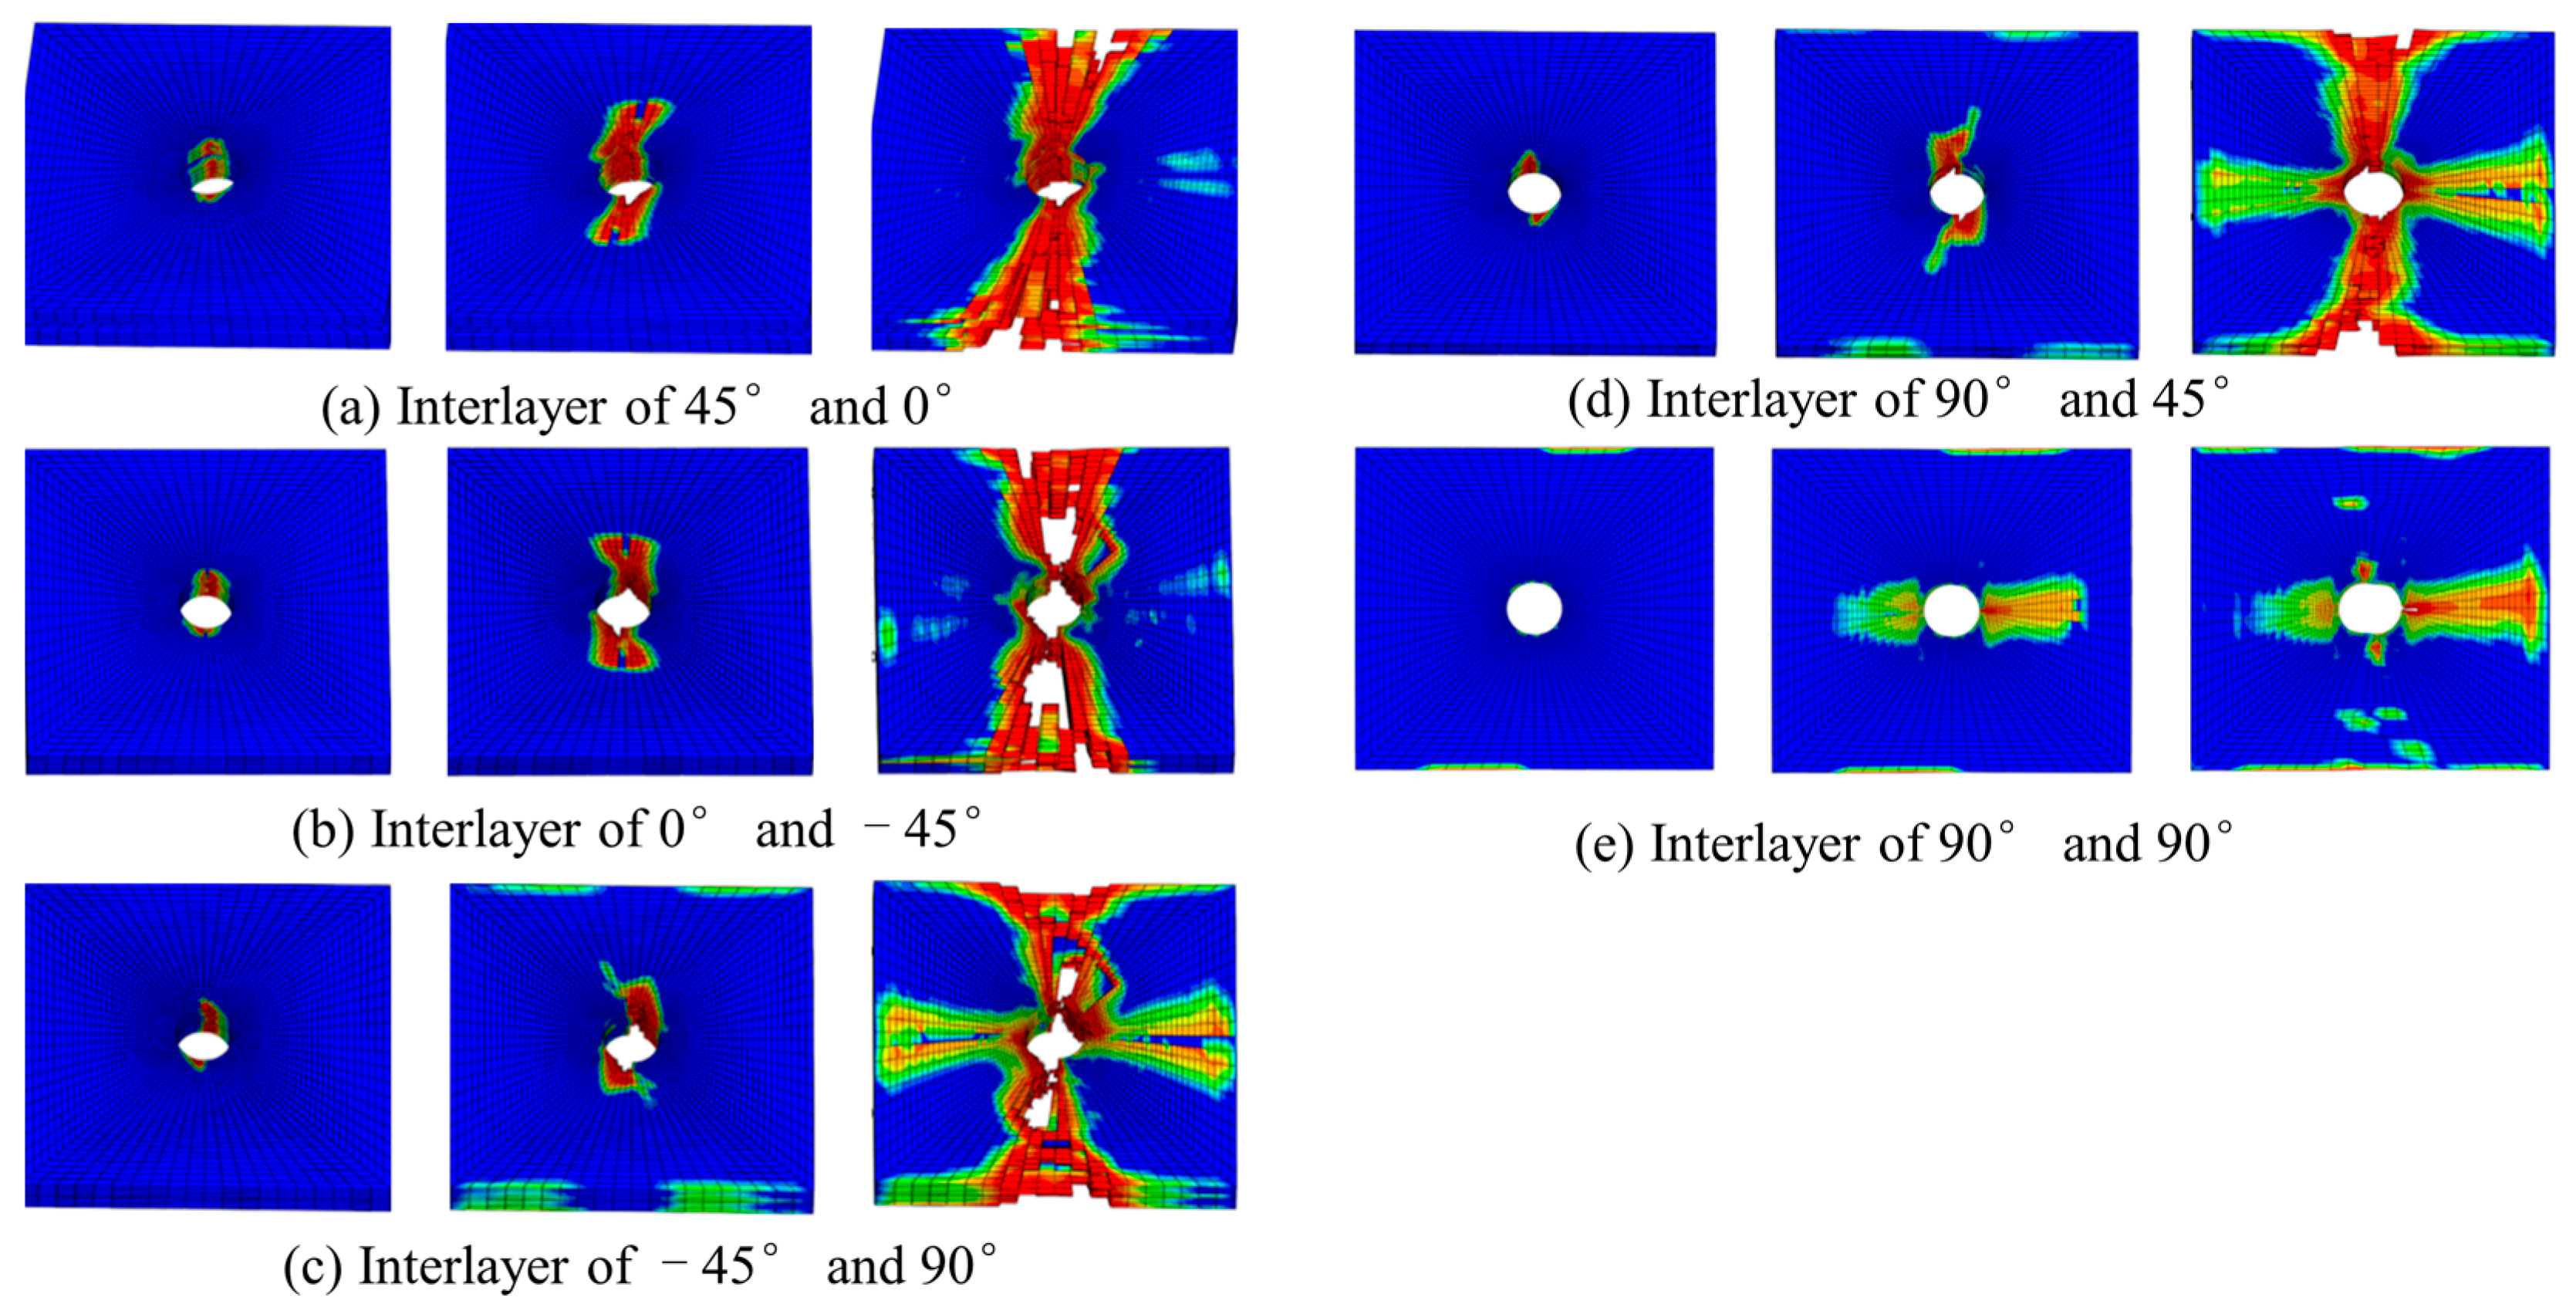
- From a macro perspective, both thermoplastic composite material TP and thermosetting composite material TS exhibit fiber extrusion and interlayer delamination, and the broken fibers interpenetrate into the opposite layered gap, thereby promoting the continuous expansion of delamination along and perpendicular to the load direction. Compared to thermosetting composite materials, the delamination area is relatively concentrated, while TP delamination in thermoplastic composite materials is more evenly distributed along the thickness direction;
- (b)
- From a macro perspective, both thermoplastic composite material specimens and thermosetting composite material specimens exhibit damage phenomena such as fiber bundle separation, fracture, pull-out, and interlayer delamination during the application of tensile load. The delamination area of thermosetting composite material is relatively concentrated, while the distribution of thermoplastic composite material delamination along the thickness direction is relatively uniform;
- (c)
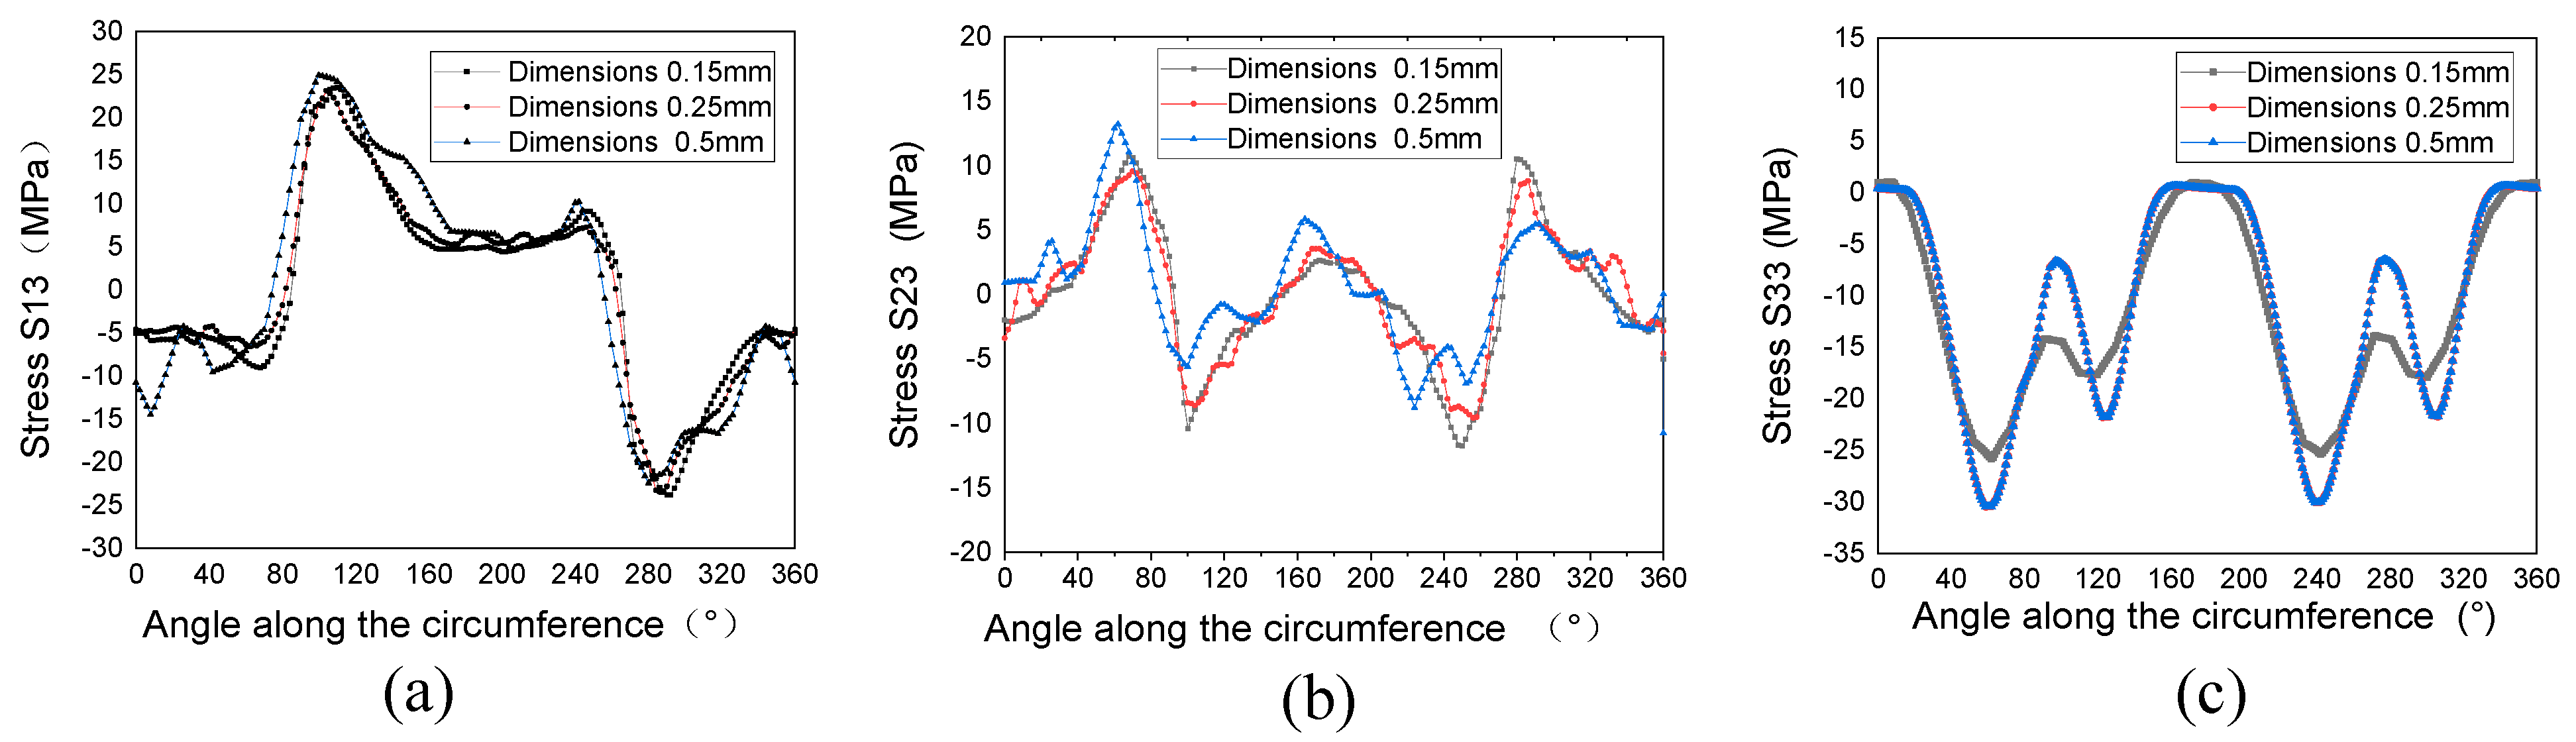
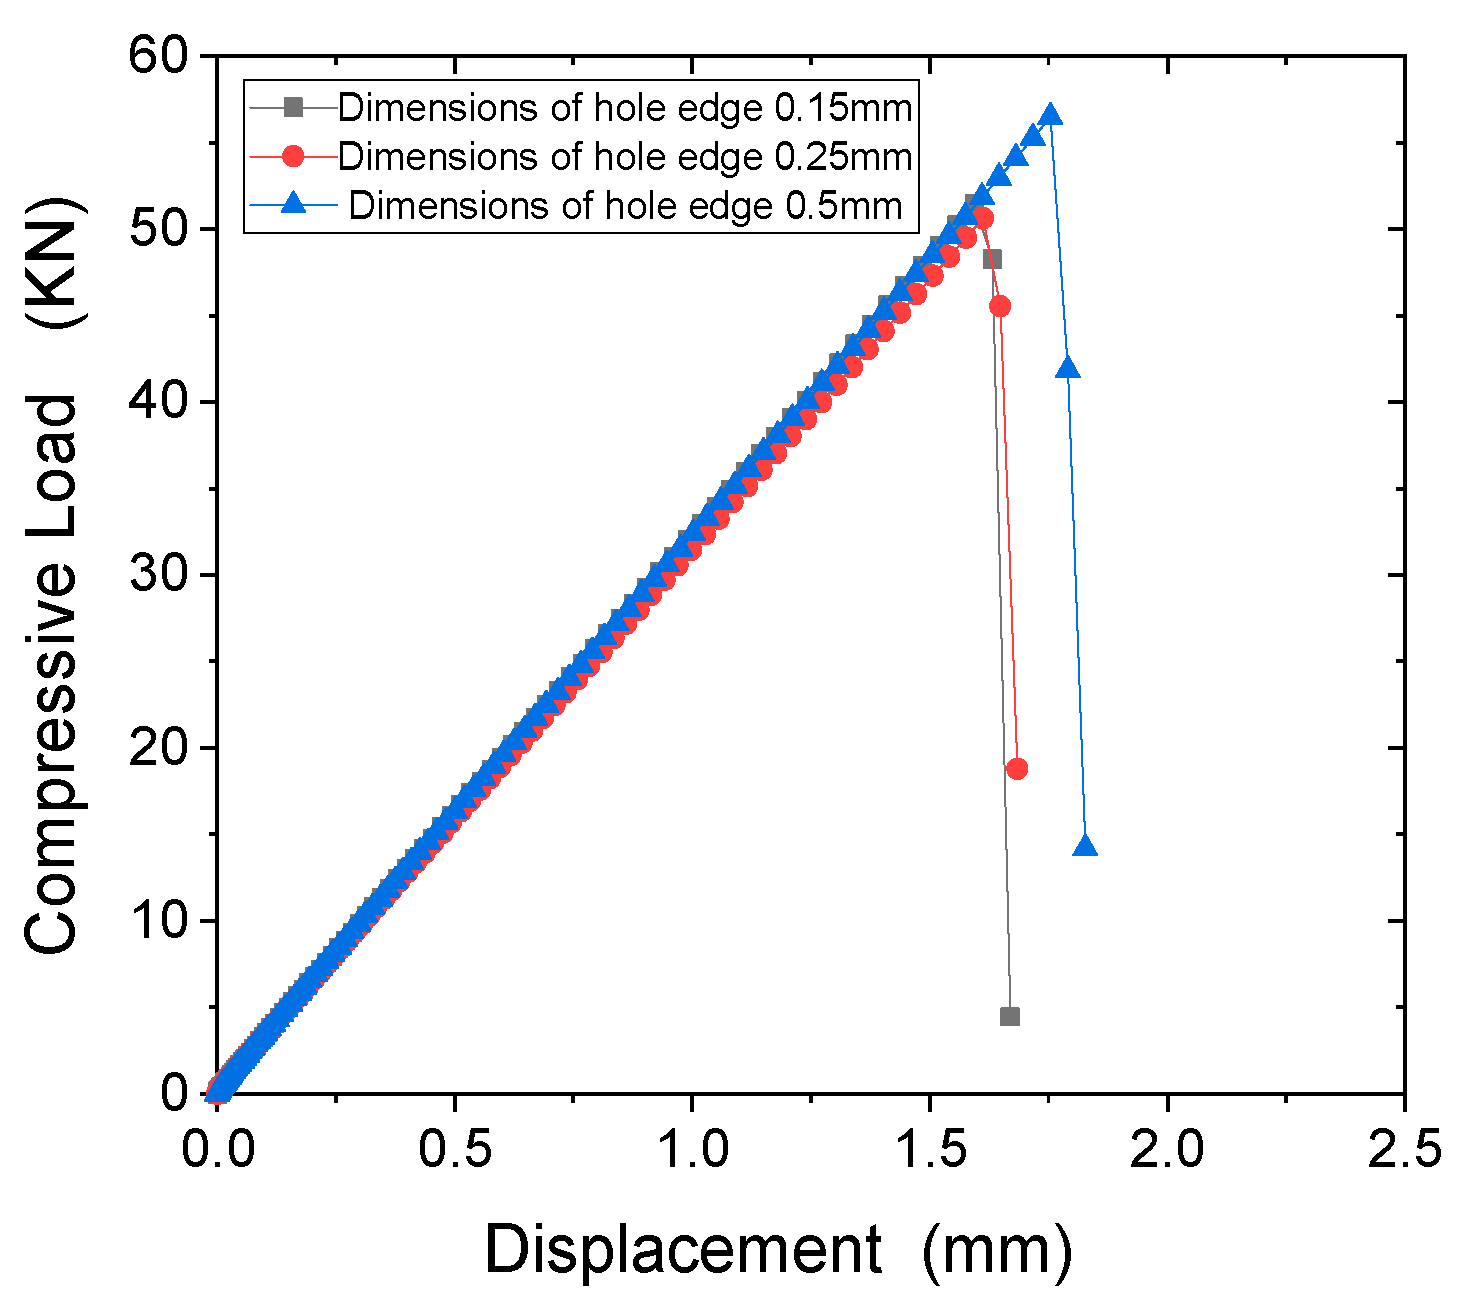
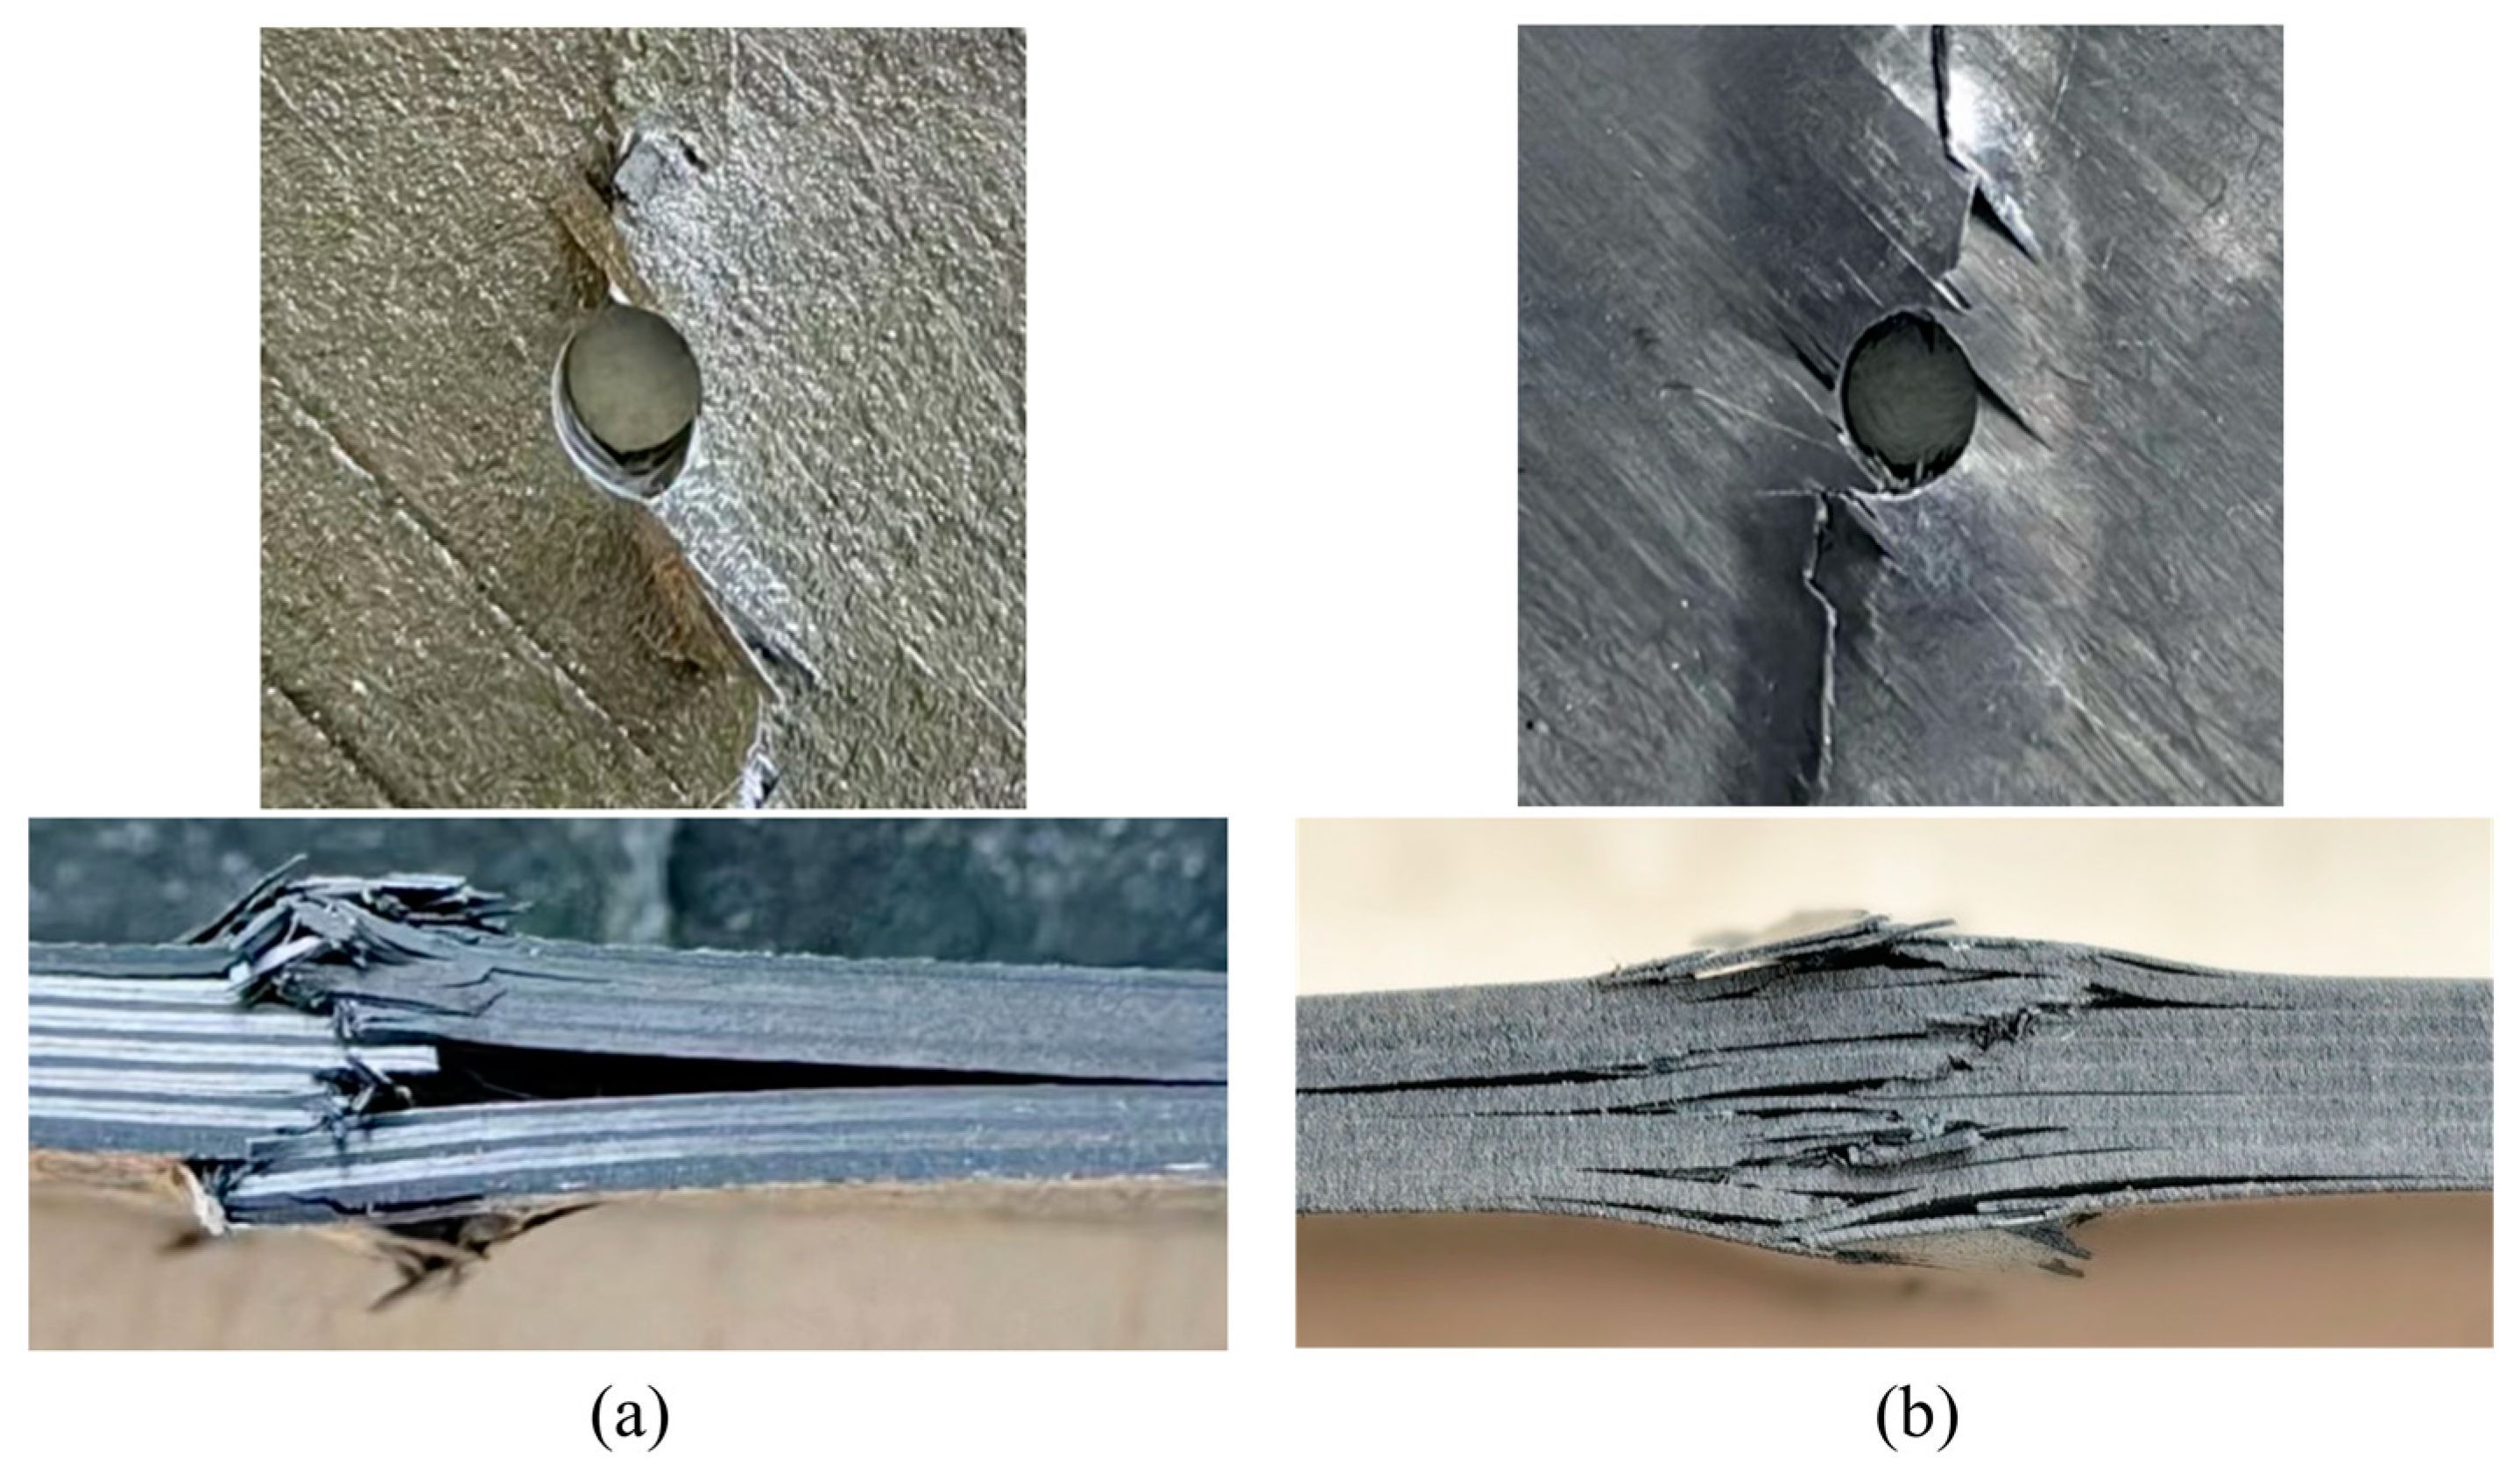
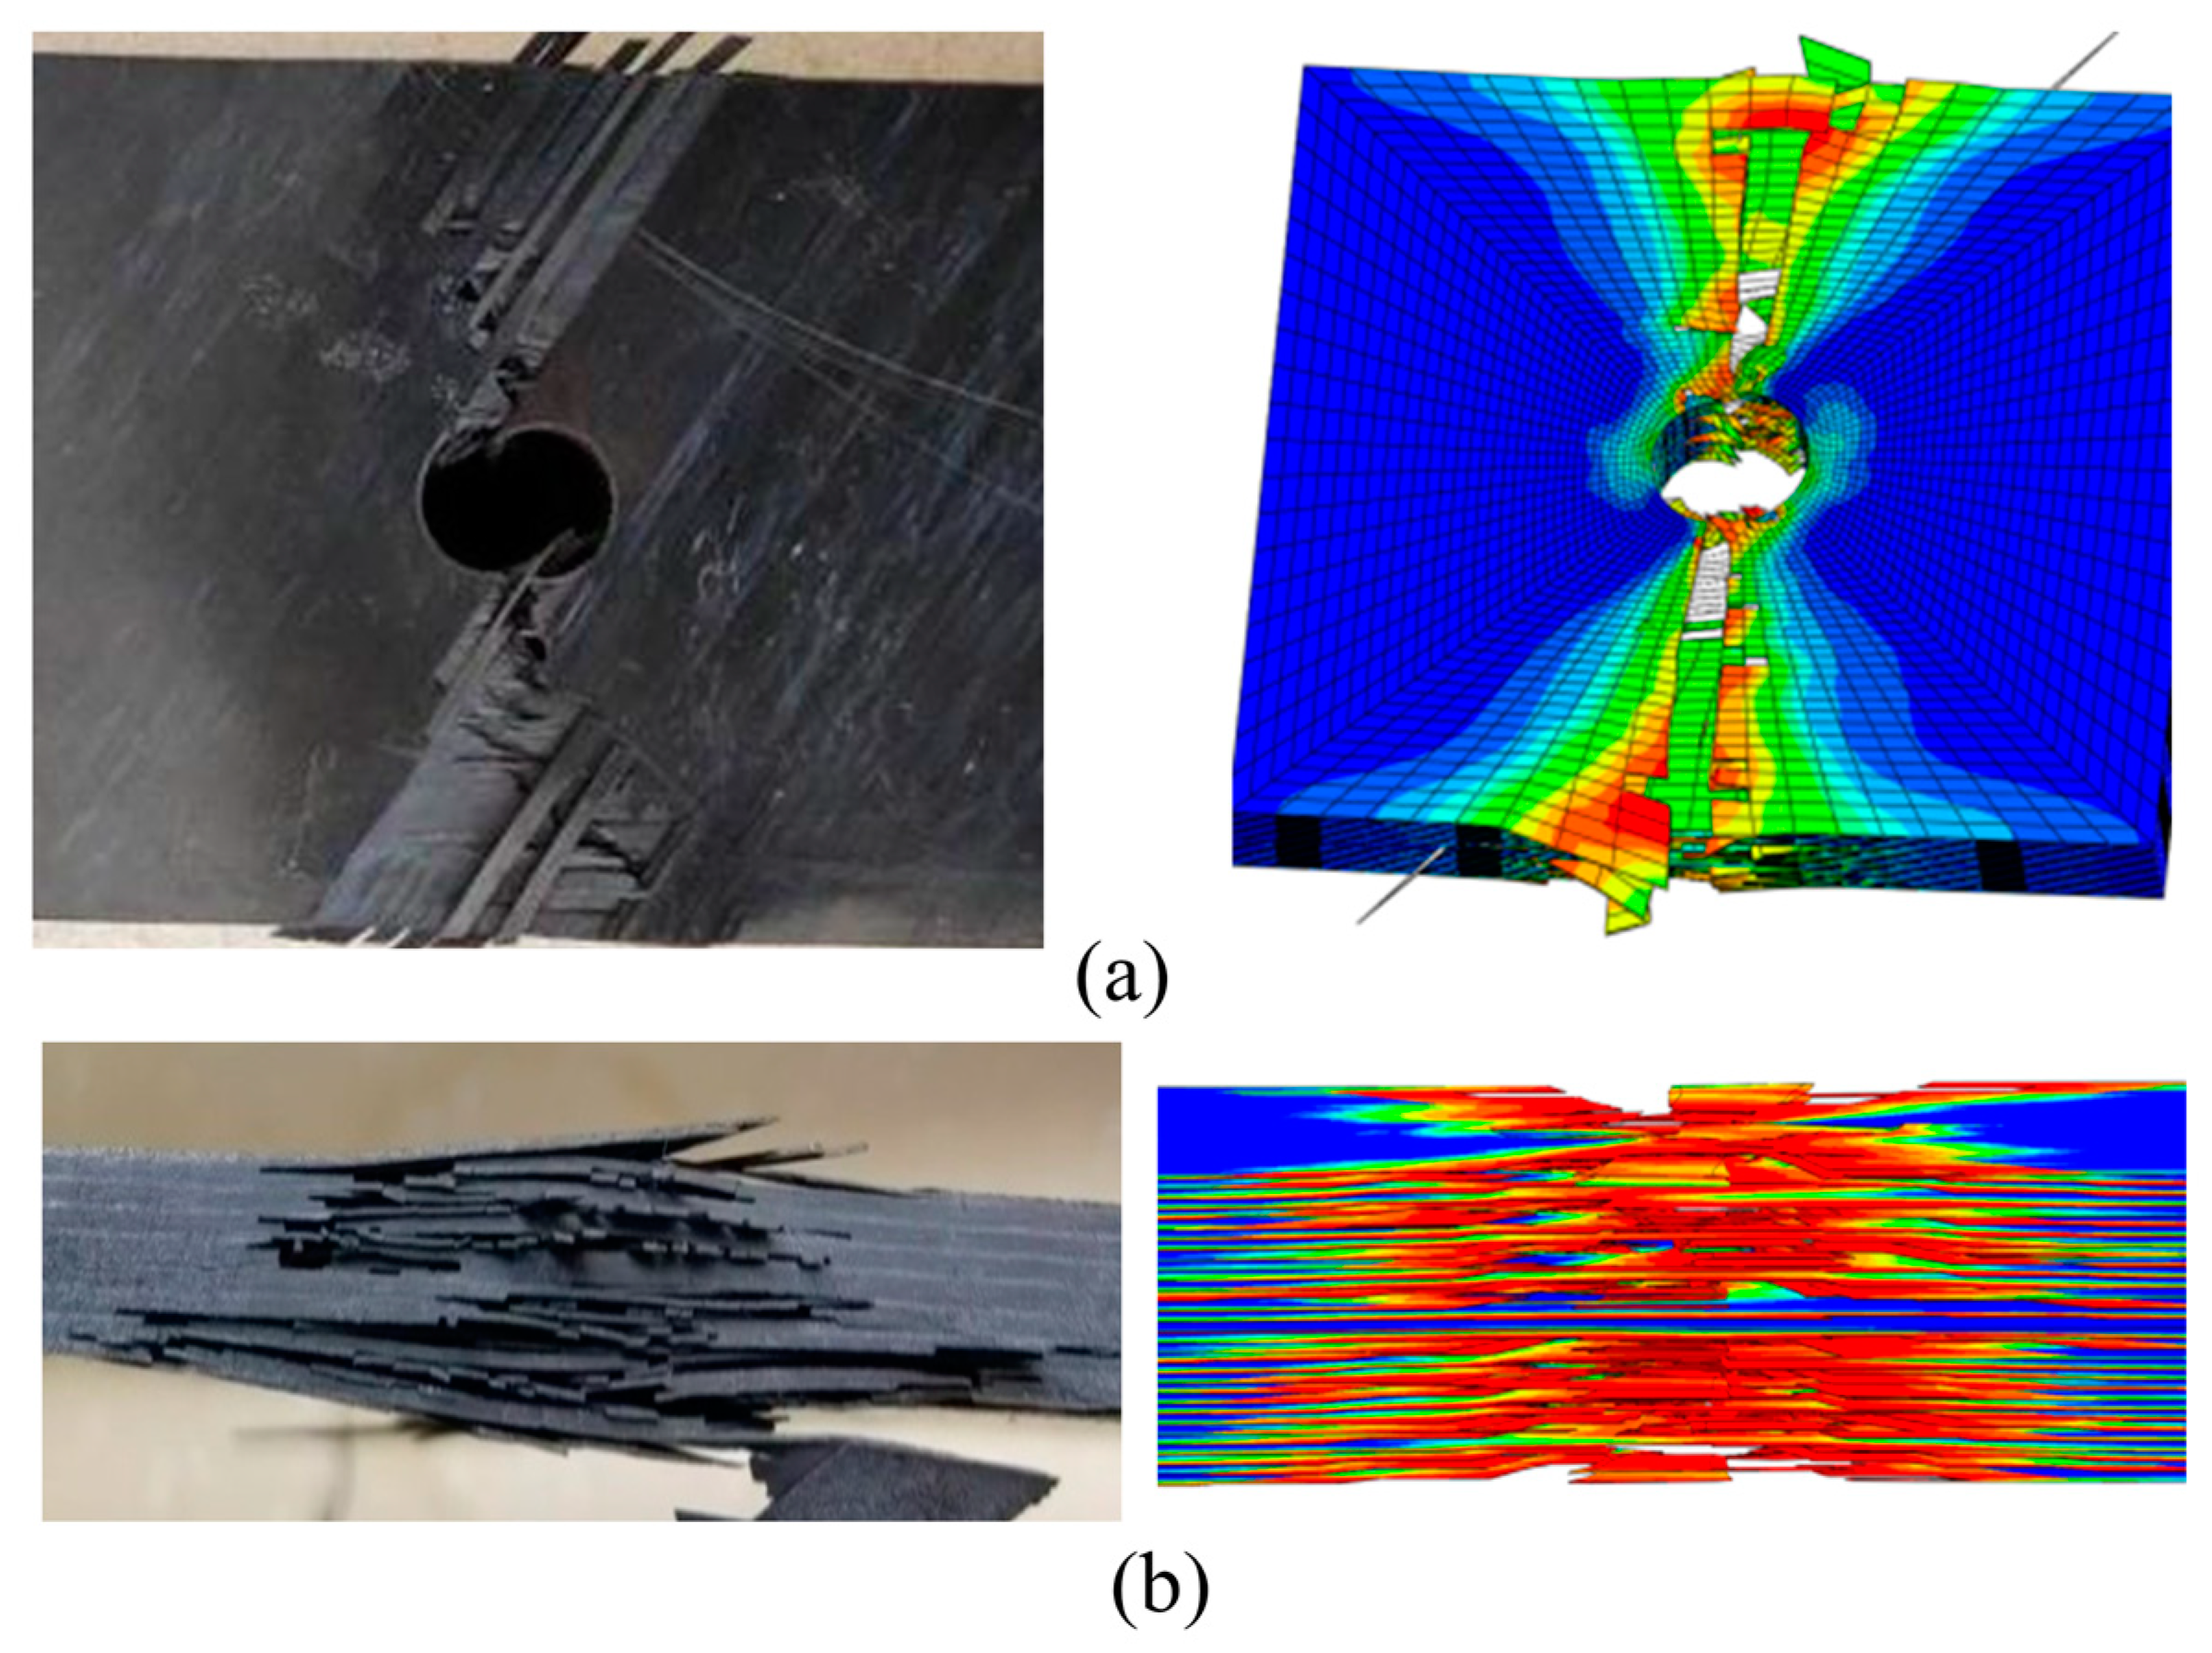
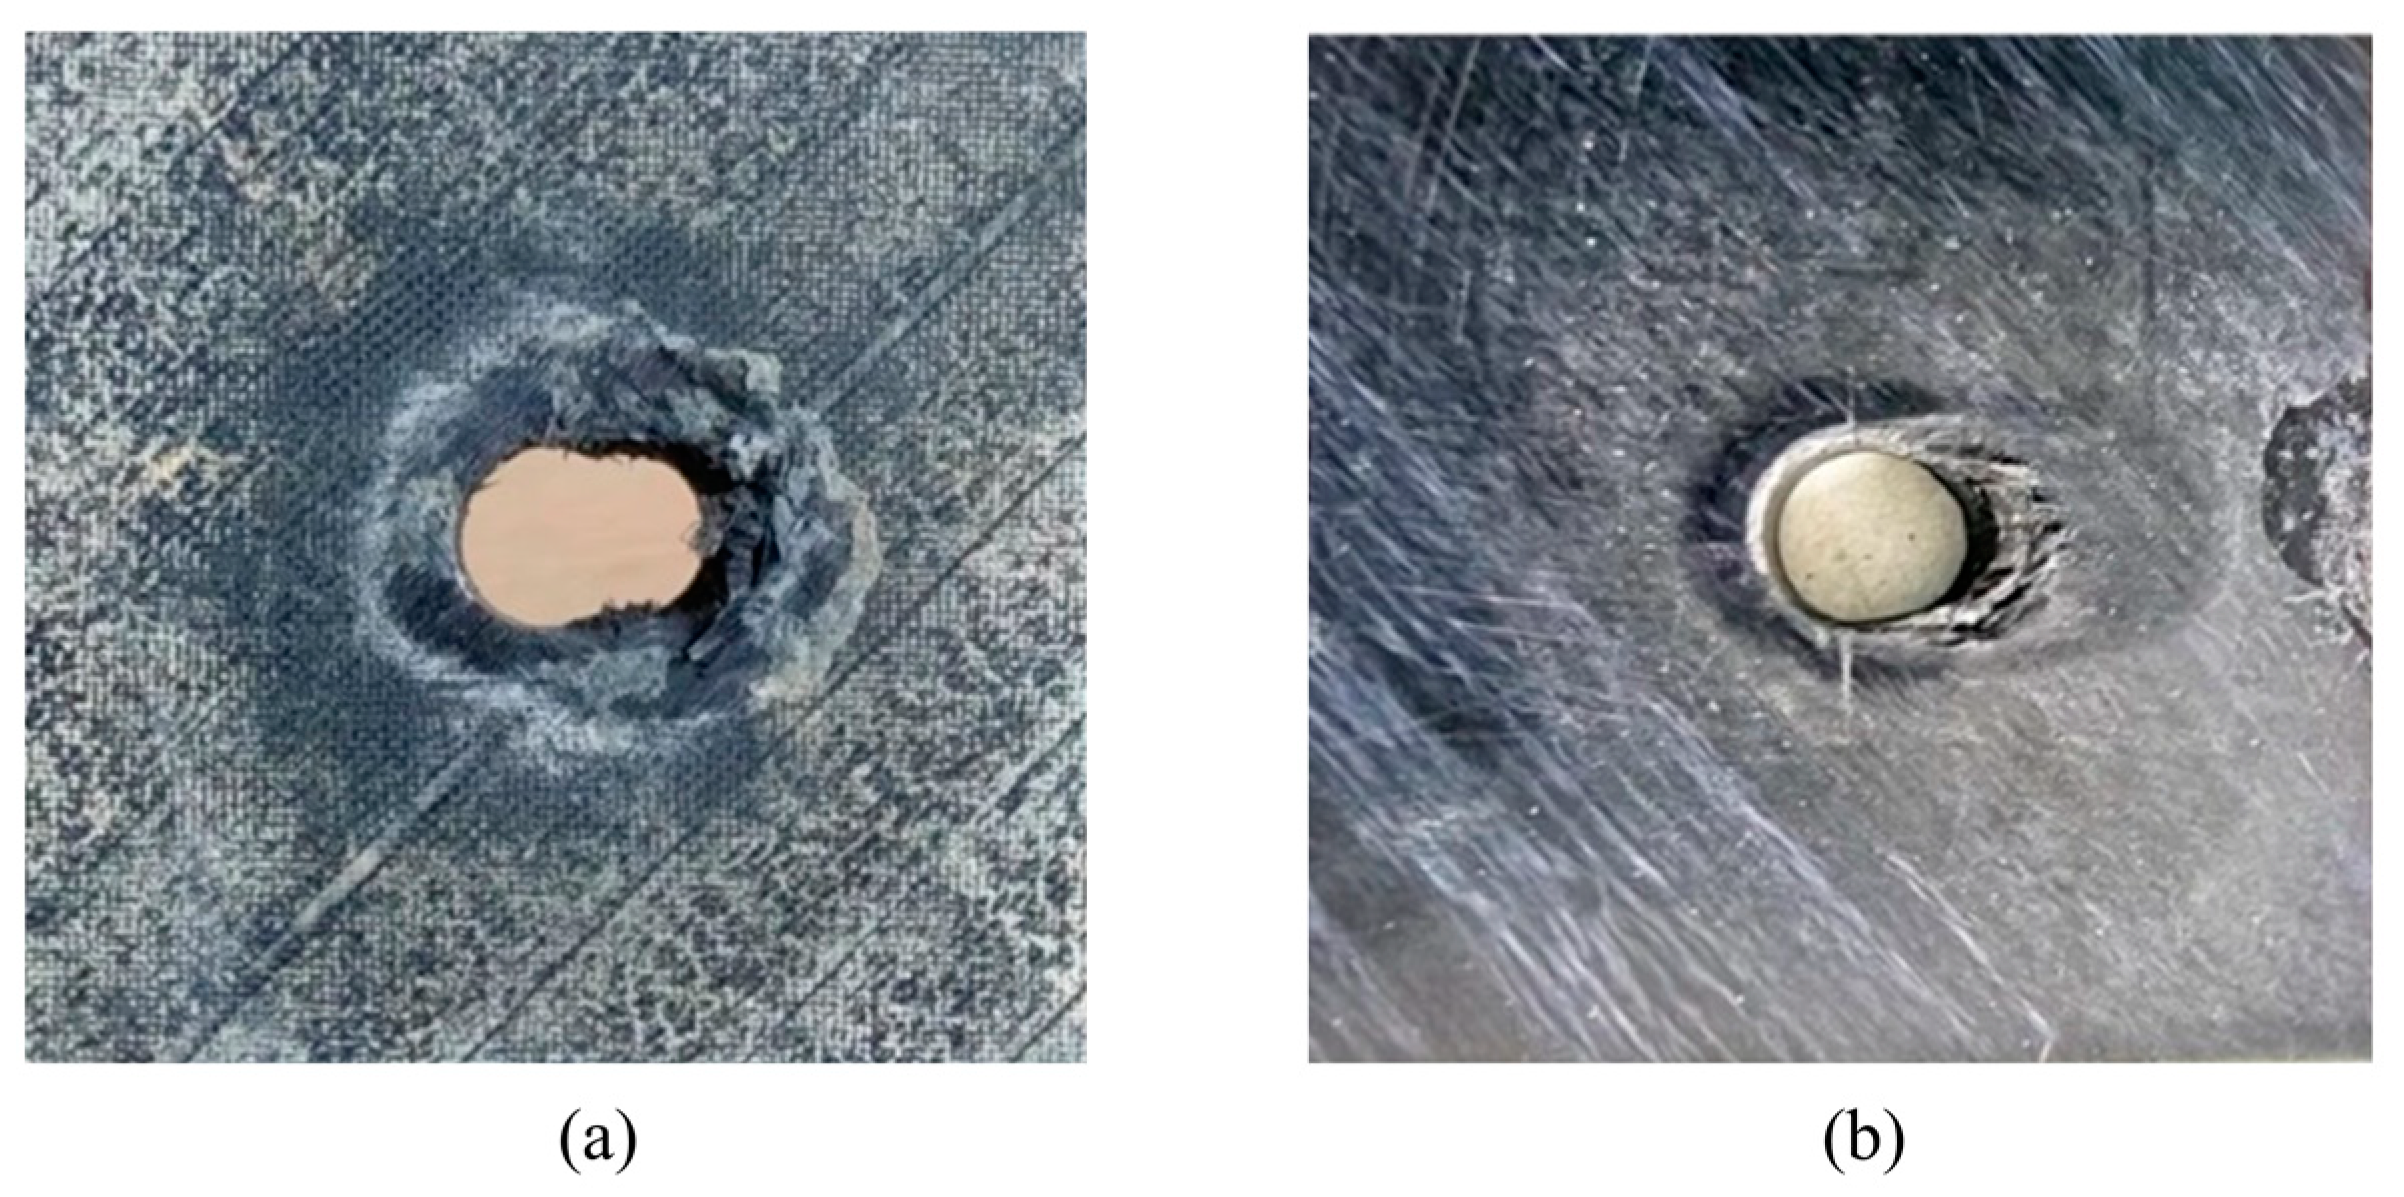
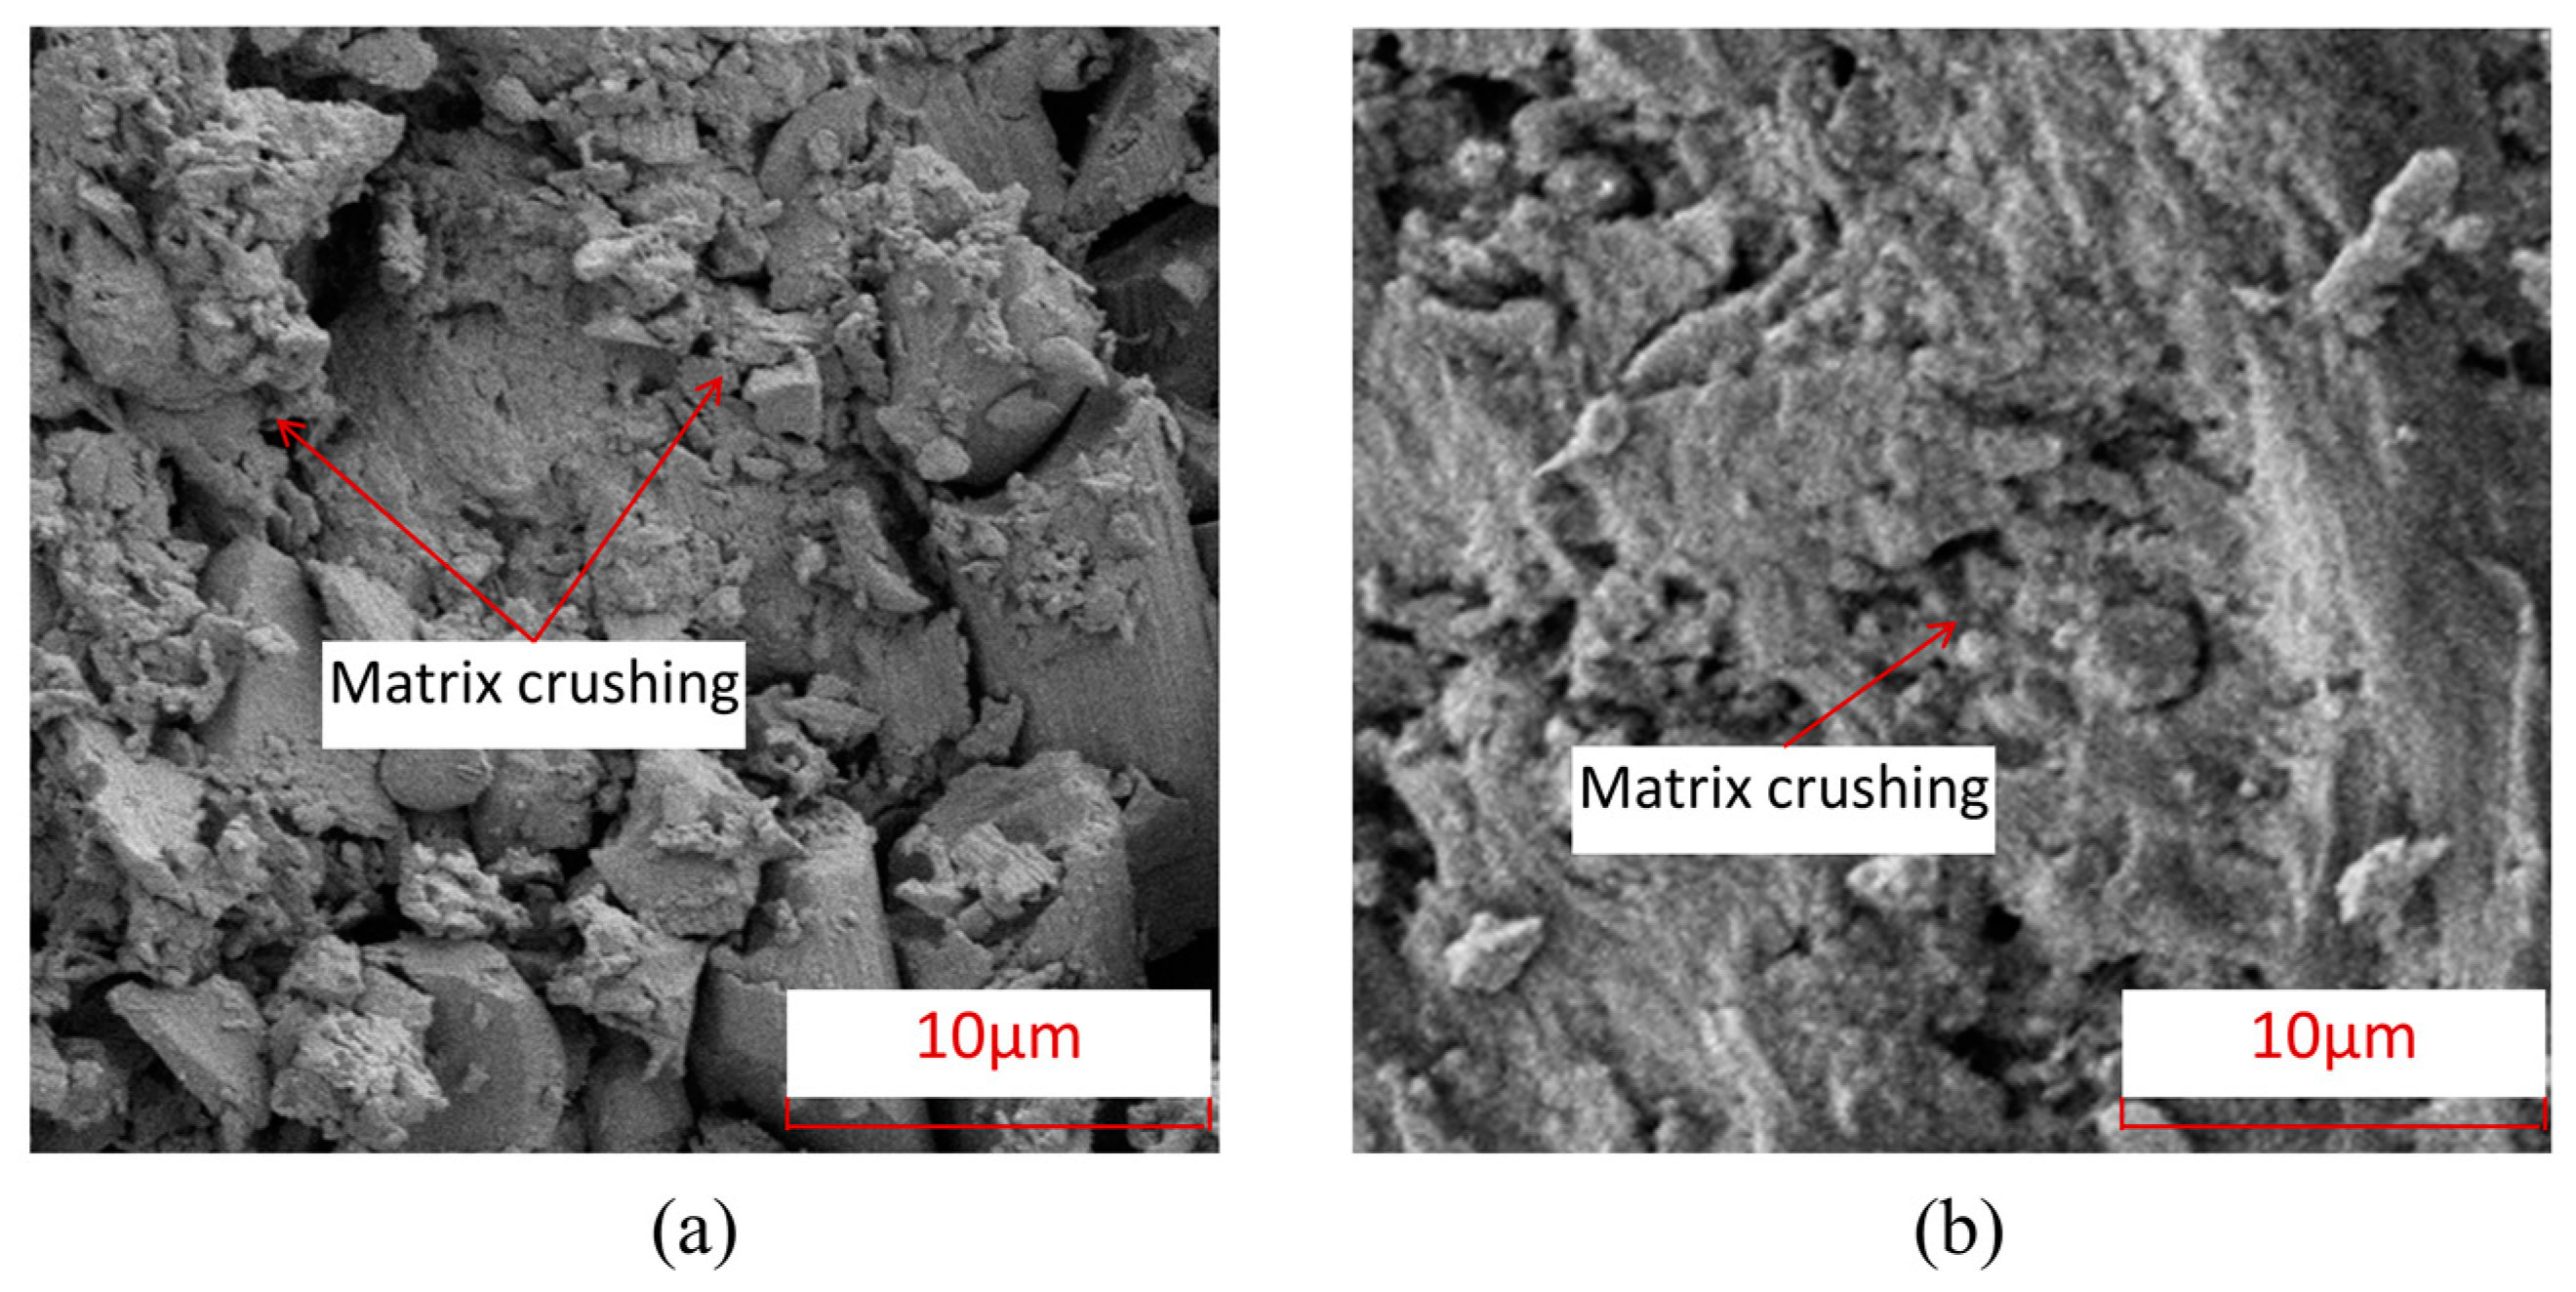
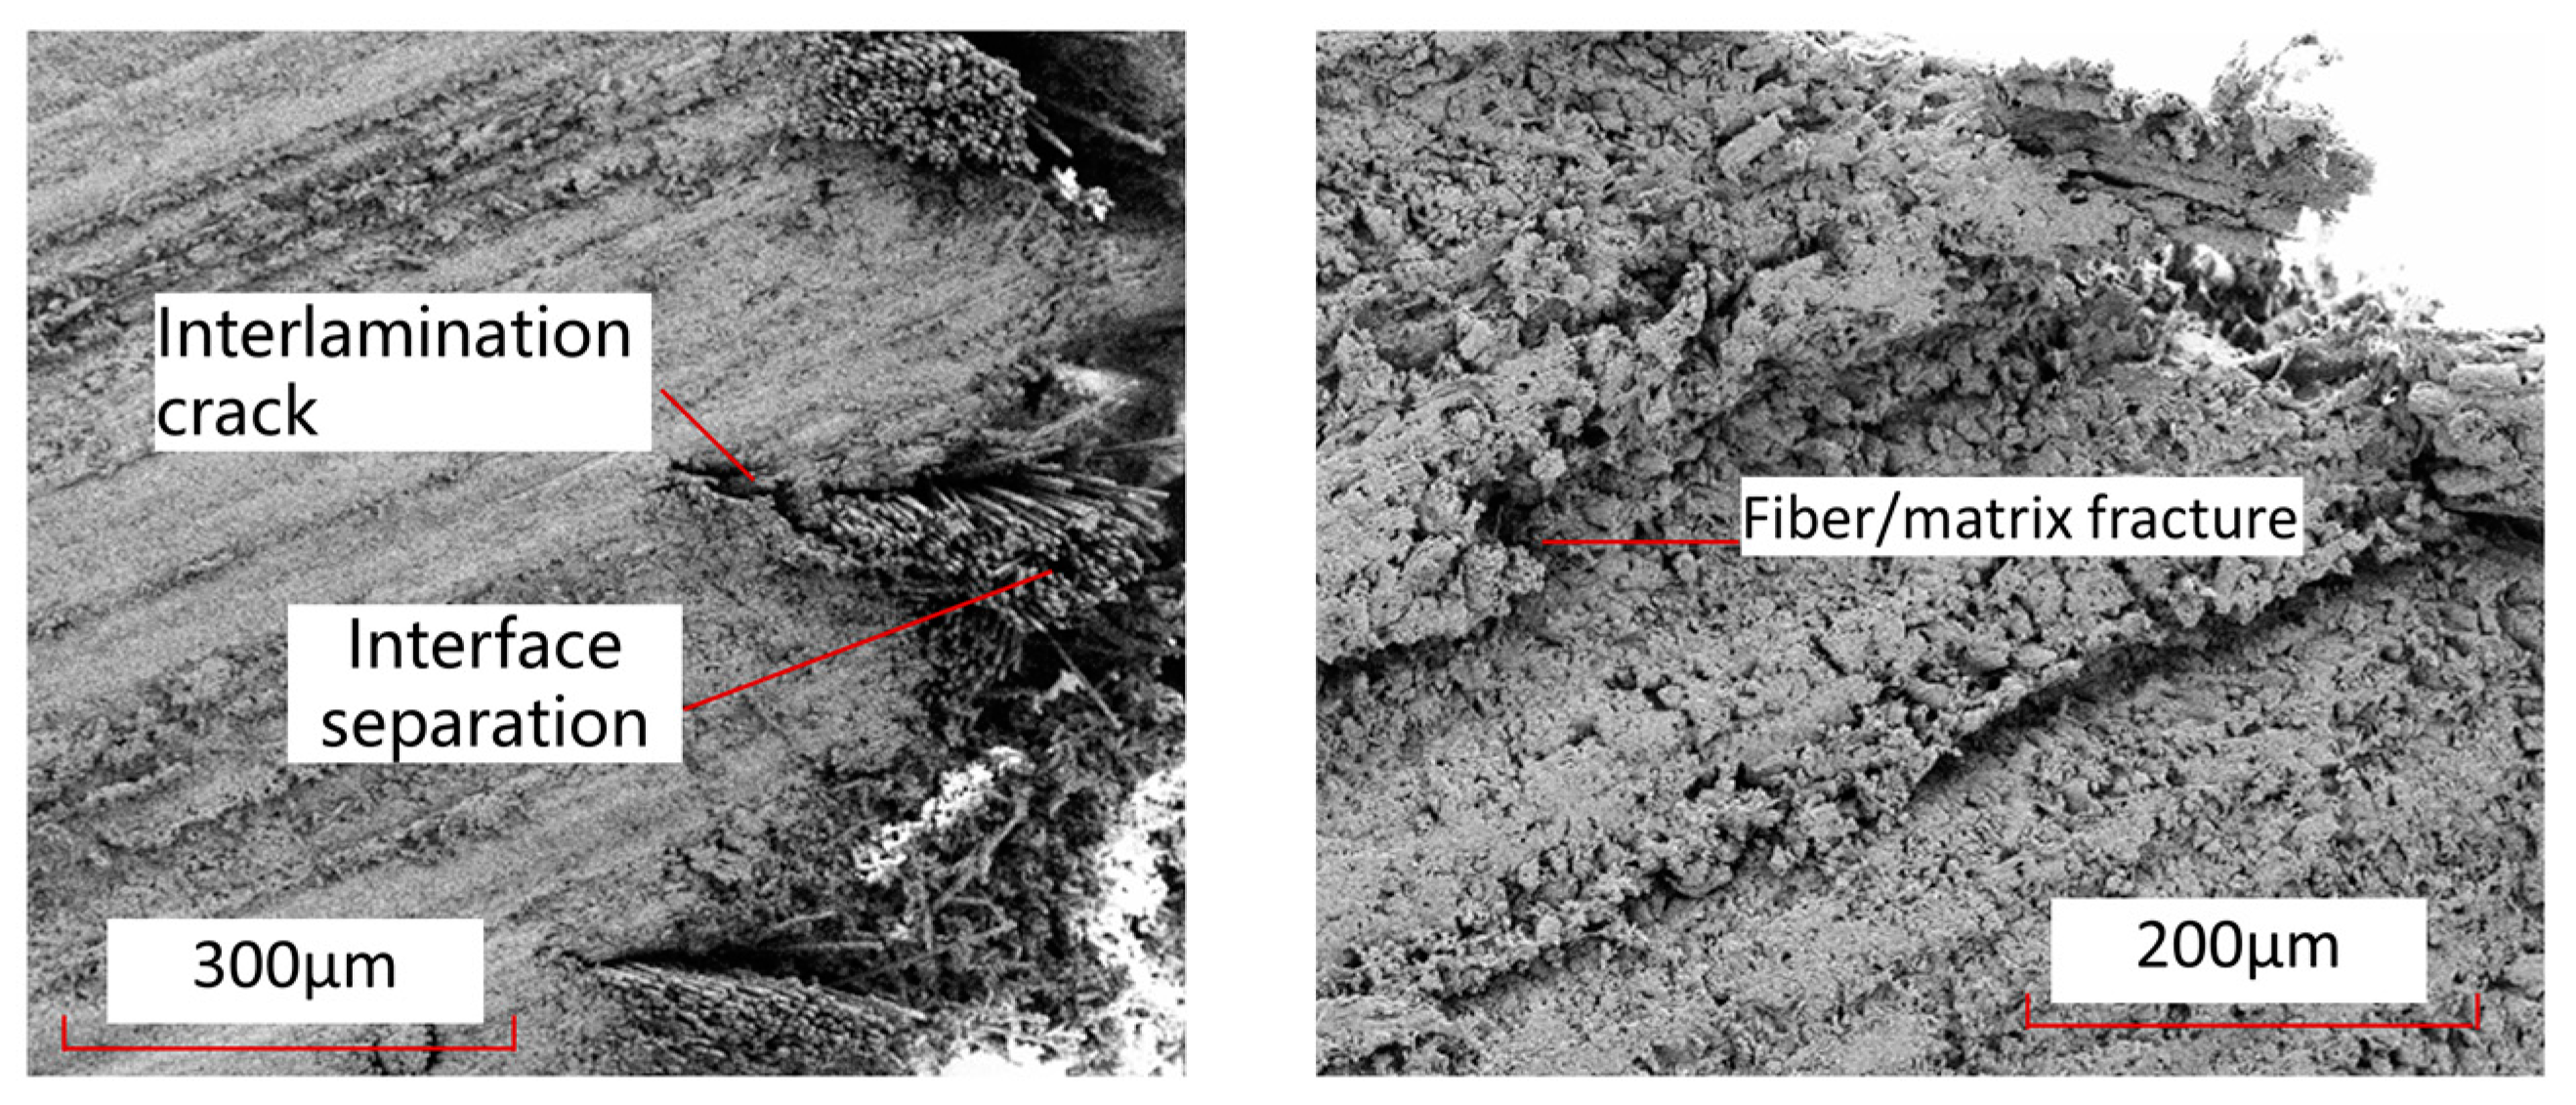
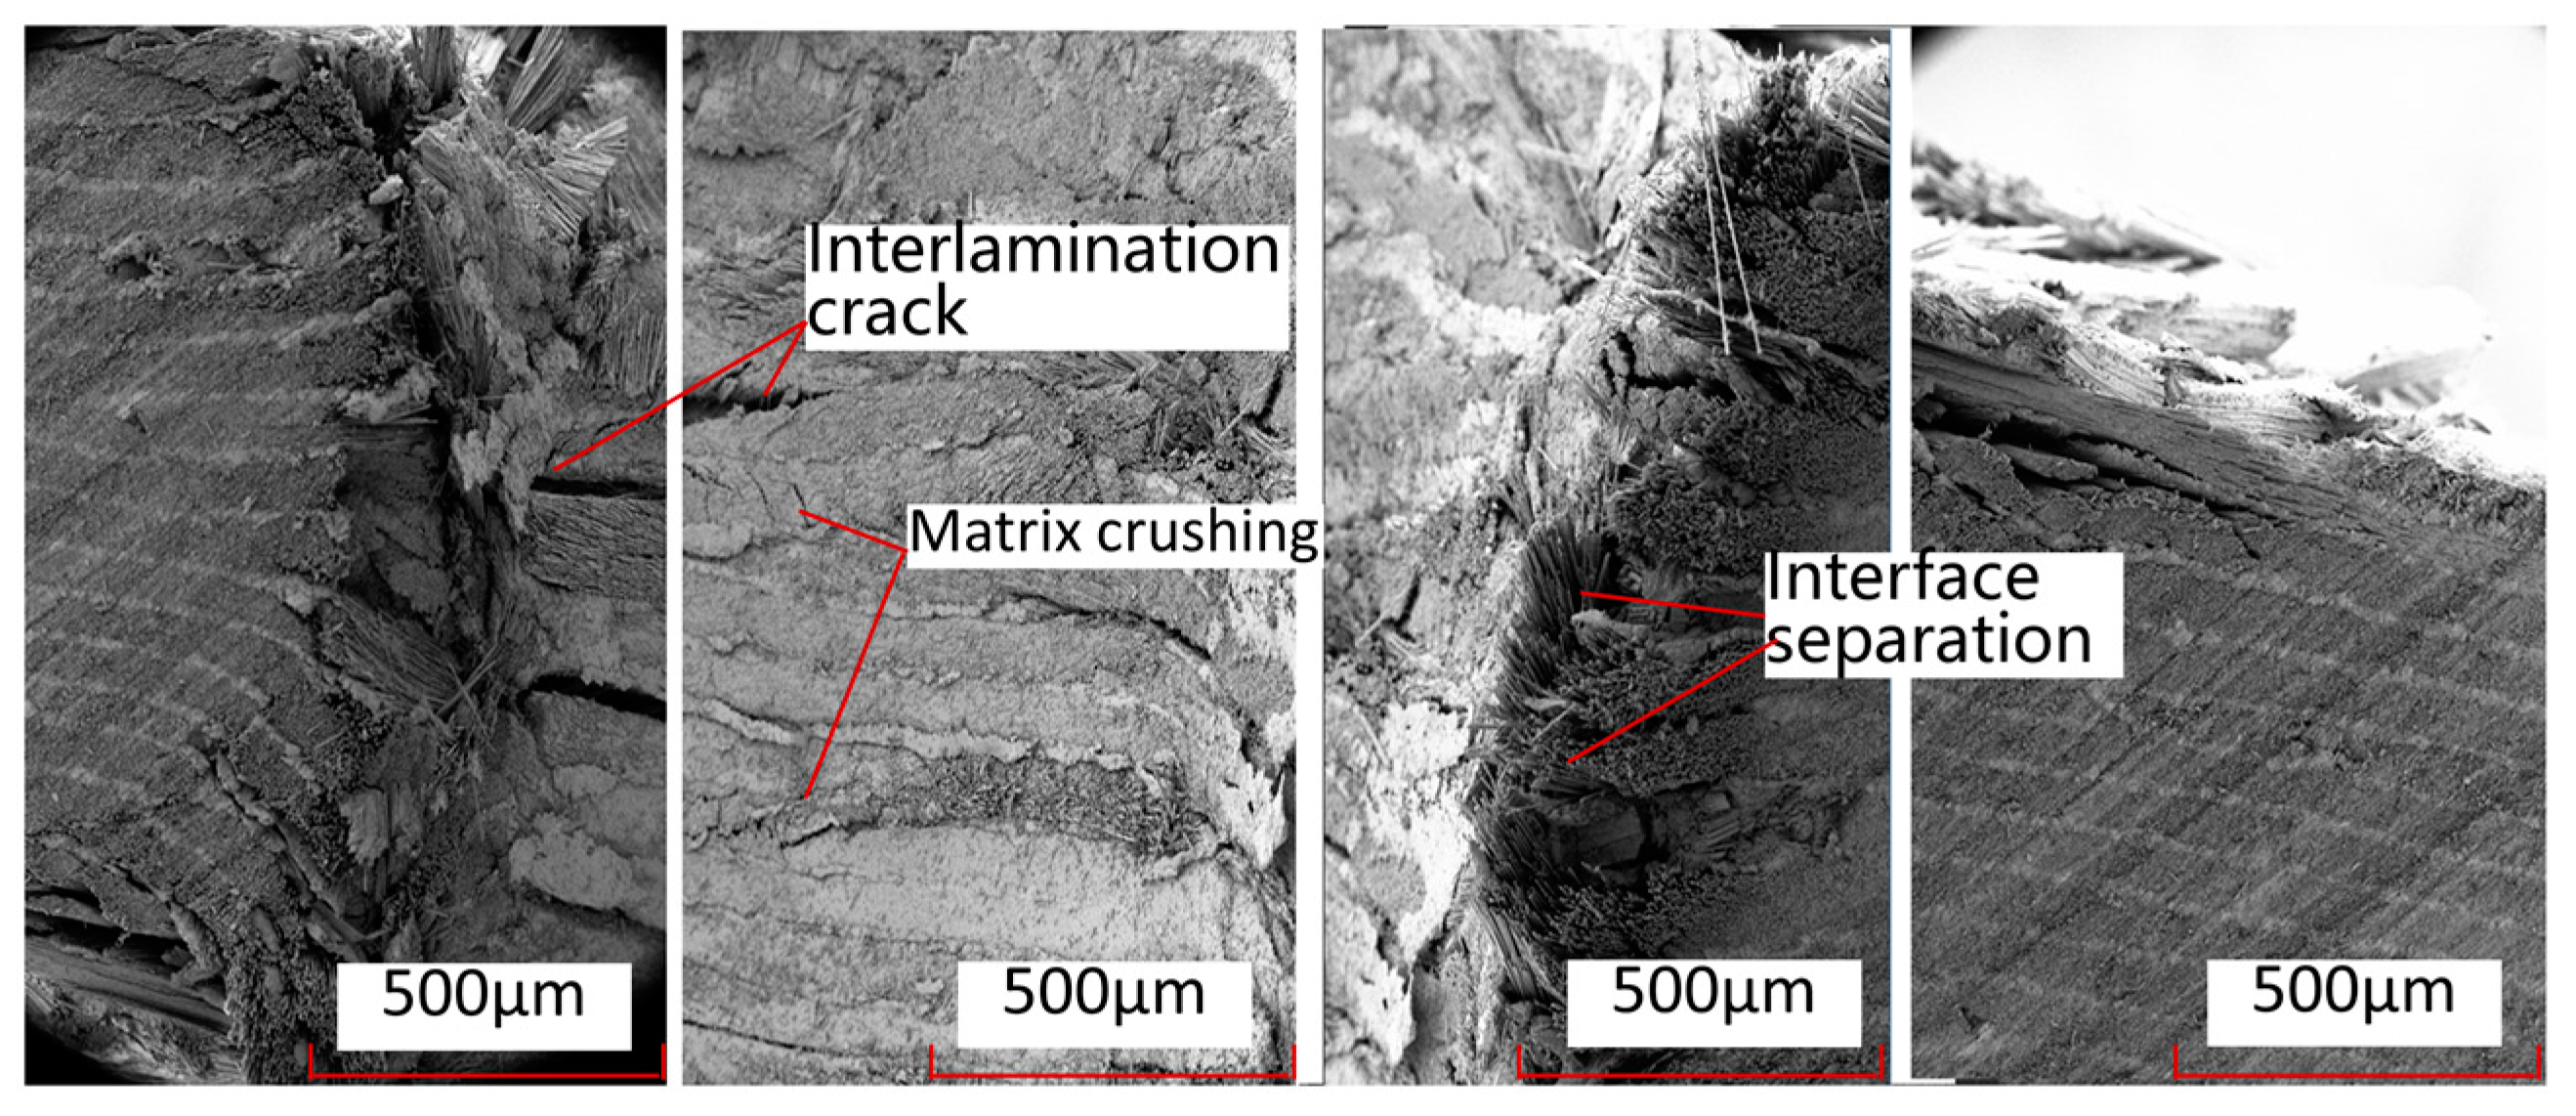
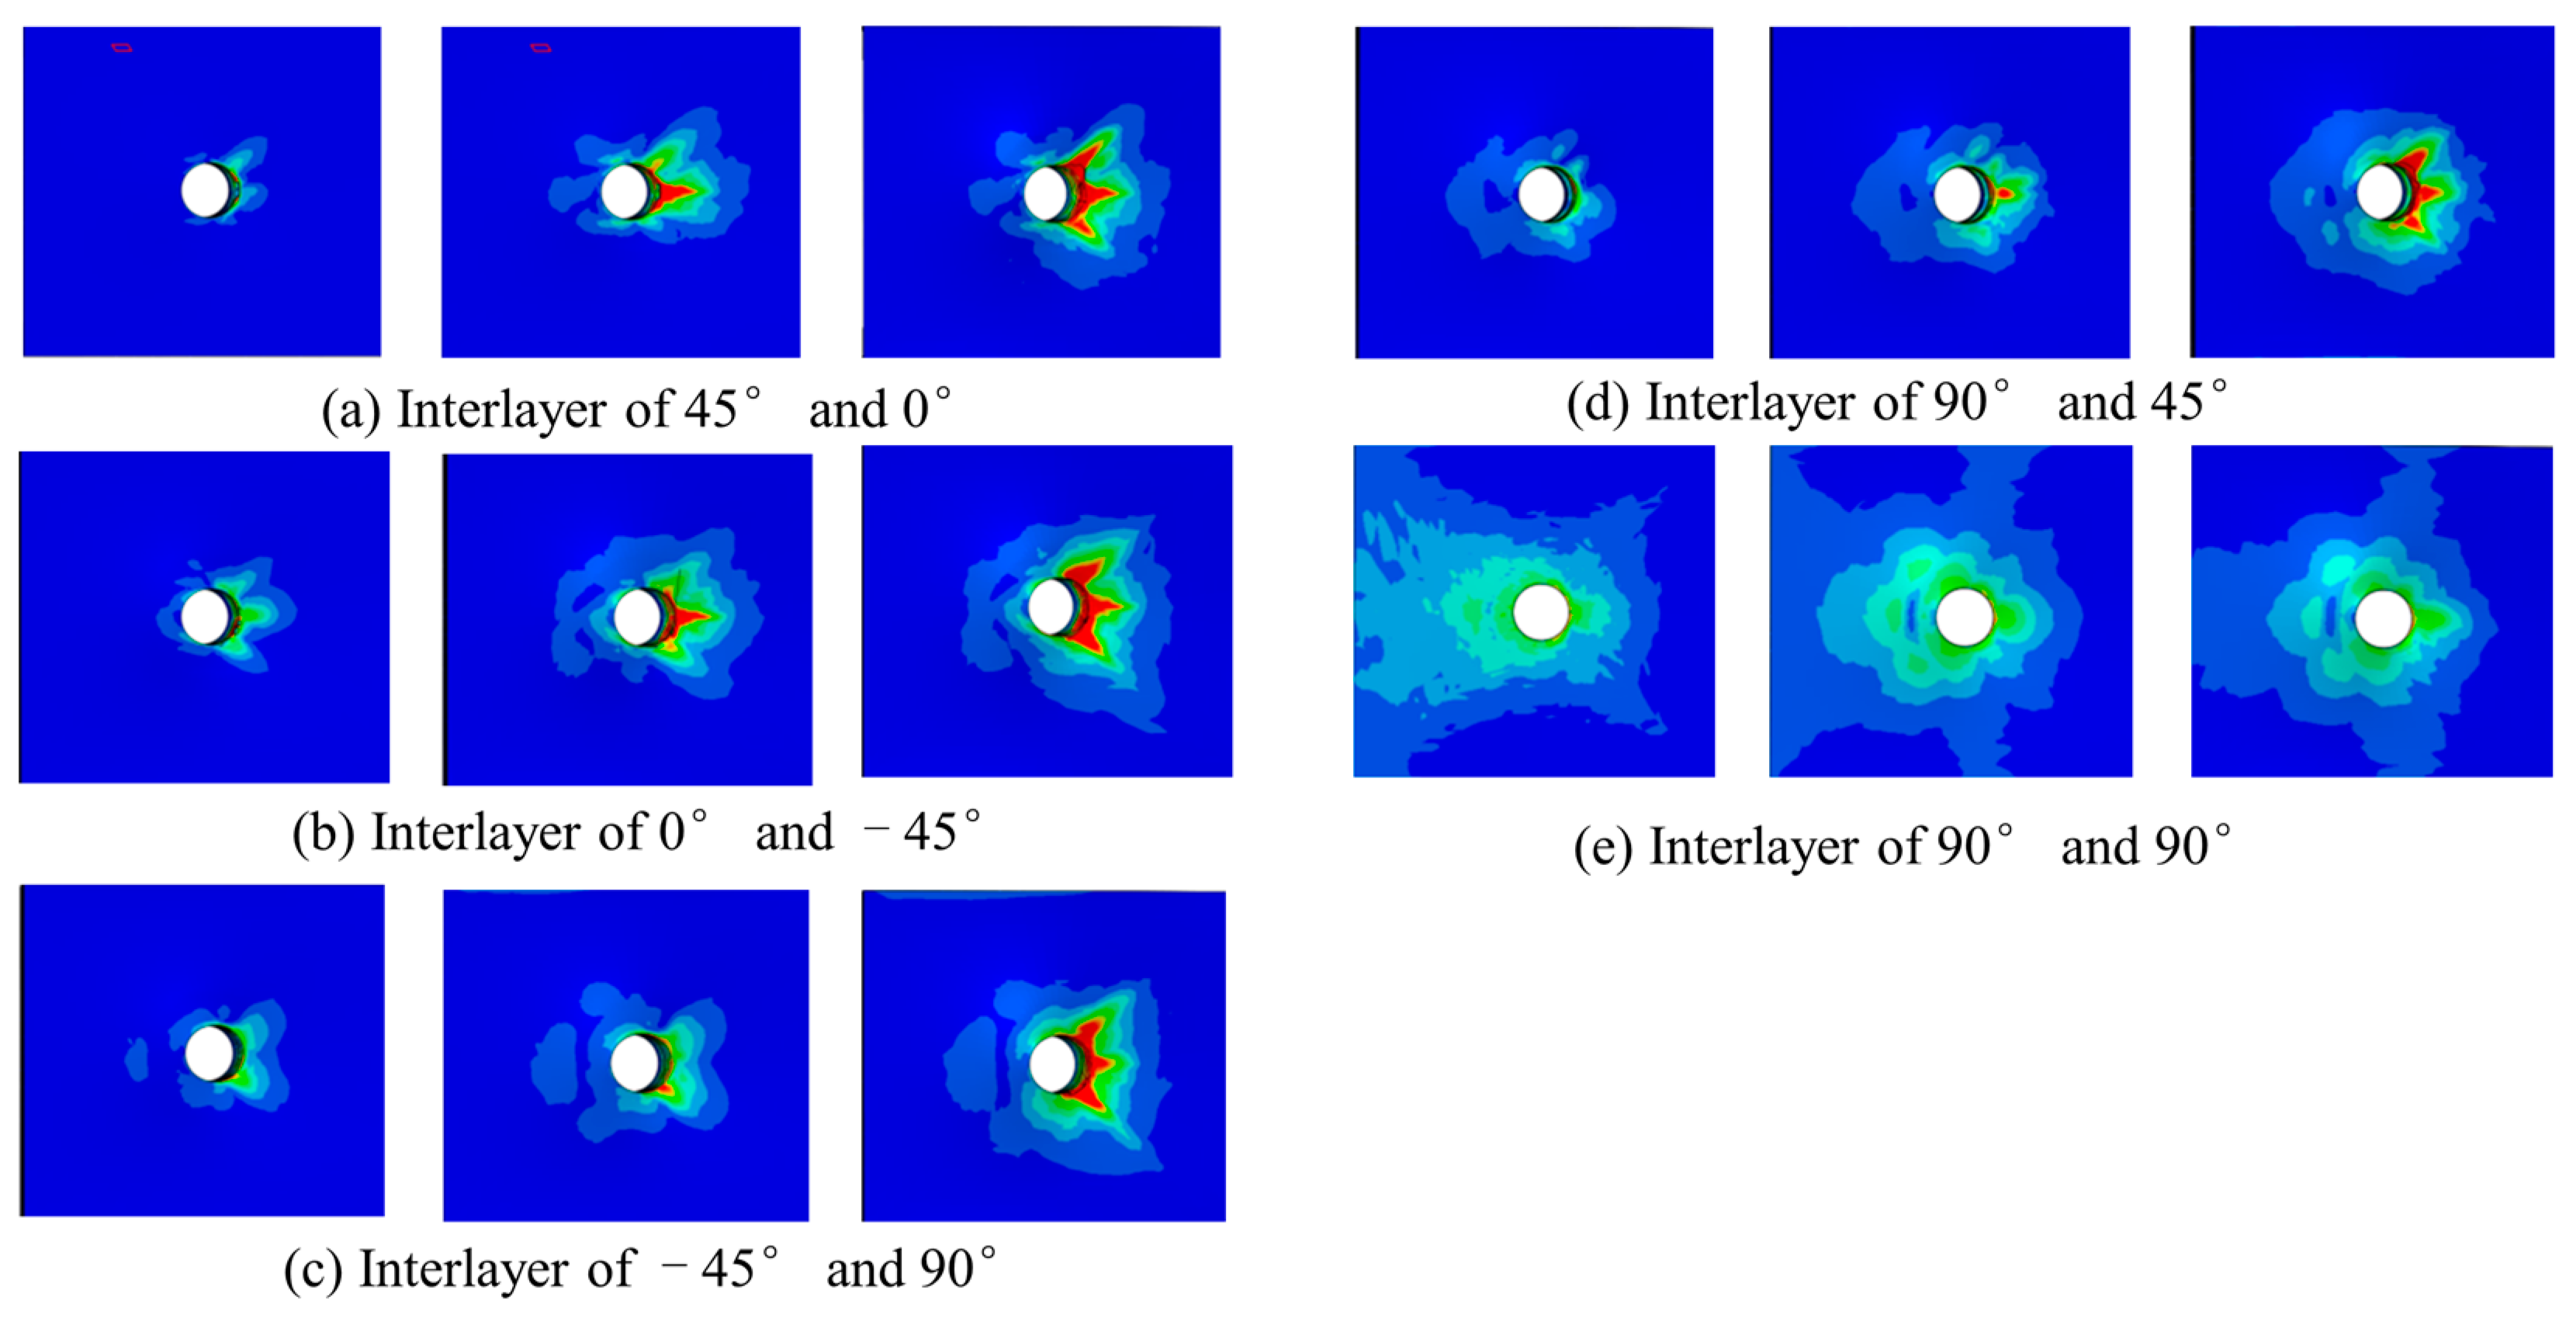
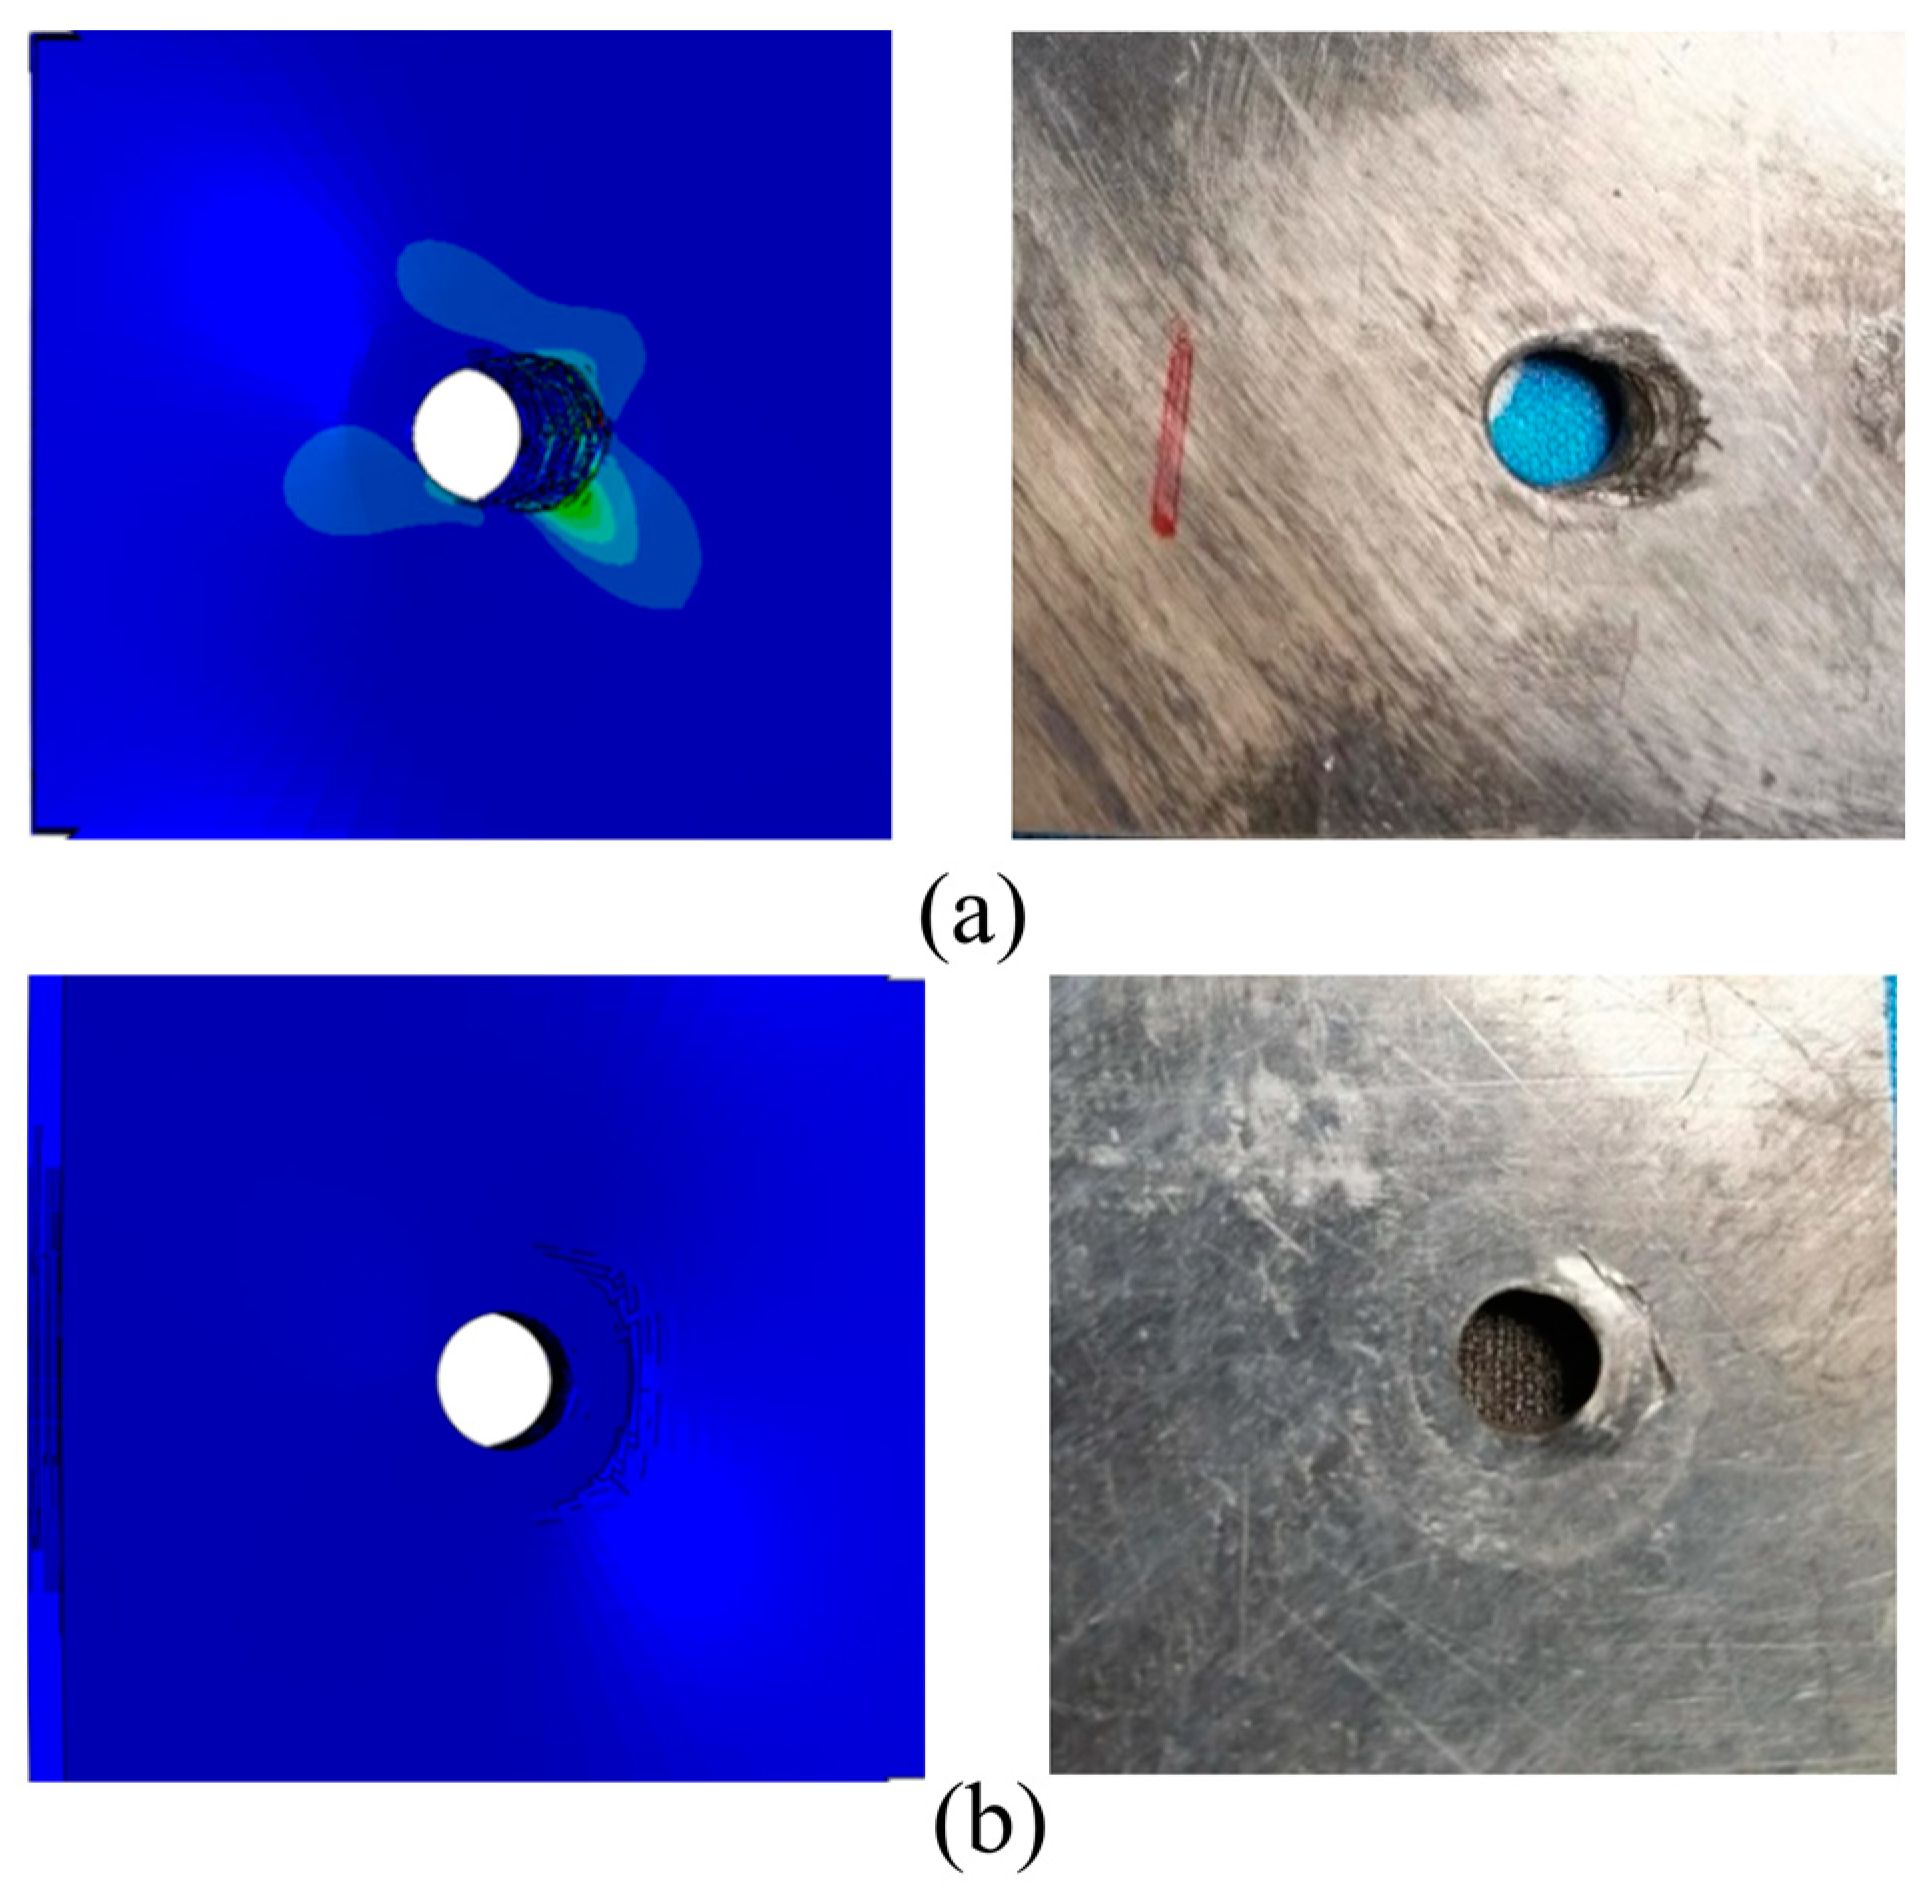
- The single-shear compression specimens of both materials showed compression failure in the direction of the end of the test piece. Thermoplastic composite materials mainly exhibit plastic flow in the matrix near the hole in contact with the bolt rod, and the fibers bend and break with numerical plastic deformation. However, thermosetting composite materials undergo greater deformation along the load direction, with more failure forms such as fiber and matrix separation, interlayer delamination, and matrix crushing appearing at the hole edge in contact with the bolt rod. In addition, thermoplastic composite materials and thermosetting composite materials exhibit small bracket-shaped matrix extrusion fractures and cracks in the contact area between the bolt cap and the hole edge in the load direction. As the extrusion load increases, the fracture area of the hole edge matrix increases, resulting in the microbending of fibers and interlayer delamination. When the damage continues to accumulate to a certain extent, local shear failure occurs in the test piece;
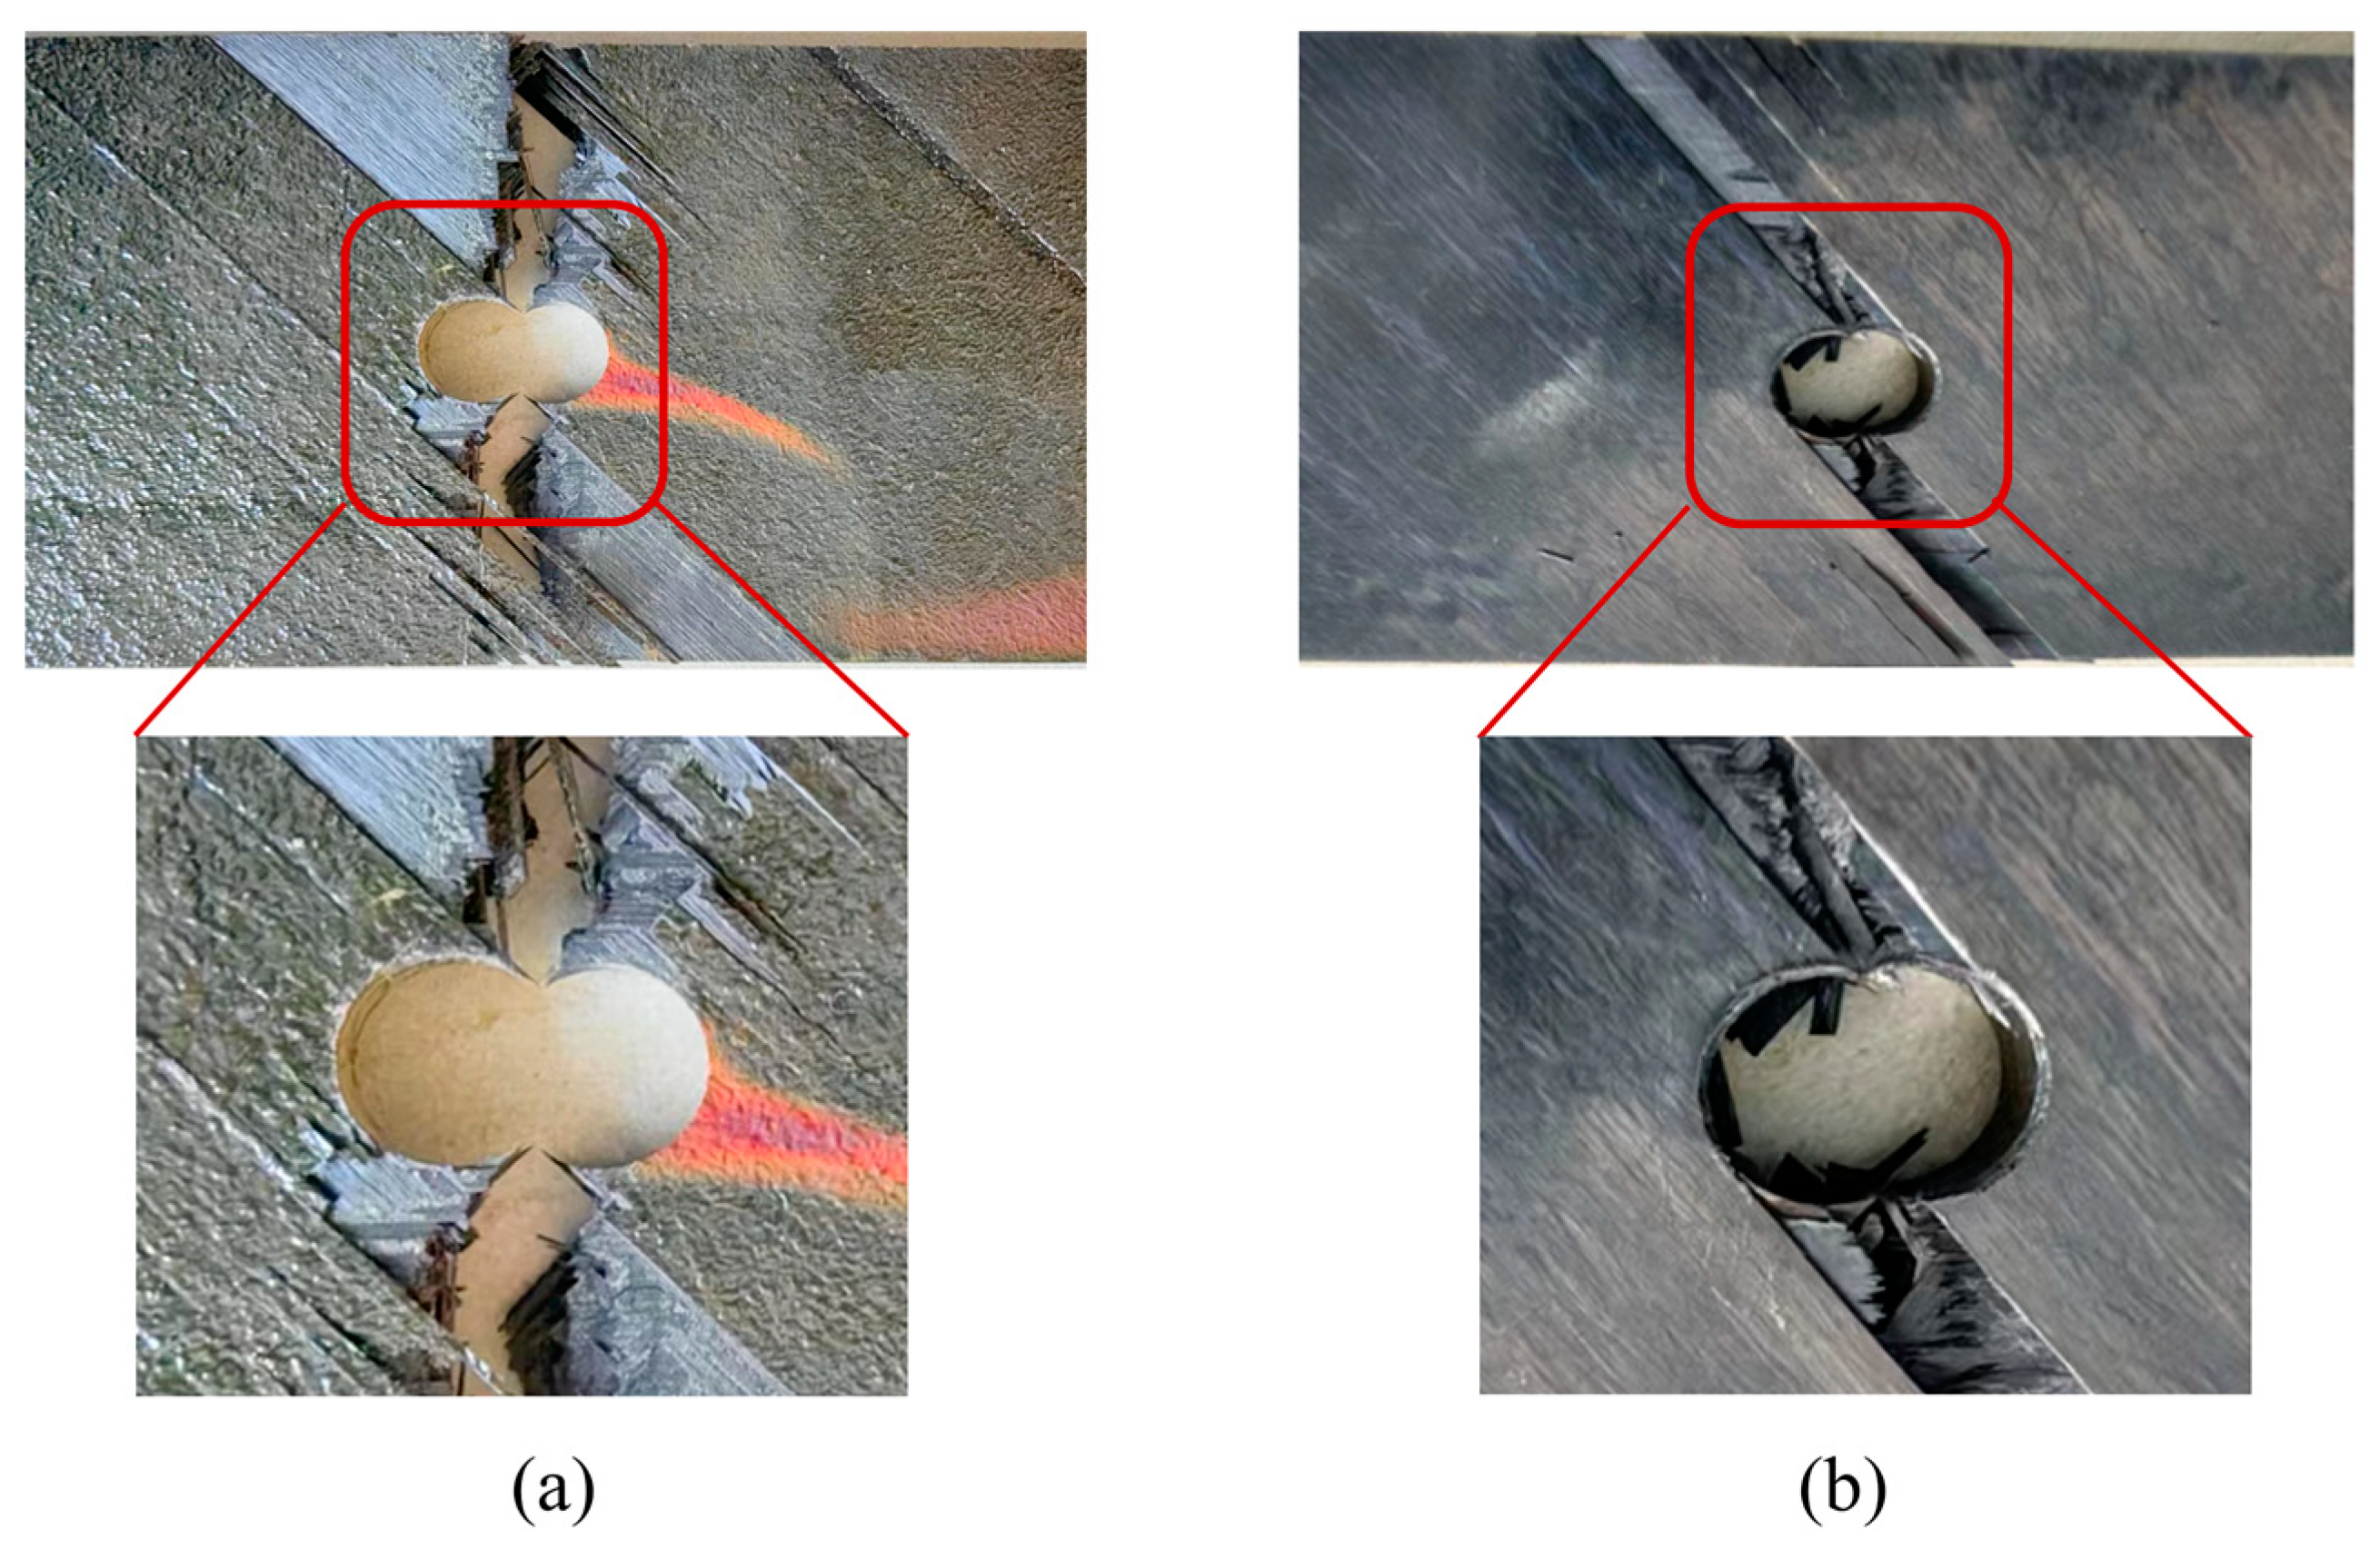
- (d)
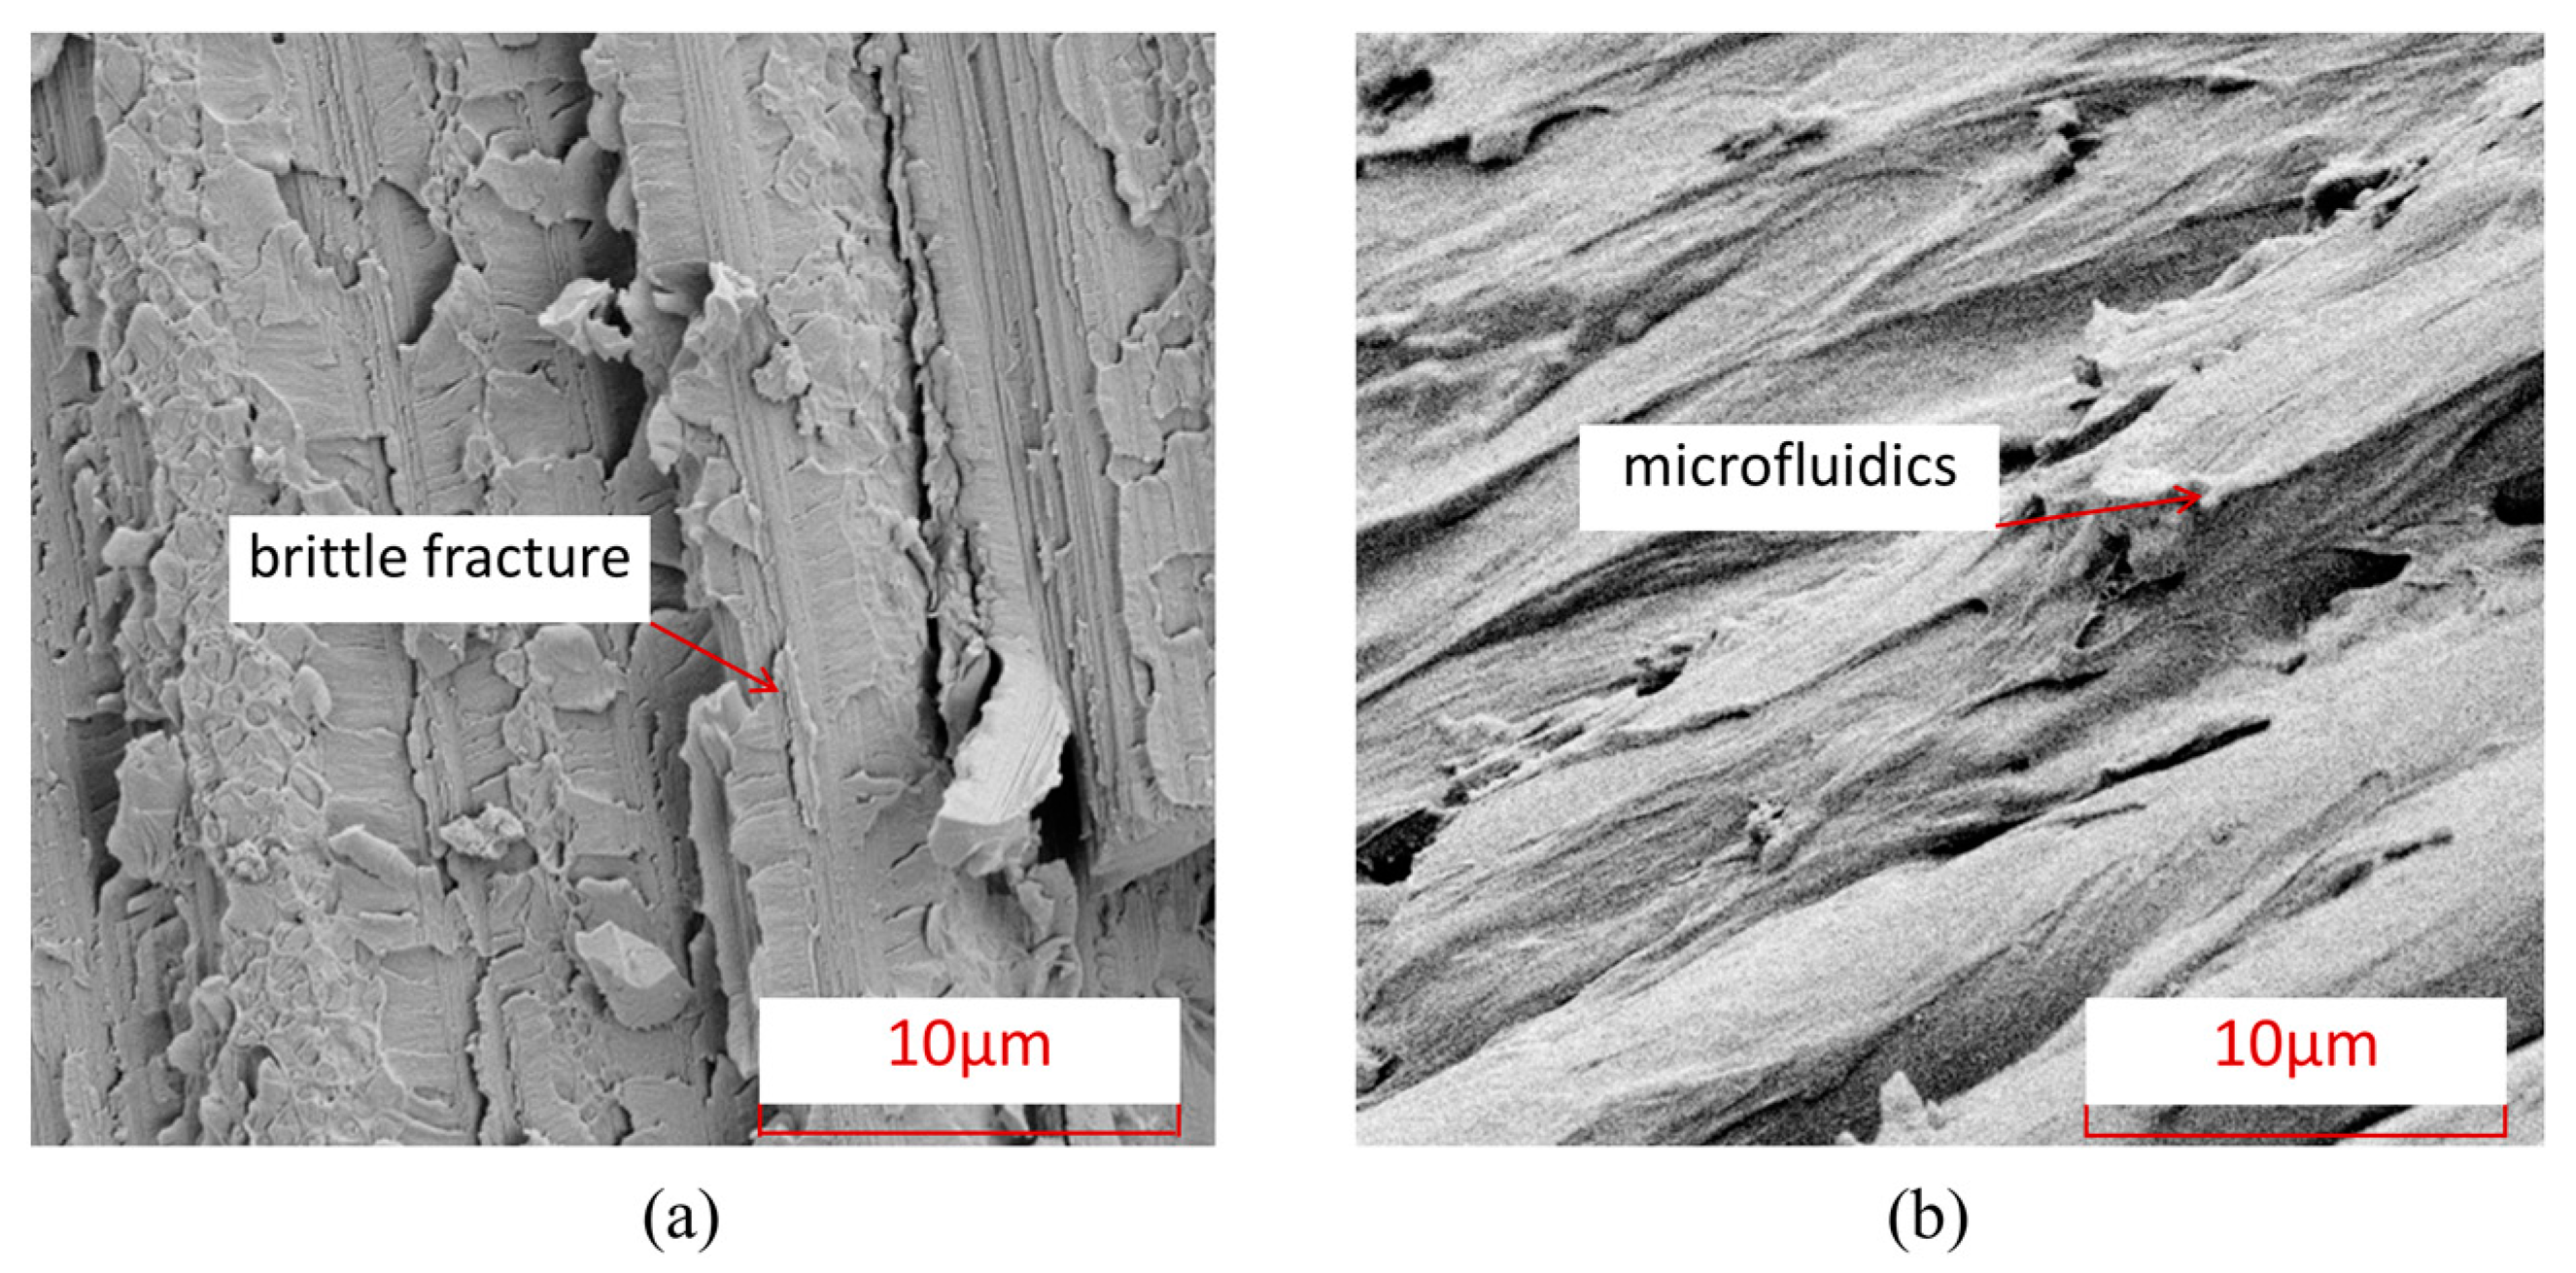
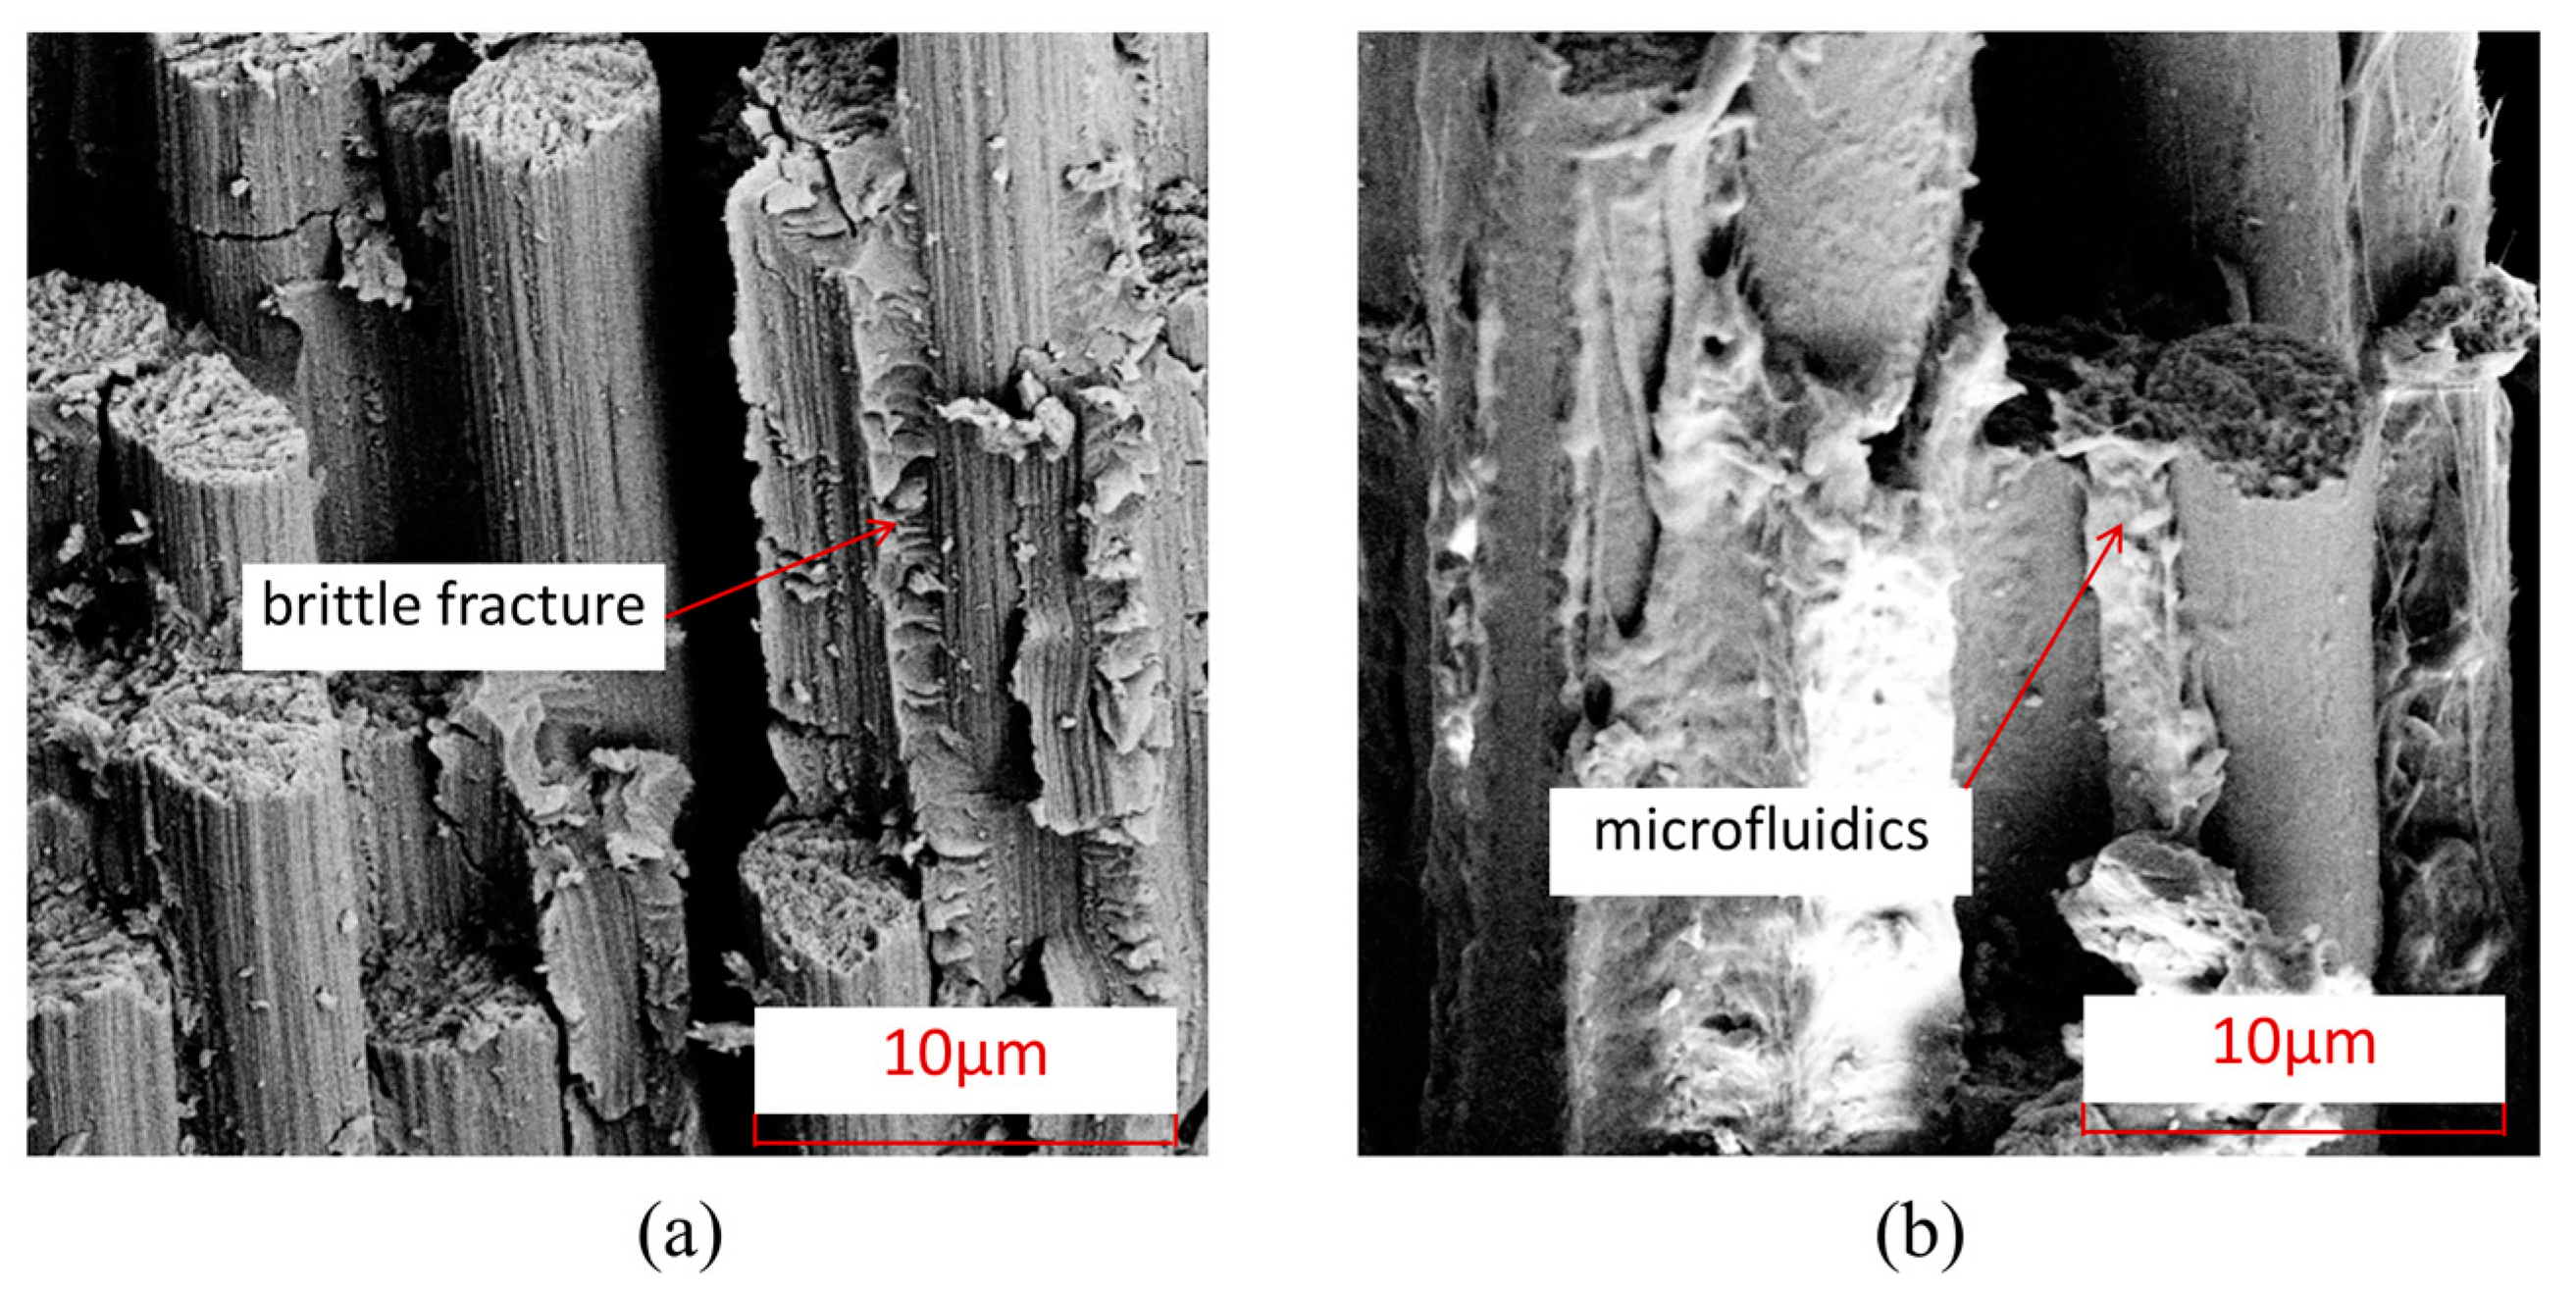
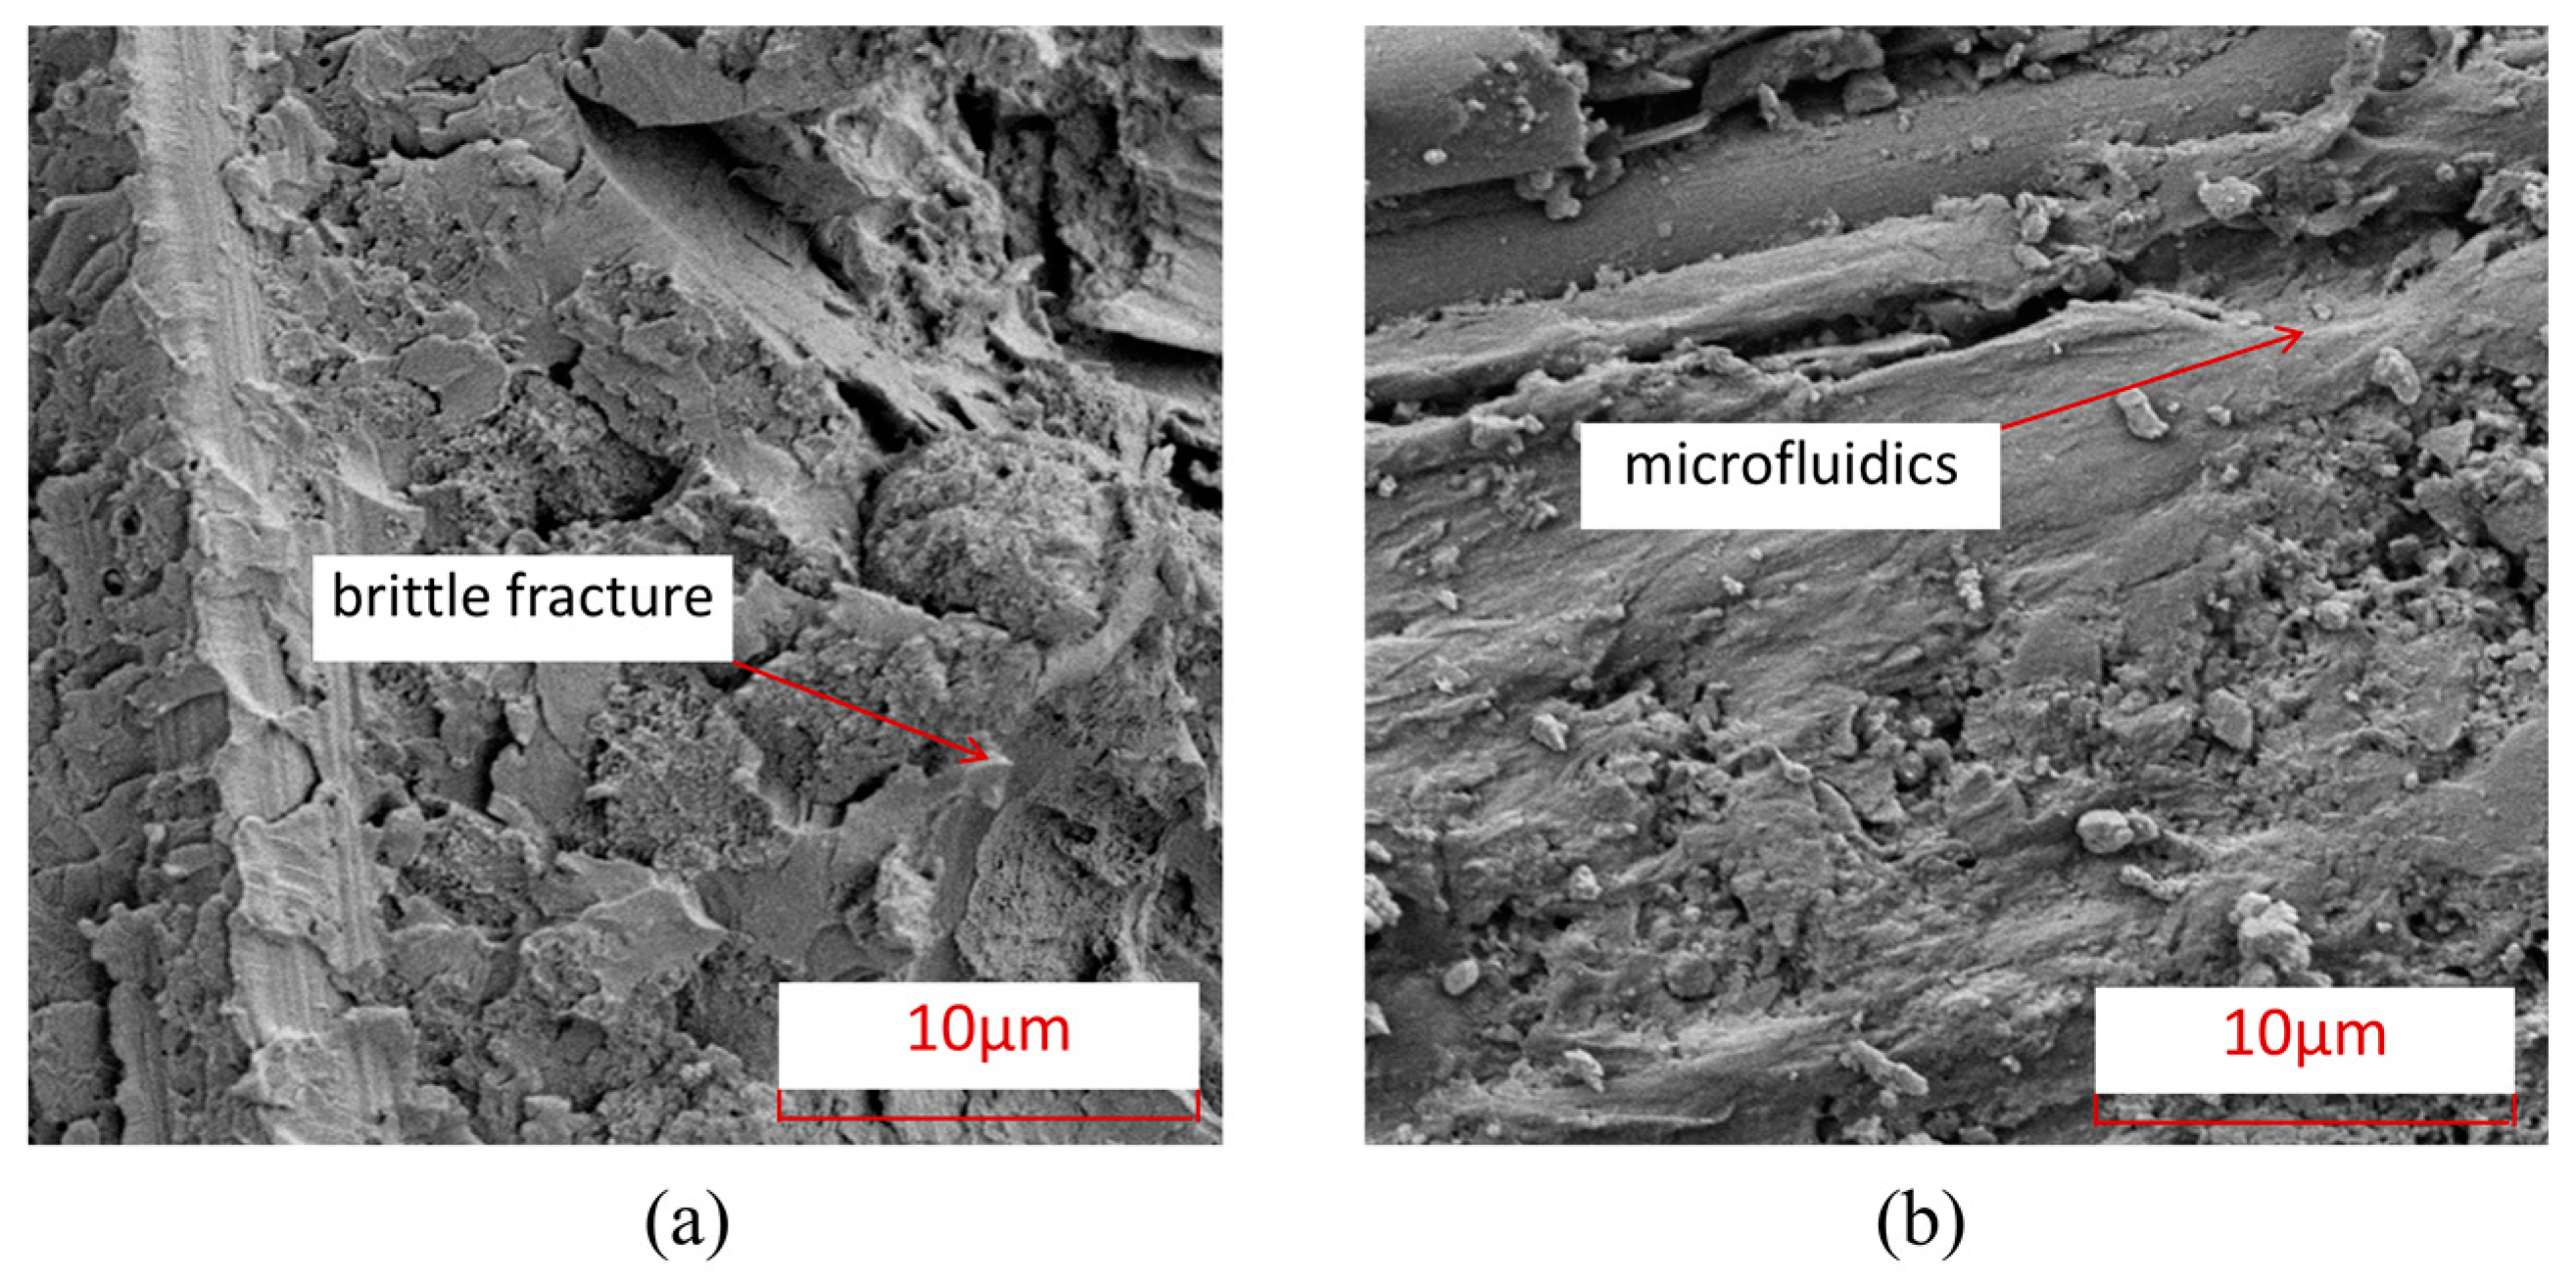
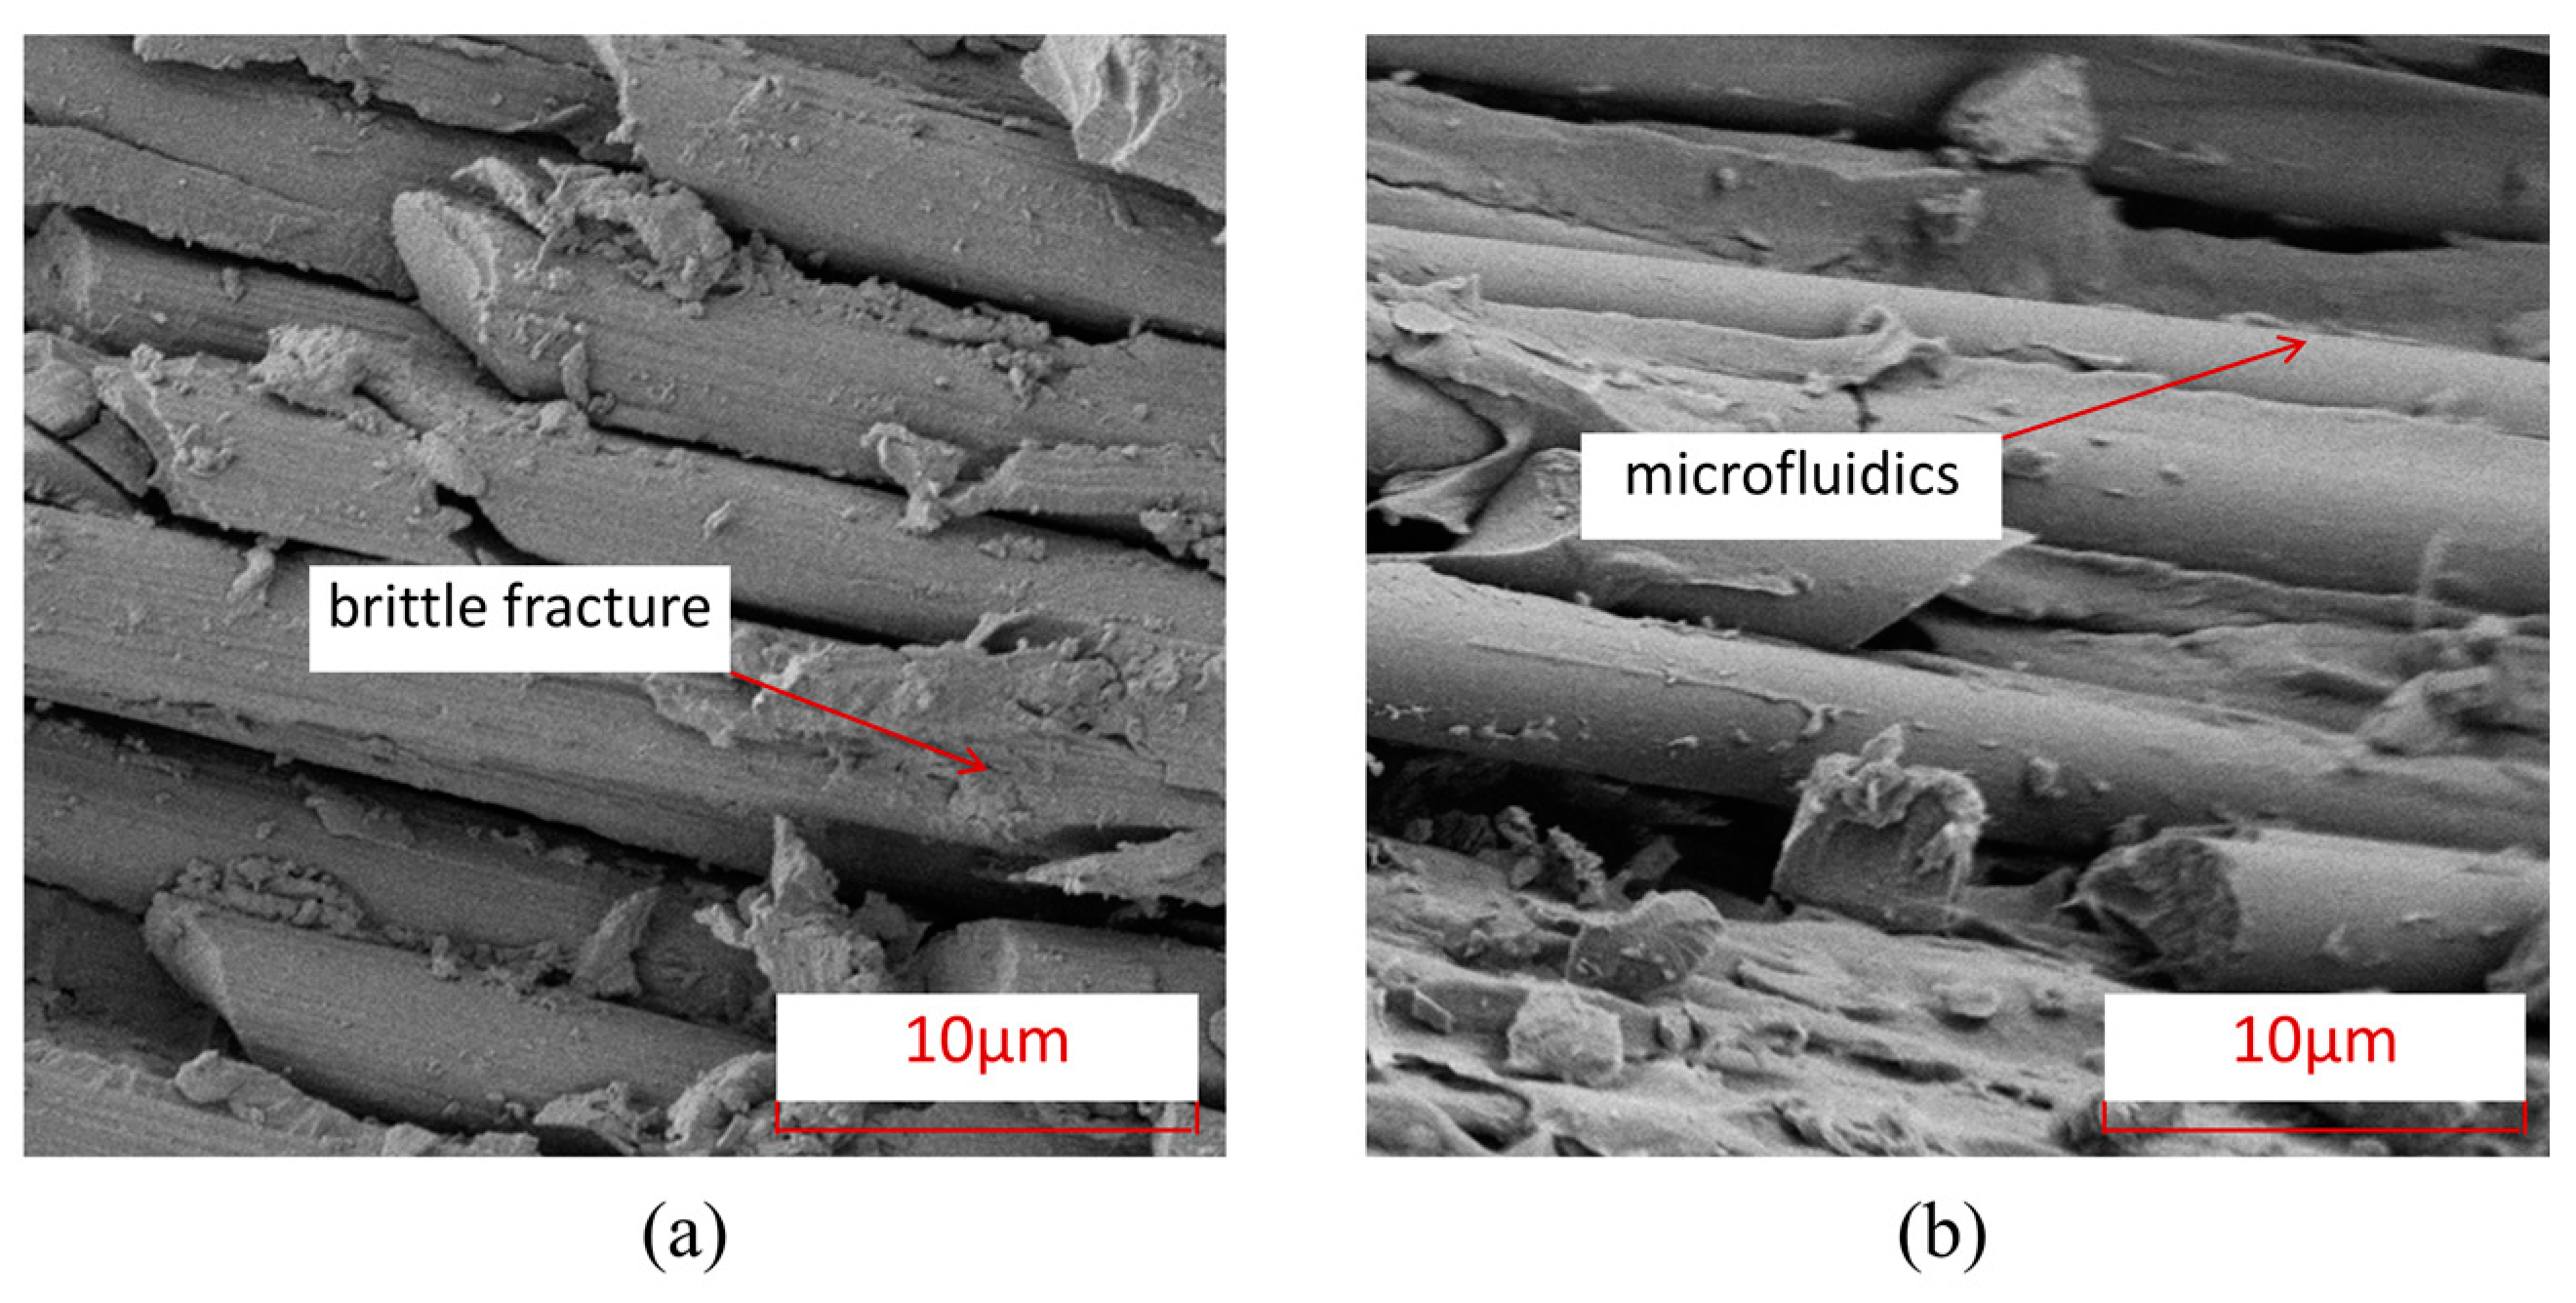
- From a microscopic perspective, the fiber–matrix interface connection of thermoplastic composite material TP is stronger than that of thermosetting composite material TS, and there is relatively little detachment of the fiber–resin interface. After compression failure, most of the fibers and matrix of thermoplastic composite material TP are still tightly connected. The thermoplastic matrix TP exhibits ductile fracture characteristics, with obvious plastic deformation forming microfluidics, while the thermosetting matrix TS exhibits obvious brittle fracture characteristics, with most of the fracture areas of the matrix showing clear edge sheet-like fractures.
Author Contributions
Funding
Institutional Review Board Statement
Data Availability Statement
Conflicts of Interest
References
- Chand, S. Review carbon fibers for composites. J. Mater. Sci. 2000, 35, 1303–1313. [Google Scholar] [CrossRef]
- Newcomb, B.A. Processing, structure, and properties of carbon fibers. Compos. Part A Appl. Sci. Manuf. 2016, 91, 262–282. [Google Scholar] [CrossRef]
- Herman, M.; Besson, J.M.; Hochard, C. Development of techniques for composite parts failure analysis in static and fatigue mode-application on thermoset and thermoplastic materials for rotorcraft main rotor hub analysis. In Proceedings of the 74th Annual Forum & Technology Display AHS International—The Vertical Flight Society, Phoenix, AZ, USA, 14–17 May 2018. [Google Scholar]
- Antifora, A.; Chiozzini, C. Clean Sky-Green Rotor Craft ITD (GRC); Agusta Westland: Samarate, Italy, 2003; pp. 25–26. [Google Scholar]
- Aoki, R.; Higuchi, R.; Yokozeki, T.; Aoki, K.; Uchiyama, S.; Ogasawara, T. Effects of ply thickness and 0°-layer ratio on failure mechanism of open-hole and filled-hole tensile tests of thin-ply composite laminates. Compos. Struct. 2022, 280, 114926. [Google Scholar] [CrossRef]
- Soutis, C.; Fleck, N.A. Failure prediction technique for compression loaded carbon fibre-epoxy laminated with open holes. J. Compos. Mater. 1991, 25, 1476–1498. [Google Scholar] [CrossRef]
- Erçin, G.; Camanho, P.; Xavier, J.; Catalanotti, G.; Mahdi, S.; Linde, P. Size effects on the tensile and compressive failure of notched composite laminates. Compos. Struct. 2013, 96, 736–744. [Google Scholar] [CrossRef]
- Saha, M.; Prabhakaran, R.; Waters, W.A. Compressive behabior of pultruded composite plates with circular holes. Compos. Struct. 2004, 65, 29–36. [Google Scholar] [CrossRef]
- Boey, Y.K.; Kwon, Y.W. Peogressive damage and failure strength of notched woven fabric composites under axial loading with varying strain rates. Compos. Struct. 2013, 96, 824–832. [Google Scholar] [CrossRef]
- Green, B.G. The Effect of Size on the Tensile Strength of Composite Laminates Containing Circular Holes. Ph.D. Dissertation, University of Bristol, Bristol, UK, 24 February 2006. [Google Scholar]
- Green, B.G.; Wisnom, M.R.; Hallett, S.R. An experimental investigation into the tensile strength scaling of notched composites. Compos. Part A Appl. Sci. Manuf. 2007, 38, 867–878. [Google Scholar] [CrossRef]
- Wisnom, M.R.; Hallett, S.R. The role of delamination in strength, failure mechanism and hole-size effect in open-hole tensile tests on quasi-isotropic laminates. Compos. Part A Appl. Sci. Manuf. 2009, 40, 335–342. [Google Scholar] [CrossRef]
- O’Higgins, R.M.; McCarthy, M.A.; McCarthy, C.T. Comparison of open hole tension characteristics of high strength glass and carbon fibre-reinforced composite materials. Compos. Sci. Technol. 2008, 68, 2770–2778. [Google Scholar] [CrossRef]
- Wang, H.; Huang, C.; Chang, F. Bearing failure of bolted composite joints. Part I: Experimental characterization. J. Compos. Mater. 1996, 30, 1284–1313. [Google Scholar] [CrossRef]
- Heimbs, S.; Schmeer, S.; Blaurock, J.; Steeger, S. Static and dynamic failure behaviour of bolted joints in carbon fibre composites. Compos. Part A Appl. Sci. Manuf. 2013, 47, 91–101. [Google Scholar] [CrossRef]
- ASTM D 6484; Standard Test Method for Open-Hole Compression Strength of Polymer Matrix Composite Laminates. ASTM: West Conshohocken, PE, USA, 2016.
- ASTM D 5766; Standard Test Method for Open-Hole Tensile Strength of Polymer Matrix Composite Laminates. ASTM: West Conshohocken, PE, USA, 2016.
- ASTM D 5961; Standard Test Method for Bearing Response of Polymer Matrix Composite Laminates. ASTM: West Conshohocken, PE, USA, 2016.
- Lin, W.P.; Hu, H.T. Nonlinear analysis of fiber-reinforced composite laminates subjected to uniaxial tensile load. J. Compos. Mater. 2002, 36, 1429–1450. [Google Scholar] [CrossRef]
- Ogihara, S.; Reifsnider, K.L. Characterization of nonlinear behavior in woven composite laminates. Appl. Compos. Mater. 2002, 9, 249–263. [Google Scholar] [CrossRef]
- Ding, S.; Tong, J.W.; Shen, M.; Huo, Y. Three-Dimensional Elastic-Plastic Analysis of the Interlaminar Stresses for the AS4/PEEK Composite Laminate with a Circular Hole. Mech. Adv. Mater. Struct. 2010, 17, 406–418. [Google Scholar] [CrossRef]
- Yang, J.-S.; Zhang, W.-M.; Yang, F.; Chen, S.-Y.; Schmidt, R.; Schröder, K.-U.; Ma, L.; Wu, L.-Z. Low velocity impact behavior of carbon fibre composite curved corrugated sandwich shells. Compos. Struct. 2020, 238, 112027. [Google Scholar] [CrossRef]
- Li, Q. CDM 3-D Numerical Model for Predicting the Strength of Notched Composite Laminates. Master’s Dissertation, Nanjing University of Aeronautics and Astronautics, Nanjing, China, 1 December 2016. [Google Scholar]
- Johnson, A.F. Modelling fabric reinforced composites under impact loads. Compos. Part A Appl. Sci. Manuf. 2001, 32, 1197–1206. [Google Scholar] [CrossRef]
- Vladimir, S.S.; Kyle, C.; Indermuehle, J.; Hurtado, A. Numerical simulation of the crushing process of a corrugated composite plate. Compos. Part A Appl. Sci. Manuf. 2011, 42, 1119–1126. [Google Scholar]
- Wang, S. Analysis of Molding Process Parameters and Typical High Temperature Mechanical Behavior of C/PPS Composites. Ph.D. Dissertation, Harbin Institute of Technology, Harbin, China, 1 June 2018. [Google Scholar]
- Chen, W. Meso-scale Modeling of Damage Development and Failure of Composite Laminates. Ph.D. Dissertation, Nanjing University of Aeronautics and Astronautics, Nanjing, China, 1 October 2018. [Google Scholar]
- Yue, W. Analysis on the Compression Property and Impact Damage Modes of CF/PPS Composite at High Temperatures. Ph.D. Dissertation, Harbin Institute of Technology, Harbin, China, 1 March 2020. [Google Scholar]
- Lu, T.; Chen, X.; Wang, H. Predicting compression-after-impact behavior of thermoplastic composite laminates by an experiment-based approach. Compos. Sci. Technol. 2021, 213, 108952. [Google Scholar] [CrossRef]
- Allen, D.H.; Harris, C.E.; Groves, S.E. A thermomechanical constitutive theory for elastic composites with distributed damage—I. Theoretical development. Int. J. Solids Struct. 1987, 23, 1301–1318. [Google Scholar] [CrossRef]
- Yang, C.; Huang, H.; Tomblin, J.S.; Sun, W. Elastic-plastic model of adhesive-bonded single-lap composite joints. J. Compos. Mater. 2004, 38, 293–309. [Google Scholar] [CrossRef]
- Han, L.; Qi, H.; Men, K.; Zhu, H.; Gong, S. Failure analysis and verification of honeycomb sandwich structure based on interface element. J. Harbin Eng. Univ. 2022, 56, 2211–2225. [Google Scholar]
- Vogler, T.J.; Kyriakides, S. Inelastic behavior of an AS4/PEEKcomposite under combined transversecompression and shear. Part I: Experiments. Int. J. Plast. 1999, 15, 783–806. [Google Scholar] [CrossRef]
- Hsu, S.-Y.; Vogler, T.J.; Kyriakides, S. Inelastic behavior of an AS4/PEEK compositeunder combined transverse compressionand shear. Part II: Modeling. Int. J. Plast. 1999, 15, 807–836. [Google Scholar] [CrossRef]
- Wei, T.B.; Falzon, G. Modelling the nonlinear behaviour and fracture process of AS4/PEKK thermoplastic composite under shear loading. Compos. Sci. Technol. 2016, 126, 60–77. [Google Scholar]
- Touchard-Lagattu, F.; Lafarie-Frenot, M.C. Damage and inelastic deformation mechanisms in notched thermoset and thermoplastic laminates. Compos. Sci. Technol. 1996, 56, 557–567. [Google Scholar] [CrossRef]


| Tension Modulus (GPa) | Ultimate Tension Strength (MPa) | Elongation (%) | Manufacturer | |
|---|---|---|---|---|
| AS4D | 231 | 4347 | 1.88 | Hexcel |
| CCF300 | 230 | 4210 | 1.78 | Toray |
| Density (MPa) | Poisson’s Ratio | Elastic Modulus (GPa) | Share Modulus (GPa) | Tensile Strength (MPa) | Compression Strength (MPa) | Shear Strength (MPa) | ||||||||||
|---|---|---|---|---|---|---|---|---|---|---|---|---|---|---|---|---|
| v | E1 | E2 | E3 | G12 | G13 | σt1 | σt2 | σt3 | σc1 | σc2 | σc3 | τ12 | τ13 | τ23 | ||
| 1580 | 0.3 | 130 | 9.3 | 9.3 | 4.1 | 3.85 | 3.85 | 1673 | 68 | 68 | 1436 | 257 | 257 | 136 | 86 | 121 |
| Density (MPa) | Poisson’s Ratio | Elastic Modulus (GPa) | Share Modulus (GPa) | Tensile Strength (MPa) | Compression Strength (MPa) | Shear Strength (MPa) | ||||||||||
|---|---|---|---|---|---|---|---|---|---|---|---|---|---|---|---|---|
| v | E1 | E2 | E3 | G12 | G13 | G23 | σt1 | σt2 | σt3 | σc1 | σc2 | σc3 | τ12 | τ13 | τ23 | |
| 1600 | 0.3 | 130 | 9.3 | 9.3 | 4.1 | 3.85 | 3.85 | 1673 | 68 | 68 | 1436 | 257 | 257 | 136 | 86 | 121 |
| Tension Modulus (MPa) | Tension Strength (MPa) | Elongation (%) | Fracture Toughness (J/mm) | |
|---|---|---|---|---|
| PEEK | 3.8 | 94 | 50 | 2000 |
| Epoxy | 3.58 | 105 | 1.9 | 420 |
| Density () | Poisson’s Ratio | Elastic Modulus () | Share Modulus () | Tensile Strength () | ||||||
|---|---|---|---|---|---|---|---|---|---|---|
| v | σt1 | σt2 | σt3 | |||||||
| 1580 | 0.3 | 130 | 9.7 | 9.7 | 5.2 | 3.94 | 3.94 | 2280 | 69 | 69 |
| Compression Strength () | Shear Strength () | Longitudinal Fracture Toughness (KJ/m2) | Transverse Fracture Toughness (KJ/m2) | |||||||
| σc1 | σc2 | σc3 | τ12 | τ13 | τ23 | |||||
| 1300 | 208 | 208 | 152 | 94 | 94 | 90 | 82 | 0.52 | 1.61 | |
| Shear Damage Coefficient | Shear Damage Factor | Initial Yield Stress | Plastic Hardening Coefficient | Coefficient | ||||||
| C | p | |||||||||
| 176 | 0.67 | 25.2 | 182.52 | 0.2553 | ||||||
| Elastic Modulus (N/mm) | Fracture Toughness (N/mm) | Strength (MPa) | ||||||
|---|---|---|---|---|---|---|---|---|
| 2.207 × 10¹⁰ | 9.047 × 10⁹ | 9.047 × 10⁹ | 0.37 | 0.82 | 0.82 | 33 | 54 | 54 |
Disclaimer/Publisher’s Note: The statements, opinions and data contained in all publications are solely those of the individual author(s) and contributor(s) and not of MDPI and/or the editor(s). MDPI and/or the editor(s) disclaim responsibility for any injury to people or property resulting from any ideas, methods, instructions or products referred to in the content. |
© 2023 by the authors. Licensee MDPI, Basel, Switzerland. This article is an open access article distributed under the terms and conditions of the Creative Commons Attribution (CC BY) license (https://creativecommons.org/licenses/by/4.0/).
Share and Cite
Han, L.; Song, Y.; Qi, H.; Yang, J.-S.; Li, S.; Liu, P.-A. A Comparative Study on the Mechanical Properties of Open-Hole Carbon Fiber-Reinforced Thermoplastic and Thermosetting Composite Materials. Polymers 2023, 15, 4468. https://doi.org/10.3390/polym15224468
Han L, Song Y, Qi H, Yang J-S, Li S, Liu P-A. A Comparative Study on the Mechanical Properties of Open-Hole Carbon Fiber-Reinforced Thermoplastic and Thermosetting Composite Materials. Polymers. 2023; 15(22):4468. https://doi.org/10.3390/polym15224468
Chicago/Turabian StyleHan, Liu, Yao Song, Hui Qi, Jin-Shui Yang, Shuang Li, and Ping-An Liu. 2023. "A Comparative Study on the Mechanical Properties of Open-Hole Carbon Fiber-Reinforced Thermoplastic and Thermosetting Composite Materials" Polymers 15, no. 22: 4468. https://doi.org/10.3390/polym15224468