Estimating Soil Penetration Resistance of Paddy Soils in the Plastic State Using Physical Properties


Department of Biosystems Engineering, Zhejiang University, Hangzhou 310058, China
*
Author to whom correspondence should be addressed.
Agronomy 2020, 10(12), 1914; https://doi.org/10.3390/agronomy10121914
Submission received: 26 October 2020
/
Revised: 30 November 2020
/
Accepted: 30 November 2020
/
Published: 4 December 2020
Abstract
:Soil penetration resistance (SPR) is an important indicator for soil strength which not only affects the growth of crop roots and crop yield but also is crucial in the design and selection of agricultural machinery. The determination of SPR in the laboratory is complex and time-consuming, while measuring SPR on-site shows high uncertainty at different times and locations due to soil heterogeneity. Therefore, this paper investigated the impact of soil parameters on SPR for paddy soils in the plastic state and then established a simple regression model to predict SPR using easy-to-obtain soil physical properties, including clay content, water content and density. Using the combined approaches of central composition rotatable design (CCRD) with response surface methodology (RSM), SPR of 20 soil samples from five paddy fields were measured in the laboratory. The results from the experiments showed that the contribution rate of each single factor to SPR from high to low was soil density, clay content and water content. Statistical analysis for the established equation suggested that the p-value for goodness of fit was significant (p < 0.001) and the p-value for lack of fit was insignificant (p > 0.05); meanwhile, the coefficient of determination (R2) was 0.95, indicating that the model was effective in predicting the SPR. Subsequently, the performance of the regression model was validated by comparing the estimated SPR with in situ field measurements, which showed high accuracy, with percent errors within 10%. Our study successfully proposed a method to estimate SPR using easy-to-measure soil properties that could be obtained from sensors in the soil or field investigations, including soil clay content, water content and wet bulk density.
1. Introduction
Soil compaction resulting from the application of heavy agricultural machinery in intensive agricultural production systems, e.g., field cultivation, fertilization and harvests, has been recognized as being associated with soil degradation and changes in soil mechanical properties [1]. The determination of soil compaction is not only crucial for farmers to assess the necessity of tillage practices but also inevitable for the design and selection of agricultural machinery in different fields for agronomic management practices [2,3].
Soil penetration resistance (SPR) has been regarded as an important indicator to evaluate the degree of soil compaction [4,5], which was found to restrict water uptake by crops [6], affect root proliferation and reduce the growth of crop roots, thereby leading to a reduction in crop yield [7,8]. Souza et al. (2021) stated that high SPR along with large bulk density after the use of heavy agricultural machinery on soil restricted the growth of crop root systems and water availability in deeper soil layers [9]. SPR varied markedly with time and was closely related to changes in soil physical properties [10], such as bulk density [11,12,13], soil water content [13,14,15], soil texture [16,17], soil organic carbon [18], matric potential and degree of saturation [19], etc. Agricultural management practices affect SPR by the disturbance of soil and alteration of soil physical properties. For example, the SPR of paddy soils was found to decrease significantly after puddling due to the reduction of bulk density [11,12]. An increase in tillage intensity contributes to a reduction in SPR by changing the soil bulk density [20], and the installation of subsurface drainage was found to affect soil properties as well as SPR [21]. He et al. (2016) found that SPR was affected by the tine geometry, thickness and penetration depth for sandy loam soil [22].
Although it is common practice to determine the SPR in the laboratory, it is usually expensive and time-consuming, and many researchers have questioned the accuracy of lab measurement for the determination of field parameters due to the differences in loadings [23,24,25]. The measurement of SPR in the field is possible; however, it leads to much uncertainty because the reading of SPR is greatly affected by soil physical properties, which may vary significantly spatially and temporally at different points of one field [26]. Moreover, these approaches are costly due to the need for field samplings and laboratory analyses. Therefore, efforts have been made to use indirect approaches to predict SPR using readily available and costless soil properties for various soil types [9]. Numerous researchers have established different mathematical models to determine SPR using soil physical properties such as moisture content, bulk density, soil texture and organic carbon [27,28,29]. Dexter et al. (2007) presented an exponential equation for the prediction of SPR by an index of soil physical quality and contribution of the pore water to soil strength [17], which showed better performance in predicting SPR than Canarache (1990) and the To and Kay (2005) models [28,29]. However, the model of Dexter et al. (2007) was very complicated, involving the measurement of many soil properties (e.g., bulk density, clay content and several water retention characteristics) [17]. Recently, Zhang et al. (2020) used a mathematical model to estimate SPR from water content, bulk density and shear wave velocity [30]. Whereas the model showed good accuracy (R2 = 0.96), the SPR was measured using a small cone penetrometer in a universal test machine laboratory and the model was not validated using data from the in situ measurements, which are necessary to verify the model performance. Gao et al. (2016) proposed a simple model to predict SPR as a function of density, drying and depth in the field on a clay loam soil [31]. However, their model was established using measured data from one soil type and its application on other soil types was not known.
Most of the reported quantitative models have only been established for upland soils with a few certain soil types, and no studies have been conducted on the determination of SPR for the muddy and wet paddy soils, especially those which are in the plastic state. The measurement of some simple soil physical properties, including soil gravimetric water content, clay content and soil wet bulk density, is less complicated, as these data could be easily obtained from soil buried sensors, literature or field investigations. Therefore, the objective of the current study was to propose a simple model to quickly estimate SPR using the soil physical properties that are easy to obtain for paddy soils with high moisture content that are in the plastic state.
2. Materials and Methods
2.1. Sample Preparation
2.1.1. Sample Collection
The experimental area was located in the Yangtze Delta Plain in eastern coastal China, which has been a traditional rice-growing region for over 7000 years, with a large area of paddy fields, covering 11.5% of the total rice planting area in China [32]. The soil samples were taken from five counties in this study region and the soil physical properties for the five soil samples are shown in Table 1. The soil texture of these samples was classified using the standard of the American Society for Testing and Materials, D2487-11 [33], including silty clay, loam, silty clay loam and silty loam, covering most of the typical soil texture types in this region. The soil liquid limit, solid limit, as well as the plasticity index were determined according to the standard test methods of the American Society for Testing and Materials [34]. The initial soil water contents for the five soil samples were all higher than the plastic limit and lower than the liquid limit, as shown in Table 1, indicating that the collected soils were in the plastic state.
2.1.2. Central Composition Rotatable Design
To study the impact of clay content, soil water content and density on SPR, the central composite rotatable design (CCRD) was proposed to schedule the experiments [35]. As shown in Table 2, the soil samples were classified into five levels based on the CCRD, contributing a total number of 20 remolded soil subsamples with different amounts of clay content, gravimetric water content and density (Table 3). The soil subsamples encompassed a wide range of soil physical parameters, which were representative of most soils found in the paddy fields of the Yangtze Delta Plain. The gravimetric water content for all was set between 30% and 50%, suggesting that the remolded soils were still in the plastic state.
2.1.3. Soil Sample Preparation
As the soil clay content was fixed for all soil samples (22.3%, 26.1%, 30.8%, 36.0% and 40.6%; see Table 2), the 20 subsamples with different levels of clay content and density were remolded in the laboratory. The calculated amount of water was added to the soil samples to obtain subsamples with different amounts of gravimetric water content (30%, 34%, 40%, 46% and 50%). After complete mixture with the water, the soil subsamples were finally remolded according to following the equation:
where m is the mass of soil added to the soil container (g); h is the height of soil in the container for the soil samples (m); is the target density (g cm−3); S is the bottom area of the soil container (m2). All soil samples were sealed in plastic bags for 24 h before the SPR tests.
2.2. Soil Penetration Resistance Tests in the Laboratory
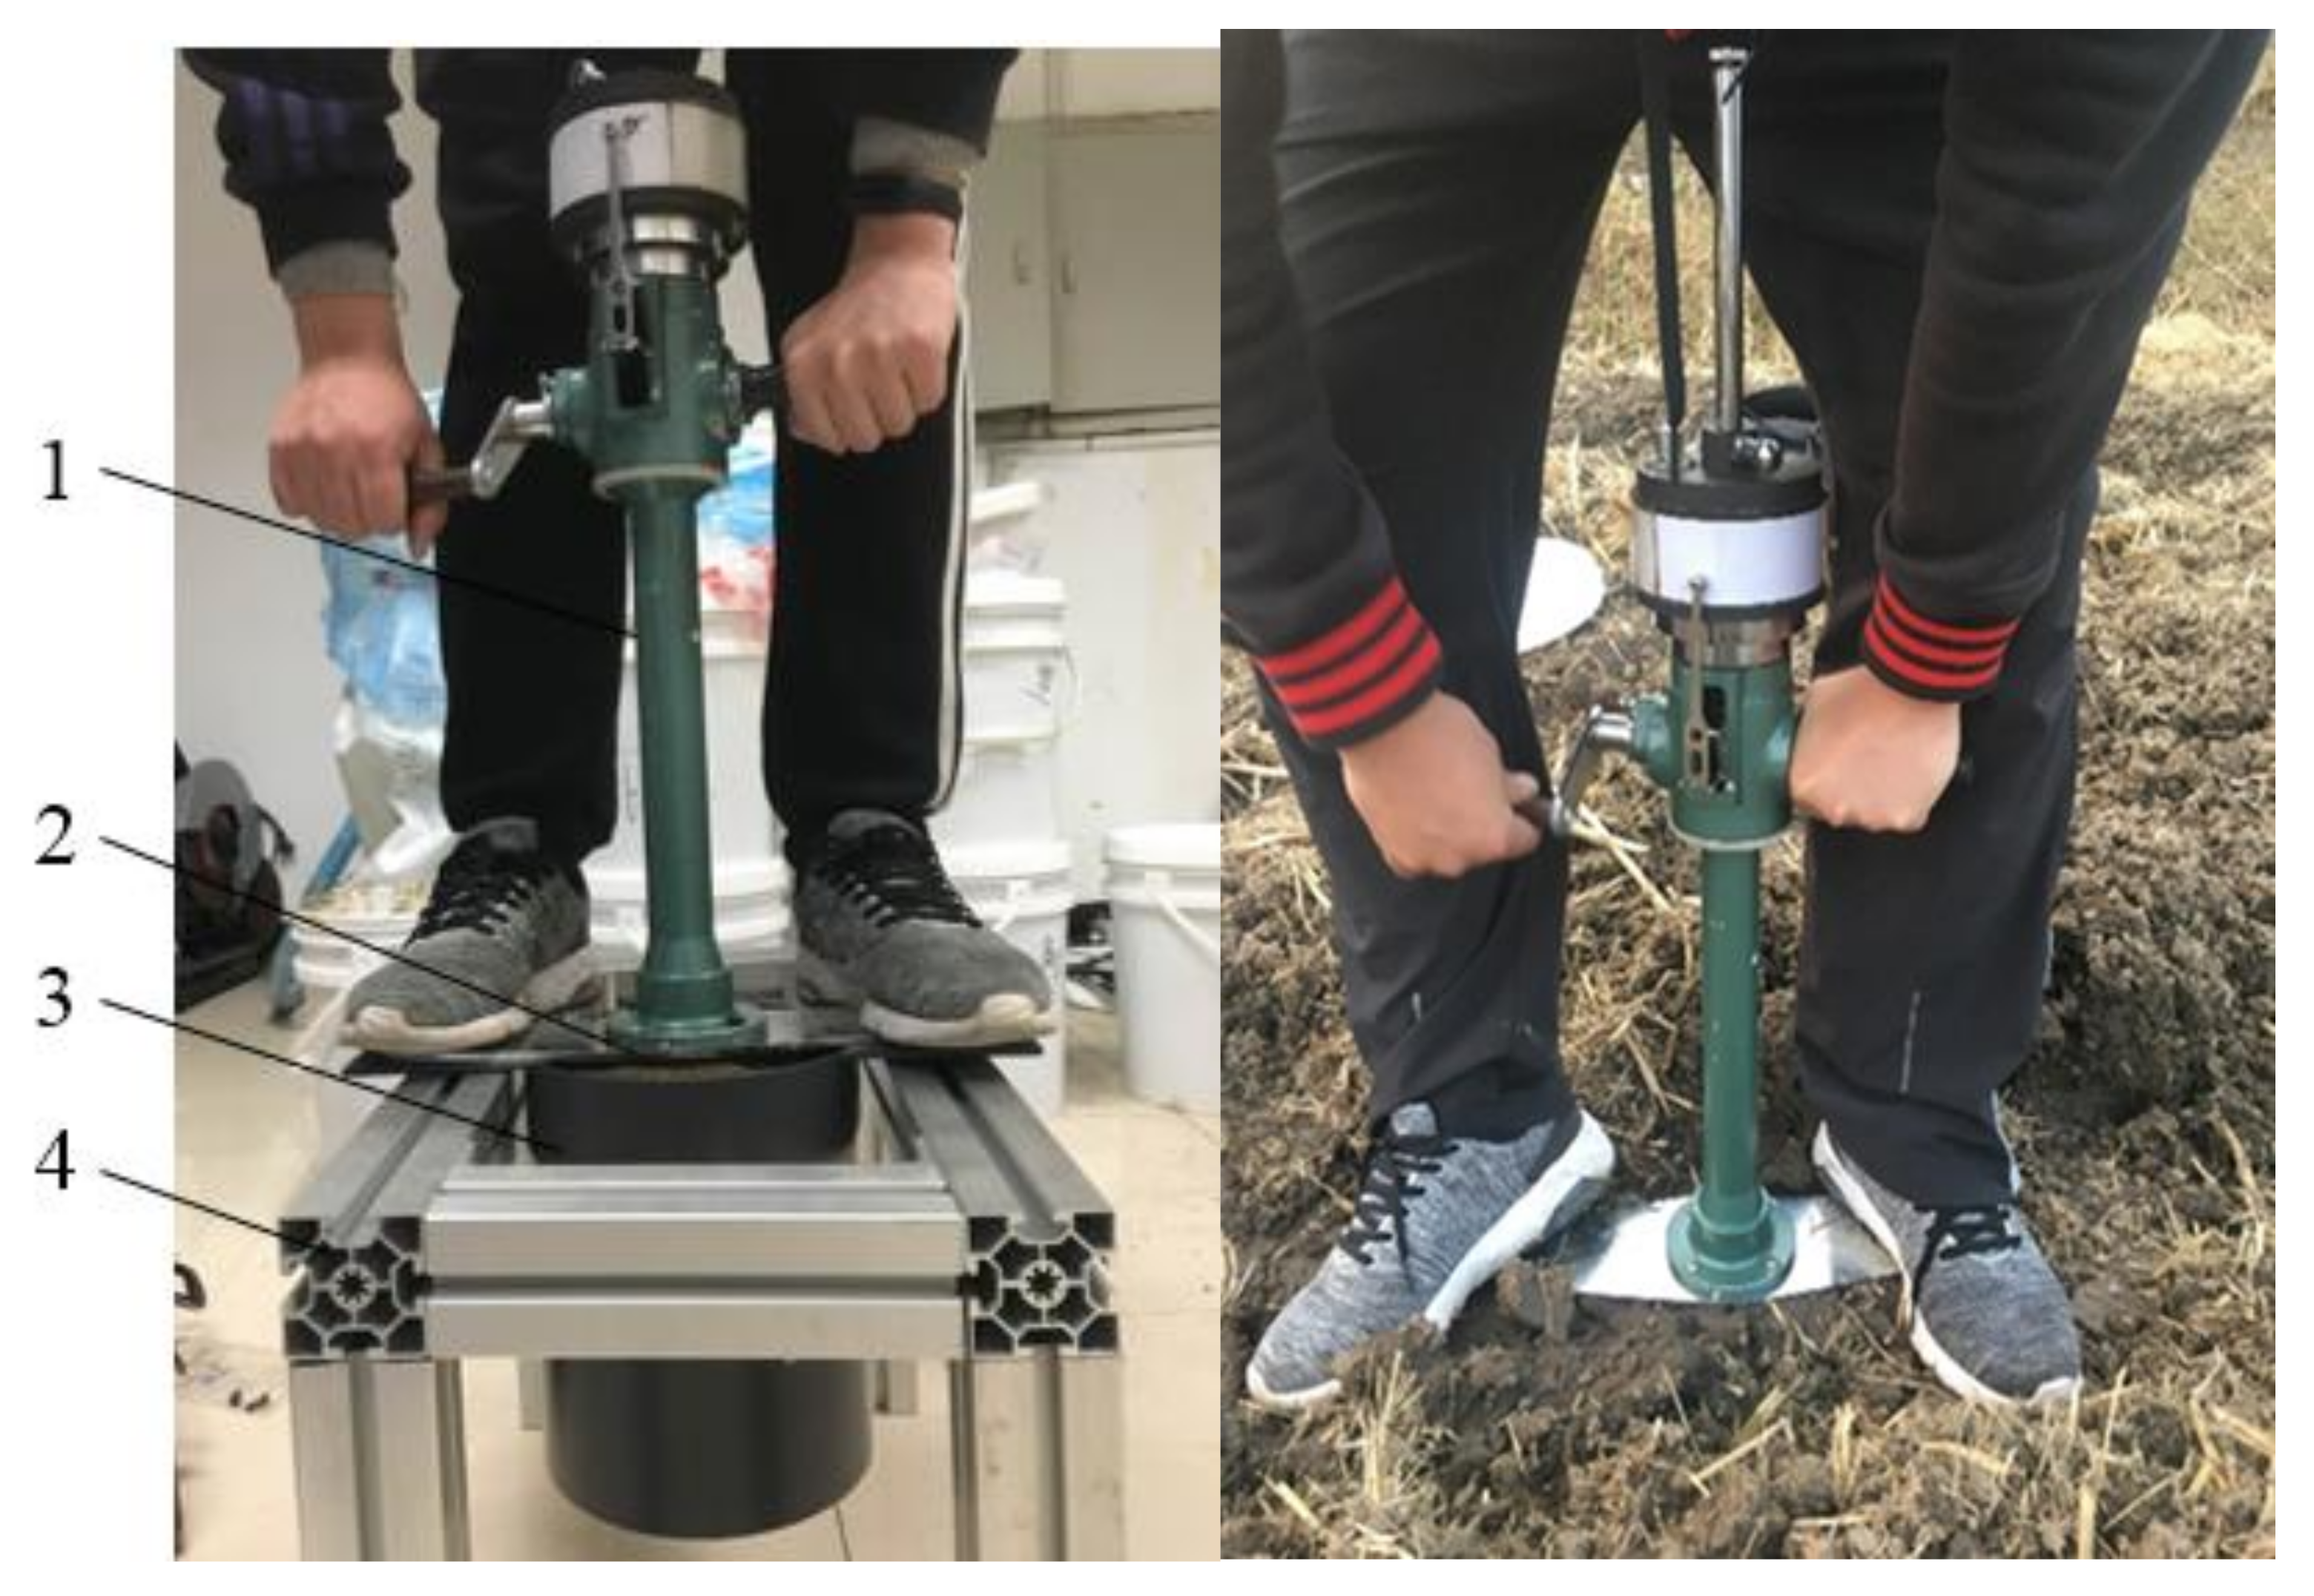
The TE-3 soil penetrometer (Nanjing Soil Instrument Factory Co., Ltd, Nanjing, China.) with a measuring distance of 0.2 m was used to measure the SPR. As shown in Figure 1, the soil penetrometer consisted of a measuring head, a measuring rod, a pedal, a handle, a screw rod, a recording pen, a recording tape and a bolt. The height and diameter of the soil container were 0.25 and 0.2 m, respectively. The container with remolded soil samples inside was placed on the self-made aluminum alloy base (Figure 1). The experiments were conducted following these five steps:
- Step 1.
- The measuring rod was raised until the zero mark of the screw rod was horizontal with the top of the recording disk;
- Step 2.
- The soil penetrometer was placed vertically in the container, and the handle was fixed with one hand while the manual handle was slowly rotated with the other hand at a constant speed to start the measurement;
- Step 3.
- The measuring rod was pressed down and the cone probe was wedged into the soil driven by the bevel gear; then, the internal spring was pressed and deformed with data recordings on the paper tape. The ratio between the real soil penetration depth and the value on the recording tape was 2:1;
- Step 4.
- When the screw on the screw rod collided with the recording disk, the recording pen (separated from the recording paper) was lowered down and the soil penetrometer was pulled out, after which one measurement was completed. Every soil sample was evenly distributed into three subsamples; thus, the measurement was repeated three times for every soil sample.
- Step 5.
- Repeat steps 1 to 4 for all the 20 subsamples. After the measurement, the soil samples were immediately taken in soil cores and stored in sealed bags for initial water content and density measurements.
2.3. Data Processing and Analysis
2.3.1. Model Establishment
The SPR was expressed by a quadratic polynomial regression using soil clay content (X1), gravimetric water content (X2) and density (X3) as follows:
where Y is the response value; X1, X2 and X3 are the coded values of each index; and are the coefficients of the terms in the regression equation.
The results from lab experiments for 20 soil samples were processed and analyzed using the software Design-Expert. The analysis of variance (ANOVA) test was conducted to assess the significance (p ≤ 0.05 level) of all the coefficients in each equation, and the coefficients that were not significant were excluded from the equation. Meanwhile, p-values from both goodness of fit and lack of fit tests were determined, and the determination coefficient (R2) was computed for the regression model for the prediction of SPR.
2.3.2. Response Surface Methodology (RSM)
The response surface methodology (RSM) was used to analyze the results from the quadratic polynomial regression. The RSM is both a statistical and a mathematical technique that has been widely used for process optimization. It allows the explanation of the combined effect of several factors on a response value and it is commonly used with CCRD for second-order response surface models [36]. In the current study, the response surface graph is a 3-D surface graph of SPR responses to soil clay content, gravimetric water content and soil wet bulk density. Then, the 2-D contour plots were projected to provide better analysis of the interactive effect of two factors on the SPR.
2.4. Computation of the SPR
The average SPR (kPa) of each soil sample was determined using the following strategy. As shown in Figure 2, the curve on the recording paper represented the relationship between the deformation of spring and penetration depth at different soil depths. The Y-axis represented the deformation of the spring (x, cm), and the X-axis represented the depth of penetration (h, cm). Subsequently, the average deformation of spring and SPR was computed as follows:
where is the average deformation of the spring (cm); S is the surrounded area of the curves (cm2); h is the depth of the measurement (cm); P is the average SPR (kPa); l is the maximum spring deformation (cm); A is the bottom area of the penetrometer; k is the measuring distance of the spring (kN).
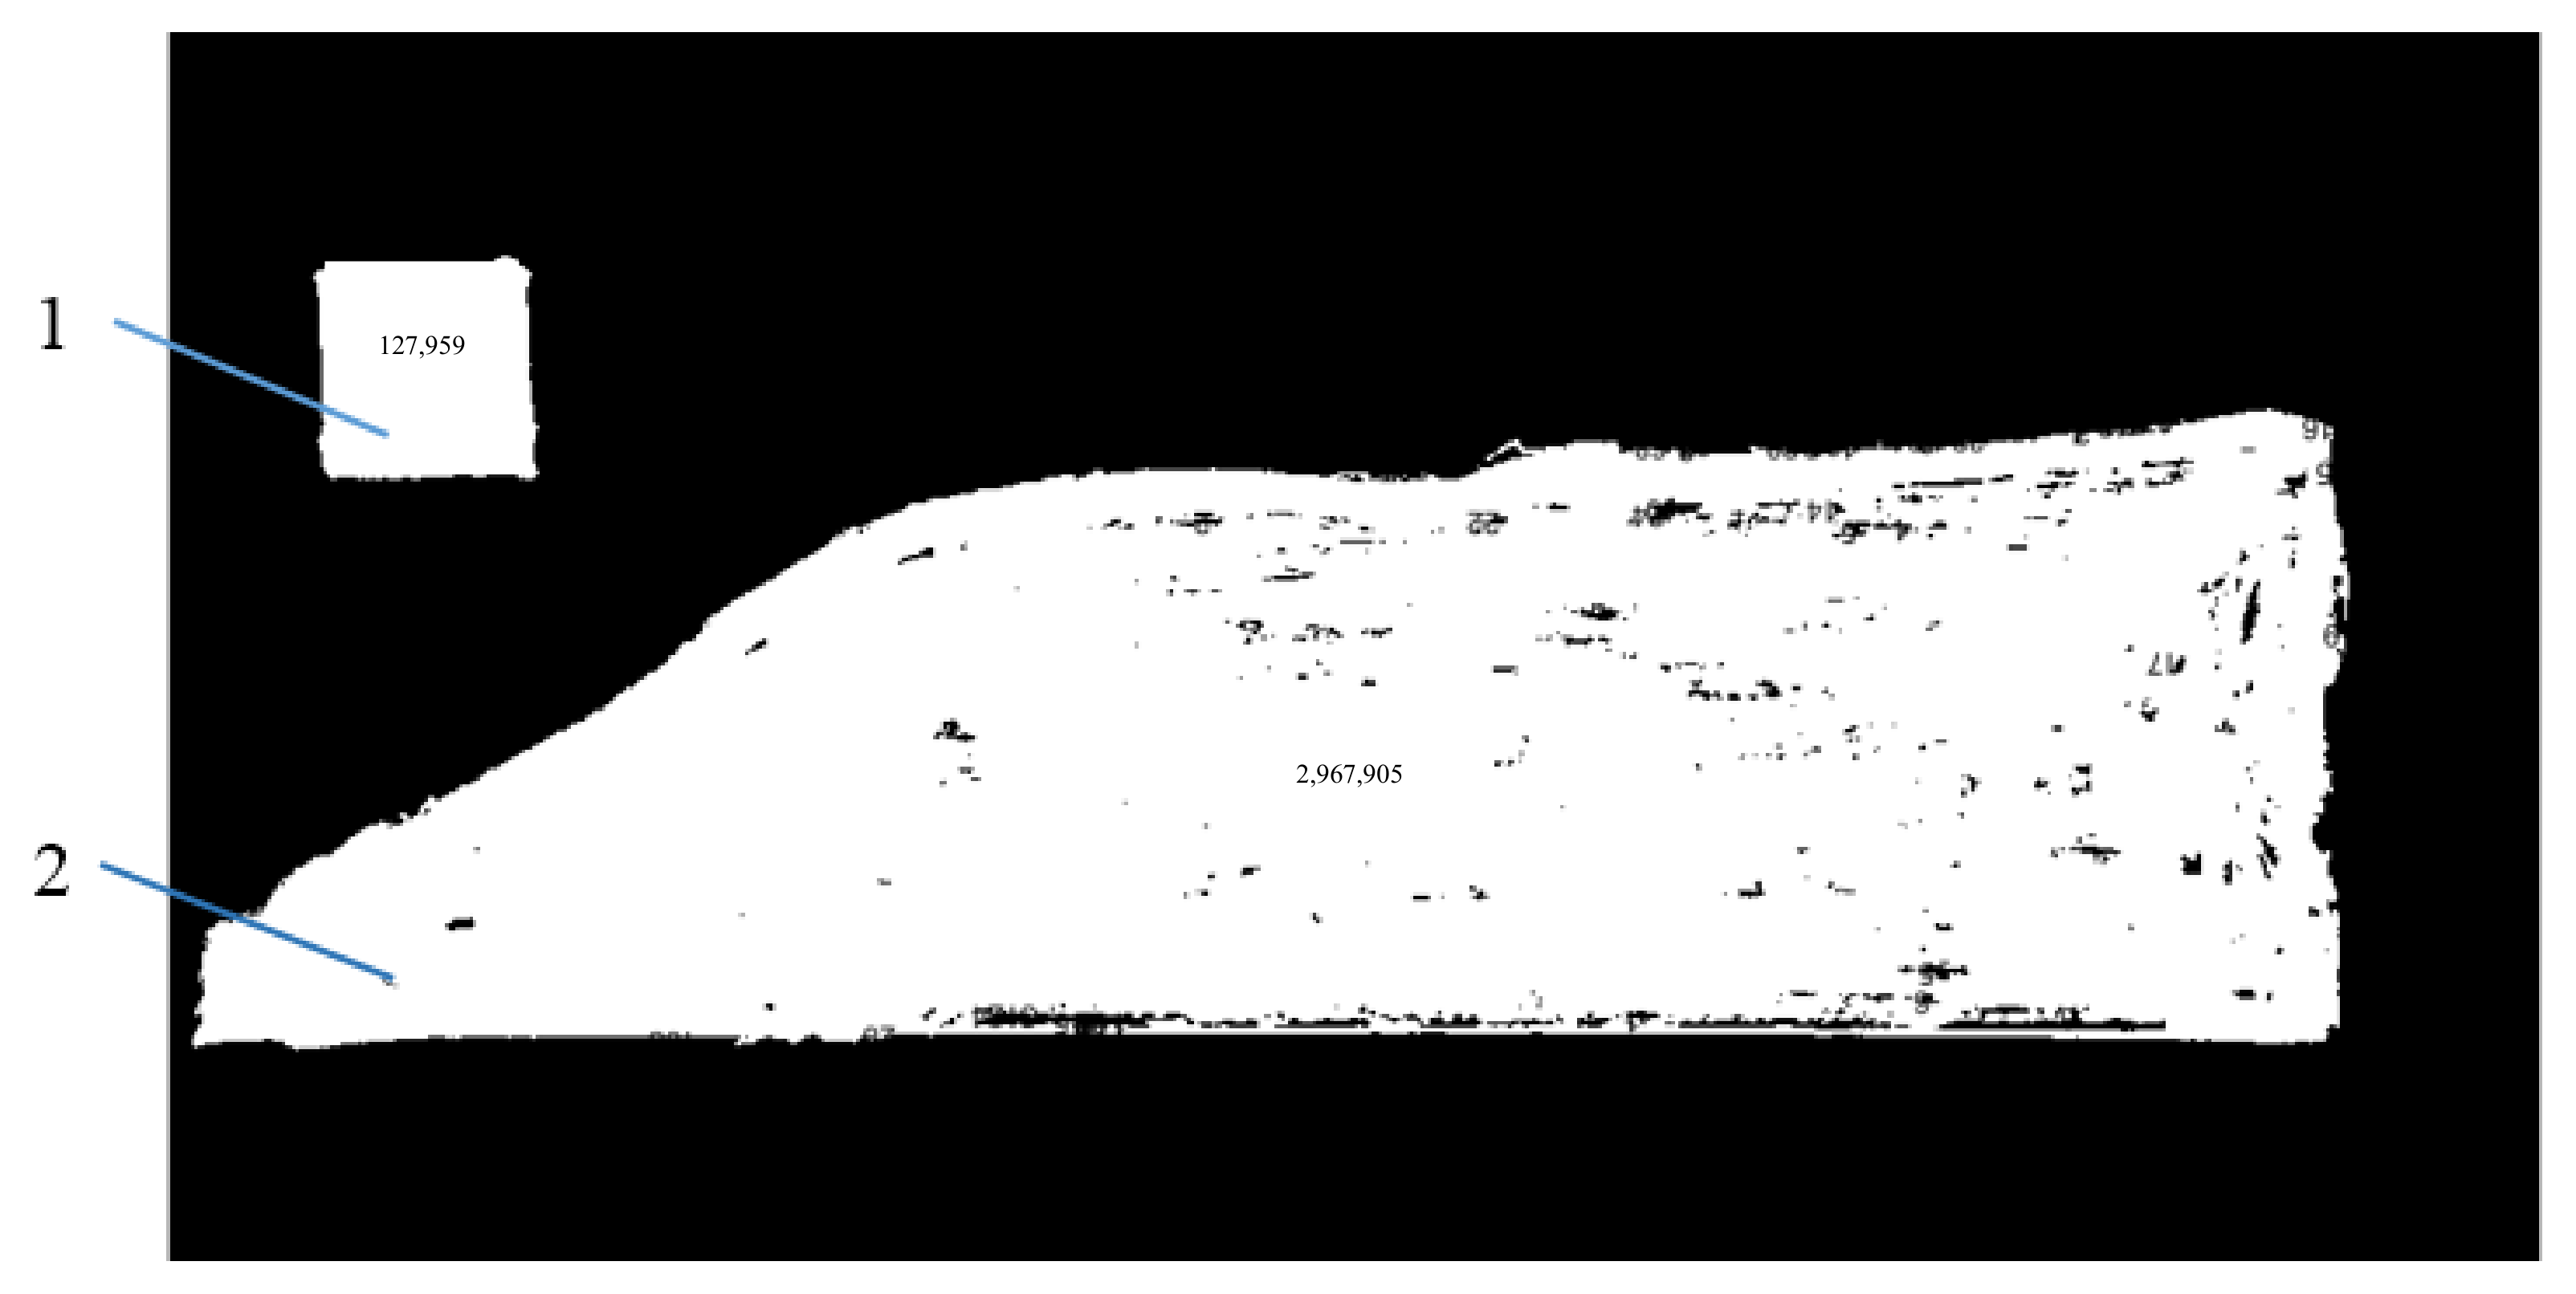
The surrounded area of the curve for each measurement was solved using MATLAB (MathWorks Inc., Natick, MA, USA), before which the closed area outside the curve was blackened, scanned and saved (Figure 3). As shown in Figure 3, a closed square of 1 × 1 cm was drawn on the paper as a reference area, while the closed area 2 was the area to be calculated in Equation (3). The pixels of both areas were computed by MATLAB; therefore, the area of closed area 2 was solved using the proportions between the pixels of the two areas. Finally, the average SPR of each soil sample was obtained through Equation (4).
2.5. Verification for Model Accuracy
As the paddy soils were taken from the fields to the laboratory and the SPR was measured indoors, it was necessary to verify the performance of the established mathematical model in estimating SPR by comparison with in situ measurements on different soils. Therefore, in situ SPR was measured with the soil penetrometer at depth from 0 to 20 cm from the same five paddy fields and an additional field following similar steps to those introduced in Section 2.4 (Figure 1). Subsequently, the in situ measured SPR was compared with the model estimations from soil physical properties using statistical methods of percent bias and coefficient of determination.
3. Results and Discussion
3.1. Experimental Results
The results from experimental tests are shown in Table 3, based on which the statistical analysis was conducted using Design-Expert (Table 4).
The coefficients of all terms in the quadratic polynomial regression equations are shown in Table 4, in which were extremely sensitive (p < 0.005 level), and was sensitive (p < 0.05 level) to the response value of SPR according to the ANOVA test. The remaining coefficients were all insignificant and thus were excluded from the model. Therefore, the quadratic polynomial regression equation for SPR was established as follows:
The p-value from the goodness of fit test was highly significant at p < 0.0001 level and the p-value from the lack of fit test was insignificant at level. The root mean square deviation was 20.4 kPa and the coefficient of determination (R2) for the model was 0.95, indicating high accuracy of the established regression equation for estimating the SPR using soil physical properties.
3.2. Impact of Single Factors on SPR
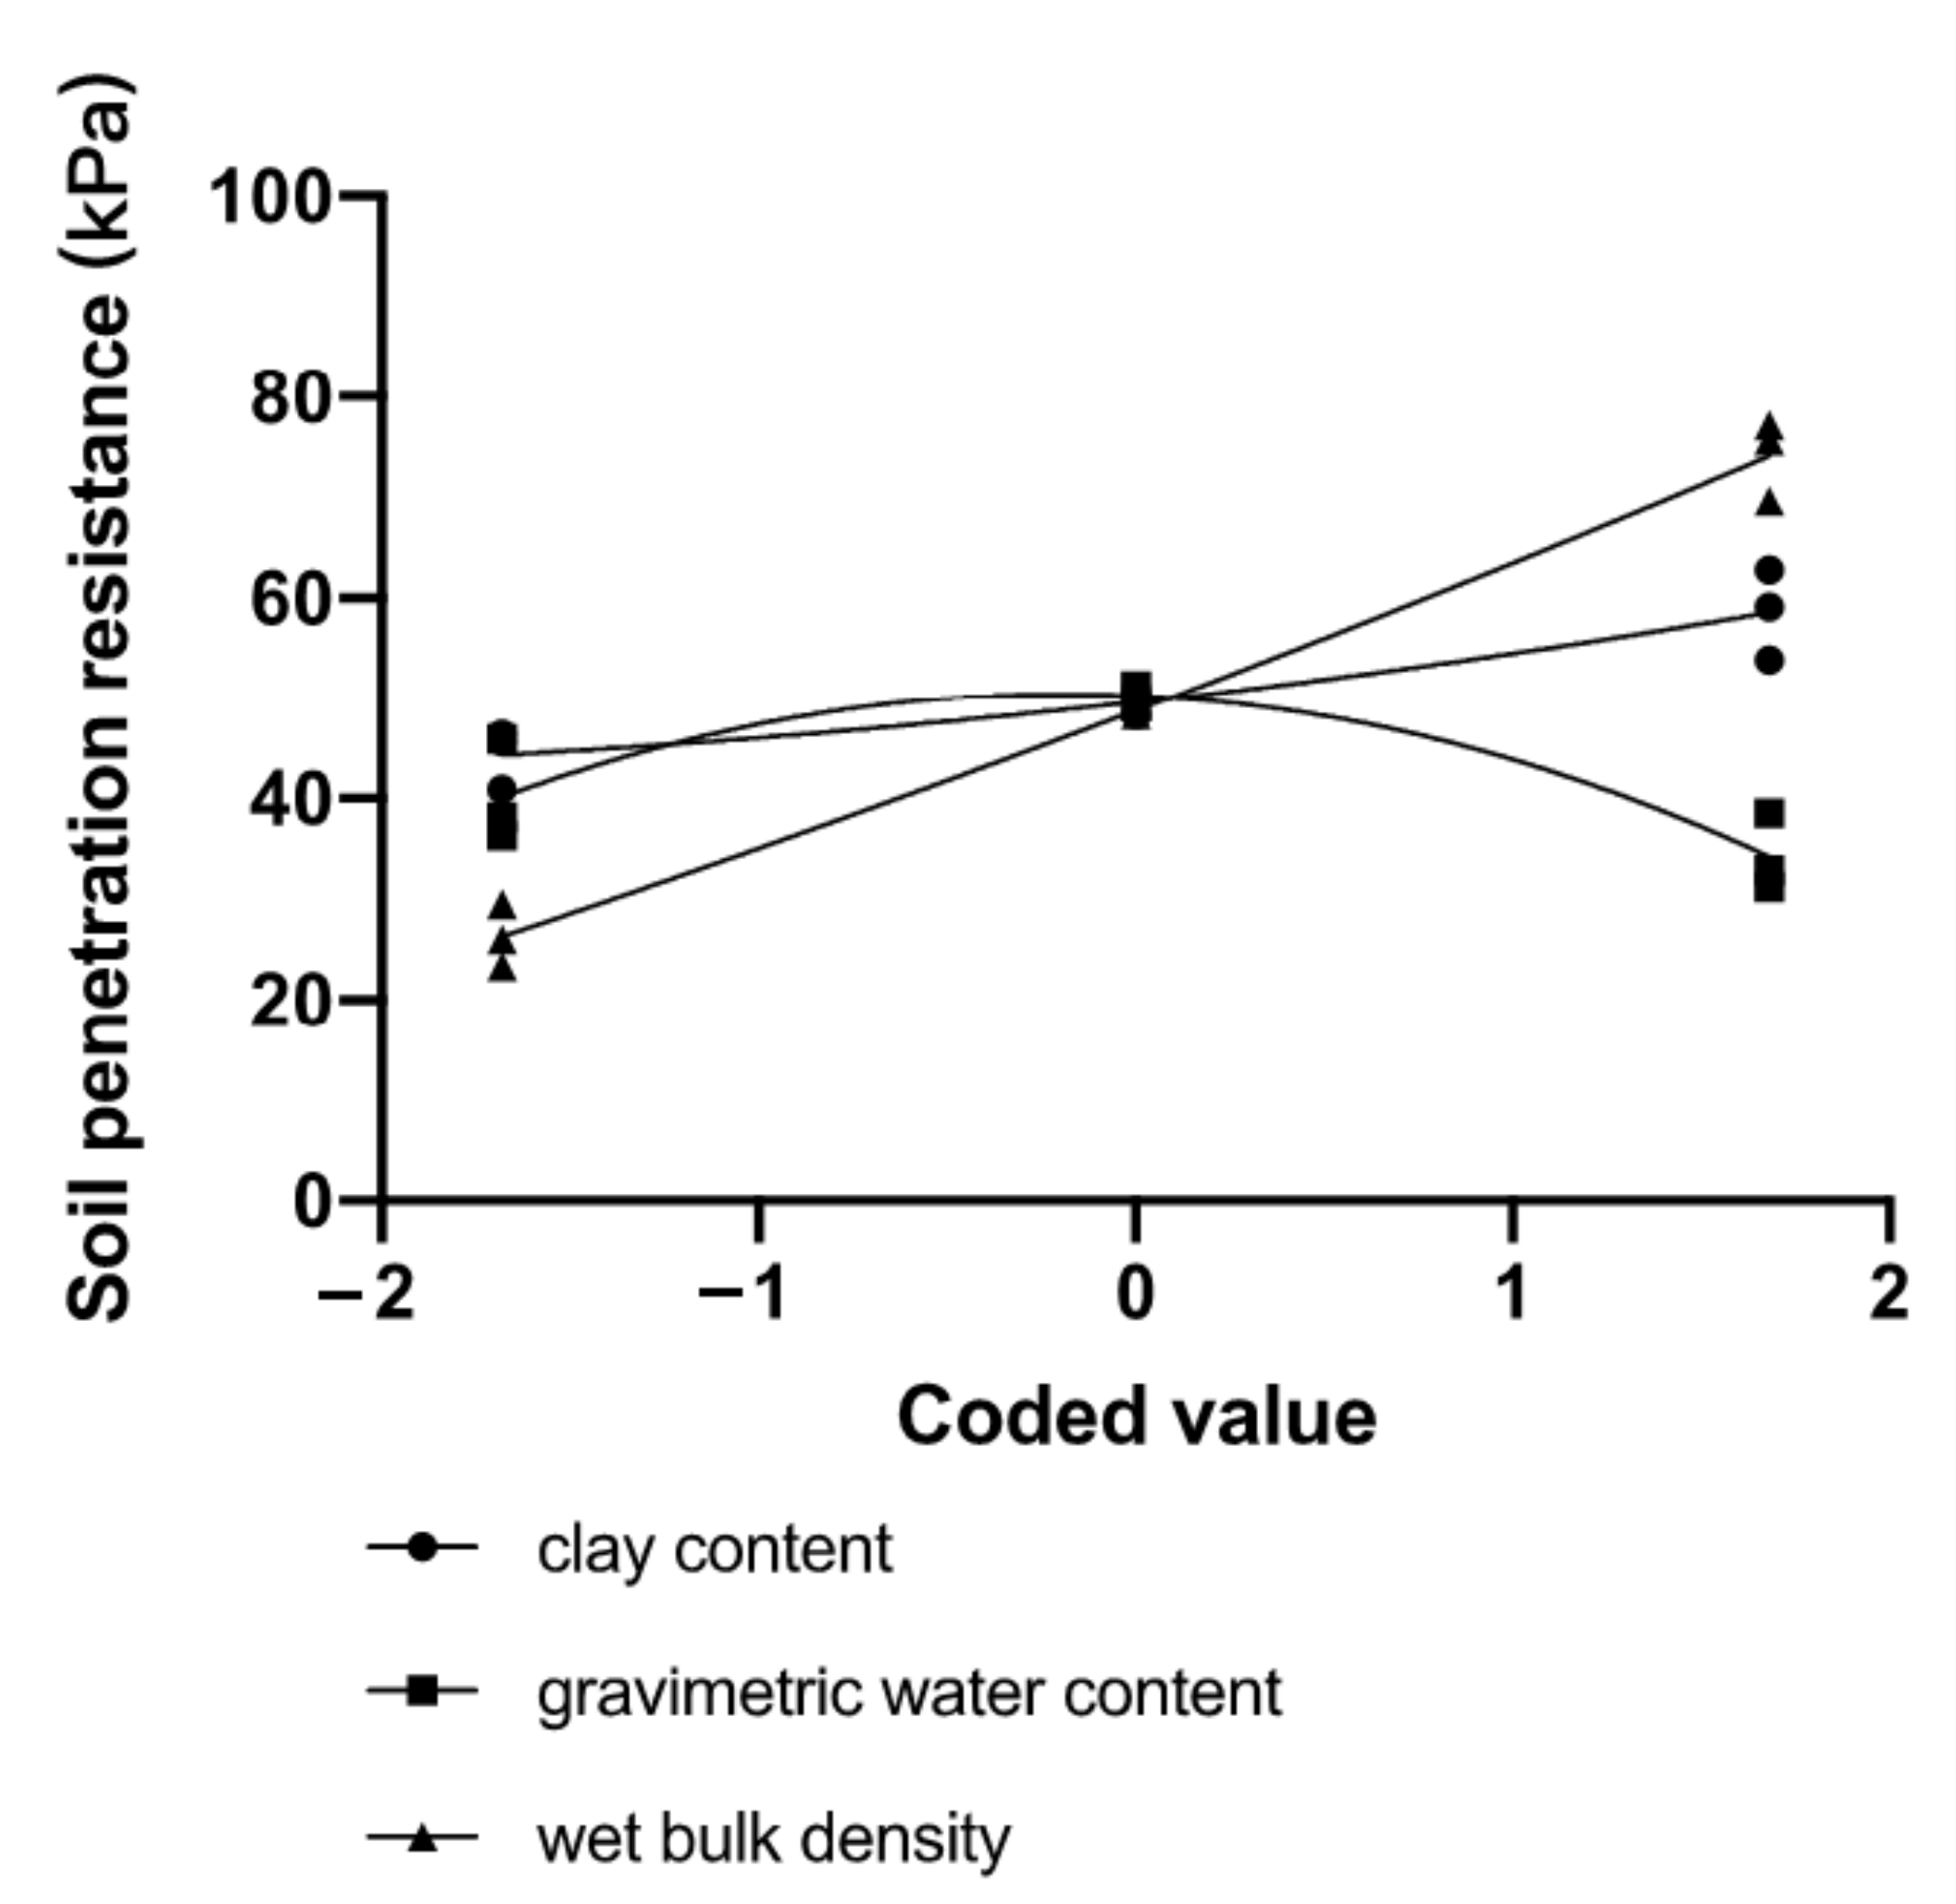
The impact of each factor on SPR was assessed by reducing the dimensionality of the prediction models, during which one factor was assessed while the others were fixed at zero levels in the regression equation. Subsequently, the curves of response values for SPR as affected by each single factor are shown in Figure 4.
As shown in Table 4 and Figure 4, the soil wet bulk density was the primary factor that was positively and linearly associated with SPR. When soil wet bulk density changed from 1.8 to 2.8 g cm−3, the SPR increased accordingly from 23.9 to 77.3 kPa. Our results are in line with many published works that suggested positive relationships between soil density and SPR for different soil types. For example, Ayers and Perumpral (1982) showed direct and consistent relationships between soil bulk density and core index, which was a measure of the SPR, for five different soil types with the soil water content below 20% [37]. They indicated that when the soil water content was below 6.7%, SPR increased exponentially with dry density, while it tended to increase linearly with density when the soil water content was between 8.8% and 11.8%. A similar finding has been reported by Vaz et al. (2001), who showed that SPR increased with bulk density (1.2–1.6 g cm−3) at the same soil water content (15–30%), and its impact on SPR decreased with higher water content [13].
Similar to soil density, SPR was also positively associated with soil clay content. The impact of clay content on SPR is comparable to previous studies on upland soils. Elbanna and Witney (1987) plotted three curves to describe the relationship between SPR and clay ratio when the moisture content was 20%, 30% and 40%, indicating that SPR increased linearly with clay ratio for soils with different clay contents (from loamy sand to heavy clay soil) [38]. Hummel et al. (2004) used the clay fraction of soil as a major variable for predicting SPR, suggesting that clay content was a significant parameter in predicting SPR for three soil types (Drummer silty clay loam, Plainfield sandy loam and Shoals silt loam) with soil water content below 25% [39].
By contrast, the slope of soil water content and SPR curve was lowest among the three curves, indicating that soil water content has the least impact on SPR as compared with soil density and clay content. As illustrated by Figure 4, SPR was negatively associated with soil water content, which decreased from 78.3 to 28.2 kPa when soil water content increased from 30% to 50% (coded value from −1.682 to 1.682). The reduction in SPR with the increase in soil water content is attributed to the more plastic state of soil through lubrication by water, as well as the rearrangement of soil particles [9]. Many have reported strong correlations between SPR and soil water—for example, the SPR characteristic curve that describes a positive correlation between soil SPR and matric suction [40,41]. Vaz et al. (2001) found that SPR increases exponentially with decreasing water content (15–30%) [13], which was in line with Upadhyaya et al. (1982) [27].
It should be noted that some researchers have pointed out that soil bulk density was a less significant driver of SPR than soil water content and clay content [39]. However, our study indicated that soil density was the primary contributor to SPR, because in the current study, we used soil wet density, which is easier to measure, while the other studies used dry soil bulk density. Therefore, the soil wet bulk density in the current study contributed to the combined effects from both dry bulk density and moisture.
3.3. Analysis of Interactive Factors
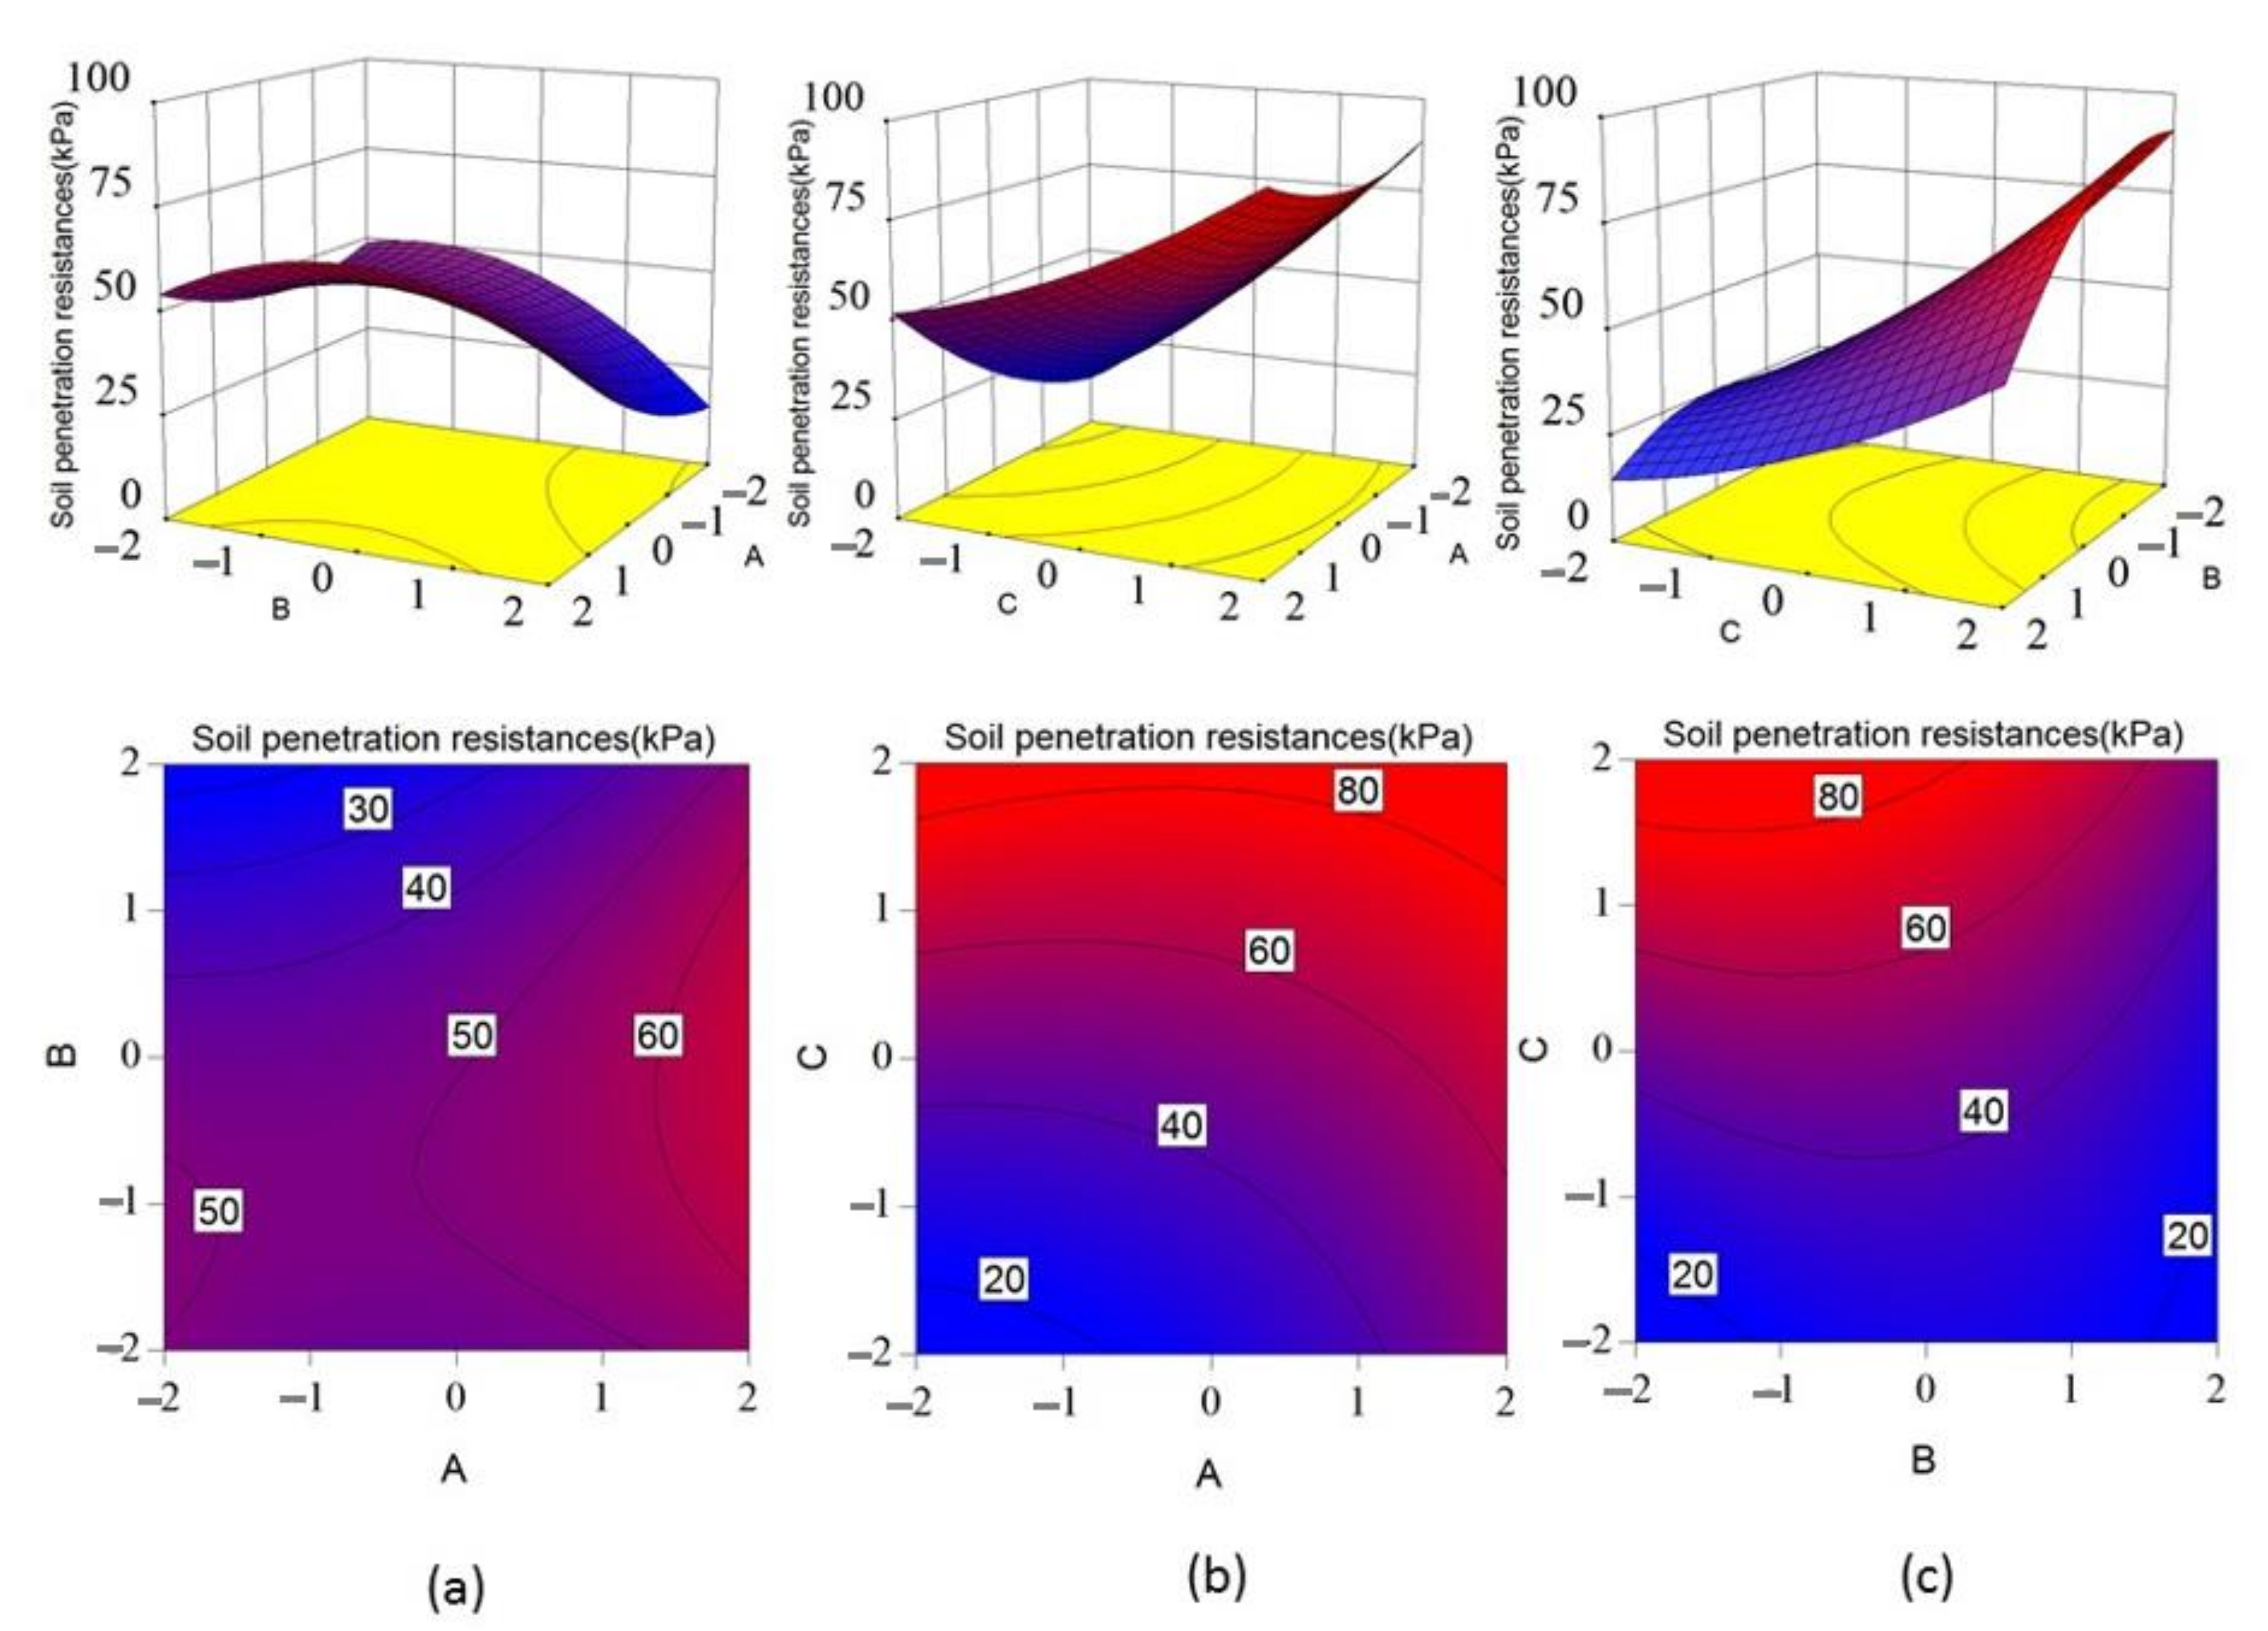
In order to gain a better understanding of the results, the predicted models are presented in Figure 5 as 3-D response surface plots and 2-D contour maps.
Keeping one factor among clay content, gravimetric water content and wet bulk density as constant, the interactive impact of other two factors on SPR was analyzed using RSM (Figure 5).
Figure 5a illustrated that when soil density was 2.3 g cm−3, SPR was positively associated with clay content, and the maximum value was reached when the coded value of clay content was within 1–1.682 (clay content between 36% and 40%). With the increase in water content, SPR increased first and reached the maximum value when the soil water content was between −1.682 and −1 (30–40%); then, it showed a decreasing trend when soil water content continued to increase. The contour lines suggested that the clay content had a greater impact on SPR as compared to water content, as the slope of SPR was greater in the direction of clay content than water content.
When soil water content was 40%, the SPR increased with clay content and density; meanwhile, its maximum value was achieved when clay content was within 36–40% (coded value 1–1.682) and density was between 2.6 and 2.8 g·cm−3 (coded value 1–1.682). The contour map showed (Figure 5b) that the variation rate of SPR was faster in the direction of density than clay content, indicating a greater impact of soil density on SPR than clay content.
When soil clay content was kept at 31%, SPR was positively associated with density, and it increased with soil water content at first but then declined. The maximum SPR fell in the area where water content was within 36–40% (coded value 1–1.682) and density was between 2.6 and 2.8 g·cm−3 (coded value 1–1.682). Similarly, soil density contributed more to the SPR than water content.
According to the F and P-values in Table 3 and slopes of contour lines in Figure 5, soil density was the primary factor that affected the SPR, which is followed by clay content and water content. Considering the impact of interactive factors on SPR, their contribution rates from high to low were X1X3 > X2X3 > X1X3. However, p-values of all the coefficients for interactive factors were all insignificant in determining SPR; thus, these coefficients were deleted in the regression models.
3.4. Model Validation
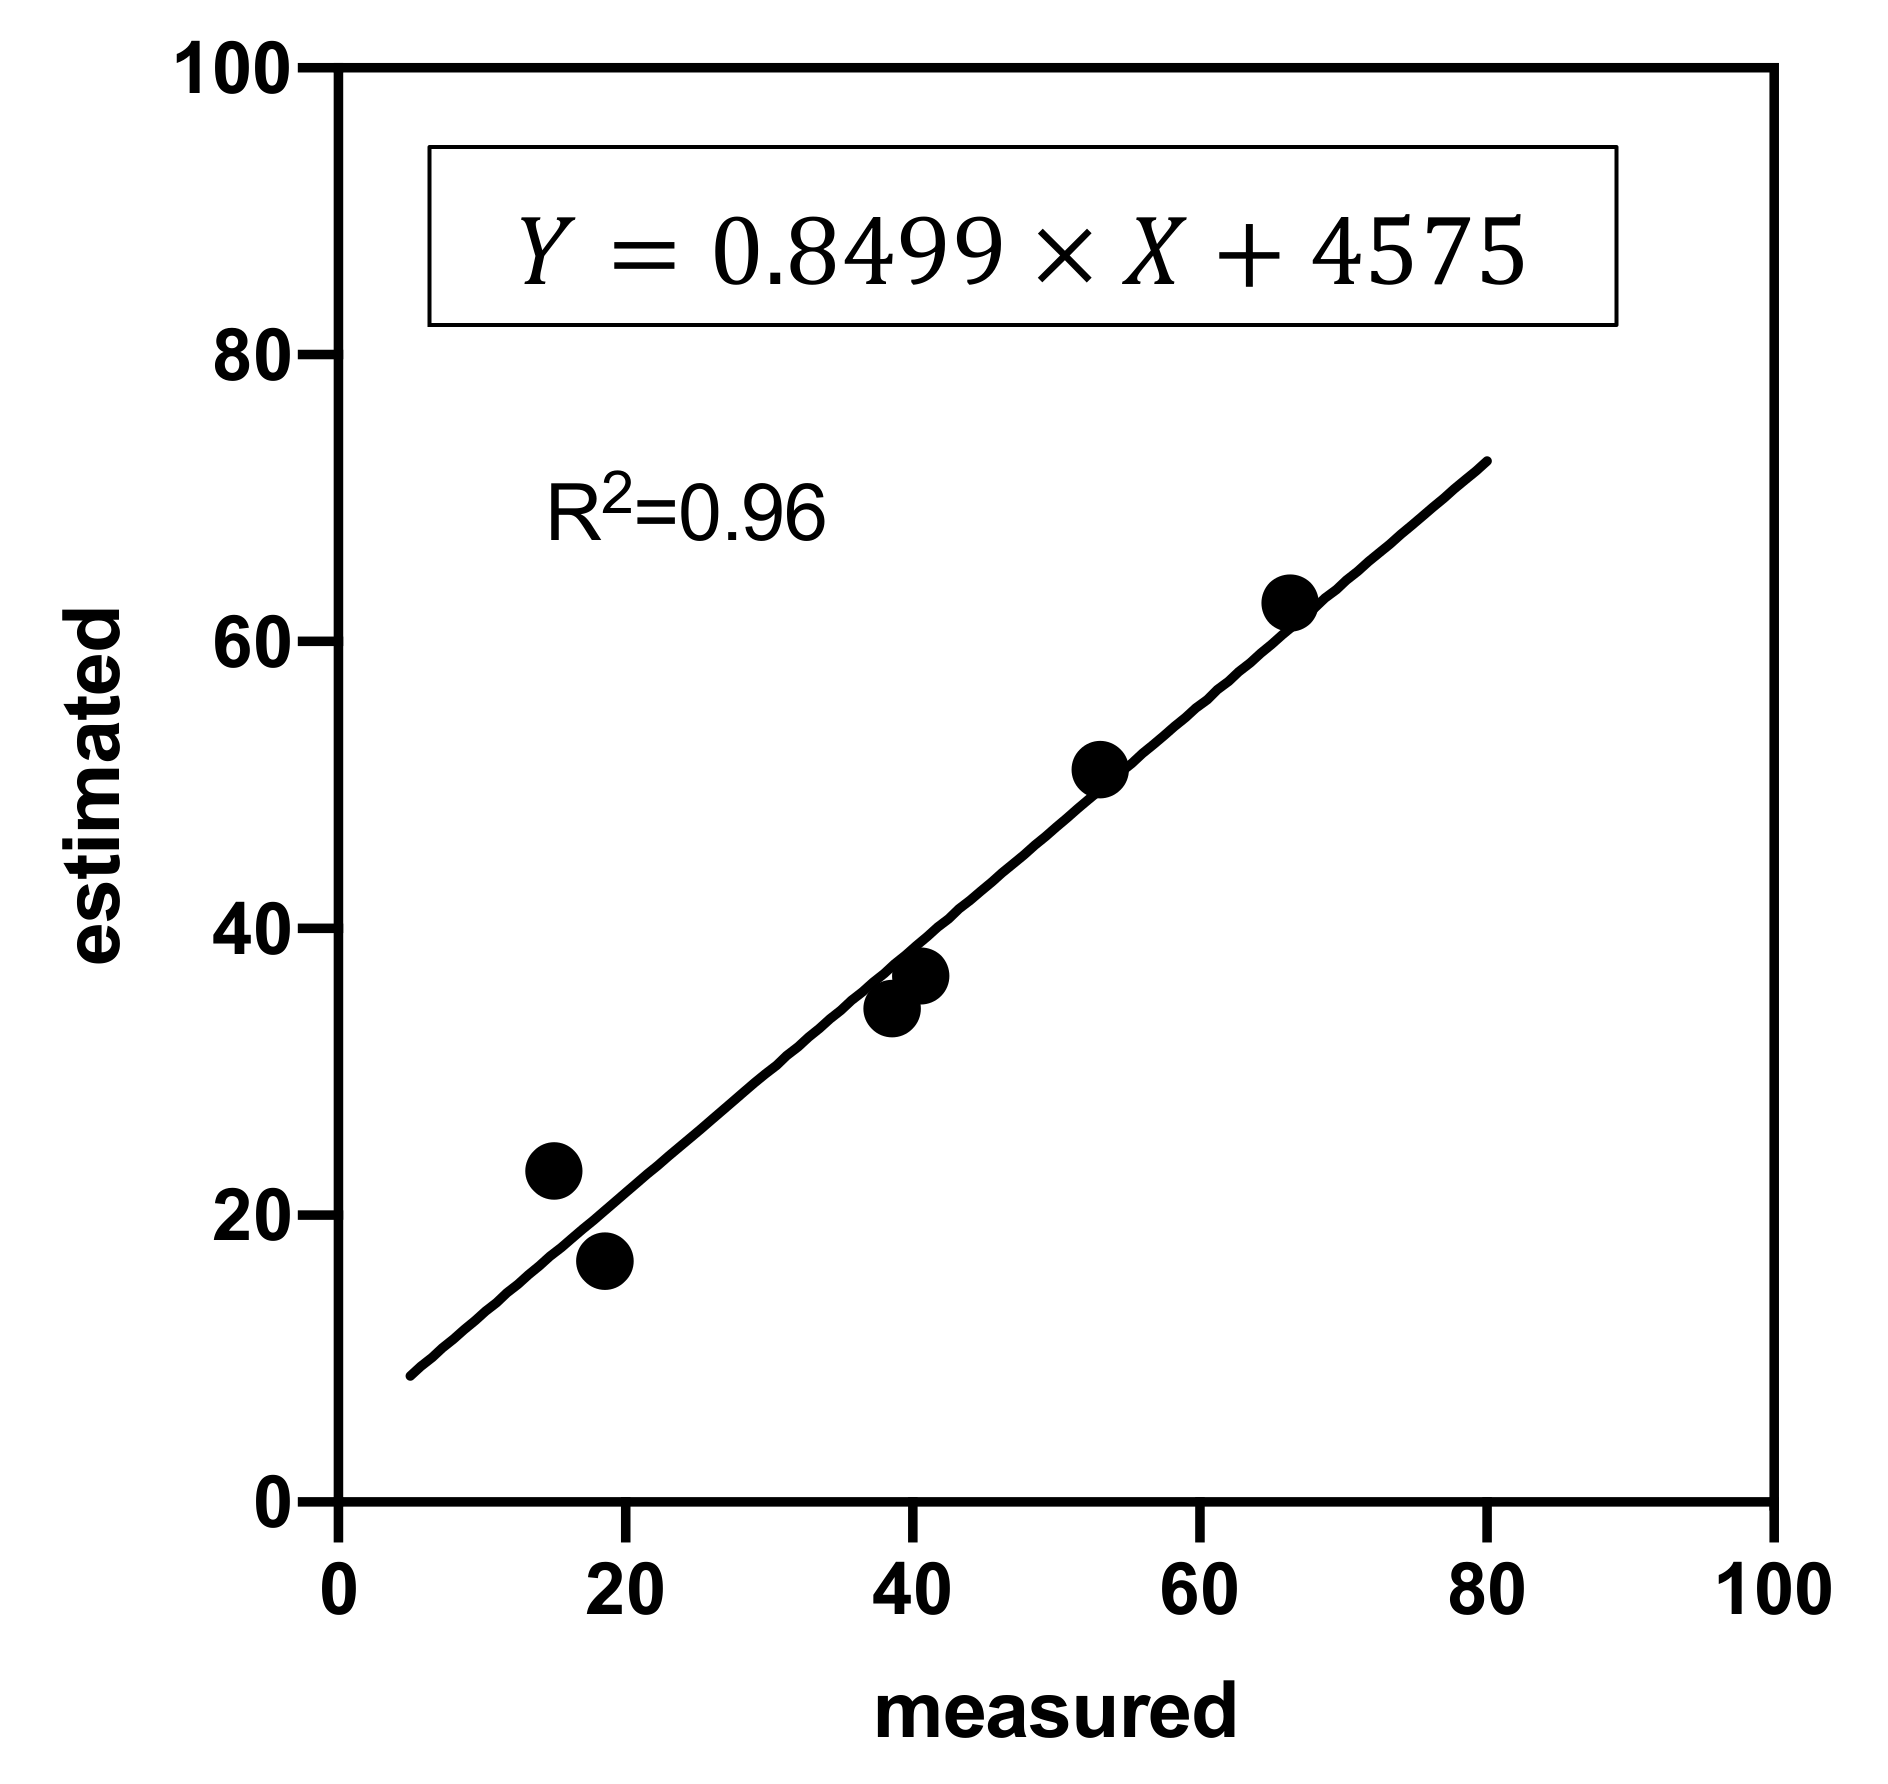
Table 5 presents the measured in situ resistance forces at the depth of 5, 10, 15 and 20 cm from six paddy fields in six different counties of the study region. The SPRs obtained from in situ measurements were then compared with the estimations from the model using soil clay content, water content and density. The percent bias between the measured and predicted SPRs ranges from 3.8% to 9.7%, values which are all within 10%. The comparisons of the measured and model estimated SPR were plotted as the dots in Figure 6, which fitted well in the linear regression line (R2 = 0.96). The low bias for each prediction as compared with the measurement as well as the high determination of coefficient suggests that the established model is accurate and efficient in estimating the SPR using readily available soil physical properties.
4. Conclusions
This paper investigated the impact of soil clay content (X1), water content (X2) and density (X3) on SPRs for paddy soils in the plastic state. SPR of the 20 soil samples were tested in laboratory based on the CCRD and analyzed using RSM. Results from the ANOVA test suggested that, though all three soil parameters had a significant impact on SPR, soil density was the primary factor, which was followed by water content and density. The impact of interactive factors on SPR from high to low was ordered as X1X3 > X2X3 > X1X3; however, none of the three interactive factors was significant in determining the SPR. Subsequently, we quantified the SPR using the three soil physical parameters by a regression equation, which showed good accuracy, with significant goodness of fit at the p < 0.001 level and insignificant lack of fit at the p > 0.05 level. Moreover, the coefficient of determination (R2) for the model was 0.95, indicating that the model was effective in predicting the SPR. Furthermore, the performance of the established model for SPR prediction was validated with the field experiment, in which the percent bias between field-measured and model-computed SPR were within 3.8% and 9.7%. Our results proved that the SPR for paddy soils in the plastic state could be quickly estimated through the mathematical method using field-derived soil parameters with high accuracy.
Author Contributions
Conceptualization, Q.J. and Y.W.; methodology, Q.J.; software, M.C.; validation, Q.J., M.C. and J.W.; formal analysis, M.C.; data curation, M.C.; writing—original draft preparation, M.C.; writing—review and editing, Q.J.; visualization, M.C.; supervision, Y.W.; project administration, Y.W.; funding acquisition, Y.W. All authors have read and agreed to the published version of the manuscript.
Funding
This research was funded by the National Key Research and Development Program of China, grant number 2016YFD0700601, and the APC was funded by Zhejiang University.
Conflicts of Interest
The authors declare no conflict of interest.
References
- De Lima, R.P.; da Silva, A.P.; Giarola, N.F.B.; da Silva, A.R.; Rolim, M.M. Changes in soil compaction indicators in response to agricultural field traffic. Biosyst. Eng. 2017, 162, 1–10. [Google Scholar] [CrossRef]
- Spinelli, R.; Magagnotti, N.; Cavallo, E.; Capello, G.; Biddoccu, M. Reducing soil compaction after thinning work in agroforestry plantations. Agrofor. Syst. 2019, 93, 1765–1779. [Google Scholar] [CrossRef]
- Ampoorter, E.; Van Nevel, L.; De Vos, B.; Hermy, M.; Verheyen, K. Assessing the effects of initial soil characteristics, machine mass and traffic intensity on forest soil compaction. For. Ecol. Manag. 2010, 260, 1664–1676. [Google Scholar] [CrossRef] [Green Version]
- Lebert, M.; Böken, H.; Glante, F. Soil compaction—Indicators for the assessment of harmful changes to the soil in the context of the german federal soil protection act. J. Environ. Manag. 2007, 82, 388–397. [Google Scholar] [CrossRef] [PubMed]
- Carrara, M.; Castrignanò, A.; Comparetti, A.; Febo, P.; Orlando, S. Mapping of penetrometer resistance in relation to tractor traffic using multivariate geostatistics. Geoderma 2007, 142, 294–307. [Google Scholar] [CrossRef] [Green Version]
- Colombi, T.; Torres, L.C.; Walter, A.; Keller, T. Feedbacks between soil penetration resistance, root architecture and water uptake limit water accessibility and crop growth—A vicious circle. Sci. Total Environ. 2018, 626, 1026–1035. [Google Scholar] [CrossRef] [PubMed]
- Otto, R.; Da Silva, A.; Franco, H.C.J.; Oliveira, E.; Trivelin, P. High soil penetration resistance reduces sugarcane root system development. Soil Tillage Res. 2011, 117, 201–210. [Google Scholar] [CrossRef]
- Bécel, C.; Vercambre, G.; Pagès, L. Soil penetration resistance, a suitable soil property to account for variations in root elongation and branching. Plant Soil 2012, 353, 169–180. [Google Scholar] [CrossRef]
- Souza, R.; Hartzell, S.; Ferraz, A.P.F.; Almeida, A.; Lima, J.R.D.S.; Antonino, A.C.D.; De Souza, E.S. Dynamics of soil penetration resistance in water-controlled environments. Soil Tillage Res. 2021, 205, 104768. [Google Scholar] [CrossRef]
- Martino, D.L.; Shaykewich, C.F. Root penetration profiles of wheat and barley as affected by soil penetration resistance in field conditions. Can. J. Soil Sci. 1994, 74, 193–200. [Google Scholar] [CrossRef]
- Rezaei, M.; Tabatabaekoloor, R.; Mousavi Seyedi, S.R.; Aghili Nategh, N. Effects of puddling intensity on the in-situ engineering properties of paddy field soil. Aust. J. Agric. Eng. 2012, 3, 22–26. [Google Scholar]
- Mohanty, M.; Painuli, D.; Mandal, K. Effect of puddling intensity on temporal variation in soil physical conditions and yield of rice (Oryza sativa L.) in a Vertisol of central India. Soil Tillage Res. 2004, 76, 83–94. [Google Scholar] [CrossRef]
- Vaz, C.M.; Bassoi, L.H.; Hopmans, J.W. Contribution of water content and bulk density to field soil penetration resistance as measured by a combined cone penetrometer—TDR probe. Soil Tillage Res. 2001, 60, 35–42. [Google Scholar] [CrossRef] [Green Version]
- Tarkiewicz, S.; Nosalewicz, A. Effect of organic carbon content on the compactibility and penetration resistance of two soils formed from loess. Int. Agrophys. 2005, 19, 345–350. [Google Scholar] [CrossRef] [Green Version]
- Bayat, H.; Zadeh, G.E. Estimation of the soil water retention curve using penetration resistance curve models. Comput. Electron. Agric. 2018, 144, 329–343. [Google Scholar] [CrossRef]
- Vepraskas, M.J. Bulk density values diagnostic of restricted root growth in coarse textured soils. Soil Sci. Soc. Am. J. 1988, 52, 1117–1121. [Google Scholar] [CrossRef]
- Dexter, A.; Czyż, E.; Gaţe, O. A method for prediction of soil penetration resistance. Soil Tillage Res. 2007, 93, 412–419. [Google Scholar] [CrossRef]
- Yao, S.; Teng, X.; Zhang, B. Effects of rice straw incorporation and tillage depth on soil puddlability and mechanical properties during rice growth period. Soil Tillage Res. 2015, 146, 125–132. [Google Scholar] [CrossRef]
- Whalley, W.; To, J.; Kay, B.; Whitmore, A. Prediction of the penetrometer resistance of soils with models with few parameters. Geoderma 2007, 137, 370–377. [Google Scholar] [CrossRef]
- Mambani, B.; De Datta, S.; Redulla, C. Land preparation requirements for rainfed rice as affected by climatic water balance and tillage properties of lowland soils. Soil Tillage Res. 1989, 14, 219–230. [Google Scholar] [CrossRef]
- Jia, X.; Scherer, T.F.; DeSutter, T.M.; Steele, D.D. Change of soil hardness and soil properties due to tile drainage in the Red River Valley of the North. In ASABE 2008 Annual International Meeting, Proceedings of the Providence, Rhode Island, USA, 29 June–2 July 2008; American Society of Agricultural and Biological Engineers: St. Joseph, MI, USA, 2008; p. 1. [Google Scholar] [CrossRef]
- He, C.; You, Y.; Wang, D.; Wang, G.; Lu, D.; Kaji, J.M.T. The effect of tine geometry during vertical movement on soil penetration resistance using finite element analysis. Comput. Electron. Agric. 2016, 130, 97–108. [Google Scholar] [CrossRef]
- Roscoe, K.H. The Influence of Strains in Soil Mechanics. Geotechnique 1970, 20, 129–170. [Google Scholar] [CrossRef]
- Jakobsen, B.F.; Dexter, A.R. Prediction of soil compaction under pneumatic tyres. J. Terramechanics 1989, 26, 107–119. [Google Scholar] [CrossRef]
- Ansorge, D.; Godwin, R.J. The Effect of Tyres and a Rubber Track at High Axle Loads on Soil Compaction, Part 3: Prediction of Soil Compaction. Biosyst. Eng. 2009, 104, 278–287. [Google Scholar] [CrossRef]
- Fernandes, M.M.H.; Coelho, A.P.; Da Silva, M.F.; Bertonha, R.S.; de Queiroz, R.F.; Furlani, C.E.A.; Fernandes, C. Estimation of soil penetration resistance with standardized moisture using modeling by artificial neural networks. Catena 2020, 189, 104505. [Google Scholar] [CrossRef]
- Upadhyaya, S.K.; Kemble, L.J.; Collins, N.E. Cone index prediction equations for Delaware soils. Trans. ASAE 1982, 82, 1452–1456. [Google Scholar]
- Canarache, A. PENETR—A generalized semi-empirical model estimating soil resistance to penetration. Soil Tillage Res. 1990, 16, 51–70. [Google Scholar] [CrossRef]
- To, J.; Kay, B. Variation in penetrometer resistance with soil properties: The contribution of effective stress and implications for pedotransfer functions. Geoderma 2005, 126, 261–276. [Google Scholar] [CrossRef]
- Zhang, W.; Gao, W.; Ren, T.; Whalley, W. A novel approach to estimate soil penetrometer resistance from water content, bulk density, and shear wave velocity: A laboratory study on a loamy sand soil. Geoderma 2020, 368, 114276. [Google Scholar] [CrossRef]
- Gao, W.; Whalley, W.R.; Tian, Z.; Liu, J.; Ren, T. A simple model to predict soil penetrometer resistance as a function of density, drying and depth in the field. Soil Tillage Res. 2016, 155, 190–198. [Google Scholar] [CrossRef]
- Rui, W.; Zhang, W. Effect size and duration of recommended management practices on carbon sequestration in paddy field in Yangtze Delta Plain of China: A meta-analysis. Agric. Ecosyst. Environ. 2010, 135, 199–205. [Google Scholar] [CrossRef]
- American Society for Testing and Materials. ASTM Standard D2487: Standard Practice for Classification of Soils for Engineering Purposes (Unified Soil Classification System); ASTM International: West Conshohocken, PA, USA, 2006. [Google Scholar]
- American Society for Testing Materials International. Designation D 4318: Standard Test Methods for Liquid Limit, Plastic Limit, and Plasticity Index of Soils; ASTM International: West Conshohocken, PA, USA, 2000. [Google Scholar]
- Box, G.E.P.; Hunter, J.S. Multi-Factor Experimental Designs for Exploring Response Surfaces. Ann. Math. Stat. 1957, 28, 195–241. [Google Scholar] [CrossRef]
- Ahmad, A.L.; Ismail, S.; Bhatia, S. Optimization of coagulation−flocculation process for palm oil mill effluent using response surface methodology. Environ. Sci. Technol. 2005, 39, 2828–2834. [Google Scholar] [CrossRef] [PubMed]
- Ayers, P.D.; Perumpral, J.V. Moisture and Density Effect on Cone Index. Trans. ASAE 1982, 25, 1169–1172. [Google Scholar] [CrossRef]
- Elbanna, E.; Witney, B. Cone penetration resistance equation as a function of the clay ratio, soil moisture content and specific weight. J. Terramechanics 1987, 24, 41–56. [Google Scholar] [CrossRef]
- Hummel, J.W.; Ahmad, I.S.; Newman, S.C.; Sudduth, K.; Drummond, S.T. Simultaneous soil moisture and cone index measurement. Trans. ASAE 2004, 47, 607–618. [Google Scholar] [CrossRef] [Green Version]
- Smith, C.; Johnston, M.; Lorentz, S. The effect of soil compaction and soil physical properties on the mechanical resistance of South African forestry soils. Geoderma 1997, 78, 93–111. [Google Scholar] [CrossRef]
- Bengough, A.G.; Campbell, D.J.; Sullivan, M.F.O. Penetrometer techniques in relation to soil compaction and root growth. Soil Environ. Anal. Phys. Methods 2000, 2, 377–403. [Google Scholar] [CrossRef]
Figure 1.
Soil penetration resistance tests in the laboratory and field. Note: 1. Soil penetrometer; 2. Remolded soil samples; 3. Container; 4. Base.
Figure 1.
Soil penetration resistance tests in the laboratory and field. Note: 1. Soil penetrometer; 2. Remolded soil samples; 3. Container; 4. Base.

Figure 2.
Spring deformation and penetration depth curve (X-axis: penetration depth, in mm; Y-axis: spring deformation, in mm). Note: 1—spring deformation and penetration depth curve, 2—recording tape.
Figure 2.
Spring deformation and penetration depth curve (X-axis: penetration depth, in mm; Y-axis: spring deformation, in mm). Note: 1—spring deformation and penetration depth curve, 2—recording tape.

Figure 3.
The closed area of the curve in MATLAB. Note: 1—standard closed square area; 2—closed area to be solved.
Figure 3.
The closed area of the curve in MATLAB. Note: 1—standard closed square area; 2—closed area to be solved.

Figure 4.
Single impact of clay content, gravimetric water content and soil wet bulk density on soil penetration resistance.
Figure 4.
Single impact of clay content, gravimetric water content and soil wet bulk density on soil penetration resistance.

Figure 5.
Interactive effects of (a) clay content and water content; (b) clay content and density; (c) water content and density on soil penetration resistance (A: clay content; B: water content; C: density).
Figure 5.
Interactive effects of (a) clay content and water content; (b) clay content and density; (c) water content and density on soil penetration resistance (A: clay content; B: water content; C: density).

Figure 6.
Comparisons of the measured and estimated soil penetration resistance (kPa).


Table 1.
Measured soil physical properties.
| No. | Sand (%) | Silt (%) | Clay (%) | Soil Texture | Plastic Limit (%) | Liquid Limit (%) | Plasticity Index (%) |
|---|---|---|---|---|---|---|---|
| 1 | 27.9 | 49.8 | 22.3 | Loam | 24.0 | 51.8 | 27.8 |
| 2 | 11.3 | 62.6 | 26.1 | Silty clay loam | 23.5 | 49.0 | 25.5 |
| 3 | 5.5 | 63.7 | 30.8 | Silty clay loam | 23.5 | 49.0 | 25.5 |
| 4 | 4.0 | 60.0 | 36.0 | Silty loam | 31.5 | 52.5 | 21.0 |
| 5 | 2.5 | 56.9 | 40.6 | Silty clay | 22.0 | 49.5 | 27.5 |
Table 2.
Coded levels for clay content (X1), gravimetric water content (X2) and wet bulk density (X3).
Table 2.
Coded levels for clay content (X1), gravimetric water content (X2) and wet bulk density (X3).
| Code | X1 (%) | X2 (%) | X3 (g·cm−3) |
|---|---|---|---|
| −1.682 | 22.3 | 30 | 1.8 |
| −1 | 26.1 | 34 | 2.0 |
| 0 | 30.8 | 40 | 2.3 |
| 1 | 36.0 | 46 | 2.6 |
| 1.682 | 40.6 | 50 | 2.8 |
Table 3.
Experiment scheme and test results (X1: clay content, %; X2: gravimetric water content, %; X3: soil wet bulk density, g cm−3; Y: soil penetration resistance).
Table 3.
Experiment scheme and test results (X1: clay content, %; X2: gravimetric water content, %; X3: soil wet bulk density, g cm−3; Y: soil penetration resistance).
| Run No. | Y/kPa | |||
|---|---|---|---|---|
| 1 | −1 | −1 | −1 | 35.4 |
| 2 | −1 | −1 | 1 | 72.0 |
| 3 | −1 | 1 | −1 | 21.3 |
| 4 | −1 | 1 | 1 | 51.9 |
| 5 | 1 | −1 | −1 | 45.3 |
| 6 | 1 | −1 | 1 | 78.1 |
| 7 | 1 | 1 | −1 | 44.6 |
| 8 | 1 | 1 | 1 | 60.4 |
| 9 | −1.682 | 0 | 0 | 44.3 |
| 10 | 1.682 | 0 | 0 | 58.6 |
| 11 | 0 | −1.682 | 0 | 40.1 |
| 12 | 0 | 1.682 | 0 | 34.2 |
| 13 | 0 | 0 | −1.682 | 26.3 |
| 14 | 0 | 0 | 1.682 | 74.1 |
| 15 | 0 | 0 | 0 | 48.3 |
| 16 | 0 | 0 | 0 | 50.9 |
| 17 | 0 | 0 | 0 | 49.2 |
| 18 | 0 | 0 | 0 | 51.3 |
| 19 | 0 | 0 | 0 | 49.2 |
| 20 | 0 | 0 | 0 | 48.3 |
Table 4.
Results of statistical analysis for the experiment.
| Coefficient | Value | P | F |
|---|---|---|---|
| 49.37 | <0.0001 | 22.41 | |
| 5.26 | 0.0013 | 19.67 | |
| −4.58 | 0.0032 | 14.90 | |
| 14.37 | <0.0001 | 146.7 | |
| 1.98 | 0.2313 | 1.62 | |
| −2.32 | 0.1644 | 2.25 | |
| −2.87 | 0.0932 | 3.44 | |
| 1.74 | 0.1617 | 2.28 | |
| −3.31 | 0.0167 | 8.22 | |
| 1.30 | 0.2855 | 1.27 | |
| P1 | <0.0001 | ||
| P2 | 0.08 | ||
| RMSD (kPa) | 4.9 | ||
| R2 | 0.95 | ||
P: p-value for each coefficient; F: F-value for each coefficient; P1: p-value for the goodness of fit; P2: p-value for lack of fit; RMSD: root mean square deviation; R2: coefficient of determination.
Table 5.
Comparison between field measured and model predicted soil penetration resistance (SPR). PBIAS: percent bias.
Table 5.
Comparison between field measured and model predicted soil penetration resistance (SPR). PBIAS: percent bias.
| Location | Clay (%) | Water (%) | Density (g cm−3) | SPR (kPa) | ||
|---|---|---|---|---|---|---|
| Measured | Estimated | PBIAS | ||||
| Hangzhou | 22 | 22.2 | 1.8 | 18.6 ± 1.2 | 16.8 | 9.7% |
| Wuhu | 26 | 36.7 | 2.2 | 38.6 ± 1.7 | 34.4 | 8.5% |
| Jiaxing | 31 | 50.4 | 2.0 | 15.0 ± 0.8 | 23.1 | 9.4% |
| Huzhou | 36 | 40.1 | 1.9 | 40.6 ± 1.2 | 36.7 | 9.6% |
| Yixing | 40 | 38.5 | 2.1 | 53.1 ± 1.0 | 51.1 | 3.8% |
| Huzhou | 35 | 22.4 | 2.4 | 66.3 ± 1.8 | 62.7 | 5.4% |
Publisher’s Note: MDPI stays neutral with regard to jurisdictional claims in published maps and institutional affiliations. |
© 2020 by the authors. Licensee MDPI, Basel, Switzerland. This article is an open access article distributed under the terms and conditions of the Creative Commons Attribution (CC BY) license (http://creativecommons.org/licenses/by/4.0/).
Share and Cite
MDPI and ACS Style
Jiang, Q.; Cao, M.; Wang, Y.; Wang, J. Estimating Soil Penetration Resistance of Paddy Soils in the Plastic State Using Physical Properties. Agronomy 2020, 10, 1914. https://doi.org/10.3390/agronomy10121914
AMA Style
Jiang Q, Cao M, Wang Y, Wang J. Estimating Soil Penetration Resistance of Paddy Soils in the Plastic State Using Physical Properties. Agronomy. 2020; 10(12):1914. https://doi.org/10.3390/agronomy10121914
Chicago/Turabian StyleJiang, Qianjing, Ming Cao, Yongwei Wang, and Jun Wang. 2020. "Estimating Soil Penetration Resistance of Paddy Soils in the Plastic State Using Physical Properties" Agronomy 10, no. 12: 1914. https://doi.org/10.3390/agronomy10121914
Note that from the first issue of 2016, this journal uses article numbers instead of page numbers. See further details here.