
scRNA-Seq of Cultured Human Amniotic Fluid from Fetuses with Spina Bifida Reveals the Origin and Heterogeneity of the Cellular Content

 , , and
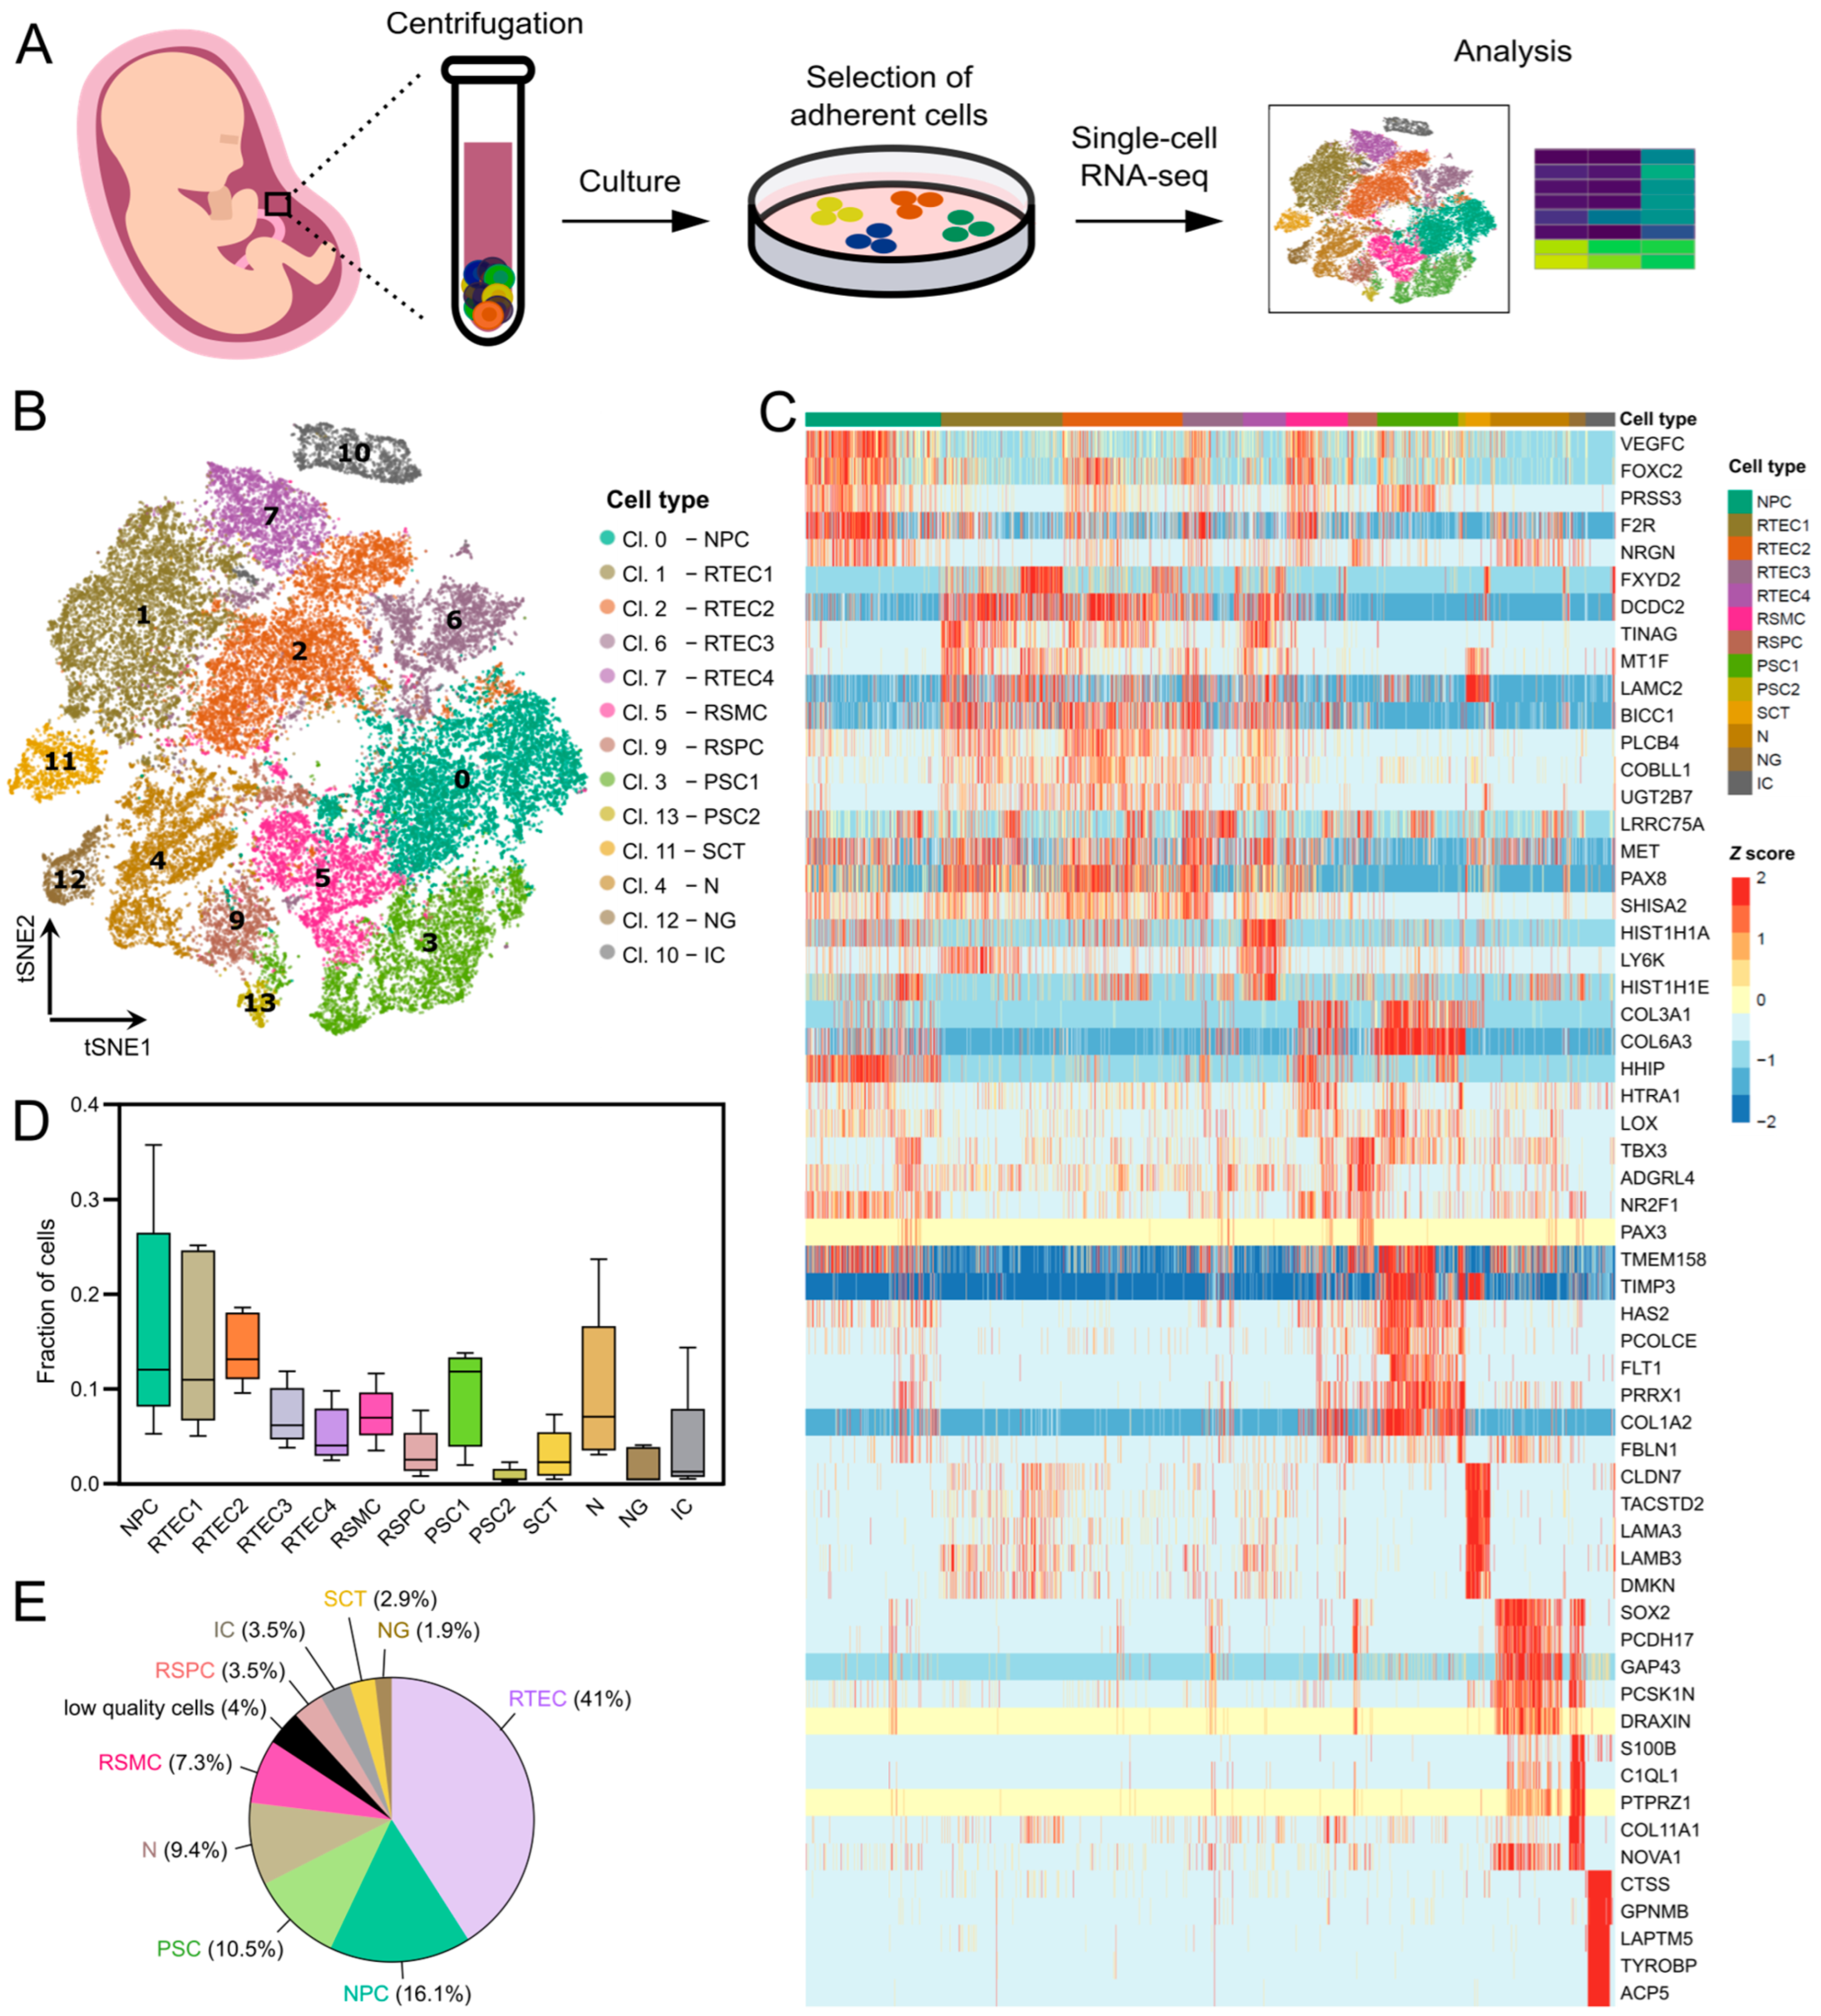
Abstract
:1. Introduction
2. Materials and Methods
2.1. Amniotic Fluid Samples
2.2. Isolation and Culture of Amniotic Fluid Cells for Single-Cell RNA Sequencing
2.3. Single-Cell RNA Sequencing
2.4. Single-Cell RNA-Seq Data Analysis
2.4.1. Analysis of Each Sample
2.4.2. Integration of Multiple Samples
2.5. Data Access
2.6. Gene Ontology Enrichment Analysis (GO Analysis)
2.7. Fluorescence-Activated and Magnetic Cell Sorting of c-Kit-Positive Cells
2.8. Cytospin
2.9. Immunofluorescence Staining for Microscopy
2.10. Flow Cytometry Analysis of Mesenchymal Stem Cell Markers
3. Results
3.1. Single-Cell Transcriptomic Analysis Identifies Nine Cell Types in Cultured Amniotic Fluid
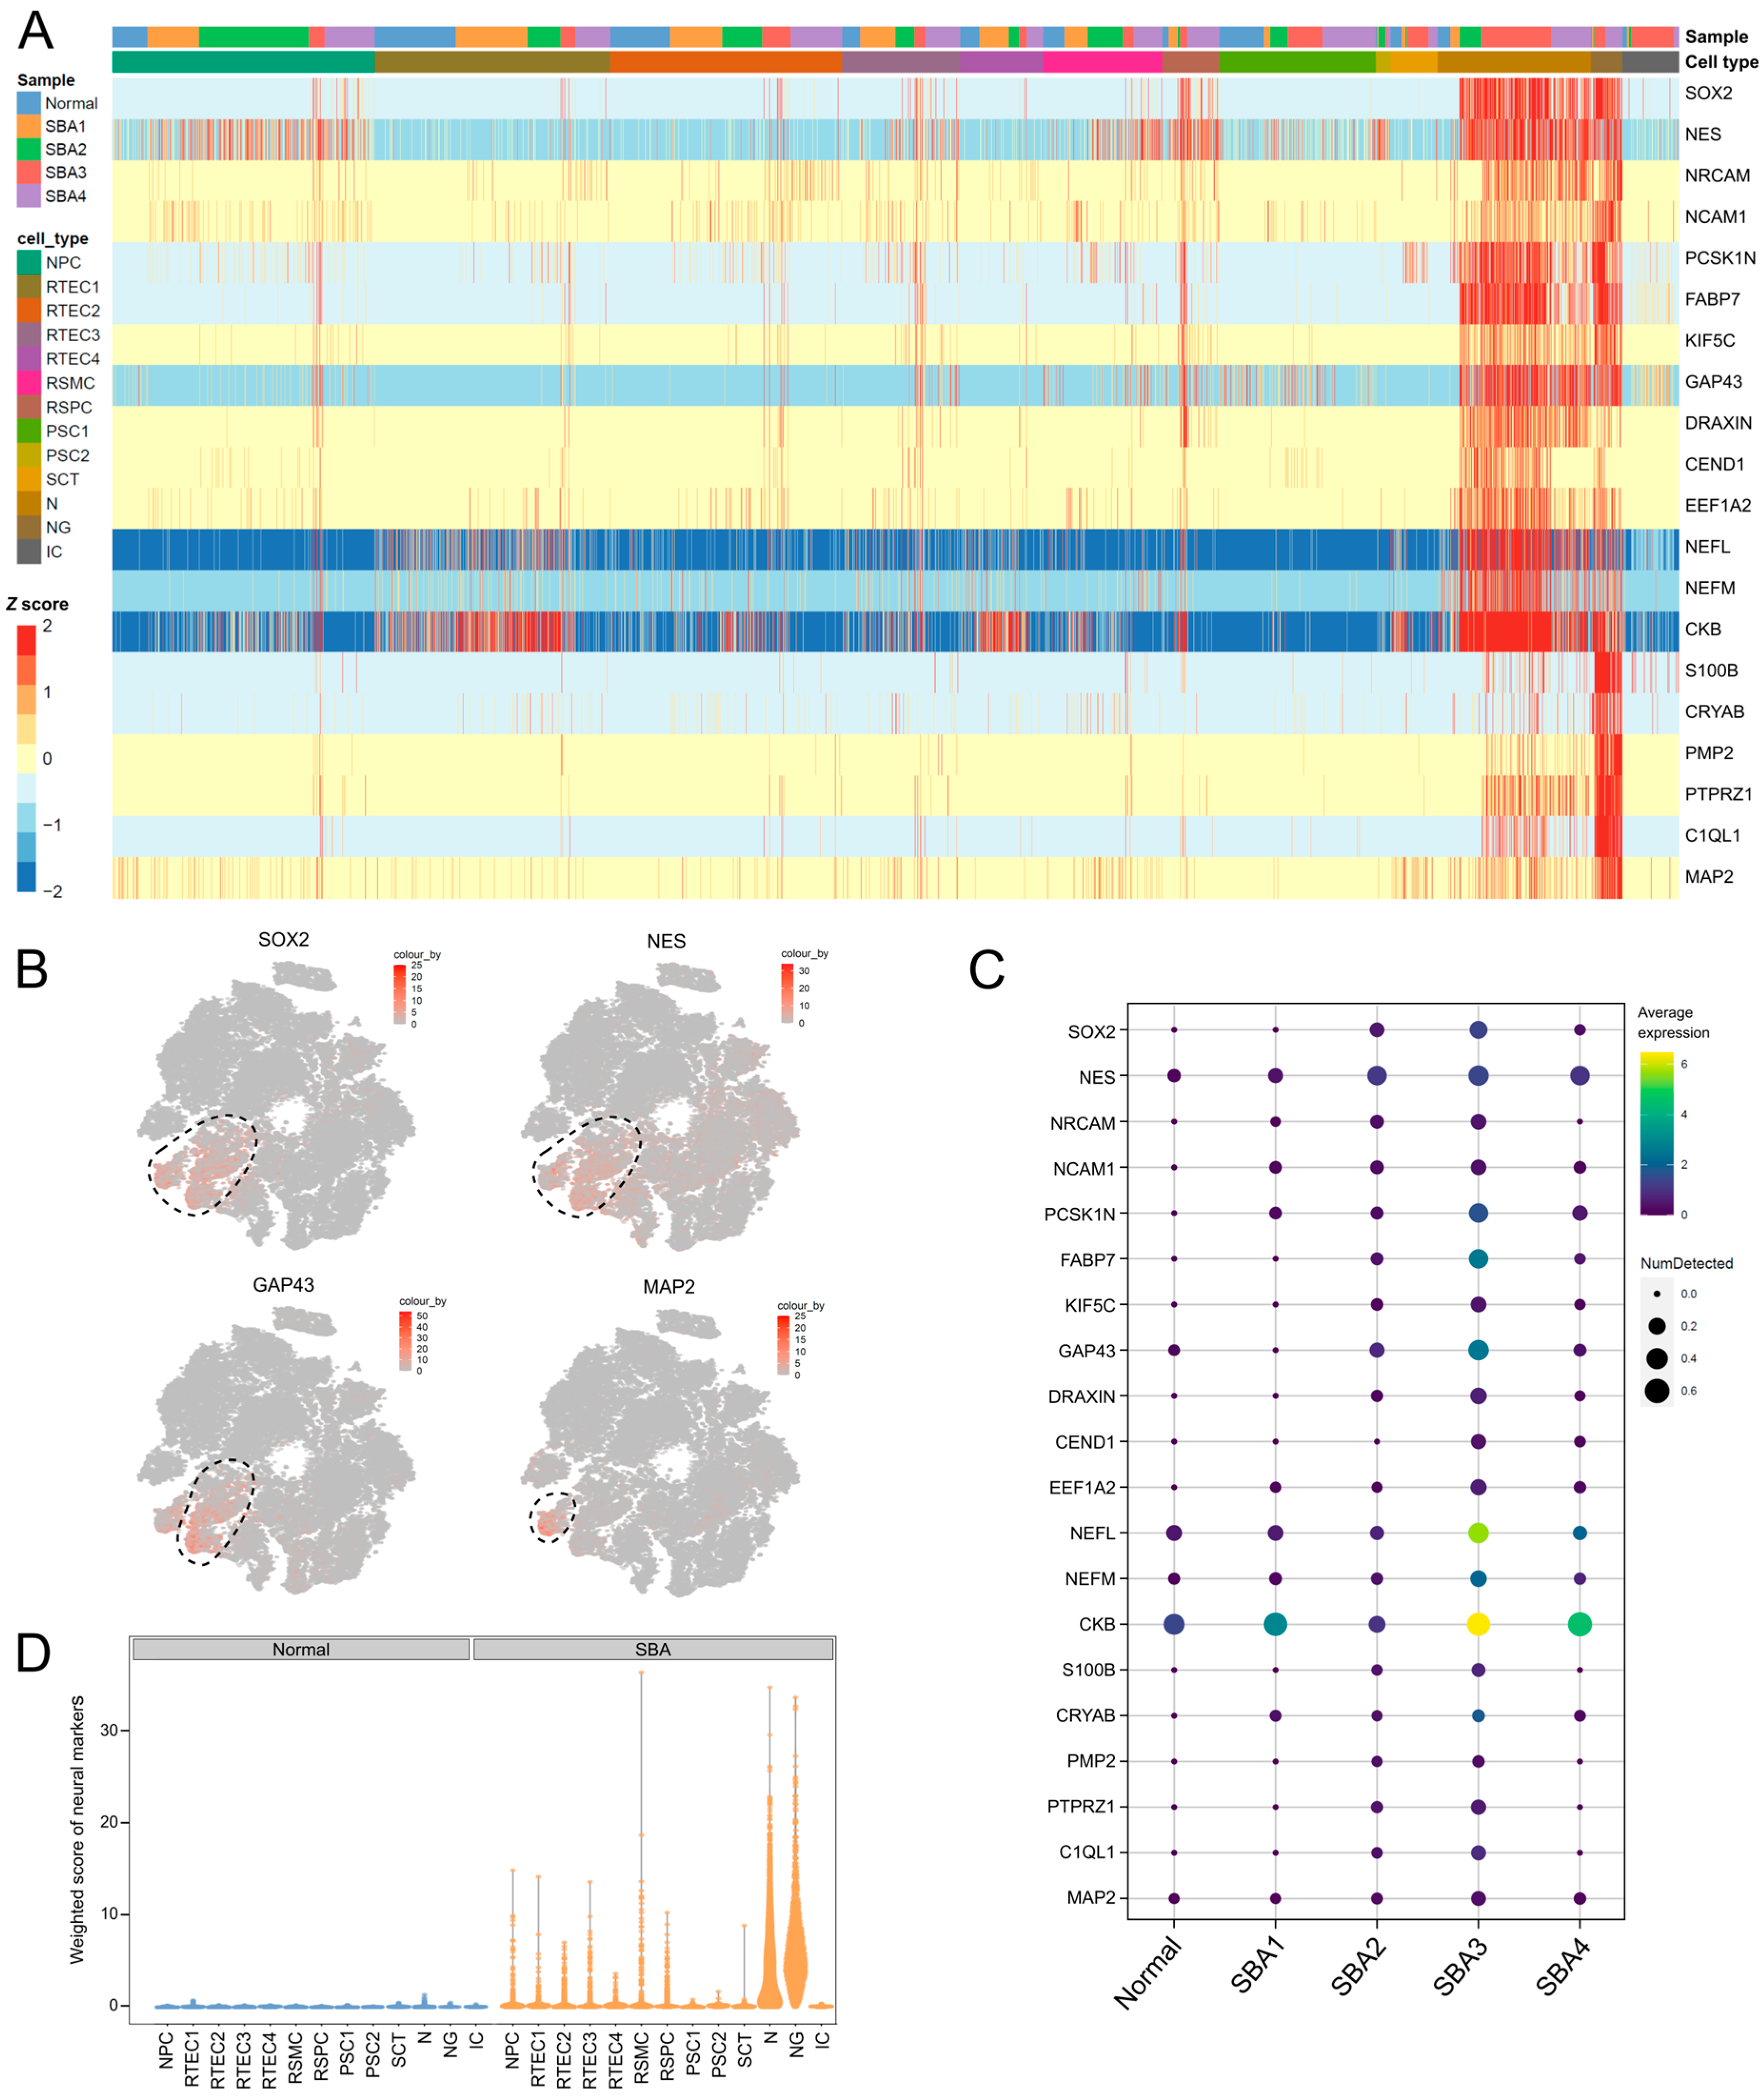
3.2. Clusters of Renal Origin Comprise Four Different Renal Cell Types
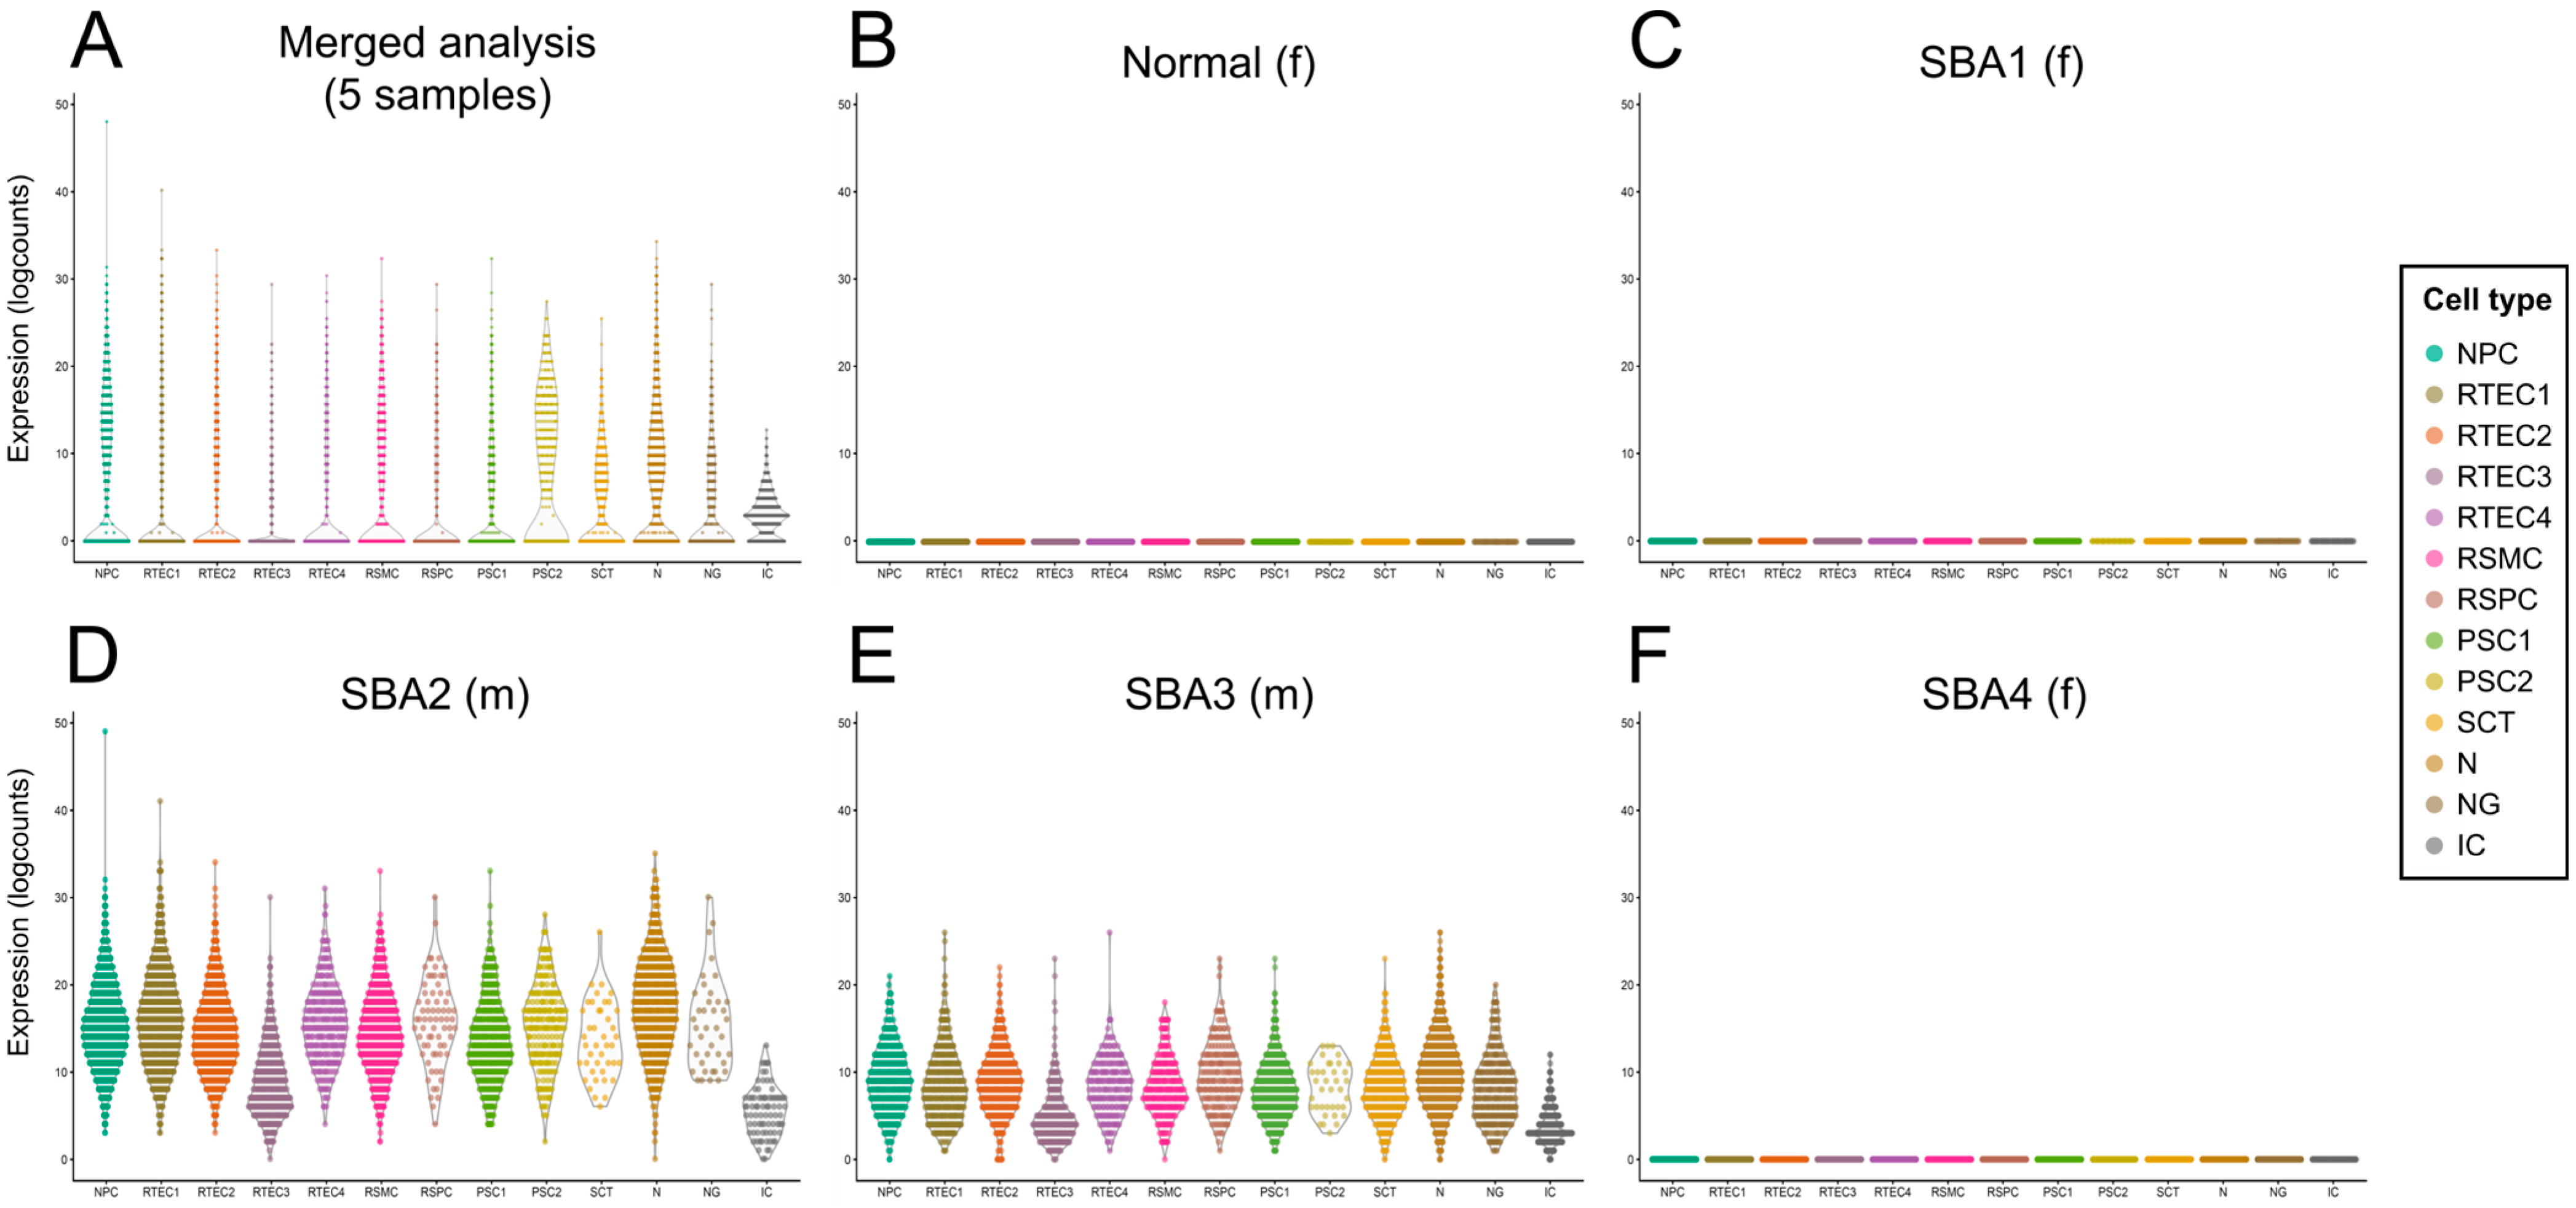
3.3. Neurons and Neuroglia Exist in AF Cultures from Fetuses with Spina Bifida Aperta
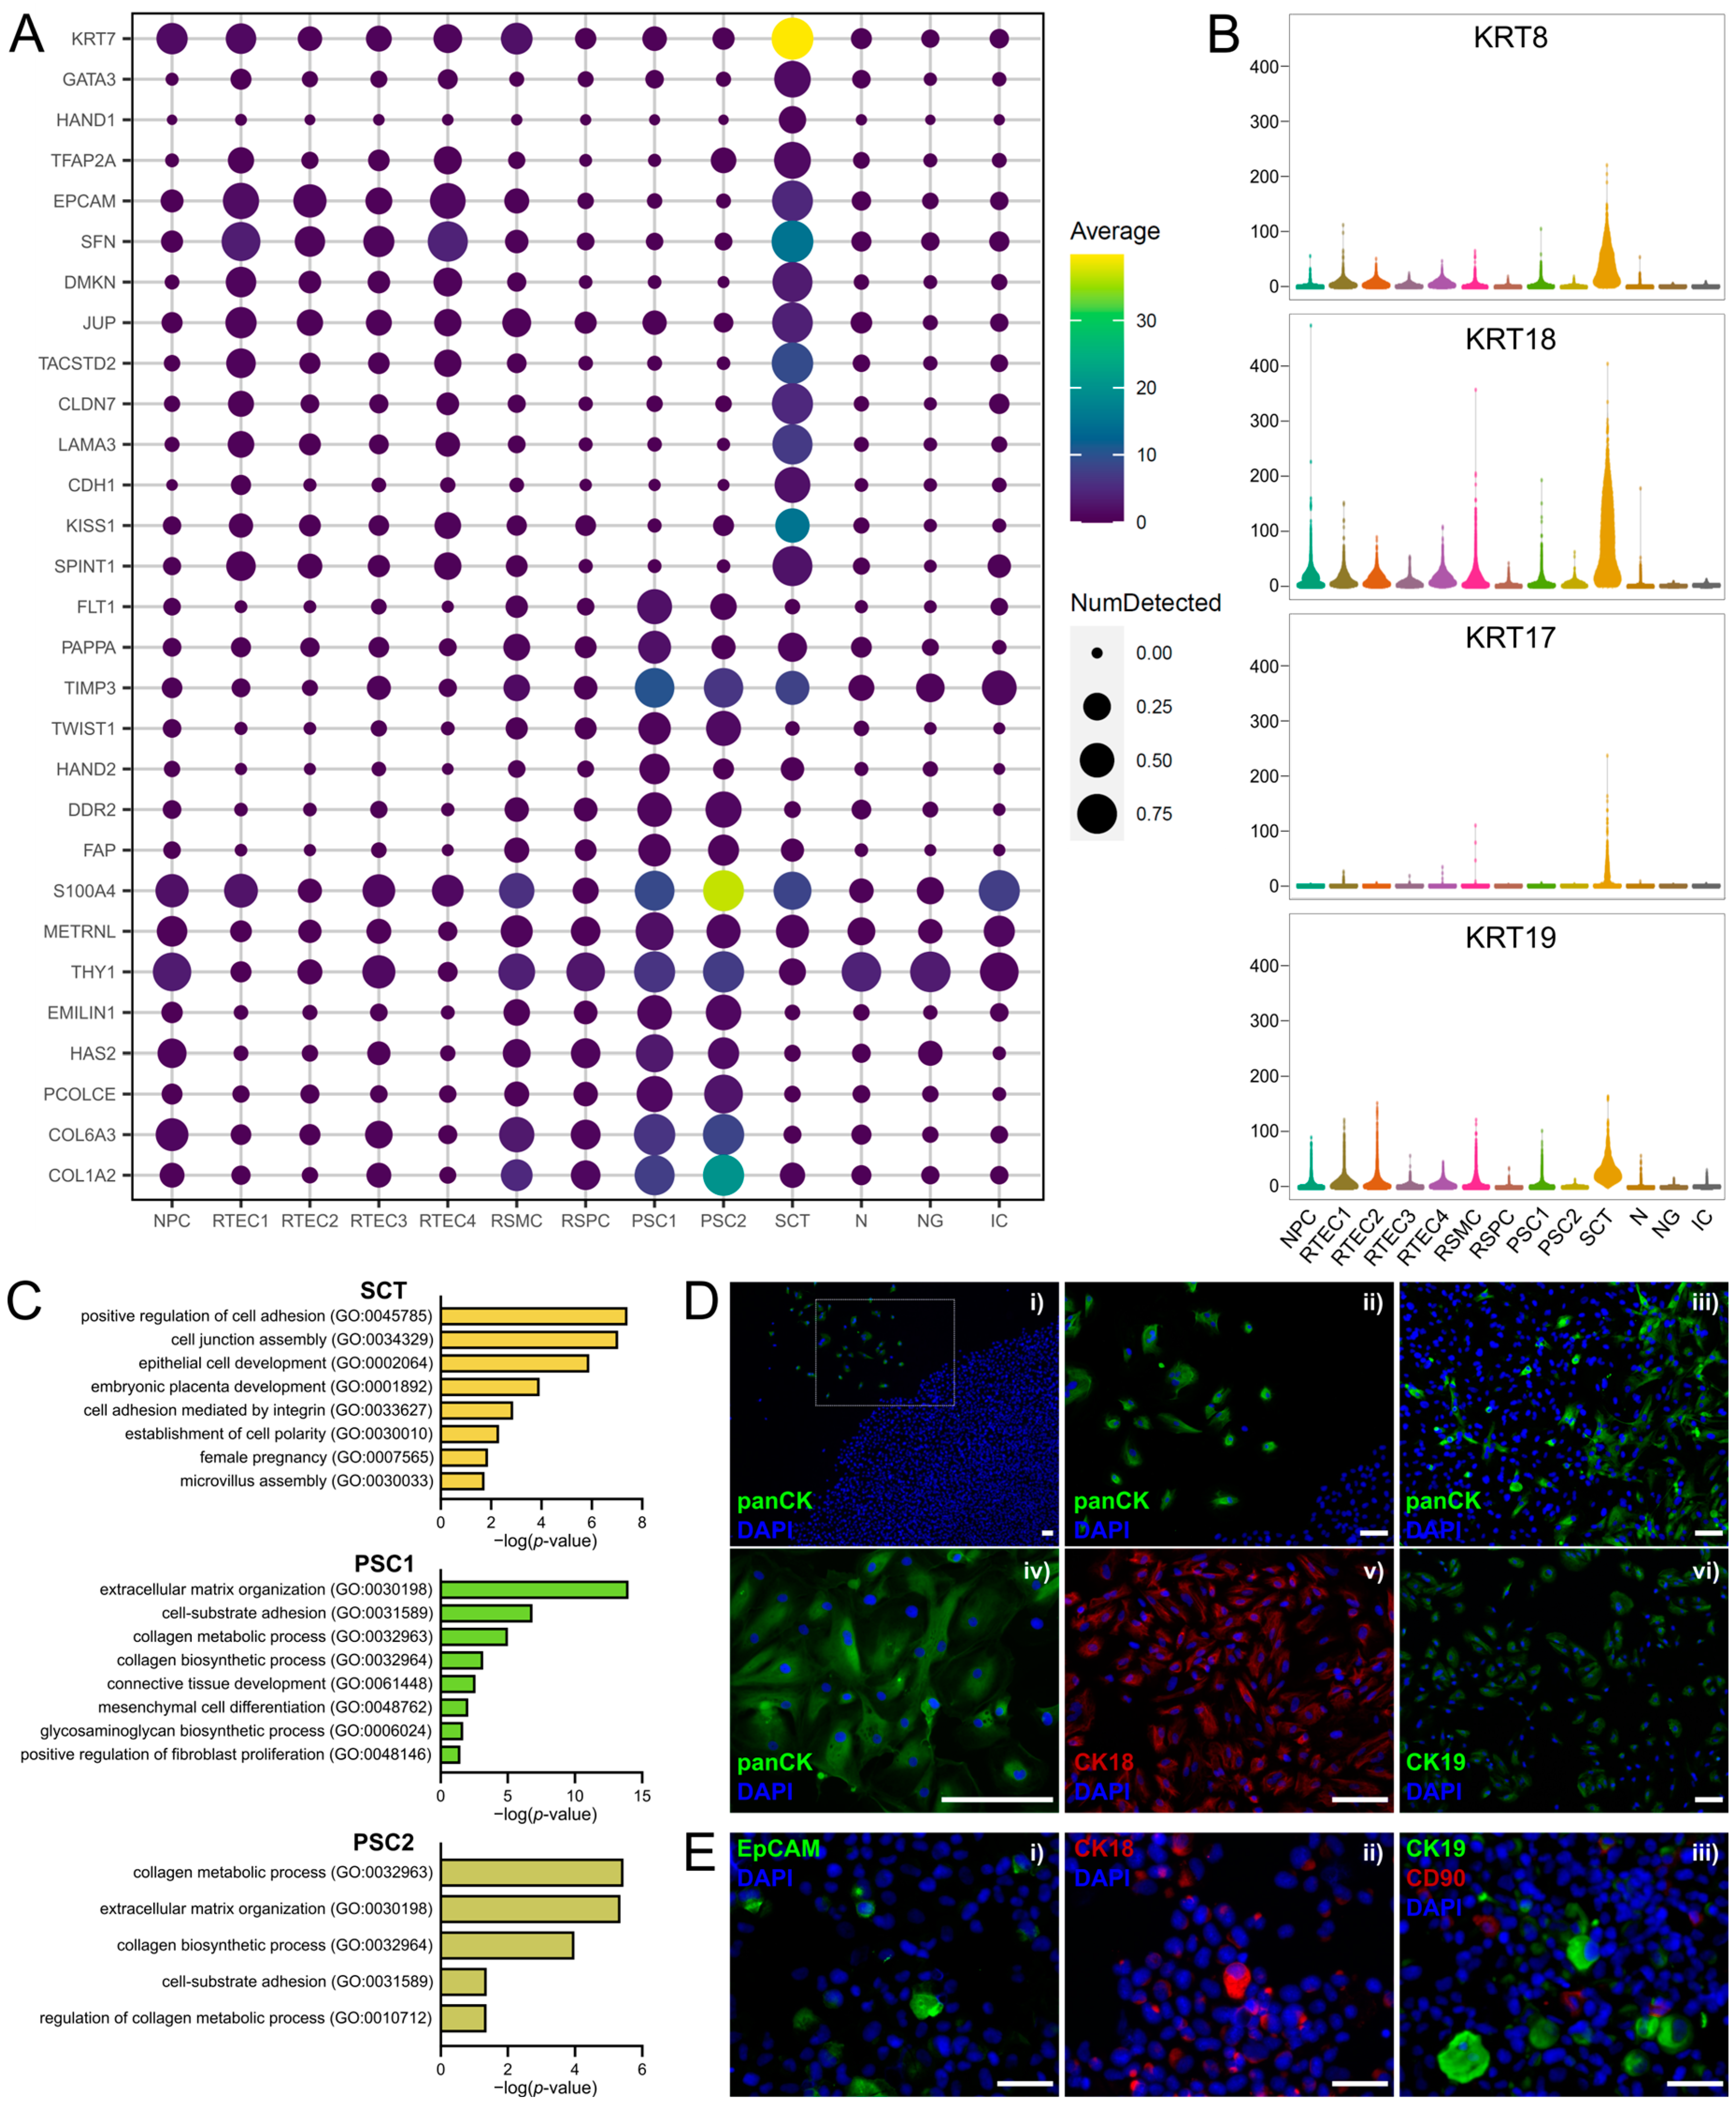
3.4. Clusters of Placental Origin Comprise Cells of Epithelial and Mesenchymal Phenotypes
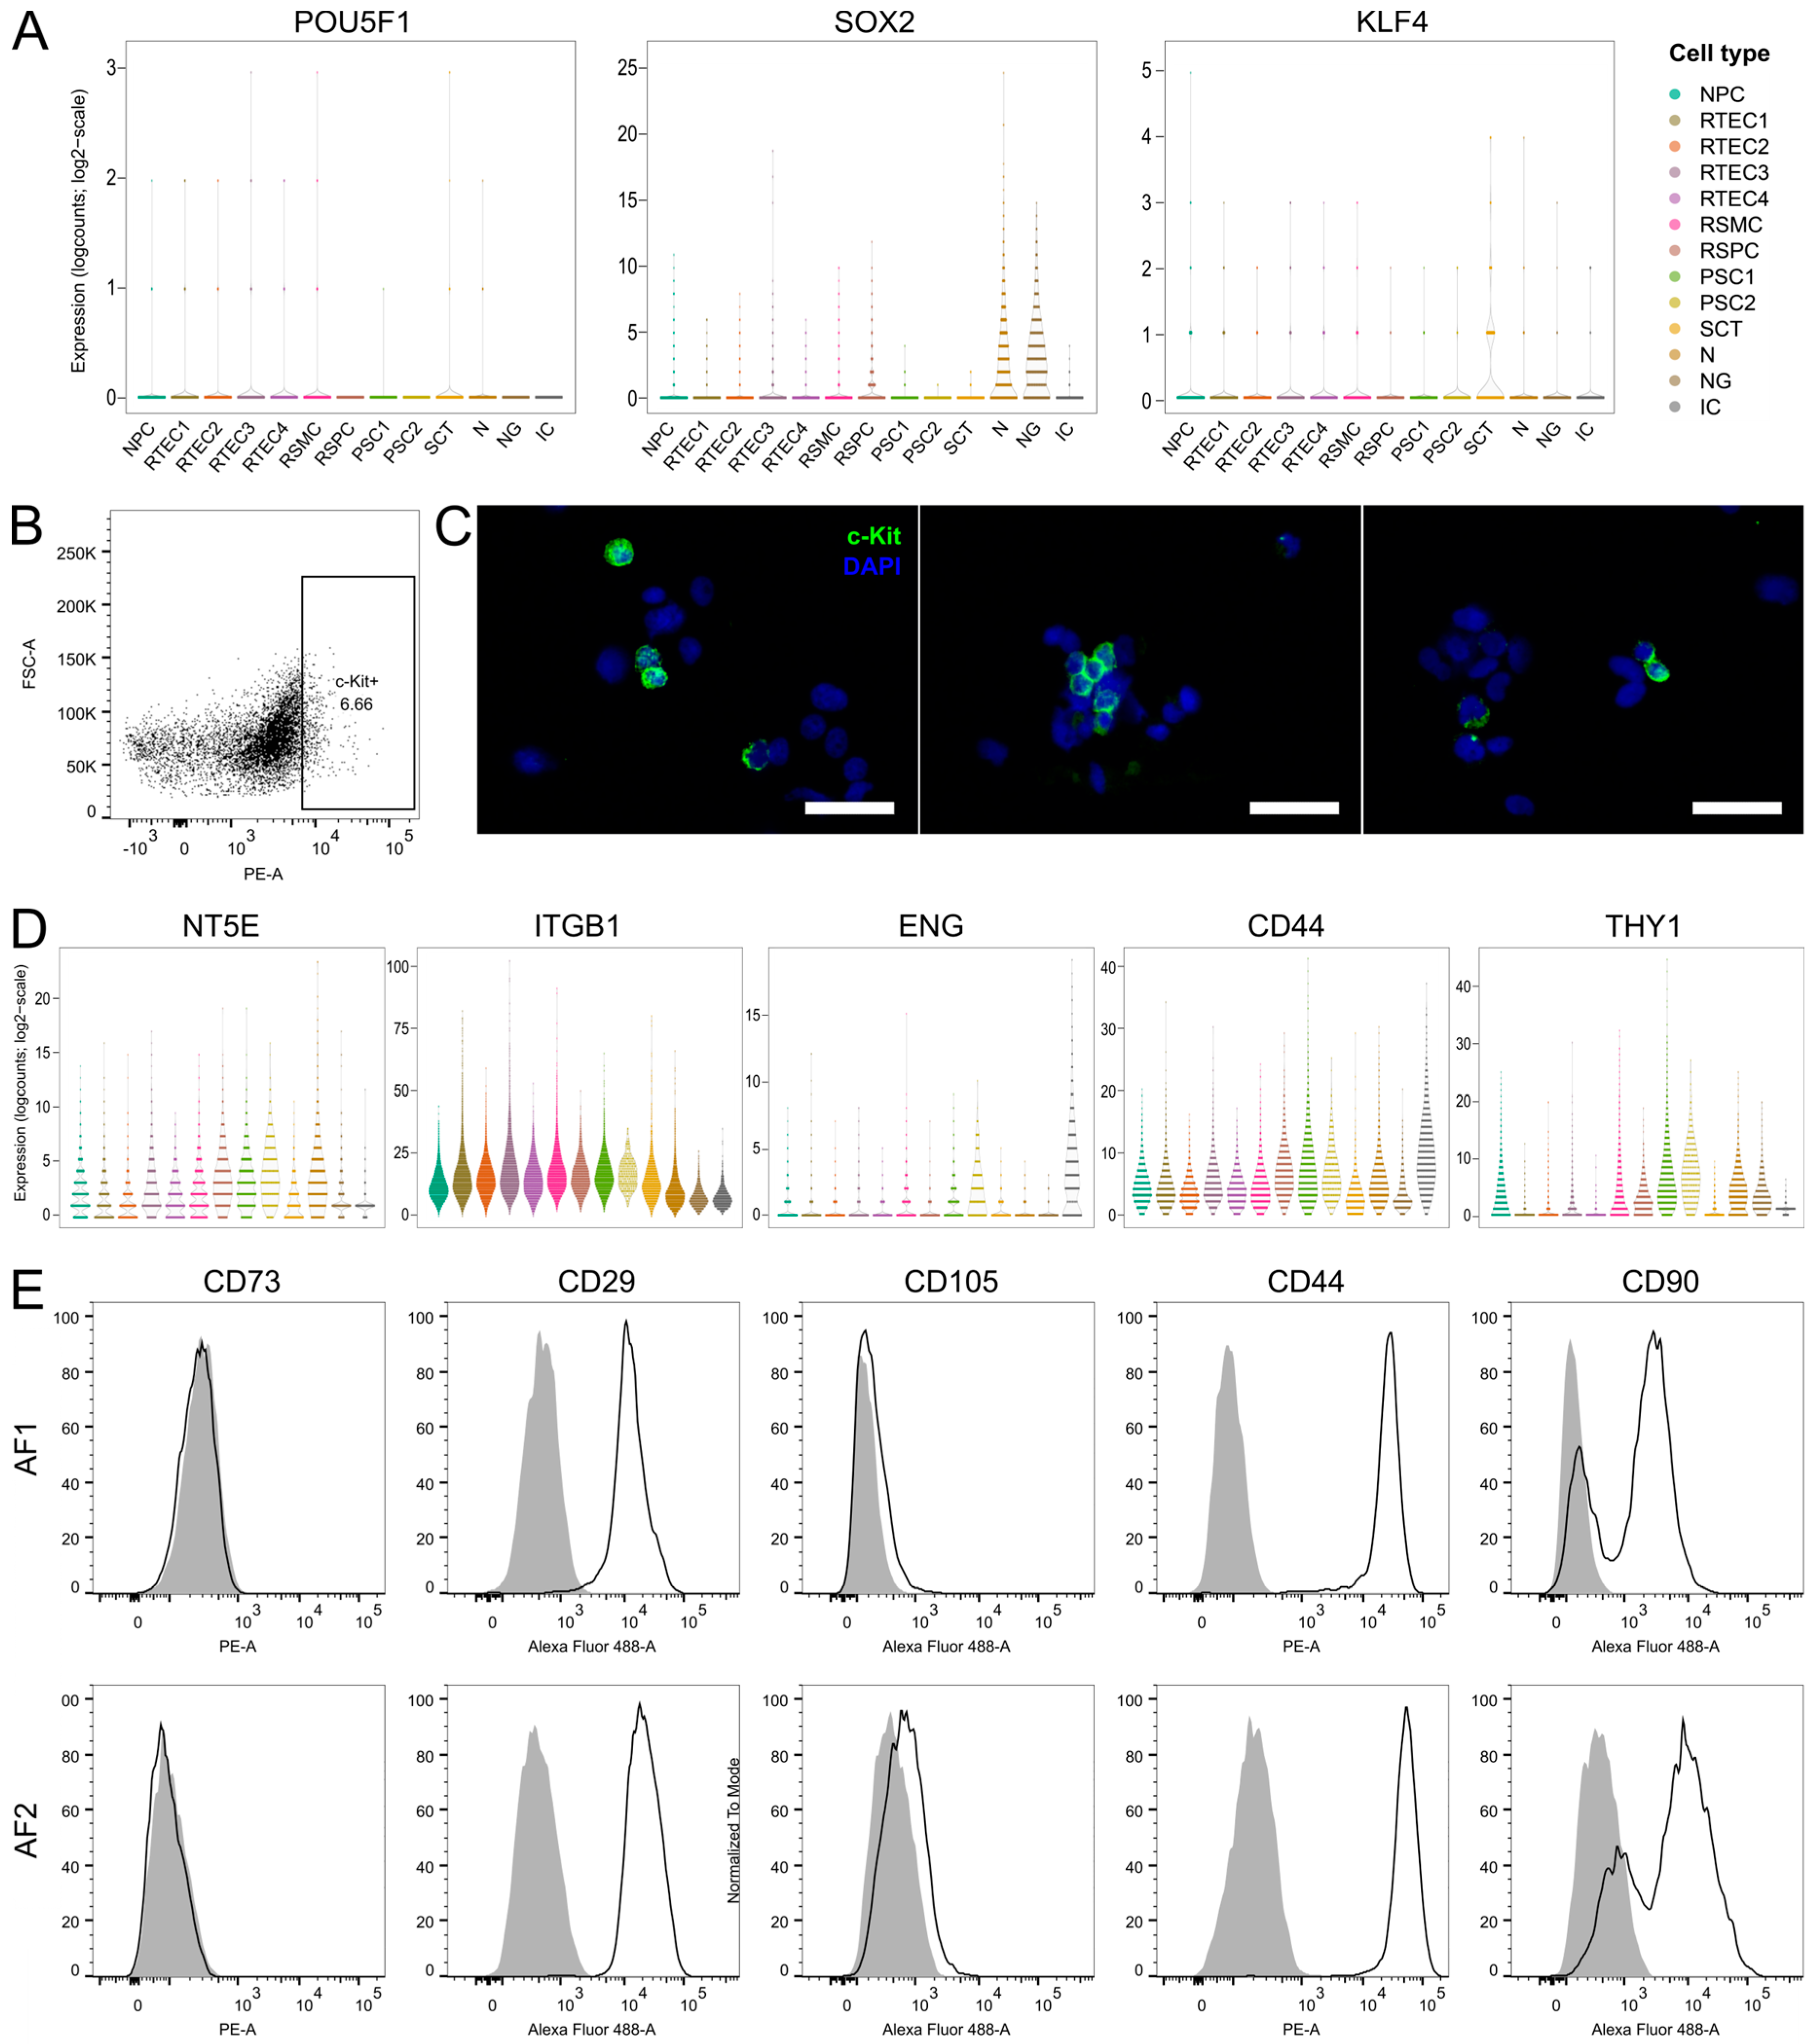
3.5. Investigation of Stem Cell Marker Expression in Cultured AF from Four Fetuses with SBA and one Healthy Fetus
4. Discussion
Limitations of This Study
5. Conclusions
Supplementary Materials
Author Contributions
Funding
Institutional Review Board Statement
Informed Consent Statement
Data Availability Statement
Acknowledgments
Conflicts of Interest
Study Approval
References
- Underwood, M.A.; Gilbert, W.M.; Sherman, M.P. Amniotic Fluid: Not Just Fetal Urine Anymore. J. Perinatol. 2005, 25, 341–348. [Google Scholar] [CrossRef] [PubMed] [Green Version]
- Fuchs, S.; Riis, P. Antenatal sex determination. Nature 1956, 177, 330. [Google Scholar] [CrossRef] [PubMed]
- Brace, R.A.; Cheung, C.Y.; Anderson, D.F. Regulation of amniotic fluid volume: Insights derived from amniotic fluid volume function curves. Am. J. Physiol. Integr. Comp. Physiol. 2018, 315, R777–R789. [Google Scholar] [CrossRef] [PubMed]
- Johnson, K.; Eason, J. Prenatal diagnosis of genetic disorders. Obstet. Gynaecol. Reprod. Med. 2018, 28, 308–313. [Google Scholar] [CrossRef]
- Nadler, H.L.; Gerbie, A.B. Role of Amniocentesis in the Intrauterine Detection of Genetic Disorders. N. Engl. J. Med. 1970, 282, 596–599. [Google Scholar] [CrossRef]
- Rennie, K.; Gruslin, A.; Hengstschläger, M.; Pei, D.; Cai, J.; Nikaido, T.; Bani-Yaghoub, M. Applications of Amniotic Membrane and Fluid in Stem Cell Biology and Regenerative Medicine. Stem Cells Int. 2012, 2012, 721538. [Google Scholar] [CrossRef]
- Bajek, A.; Olkowska, J.; Gurtowska, N.; Kloskowski, T.; Walentowicz-Sadlecka, M.; Sadlecki, P.; Grabiec, M.; Drewa, T. Human amniotic-fluid-derived stem cells: A unique source for regenerative medicine. Expert Opin. Biol. Ther. 2014, 14, 831–839. [Google Scholar] [CrossRef]
- Gosden, C.; Brock, D.J. Combined use of alphafetoprotein and amniotic fluid cell morphology in early prenatal diagnosis of fetal abnormalities. J. Med. Genet. 1978, 15, 262–270. [Google Scholar] [CrossRef] [Green Version]
- Nelson, M.M.; Emery, A.E.H. Amniotic Fluid Cell Cultures. J. Med. Genet. 1973, 10, 19–22. [Google Scholar] [CrossRef] [Green Version]
- Steele, M.W.; Breg, R.W. Chromosome analysis of human amniotic-fluid cells. Lancet 1966, 287, 383–385. [Google Scholar] [CrossRef]
- Gosden, C.; Brock, D. Morphology of Rapidly Adhering Amniotic-Fluid Cells as an Aid to the Diagnosis of Neural-Tube Defects. Lancet 1977, 309, 919–922. [Google Scholar] [CrossRef] [PubMed]
- Gosden, B.C.M. Amniotic Fluid Cell Types and Culture. Br. Med. Bull. 1983, 39, 348–354. [Google Scholar] [CrossRef] [PubMed]
- Loukogeorgakis, S.P.; De Coppi, P. Concise Review: Amniotic Fluid Stem Cells: The Known, the Unknown, and Potential Regenerative Medicine Applications. Stem Cells 2017, 35, 1663–1673. [Google Scholar] [CrossRef] [Green Version]
- Mosquera, A.; Fernández, J.L.; Campos, A.; Goyanes, V.J.; Ramiro-Díaz, J.; Gosálvez, J. Simultaneous decrease of telomere length and telomerase activity with ageing of human amniotic fluid cells. J. Med. Genet. 1999, 36, 494–496. [Google Scholar]
- Prusa, A.; Marton, E.; Rosner, M.; Bernaschek, G.; Hengstschläger, M. Oct-4-expressing cells in human amniotic fluid: A new source for stem cell research? Hum. Reprod. 2003, 18, 1489–1493. [Google Scholar] [CrossRef] [PubMed] [Green Version]
- Roubelakis, M.G.; Pappa, K.I.; Bitsika, V.; Zagoura, D.; Vlahou, A.; Papadaki, H.A.; Antsaklis, A.; Anagnou, N.P. Molecular and Proteomic Characterization of Human Mesenchymal Stem Cells Derived from Amniotic Fluid: Comparison to Bone Marrow Mesenchymal Stem Cells. Stem Cells Dev. 2007, 16, 931–952. [Google Scholar] [CrossRef] [PubMed] [Green Version]
- Tsai, M.-S.; Hwang, S.-M.; Tsai, Y.-L.; Cheng, F.-C.; Lee, J.-L.; Chang, Y.-J. Clonal Amniotic Fluid-Derived Stem Cells Express Characteristics of Both Mesenchymal and Neural Stem Cells1. Biol. Reprod. 2006, 74, 545–551. [Google Scholar] [CrossRef] [Green Version]
- Jezierski, A.; Gruslin, A.; Tremblay, R.; Ly, D.; Smith, C.; Turksen, K.; Sikorska, M.; Bani-Yaghoub, M. Probing Stemness and Neural Commitment in Human Amniotic Fluid Cells. Stem Cell Rev. Rep. 2010, 6, 199–214. [Google Scholar] [CrossRef]
- Cananzi, M.; De Coppi, P. CD117+ amniotic fluid stem cells. Organogenesis 2012, 8, 77–88. [Google Scholar] [CrossRef] [Green Version]
- Ditadi, A.; de Coppi, P.; Picone, O.; Gautreau, L.; Smati, R.; Six, E.; Bonhomme, D.; Ezine, S.; Frydman, R.; Cavazzana-Calvo, M.; et al. Human and murine amniotic fluid c-Kit+Lin− cells display hematopoietic activity. Blood 2009, 113, 3953–3960. [Google Scholar] [CrossRef] [Green Version]
- De Coppi, P.; Bartsch, G.; Siddiqui, M.; Xu, T.; Santos, C.C.; Perin, L.; Mostoslavsky, G.; Serre, A.C.; Snyder, E.Y.; Yoo, J.J.; et al. Isolation of amniotic stem cell lines with potential for therapy. Nat. Biotechnol. 2007, 25, 100–106. [Google Scholar] [CrossRef] [PubMed]
- Pozzobon, M.; Piccoli, M.; Schiavo, A.A.; Atala, A.; De Coppi, P. Isolation of c-Kit+ Human Amniotic Fluid Stem Cells from Second Trimester. Stem Cell Niche Methods Protoc. 2013, 1035, 191–198. [Google Scholar] [CrossRef]
- int Anker, P.S.; Scherjon, S.A.; Kleijburg-Van der Keur, C.; Noort, W.A.; Claas, F.H.; Willemze, R.; Fibbe, W.E.; Kanhai, H.H.H. Amniotic fluid as a novel source of mesenchymal stem cells for therapeutic transplantation. Blood 2003, 102, 1548–1549. [Google Scholar] [CrossRef] [PubMed]
- Tsai, M.; Lee, J.; Chang, Y.; Hwang, S. Isolation of human multipotent mesenchymal stem cells from second-trimester amniotic fluid using a novel two-stage culture protocol. Hum. Reprod. 2004, 19, 1450–1456. [Google Scholar] [CrossRef] [PubMed]
- Fauza, D. Amniotic fluid and placental stem cells. Best Pract. Res. Clin. Obstet. Gynaecol. 2004, 18, 877–891. [Google Scholar] [CrossRef]
- Harrell, C.R.; Gazdic, M.; Fellabaum, C.; Jovicic, N.; Djonov, V.; Arsenijevic, N.; Volarevic, V. Therapeutic Potential of Amniotic Fluid Derived Mesenchymal Stem Cells Based on their Differentiation Capacity and Immunomodulatory Properties. Curr. Stem Cell Res. Ther. 2019, 14, 327–336. [Google Scholar] [CrossRef]
- Joo, S.; Ko, I.K.; Atala, A.; Yoo, J.J.; Lee, S.J. Amniotic fluid-derived stem cells in regenerative medicine research. Arch. Pharmacal Res. 2012, 35, 271–280. [Google Scholar] [CrossRef]
- Vlahova, F.; Hawkins, K.E.; Ranzoni, A.M.; Hau, K.-L.; Sagar, R.; De Coppi, P.; David, A.L.; Adjaye, J.; Guillot, P.V. Human mid-trimester amniotic fluid (stem) cells lack expression of the pluripotency marker OCT4A. Sci. Rep. 2019, 9, 8126. [Google Scholar] [CrossRef] [Green Version]
- Hoehn, H.; Salk, D. Chapter 2. Morphological and Biochemical Heterogeneity of Amniotic Fluid Cells in Culture. Methods Cell Biol. 1982, 26, 11–34. [Google Scholar] [CrossRef]
- Davydova, D.A.; Vorotelyak, E.A.; Zinovieva, R.D.; Kabaeva, N.V.; Terskikh, V.V.; Vasiliev, A.V. Cell Phenotypes in human Amniotic Fluid. Acta Nat. 2009, 1, 98–103. [Google Scholar] [CrossRef] [Green Version]
- Roubelakis, M.G.; Trohatou, O.; Anagnou, N.P. Amniotic Fluid and Amniotic Membrane Stem Cells: Marker Discovery. Stem Cells Int. 2012, 2012, 107836. [Google Scholar] [CrossRef] [Green Version]
- Roubelakis, M.G.; Bitsika, V.; Zagoura, D.; Trohatou, O.; Pappa, K.I.; Makridakis, M.; Antsaklis, A.; Vlahou, A.; Anagnou, N.P. In vitro and in vivo properties of distinct populations of amniotic fluid mesenchymal progenitor cells. J. Cell. Mol. Med. 2010, 15, 1896–1913. [Google Scholar] [CrossRef] [Green Version]
- Parolini, O.; Soncini, M.; Evangelista, M.; Schmidt, D. Amniotic membrane and amniotic fluid-derived cells: Potential tools for regenerative medicine? Regen. Med. 2009, 4, 275–291. [Google Scholar] [CrossRef] [Green Version]
- Pipino, C.; Pierdomenico, L.; Di Tomo, P.; Di Giuseppe, F.; Cianci, E.; D’Alimonte, I.; Morabito, C.; Centurione, L.; Antonucci, I.; Mariggiò, M.A.; et al. Molecular and Phenotypic Characterization of Human Amniotic Fluid-Derived Cells: A Morphological and Proteomic Approach. Stem Cells Dev. 2015, 24, 1415–1428. [Google Scholar] [CrossRef] [PubMed]
- Bossolasco, P.; Montemurro, T.; Cova, L.; Zangrossi, S.; Calzarossa, C.; Buiatiotis, S.; Soligo, D.; Bosari, S.; Silani, V.; Deliliers, G.L.; et al. Molecular and phenotypic characterization of human amniotic fluid cells and their differentiation potential. Cell Res. 2006, 16, 329–336. [Google Scholar] [CrossRef] [PubMed] [Green Version]
- Ekblad, Å.; Qian, H.; Westgren, M.; Le Blanc, K.; Fossum, M.; Götherström, C. Amniotic Fluid—A Source for Clinical Therapeutics in the Newborn? Stem Cells Dev. 2015, 24, 1405–1414. [Google Scholar] [CrossRef]
- Tsai, M.-S.; Hwang, S.-M.; Chen, K.-D.; Lee, Y.-S.; Hsu, L.-W.; Chang, Y.-J.; Wang, C.-N.; Peng, H.-H.; Chang, Y.-L.; Chao, A.-S.; et al. Functional Network Analysis of the Transcriptomes of Mesenchymal Stem Cells Derived from Amniotic Fluid, Amniotic Membrane, Cord Blood, and Bone Marrow. Stem Cells 2007, 25, 2511–2523. [Google Scholar] [CrossRef] [PubMed]
- Casciaro, F.; Zia, S.; Forcato, M.; Zavatti, M.; Beretti, F.; Bertucci, E.; Zattoni, A.; Reschiglian, P.; Alviano, F.; Bonsi, L.; et al. Unravelling Heterogeneity of Amplified Human Amniotic Fluid Stem Cells Sub-Populations. Cells 2021, 10, 158. [Google Scholar] [CrossRef]
- Calió, M.; Gantenbein, B.; Egli, M.; Poveda, L.; Ille, F. The cellular composition of bovine coccygeal intervertebral discs: A comprehensive single-cell rnaseq analysis. Int. J. Mol. Sci. 2021, 22, 4917. [Google Scholar] [CrossRef]
- Germain, P.-L.; Lun, A.; Macnair, W.; Robinson, M.D. Doublet identification in single-cell sequencing data using scDblFinder. F1000Research 2021, 10, 979. [Google Scholar] [CrossRef]
- McCarthy, D.J.; Campbell, K.R.; Lun, A.T.L.; Wills, Q.F. Scater: Pre-processing, quality control, normalization and visualization of single-cell RNA-seq data in R. Bioinformatics 2017, 33, 1179–1186. [Google Scholar] [CrossRef] [PubMed] [Green Version]
- Hafemeister, C.; Satija, R. Normalization and variance stabilization of single-cell RNA-seq data using regularized negative binomial regression. Genome Biol. 2019, 20, 296. [Google Scholar] [CrossRef] [PubMed] [Green Version]
- Stuart, T.; Butler, A.; Hoffman, P.; Hafemeister, C.; Papalexi, E.; Mauck, W.M., III; Hao, Y.; Stoeckius, M.; Smibert, P.; Satija, R. Comprehensive Integration of Single-Cell Data. Cell 2019, 177, 1888–1902. [Google Scholar] [CrossRef]
- Satija, R.; Farrell, J.; Gennert, D.; Schier, A.F.; Regev, A. Spatial reconstruction of single-cell gene expression data. Nat. Biotechnol. 2015, 33, 495–502. [Google Scholar] [CrossRef] [Green Version]
- Macosko, E.Z.; Basu, A.; Satija, R.; Nemesh, J.; Shekhar, K.; Goldman, M.; Tirosh, I.; Bialas, A.R.; Kamitaki, N.; Martersteck, E.M.; et al. Highly Parallel Genome-wide Expression Profiling of Individual Cells Using Nanoliter Droplets. Cell 2015, 161, 1202–1214. [Google Scholar] [CrossRef] [PubMed] [Green Version]
- Lun, A.T.; McCarthy, D.J.; Marioni, J.C. A step-by-step workflow for low-level analysis of single-cell RNA-seq data with Bioconductor. F1000Research 2016, 5, 2122. [Google Scholar] [CrossRef] [PubMed] [Green Version]
- Badia-I.-Mompel, P.; Santiago, J.V.; Braunger, J.; Geiss, C.; Dimitrov, D.; Müller-Dott, S.; Taus, P.; Dugourd, A.; Holland, C.H.; Flores, R.O.R.; et al. decoupleR: Ensemble of computational methods to infer biological activities from omics data. Bioinform. Adv. 2022, 2, vbac016. [Google Scholar] [CrossRef] [PubMed]
- Yu, G.; Wang, L.-G.; Han, Y.; He, Q.-Y. clusterProfiler: An R Package for Comparing Biological Themes Among Gene Clusters. OMICS J. Integr. Biol. 2012, 16, 284–287. [Google Scholar] [CrossRef]
- Manegold-Brauer, G.; Kang, B.; Hahn, S.; De Geyter, C.; Buechel, J.; Hoesli, I.; Lapaire, O. A new era in prenatal care: Non-invasive prenatal testing in Switzerland. Swiss Med. Wkly. 2014, 144, w13915. [Google Scholar] [CrossRef]
- Bouchard, M.; Souabni, A.; Mandler, M.; Neubüser, A.; Busslinger, M. Nephric lineage specification by Pax2 and Pax8. Genes Dev. 2002, 16, 2958–2970. [Google Scholar] [CrossRef] [Green Version]
- Combes, A.N.; Zappia, L.; Er, P.X.; Oshlack, A.; Little, M.H. Single-cell analysis reveals congruence between kidney organoids and human fetal kidney. Genome Med. 2019, 11, 3. [Google Scholar] [CrossRef] [PubMed] [Green Version]
- Harder, J.L.; Menon, R.; Otto, E.A.; Zhou, J.; Eddy, S.; Wys, N.L.; O’connor, C.; Luo, J.; Nair, V.; Cebrian, C.; et al. Organoid single cell profiling identifies a transcriptional signature of glomerular disease. J. Clin. Investig. 2019, 4, e122697. [Google Scholar] [CrossRef] [PubMed] [Green Version]
- O’Brien, L.L.; Guo, Q.; Lee, Y.; Tran, T.; Benazet, J.-D.; Whitney, P.H.; Valouev, A.; McMahon, A.P. Differential regulation of mouse and human nephron progenitors by the Six family of transcriptional regulators. Development 2016, 143, 595–608. [Google Scholar] [CrossRef] [Green Version]
- Miao, Z.; Balzer, M.S.; Ma, Z.; Liu, H.; Wu, J.; Shrestha, R.; Aranyi, T.; Kwan, A.; Kondo, A.; Pontoglio, M.; et al. Single cell regulatory landscape of the mouse kidney highlights cellular differentiation programs and disease targets. Nat. Commun. 2021, 12, 2277. [Google Scholar] [CrossRef] [PubMed]
- Kume, T.; Deng, K.; Hogan, B.L.M. Murine forkhead/winged helix genes Foxc1 (Mf1) and Foxc2 (Mfh1) are required for the early organogenesis of the kidney and urinary tract. Development 2000, 127, 1387–1395. [Google Scholar] [CrossRef]
- Ide, S.; Finer, G.; Maezawa, Y.; Onay, T.; Souma, T.; Scott, R.; Ide, K.; Akimoto, Y.; Li, C.; Ye, M.; et al. Transcription Factor 21 Is Required for Branching Morphogenesis and Regulates the Gdnf-Axis in Kidney Development. J. Am. Soc. Nephrol. 2018, 29, 2795–2808. [Google Scholar] [CrossRef] [Green Version]
- Cargill, K.; Sims-Lucas, S. Metabolic requirements of the nephron. Pediatr. Nephrol. 2018, 35, 1–8. [Google Scholar] [CrossRef] [PubMed]
- Naiman, N.; Fujioka, K.; Fujino, M.; Valerius, M.T.; Potter, S.S.; McMahon, A.P.; Kobayashi, A. Repression of Interstitial Identity in Nephron Progenitor Cells by Pax2 Establishes the Nephron-Interstitium Boundary during Kidney Development. Dev. Cell 2017, 41, 349–365. [Google Scholar] [CrossRef] [Green Version]
- Torban, E.; Dziarmaga, A.; Iglesias, D.; Chu, L.L.; Vassilieva, T.; Little, M.; Eccles, M.; Discenza, M.; Pelletier, J.; Goodyer, P. PAX2 Activates WNT4 Expression during Mammalian Kidney Development. J. Biol. Chem. 2006, 281, 12705–12712. [Google Scholar] [CrossRef] [Green Version]
- Geering, K. FXYD proteins: New regulators of Na-K-ATPase. Am. J. Physiol. Physiol. 2006, 290, F241–F250. [Google Scholar] [CrossRef] [Green Version]
- Feraille, E.; Dizin, E. Coordinated Control of ENaC and Na+,K+-ATPase in Renal Collecting Duct. J. Am. Soc. Nephrol. 2016, 27, 2554–2563. [Google Scholar] [CrossRef] [Green Version]
- Nelson, T.R.; Kim, Y.; Michael, A.F.; Butkowskt, R.J.; Charonis, A.S. Tubulointerstitial Nephritis Antigen (TIN-ag) is Expresses in Distinct Segments of the Developing Human Nephron. Connect. Tissue Res. 1998, 37, 53–60. [Google Scholar] [CrossRef]
- Butkowski, R.J.; Kleppel, M.M.; Katz, A.; Michael, A.F.; Fish, A.J. Distribution of tubulointerstitial nephritis antigen and evidence for multiple forms. Kidney Int. 1991, 40, 838–846. [Google Scholar] [CrossRef] [PubMed] [Green Version]
- Zhou, B.; Nelson, T.R.; Kashtan, C.; Gleason, B.; Michael, A.F.; Vlassi, M.; Charonis, A.S. Identification of two alternatively spliced forms of Human Tubulointerstitial Nephritis Antigen (TIN-Ag). J. Am. Soc. Nephrol. 2000, 11, 658–668. [Google Scholar] [CrossRef] [PubMed]
- Bignon, Y.; Pinelli, L.; Frachon, N.; Lahuna, O.; Figueres, L.; Houillier, P.; Lourdel, S.; Teulon, J.; Paulais, M. Defective bicarbonate reabsorption in Kir4.2 potassium channel deficient mice impairs acid-base balance and ammonia excretion. Kidney Int. 2019, 97, 304–315. [Google Scholar] [CrossRef]
- Wells, C.D.; Fawcett, J.P.; Traweger, A.; Yamanaka, Y.; Goudreault, M.; Elder, K.; Kulkarni, S.; Gish, G.; Virag, C.; Lim, C.; et al. A Rich1/Amot Complex Regulates the Cdc42 GTPase and Apical-Polarity Proteins in Epithelial Cells. Cell 2006, 125, 535–548. [Google Scholar] [CrossRef] [Green Version]
- Delous, M.; Hellman, N.E.; Gaudé, H.-M.; Silbermann, F.; Le Bivic, A.; Salomon, R.; Antignac, C.; Saunier, S. Nephrocystin-1 and nephrocystin-4 are required for epithelial morphogenesis and associate with PALS1/PATJ and Par6. Hum. Mol. Genet. 2009, 18, 4711–4723. [Google Scholar] [CrossRef]
- Chambers, B.E.; Gerlach, G.F.; Clark, E.G.; Chen, K.H.; Levesque, A.E.; Leshchiner, I.; Goessling, W.; Wingert, R.A. Tfap2a is a novel gatekeeper of nephron differentiation during kidney development. Development 2019, 146, dev172387. [Google Scholar] [CrossRef] [Green Version]
- Tran, U.; Zakin, L.; Schweickert, A.; Agrawal, R.; Döger, R.; Blum, M.; De Robertis, E.M.; Wessely, O. The RNA-binding protein bicaudal C regulates polycystin 2 in the kidney by antagonizing miR-17 activity. Development 2010, 137, 1107–1116. [Google Scholar] [CrossRef] [Green Version]
- Fu, Y.; Kim, I.; Lian, P.; Li, A.; Zhou, L.; Li, C.; Liang, D.; Coffey, R.J.; Ma, J.; Zhao, P.; et al. Loss of Bicc1 impairs tubulomorphogenesis of cultured IMCD cells by disrupting E-cadherin-based cell-cell adhesion. Eur. J. Cell Biol. 2010, 89, 428–436. [Google Scholar] [CrossRef] [Green Version]
- Girard, C.; Barbier, O.; Veilleux, G.; El-Alfy, M.; Bélanger, A. Human Uridine Diphosphate-Glucuronosyltransferase UGT2B7 Conjugates Mineralocorticoid and Glucocorticoid Metabolites. Endocrinology 2003, 144, 2659–2668. [Google Scholar] [CrossRef] [Green Version]
- Du, P.; Ye, L.; Li, H.; Yang, Y.; Jiang, W. The tumour suppressive role of metastasis suppressor-1, MTSS1, in human kidney cancer, a possible connection with the SHH pathway. J. Exp. Ther. Oncol. 2012, 10, 91–99. [Google Scholar] [PubMed]
- Schueler, M.; Braun, D.A.; Chandrasekar, G.; Gee, H.Y.; Klasson, T.D.; Halbritter, J.; Bieder, A.; Porath, J.D.; Airik, R.; Zhou, W.; et al. DCDC2 Mutations Cause a Renal-Hepatic Ciliopathy by Disrupting Wnt Signaling. Am. J. Hum. Genet. 2014, 96, 81–92. [Google Scholar] [CrossRef] [PubMed] [Green Version]
- Gewin, L.S. Sugar or Fat? Renal Tubular Metabolism Reviewed in Health and Disease. Nutrients 2021, 13, 1580. [Google Scholar] [CrossRef] [PubMed]
- Menon, R.; Otto, E.A.; Kokoruda, A.; Zhou, J.; Zhang, Z.; Yoon, E.; Chen, Y.-C.; Troyanskaya, O.; Spence, J.R.; Kretzler, M.; et al. Single-cell analysis of progenitor cell dynamics and lineage specification in the human fetal kidney. Development 2018, 145, dev164038. [Google Scholar] [CrossRef] [PubMed] [Green Version]
- Chung, J.-J.; Goldstein, L.; Chen, Y.-J.J.; Lee, J.; Webster, J.D.; Roose-Girma, M.; Paudyal, S.C.; Modrusan, Z.; Dey, A.; Shaw, A.S. Single-Cell Transcriptome Profiling of the Kidney Glomerulus Identifies Key Cell Types and Reactions to Injury. J. Am. Soc. Nephrol. 2020, 31, 2341–2354. [Google Scholar] [CrossRef] [PubMed]
- Hueber, P.-A.; Fukuzawa, R.; Elkares, R.; Chu, L.; Blumentkrantz, M.; He, S.-J.; Anaka, M.R.; Reeve, A.E.; Eccles, M.; Jabado, N.; et al. PAX3 is Expressed in the Stromal Compartment of the Developing Kidney and in Wilms Tumors with Myogenic Phenotype. Pediatr. Dev. Pathol. 2009, 12, 347–354. [Google Scholar] [CrossRef]
- Schwab, K.; Patterson, L.T.; Aronow, B.J.; Luckas, R.; Liang, H.-C.; Potter, S.S. A catalogue of gene expression in the developing kidney. Kidney Int. 2003, 64, 1588–1604. [Google Scholar] [CrossRef] [Green Version]
- Kispert, A. T-Box Genes in the Kidney and Urinary Tract. Curr. Top. Dev. Biol. 2017, 122, 245–278. [Google Scholar] [CrossRef]
- Bernal, A.; Arranz, L. Nestin-expressing progenitor cells: Function, identity and therapeutic implications. Cell. Mol. Life Sci. 2018, 75, 2177–2195. [Google Scholar] [CrossRef] [Green Version]
- Schaefer, T.; Lengerke, C. SOX2 protein biochemistry in stemness, reprogramming, and cancer: The PI3K/AKT/SOX2 axis and beyond. Oncogene 2019, 39, 278–292. [Google Scholar] [CrossRef] [PubMed] [Green Version]
- Matsumata, M.; Sakayori, N.; Maekawa, M.; Owada, Y.; Yoshikawa, T.; Osumi, N. The Effects of Fabp7 and Fabp5 on Postnatal Hippocampal Neurogenesis in the Mouse. Stem Cells 2012, 30, 1532–1543. [Google Scholar] [CrossRef] [PubMed]
- Avraham, O.; Deng, P.-Y.; Jones, S.; Kuruvilla, R.; Semenkovich, C.F.; Klyachko, V.A.; Cavalli, V. Satellite glial cells promote regenerative growth in sensory neurons. Nat. Commun. 2020, 11, 4891. [Google Scholar] [CrossRef] [PubMed]
- Sakurai, T. The role of NrCAM in neural development and disorders—Beyond a simple glue in the brain. Mol. Cell. Neurosci. 2012, 49, 351–363. [Google Scholar] [CrossRef] [PubMed]
- Paratcha, G.; Ledda, F.; Ibáñez, C.F. The Neural Cell Adhesion Molecule NCAM Is an Alternative Signaling Receptor for GDNF Family Ligands. Cell 2003, 113, 867–879. [Google Scholar] [CrossRef] [PubMed] [Green Version]
- Jarvela, T.S.; Lam, H.A.; Helwig, M.; Lorenzen, N.; Otzen, D.E.; McLean, P.J.; Maidment, N.T.; Lindberg, I. The neural chaperone proSAAS blocks α-synuclein fibrillation and neurotoxicity. Proc. Natl. Acad. Sci. USA 2016, 113, E4708–E4715. [Google Scholar] [CrossRef] [Green Version]
- Willemsen, M.H.; Ba, W.; Wissink-Lindhout, W.M.; de Brouwer, A.P.M.; Haas, S.A.; Bienek, M.; Hu, H.; Vissers, L.E.L.M.; van Bokhoven, H.; Kalscheuer, V.; et al. Involvement of the kinesin family members KIF4A and KIF5C in intellectual disability and synaptic function. J. Med. Genet. 2014, 51, 487–494. [Google Scholar] [CrossRef] [Green Version]
- Shen, W.; Willis, D.; Zhang, Y.; Schlattner, U.; Wallimann, T.; Molloy, G.R. Expression of creatine kinase isoenzyme genes during postnatal development of rat brain cerebellum: Evidence for transcriptional regulation. Biochem. J. 2002, 367, 369–380. [Google Scholar] [CrossRef]
- Chung, D.; Shum, A.; Caraveo, G. GAP-43 and BASP1 in Axon Regeneration: Implications for the Treatment of Neurodegenerative Diseases. Front. Cell Dev. Biol. 2020, 8, 567537. [Google Scholar] [CrossRef]
- Shinmyo, Y.; Riyadh, M.A.; Ahmed, G.; Bin Naser, I.; Hossain, M.; Takebayashi, H.; Kawasaki, H.; Ohta, K.; Tanaka, H. Draxin from neocortical neurons controls the guidance of thalamocortical projections into the neocortex. Nat. Commun. 2015, 6, 10232. [Google Scholar] [CrossRef] [Green Version]
- Gaitanou, M.; Segklia, K.; Matsas, R. Cend1, a Story with Many Tales: From Regulation of Cell Cycle Progression/Exit of Neural Stem Cells to Brain Structure and Function. Stem Cells Int. 2019, 2019, 2054783. [Google Scholar] [CrossRef] [PubMed] [Green Version]
- Mills, A.; Gago, F. On the Need to Tell Apart Fraternal Twins eEF1A1 and eEF1A2, and Their Respective Outfits. Int. J. Mol. Sci. 2021, 22, 6973. [Google Scholar] [CrossRef] [PubMed]
- Khalil, M.; Teunissen, C.E.; Otto, M.; Piehl, F.; Sormani, M.P.; Gattringer, T.; Barro, C.; Kappos, L.; Comabella, M.; Fazekas, F.; et al. Neurofilaments as biomarkers in neurological disorders. Nat. Rev. Neurol. 2018, 14, 577–589. [Google Scholar] [CrossRef] [PubMed]
- Doll, T.; Meichsner, M.; Riederer, B.; Honegger, P.; Matus, A. An isoform of microtubule-associated protein 2 (MAP2) containing four repeats of the tubulin-binding motif. J. Cell Sci. 1993, 106, 633–639. [Google Scholar] [CrossRef] [PubMed]
- Donato, R.; Sorci, G.; Riuzzi, F.; Arcuri, C.; Bianchi, R.; Brozzi, F.; Tubaro, C.; Giambanco, I. S100B’s double life: Intracellular regulator and extracellular signal. Biochim. Biophys. Acta Mol. Cell Res. 2009, 1793, 1008–1022. [Google Scholar] [CrossRef] [Green Version]
- Lu, S.; Guo, Y.-S.; Liang, P.-Z.; Zhang, S.-Z.; Yin, S.; Yin, Y.-Q.; Wang, X.-M.; Ding, F.; Gu, X.-S.; Zhou, J.-W. Suppression of astrocytic autophagy by αB-crystallin contributes to α-synuclein inclusion formation. Transl. Neurodegener. 2019, 8, 3. [Google Scholar] [CrossRef]
- Kelley, K.W.; Nakao-Inoue, H.; Molofsky, A.V.; Oldham, M.C. Variation among intact tissue samples reveals the core transcriptional features of human CNS cell classes. Nat. Neurosci. 2018, 21, 1171–1184. [Google Scholar] [CrossRef]
- McClain, C.R.; Sim, F.J.; Goldman, S.A. Pleiotrophin Suppression of Receptor Protein Tyrosine Phosphatase-β/ζ Maintains the Self-Renewal Competence of Fetal Human Oligodendrocyte Progenitor Cells. J. Neurosci. 2012, 32, 15066–15075. [Google Scholar] [CrossRef] [Green Version]
- Li, X.; Liu, G.; Yang, L.; Li, Z.; Zhang, Z.; Xu, Z.; Cai, Y.; Du, H.; Su, Z.; Wang, Z.; et al. Decoding Cortical Glial Cell Development. Neurosci. Bull. 2021, 37, 440–460. [Google Scholar] [CrossRef]
- Zieba, J.; Miller, A.; Gordiienko, O.; Smith, G.M.; Krynska, B. Clusters of amniotic fluid cells and their associated early neuroepithelial markers in experimental myelomeningocele: Correlation with astrogliosis. PLoS ONE 2017, 12, e0174625. [Google Scholar] [CrossRef] [Green Version]
- Polgár, K.; Adány, R.; Abel, G.; Kappelmayer, J.; Muszbek, L.; Papp, Z. Characterization of rapidly adhering amniotic fluid cells by combined immunofluorescence and phagocytosis assays. Am. J. Hum. Genet. 1989, 45, 786–792. [Google Scholar]
- Turner, C.G.; Klein, J.D.; Wang, J.; Thakor, D.; Benedict, D.; Ahmed, A.; Teng, Y.D.; Fauza, D.O. The Amniotic Fluid As a Source of Neural Stem Cells in the Setting of Experimental Neural Tube Defects. Stem Cells Dev. 2013, 22, 548–553. [Google Scholar] [CrossRef] [PubMed]
- Lee, C.Q.; Gardner, L.; Turco, M.; Zhao, N.; Murray, M.J.; Coleman, N.; Rossant, J.; Hemberger, M.; Moffett, A. What Is Trophoblast? A Combination of Criteria Define Human First-Trimester Trophoblast. Stem Cell Rep. 2016, 6, 257–272. [Google Scholar] [CrossRef] [PubMed] [Green Version]
- Krendl, C.; Shaposhnikov, D.; Rishko, V.; Ori, C.; Ziegenhain, C.; Sass, S.; Simon, L.; Müller, N.S.; Straub, T.; Brooks, K.E.; et al. GATA2/3-TFAP2A/C transcription factor network couples human pluripotent stem cell differentiation to trophectoderm with repression of pluripotency. Proc. Natl. Acad. Sci. USA 2017, 114, E9579–E9588. [Google Scholar] [CrossRef] [PubMed] [Green Version]
- Kwak, Y.-T.; Muralimanoharan, S.A.; Gogate, A.; Mendelson, C.R. Human Trophoblast Differentiation Is Associated with Profound Gene Regulatory and Epigenetic Changes. Endocrinology 2019, 160, 2189–2203. [Google Scholar] [CrossRef]
- Goldenberg, D.M.; Stein, R.; Sharkey, R.M. The emergence of trophoblast cell-surface antigen 2 (TROP-2) as a novel cancer target. Oncotarget 2018, 9, 28989–29006. [Google Scholar] [CrossRef] [PubMed] [Green Version]
- Hu, K.-L.; Chang, H.-M.; Zhao, H.-C.; Yu, Y.; Li, R.; Qiao, J. Potential roles for the kisspeptin/kisspeptin receptor system in implantation and placentation. Hum. Reprod. Update 2018, 25, 326–343. [Google Scholar] [CrossRef] [PubMed] [Green Version]
- Mori, M.; Ishikawa, G.; Luo, S.-S.; Mishima, T.; Goto, T.; Robinson, J.M.; Matsubara, S.; Takeshita, T.; Kataoka, H.; Takizawa, T. The Cytotrophoblast Layer of Human Chorionic Villi Becomes Thinner but Maintains Its Structural Integrity During Gestation1. Biol. Reprod. 2007, 76, 164–172. [Google Scholar] [CrossRef] [PubMed]
- Chen, H.; Williams, K.E.; Kwan, E.Y.; Kapidzic, M.; Puckett, K.A.; Aburajab, R.K.; Robinson, J.F.; Fisher, S.J. Global proteomic analyses of human cytotrophoblast differentiation/invasion. Development 2021, 148, dev199561. [Google Scholar] [CrossRef]
- Abou-Kheir, W.; Eid, A.; El-Merahbi, R.; Assaf, R.; Daoud, G. A Unique Expression of Keratin 14 in a Subset of Trophoblast Cells. PLoS ONE 2015, 10, e0139939. [Google Scholar] [CrossRef] [Green Version]
- Gauster, M.; Blaschitz, A.; Siwetz, M.; Huppertz, B. Keratins in the human trophoblast. Histol. Histopathol. 2013, 28, 817–825. [Google Scholar] [CrossRef]
- Ashar-Patel, A.; Kaymaz, Y.; Rajakumar, A.; Bailey, J.A.; Karumanchi, S.A.; Moore, M.J. FLT1 and transcriptome-wide polyadenylation site (PAS) analysis in preeclampsia. Sci. Rep. 2017, 7, 12139. [Google Scholar] [CrossRef] [PubMed] [Green Version]
- Lawrence, J.B.; Oxvig, C.; Overgaard, M.T.; Sottrup-Jensen, L.; Gleich, G.J.; Hays, L.G.; Yates, J.R.; Conover, C.A. The insulin-like growth factor (IGF)-dependent IGF binding protein-4 protease secreted by human fibroblasts is pregnancy-associated plasma protein-A. Proc. Natl. Acad. Sci. USA 1999, 96, 3149–3153. [Google Scholar] [CrossRef] [PubMed] [Green Version]
- Qi, J.H.; Ebrahem, Q.; Moore, N.; Murphy, G.; Claesson-Welsh, L.; Bond, M.; Baker, A.; Anand-Apte, B. A novel function for tissue inhibitor of metalloproteinases-3 (TIMP3): Inhibition of angiogenesis by blockage of VEGF binding to VEGF receptor-2. Nat. Med. 2003, 9, 407–415. [Google Scholar] [CrossRef]
- Lu, X.; He, Y.; Zhu, C.; Wang, H.; Chen, S.; Lin, H.-Y. Twist1 is involved in trophoblast syncytialization by regulating GCM1. Placenta 2016, 39, 45–54. [Google Scholar] [CrossRef] [PubMed]
- Marinić, M.; Mika, K.; Chigurupati, S.; Lynch, V.J. Evolutionary transcriptomics implicates HAND2 in the origins of implantation and regulation of gestation length. eLife 2021, 10, e61257. [Google Scholar] [CrossRef] [PubMed]
- Leitinger, B. Discoidin Domain Receptor Functions in Physiological and Pathological Conditions. Int. Rev. Cell Mol. Biol. 2014, 310, 39–87. [Google Scholar] [CrossRef] [Green Version]
- Strutz, F.; Okada, H.; Lo, C.W.; Danoff, T.; Carone, R.L.; Tomaszewski, J.E.; Neilson, E.G. Identification and characterization of a fibroblast marker: FSP1. J. Cell Biol. 1995, 130, 393–405. [Google Scholar] [CrossRef] [Green Version]
- Zheng, S.-L.; Li, Z.-Y.; Song, J.; Liu, J.-M.; Miao, C.-Y. Metrnl: A secreted protein with new emerging functions. Acta Pharmacol. Sin. 2016, 37, 571–579. [Google Scholar] [CrossRef] [Green Version]
- Spessotto, P.; Bulla, R.; Danussi, C.; Radillo, O.; Cervi, M.; Monami, G.; Bossi, F.; Tedesco, F.; Doliana, R.; Colombatti, A. EMILIN1 represents a major stromal element determining human trophoblast invasion of the uterine wall. J. Cell Sci. 2006, 119, 4574–4584. [Google Scholar] [CrossRef] [Green Version]
- Li, Y.; Liang, J.; Yang, T.; Mena, J.M.; Huan, C.; Xie, T.; Kurkciyan, A.; Liu, N.; Jiang, D.; Noble, P.W. Hyaluronan synthase 2 regulates fibroblast senescence in pulmonary fibrosis. Matrix Biol. 2016, 55, 35–48. [Google Scholar] [CrossRef] [PubMed]
- Lagoutte, P.; Bettler, E.; Goff, S.V.-L.; Moali, C. Procollagen C-proteinase enhancer-1 (PCPE-1), a potential biomarker and therapeutic target for fibrosis. Matrix Biol. Plus 2021, 11, 100062. [Google Scholar] [CrossRef] [PubMed]
- Graham, V.; Khudyakov, J.; Ellis, P.; Pevny, L. SOX2 Functions to Maintain Neural Progenitor Identity. Neuron 2003, 39, 749–765. [Google Scholar] [CrossRef] [PubMed] [Green Version]
- Ghaleb, A.M.; Yang, V.W. Krüppel-like factor 4 (KLF4): What we currently know. Gene 2017, 611, 27–37. [Google Scholar] [CrossRef]
- Maleki, M.; Ghanbarvand, F.; Behvarz, M.R.; Ejtemaei, M.; Ghadirkhomi, E. Comparison of Mesenchymal Stem Cell Markers in Multiple Human Adult Stem Cells. Int. J. Stem Cells 2014, 7, 118–126. [Google Scholar] [CrossRef] [Green Version]
- Dominici, M.; Le Blanc, K.; Mueller, I.; Slaper-Cortenbach, I.; Marini, F.C.; Krause, D.S.; Deans, R.J.; Keating, A.; Prockop, D.J.; Horwitz, E.M. Minimal criteria for defining multipotent mesenchymal stromal cells. The International Society for Cellular Therapy position statement. Cytotherapy 2006, 8, 315–317. [Google Scholar] [CrossRef]
- Arcolino, F.O.; Zia, S.; Held, K.; Papadimitriou, E.; Theunis, K.; Bussolati, B.; Raaijmakers, A.; Allegaert, K.; Voet, T.; Deprest, J.; et al. Urine of Preterm Neonates as a Novel Source of Kidney Progenitor Cells. J. Am. Soc. Nephrol. 2016, 27, 2762–2770. [Google Scholar] [CrossRef] [Green Version]
- Arcolino, F.O.; Piella, A.T.; Papadimitriou, E.; Bussolati, B.; Antonie, D.J.; Murray, P.; Heuvel, L.V.D.; Levtchenko, E. Human Urine as a Noninvasive Source of Kidney Cells. Stem Cells Int. 2015, 2015, 362562. [Google Scholar] [CrossRef] [Green Version]
- Da Sacco, S.; Lemley, K.V.; Sedrakyan, S.; Zanusso, I.; Petrosyan, A.; Peti-Peterdi, J.; Burford, J.; De Filippo, R.E.; Perin, L. A Novel Source of Cultured Podocytes. PLoS ONE 2013, 8, e81812. [Google Scholar] [CrossRef] [Green Version]
- Rahman, S.; Spitzhorn, L.-S.; Wruck, W.; Hagenbeck, C.; Balan, P.; Graffmann, N.; Bohndorf, M.; Ncube, A.; Guillot, P.V.; Fehm, T.; et al. The presence of human mesenchymal stem cells of renal origin in amniotic fluid increases with gestational time. Stem Cell Res. Ther. 2018, 9, 113. [Google Scholar] [CrossRef]
- Janik, K.; Manire, M.A.; Smith, G.M.; Krynska, B. Spinal Cord Injury in Myelomeningocele: Prospects for Therapy. Front. Cell. Neurosci. 2020, 14, 201. [Google Scholar] [CrossRef] [PubMed]
- Kabu, S.; Gao, Y.; Kwon, B.K.; Labhasetwar, V. Drug delivery, cell-based therapies, and tissue engineering approaches for spinal cord injury. J. Control. Release 2015, 219, 141–154. [Google Scholar] [CrossRef] [PubMed] [Green Version]


Disclaimer/Publisher’s Note: The statements, opinions and data contained in all publications are solely those of the individual author(s) and contributor(s) and not of MDPI and/or the editor(s). MDPI and/or the editor(s) disclaim responsibility for any injury to people or property resulting from any ideas, methods, instructions or products referred to in the content. |
© 2023 by the authors. Licensee MDPI, Basel, Switzerland. This article is an open access article distributed under the terms and conditions of the Creative Commons Attribution (CC BY) license (https://creativecommons.org/licenses/by/4.0/).
Share and Cite
Dasargyri, A.; González Rodríguez, D.; Rehrauer, H.; Reichmann, E.; Biedermann, T.; Moehrlen, U. scRNA-Seq of Cultured Human Amniotic Fluid from Fetuses with Spina Bifida Reveals the Origin and Heterogeneity of the Cellular Content. Cells 2023, 12, 1577. https://doi.org/10.3390/cells12121577
Dasargyri A, González Rodríguez D, Rehrauer H, Reichmann E, Biedermann T, Moehrlen U. scRNA-Seq of Cultured Human Amniotic Fluid from Fetuses with Spina Bifida Reveals the Origin and Heterogeneity of the Cellular Content. Cells. 2023; 12(12):1577. https://doi.org/10.3390/cells12121577
Chicago/Turabian StyleDasargyri, Athanasia, Daymé González Rodríguez, Hubert Rehrauer, Ernst Reichmann, Thomas Biedermann, and Ueli Moehrlen. 2023. "scRNA-Seq of Cultured Human Amniotic Fluid from Fetuses with Spina Bifida Reveals the Origin and Heterogeneity of the Cellular Content" Cells 12, no. 12: 1577. https://doi.org/10.3390/cells12121577