Article

Mitochondrial Genome of Strophopteryx fasciata (Plecoptera: Taeniopterygidae), with a Phylogenetic Analysis of Nemouroidea

1
Henan International Joint Laboratory of Taxonomy and Systematic Evolution of Insecta, Henan Institute of Science and Technology, Xinxiang 453003, China
2
Plant Protection Institute, Centre for Agricultural Research, Hungarian Academy of Sciences, Herman Ottó út 15, H-1022 Budapest, Hungary
3
Department of Zoology, Hungarian Natural History Museum, Baross u. 13, H-1088 Budapest, Hungary
*
Author to whom correspondence should be addressed.
These authors contributed equally to this work.
Genes 2022, 13(7), 1116; https://doi.org/10.3390/genes13071116
Submission received: 24 May 2022 / Revised: 17 June 2022 / Accepted: 21 June 2022 / Published: 22 June 2022
(This article belongs to the Special Issue Phylogeny and Genetic Diversity of Insects)

Abstract

:
Taeniopterygidae is a medium-sized family of stoneflies. The phylogeny of Taeniopterygidae was widely accepted based on the morphological analyses. However, there are different opinions based on molecular data. To date, only two taeniopterygid mitochondrial genomes (mitogenomes) were available, and more sampling is needed to obtain precise phylogenetic relationships. In this research, the Strophopteryx fasciata mitogenome was sequenced and analyzed. The complete mitogenome of S. fasciata was 15,527 bp in length and contained 37 genes and a non-coding control region. Among taeniopterygid mitogenomes, the length variation was minimal in protein-coding genes (PCGs), transfer RNA genes (tRNAs) and ribosomal RNA genes (rRNAs), but very different in the control region. Similar to mitogenomes of other taeniopterygid species, the S. fasciata mitogenome was consistently AT biased and displayed positive AT- and negative GC-skews of the whole mitogenome. Most PCGs used ATN as the start codon and TAA/TAG as the stop codon. The stop codons were far less variable than the start codons in taeniopterygid mitogenomes. All Ka/Ks ratios were less than 1, indicating the presence of purifying selection in these genes. The secondary structures of transfer and ribosomal RNA genes of S. fasciata mitogenome are highly conserved with other taeniopterygid species. In the control region of the S. fasciata mitogenome, some essential elements (tandem repeats, stem–loop structures, and poly−N stretch, etc.) were observed. Two phylogenetic trees were inferred from Bayesian inference (BI) and Maximum Likelihood (ML) methods generated the identical topology across the PCGR dataset. The relationships of five families in Nemouroidea were recovered as Leuctridae + ((Capniidae + Taeniopterygidae) + (Nemouridae + Notonemouridae)). These results will help us understand the mitogenome structure of taeniopterygid species and the evolutionary relationship within Plecoptera.

1. Introduction

Taeniopterygidae is a medium-sized family of stoneflies (Plecoptera) consisting of about 75 species with Holarctic distribution [1,2]. They are found in all sizes of streams but are probably most species rich in larger ones [1]. Currently, the most widely accepted classification system of stonefly was proposed by Zwick (2000) based on the morphological analyses [2]. In Zwick’s (2000) study, Taeniopterygidae and other four families (Capniidae, Leuctridae, Nemouridae and Notonemouridae) were assigned to the superfamily Nemouroidea [2]. The family Taeniopterygidae can be easily distinguished with other Nemouroidea families by the elongated second tarsal segment [3]. At the family level, the Taeniopterygidae is recognized as monophyletic, and is placed as the most basal lineage of Nemouroidea [2]. However, there are different opinions based on molecular data. Based on 18S sequence data, Thomas et al. supported Nemouridae as the earliest branch within Plecoptera [4]. Terry used six molecular markers to construct the phylogeny of Plecoptera [5]. The results supported the basal position of Leuctridae and the sister-group relationship of Taeniopterygidae and Scopuridae [5]. In addition, based on transcriptome data, Davis listed Taeniopterygidae and Capniidae as sister families [6]. This result was also supported by most mitochondrial genomic studies [7,8,9,10,11,12]. Recently, South et al. recovered the phylogeny of the North American Plecoptera using sequences of single-copy orthologous genes selected from transcriptomes [13]. However, inconsistent relationships of Taeniopterygidae were generated from the analysis of different datasets [13].
Currently, mitochondrial genomes (mitogenomes) are commonly employed for phylogenetic analysis of insect lineages because of their maternal inheritance, rare recombination, relatively high evolutionary rate, and conserved gene components [14,15,16]. With the development of next-generation sequencing technologies, large numbers of mitogenomes have been extensively employed to resolve deep-level phylogenetic relationships [17,18,19].
To date, there are 86 complete or near complete plecopteran mitogenomes available in GenBank (as of May 2022). Among these sequences, however, only two complete mitogenomes representing the Taeniopterygidae were available. Relevant phylogenetic studies have been carried out to investigate the molecular phylogenetic relationships among stoneflies. However, taxon sampling in these studies has been limited and is not enough to obtain precise phylogenetic relationships within Nemouroidea.
In this study, the complete mitogenome of Strophopteryx fasciata was sequenced. The mitochondrial genomic structure and composition, such as gene content and RNA secondary structure, were also compared with other taeniopterygid mitogenomes. Furthermore, the phylogeny of Nemouroidea was reconstructed using published mitogenomes along with this newly sequenced mitogenome. The results will help us understand the evolutionary relationship within Plecoptera.

2. Materials and Methods

2.1. Sample Collection, DNA Extraction and Sequencing

Specimens of S. fasciata were collected from Putnam County in Georgia, USA. Specimens were preserved in 100% ethanol and stored at −20 °C. Total genomic DNA was extracted from adults using the DNeasy tissue kit (Qiagen, Hilden, Germany). The voucher specimens are kept in Henan International Joint Laboratory of Taxonomy and Systematic Evolution of Insecta, Henan Institute of Science and Technology (HIST), Xinxiang, China. The DNA concentration was measured for each sample by using NanoDrop One (Thermo Scientific, Waltham, MA, USA). DNA samples with qualified concentration (>10 ug) were sent to Berry Genomics Co., Ltd. (Beijing, China) for further detecting.
An Illumina TruSeq library was prepared with an insert size of 480 bp and was sequenced on the Illumina Hiseq 2500 platform with 250 bp paired-end reads. Raw reads were checked by FastQC 0.11.3 [20], with adapters and low-quality reads filtered by Trimmomatic [21]. A total of 6 GB clean data were obtained and used in the de novo assembly using IDBA-UD [22] with minimum and maximum k values of 45 bp and 145 bp. To identify the mitogenome sequences, the contigs obtained were searched with the COI and srRNA gene sequences using BLAST with at least 98% similarity. The complete mitogenome assembling strategy is similar to that of our previous studies [8,9,23,24,25].

2.2. Genome Annotation and Sequence Analysis

Geneious 6.1.6 was used to assemble Illumina sequence reads into contigs [26]. Then, the assembled mitochondrial sequences were annotated with MITOS [27]. All transfer RNA genes (tRNAs) were identified by MITOS. The secondary structure of the tRNA gene was also predicted by MITOS. Protein-coding genes (PCGs) and two ribosomal RNA (rRNA) genes were verified by alignment with homologous genes from other published stonefly species. The graphical mitogenomic map was depicted with OGDRAW v1.3.1 [28]. The MAFFT algorithm (within TranslatorX online) was used for the alignment of each PCG, using codon–based multiple alignment [29]. Before the protein alignment was back translated to nucleotides, GBlocks (in TranslatorX) with default settings were used to remove ambiguously aligned areas. The G–INS–I alignment strategy in MAFFT 7.0 online was used for rRNA alignment [30], and ambiguously aligned regions masked with Gblocks [31].
Nucleotide composition and codon usage were calculated by MEGA 6.0 [32]. AT and GC asymmetries were calculated using the following formulas: AT skew = [A − T]/[A + T] and GC skew = [G − C]/[G + C] [33]. DnaSP [34] was used to calculate the value of Ka (the nonsynonymous substitution rate) and Ks (the synonymous substitution rate). Tandem Repeats Finder server [35] and mfold web server [36] were used to identify tandem repeats and to infer the stem−loop structure, respectively.

2.3. Phylogenetic Analysis

To investigate the phylogenetic relationships within the Nemouroidea, 27 Nemouroidea species with published mitogenomes and the newly sequenced mitogenome were used in this study. Outgroups used two perlodid species, Isoperla eximia and Pseudomegarcys japonicus (Table 1). The PCGR dataset (13,194 bp, including all 13 PCGs plus two rRNA genes) was assembled for phylogenetic analyses.
GTR+I+G was selected as the best−fit nucleotide substitution model for each gene using ModelFinder applying the Akaike Information Criterion (AIC) [37]. Maximum Likelihood (ML) phylogenetic trees were inferred using IQ–TREE [37], and an ultrafast bootstrap approximation with 1000 replicates. Bayesian analyses were carried out using MrBayes v3.2.6 with selected models [38]. MrBayes runs were as follows: 10 million generations with four chains, sampling every 100 generations, and the first 25% discarded as burn–in.

3. Results and Discussion

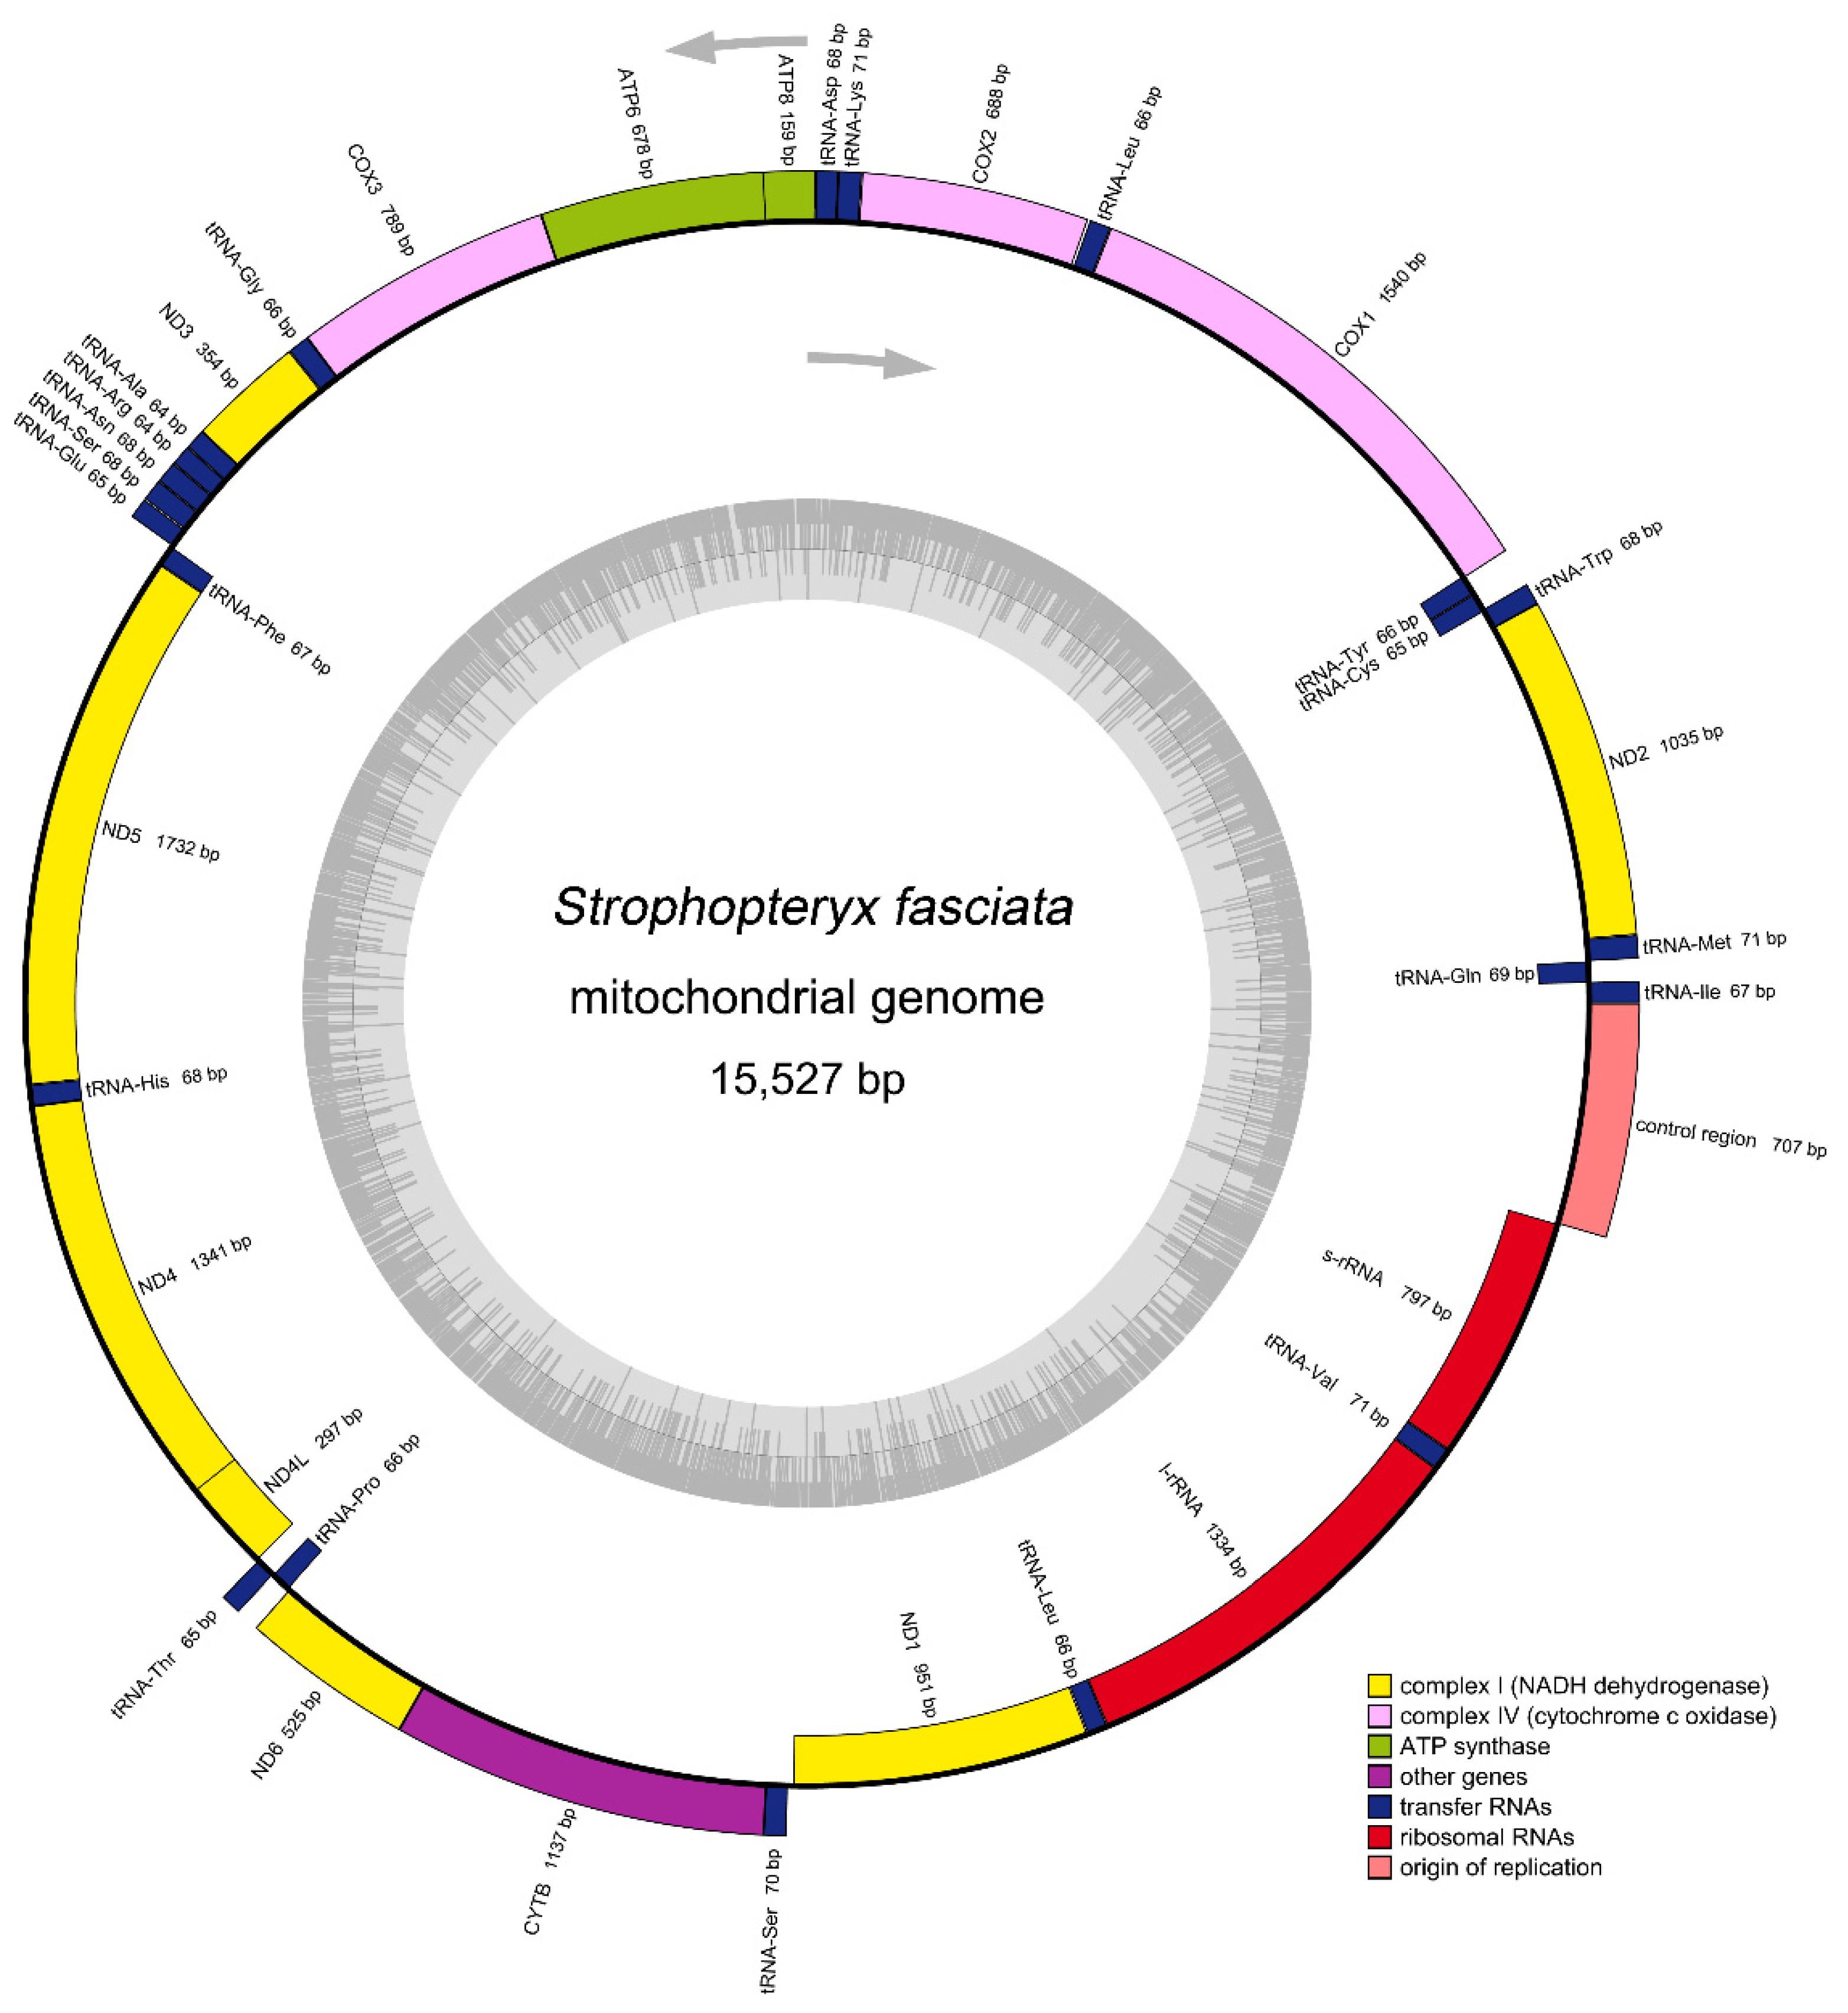
3.1. General Features of Mitogenome

The complete mitogenome of S. fasciata (15,527 bp) was determined (GenBank accession ON500674; Figure 1). The S. fasciata mitogenome was a traditional circular DNA molecule and medium-sized when compared with mitogenomes of other taeniopterygid species, which typically ranged from 15,353 bp to 16,020 bp (Table 1). This mitogenome was the second smallest one among the Nemouroidea complete mitogenomes (Table 1). Among taeniopterygid mitogenomes, the length variation was minimal in PCGs, tRNAs and rRNAs, but very different in the control region (Table 2). The mitogenome of S. fasciata contained 37 genes (22 tRNAs, 13 PCGs and 2 rRNAs) and a control region (Figure 1 and Table S1), which were typically present in metazoan mitogenomes [39]. The gene order of the S. fasciata mitogenome was identical with the ancestral gene order of Drosophila yakuba, which was thought to be the ground pattern for insect mitogenomes [40]. All three taeniopterygid mitogenomes had highly conserved gene order, other Nemouroidea mitogenomes having the insect ancestral gene order [7,8,9].
A total of 45 bp overlapping nucleotides were found at 14 gene junctions; the longest overlap (8 bp) existed between tRNATrp and tRNACys, and tRNATyr and COI (Table S1). Except for the large non-coding control region, the S. fasciata mitogenome also included seven intergenic spacers, ranging in size from 1 to 16 bp (Table S1).

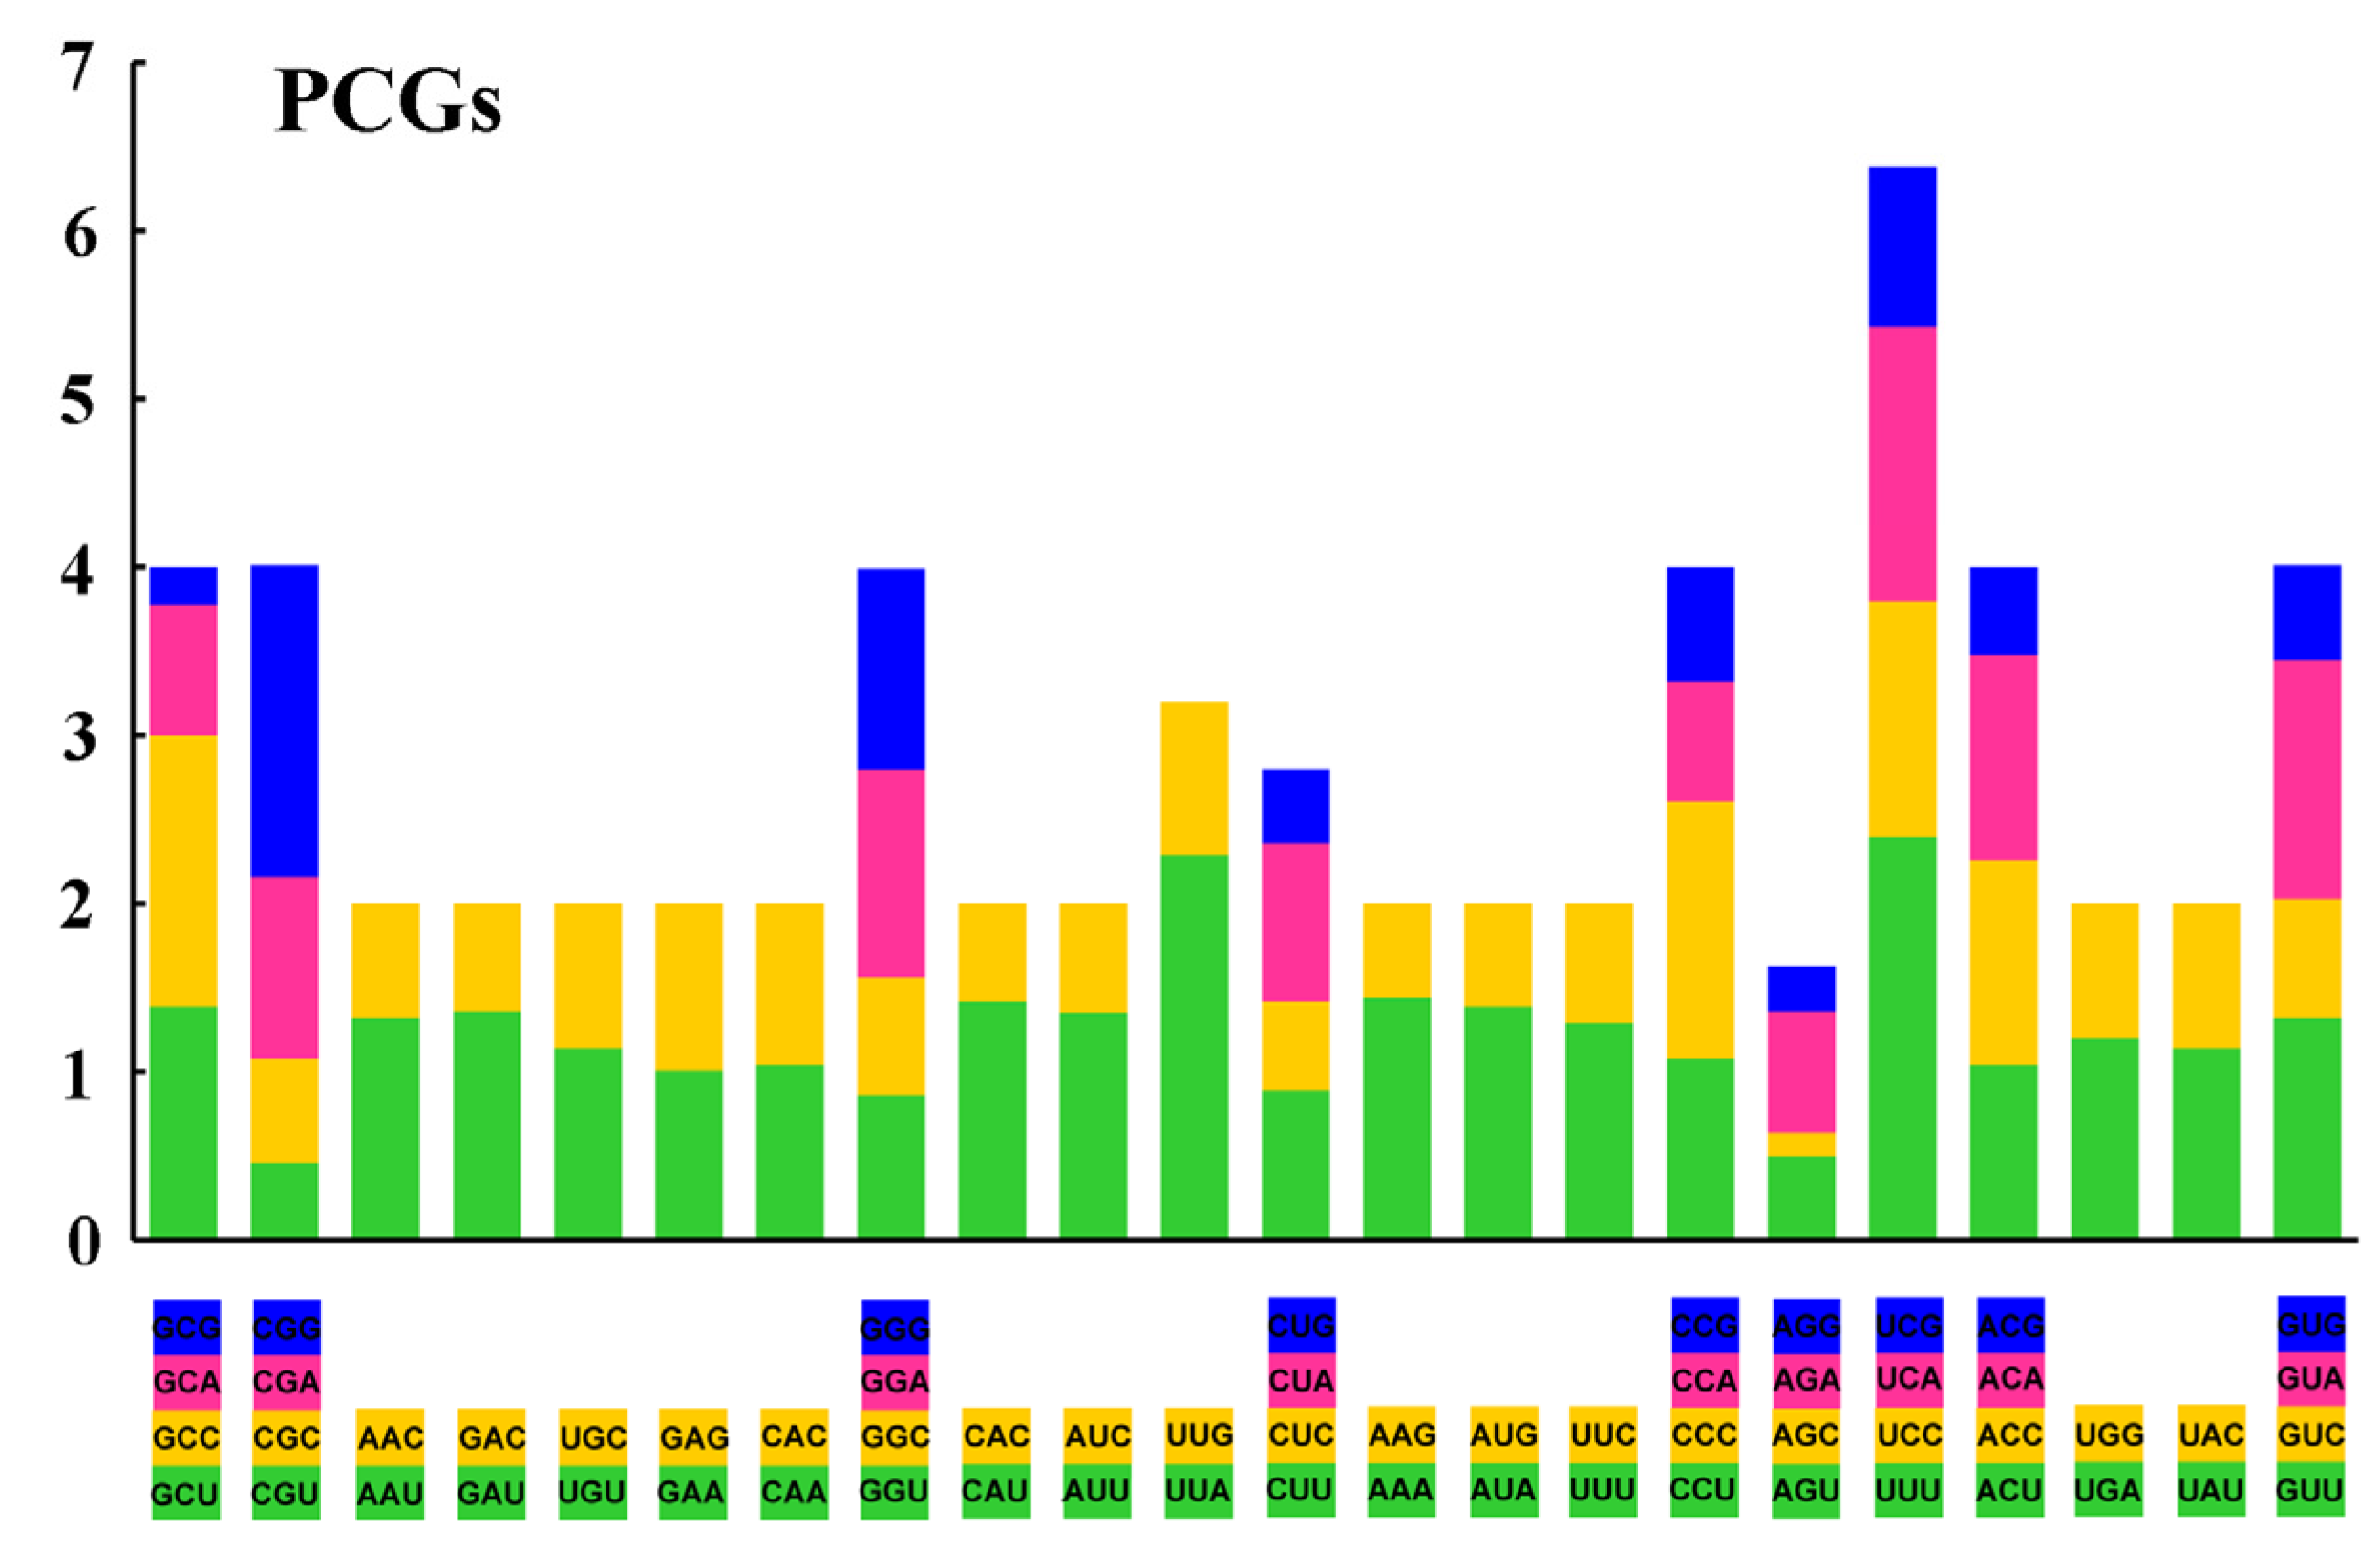
3.2. Nucleotide Composition and Codon Usage

Similar to other taeniopterygid mitogenomes, S. fasciata mitogenome was consistently AT biased, with an A + T value of 68.1%, and displayed positive AT- (0.03) and negative GC-skews (−0.18) of the whole mitogenome (Table 2). In all taeniopterygid species, both PCGs and rRNAs had a negative AT-skew, and the control region had a positive AT-skew. Meanwhile, the rRNAs had a positive GC-skew, and the control region had a negative GC-skew (Table 2). In addition, the control region showed a large variation in AT- (from 0.01 to 0.07) and GC-skews (from −0.16 to −0.30) (Table 2).
The codon usage pattern in all investigated taeniopterygid mitogenomes is consistent with the typical invertebrate mitochondrial genetic code, which favors AT-rich codons. In this study, the value of relative synonymous codon usage (RSCU) was calculated. In the PCGs of S. fasciata mitogenome, A or T were overwhelmingly represented compared to G or C at the third codon position (Figure 2 and Table S2). Four most frequently used codons in S. fasciata were TTA, ATT, TTT, and ATA, and they were all composed wholly of A and/or T (Table S2). Overall, the nucleotide compositions and codon usage of S. fasciata were almost the same as the other two taeniopterygid mitogenomes.

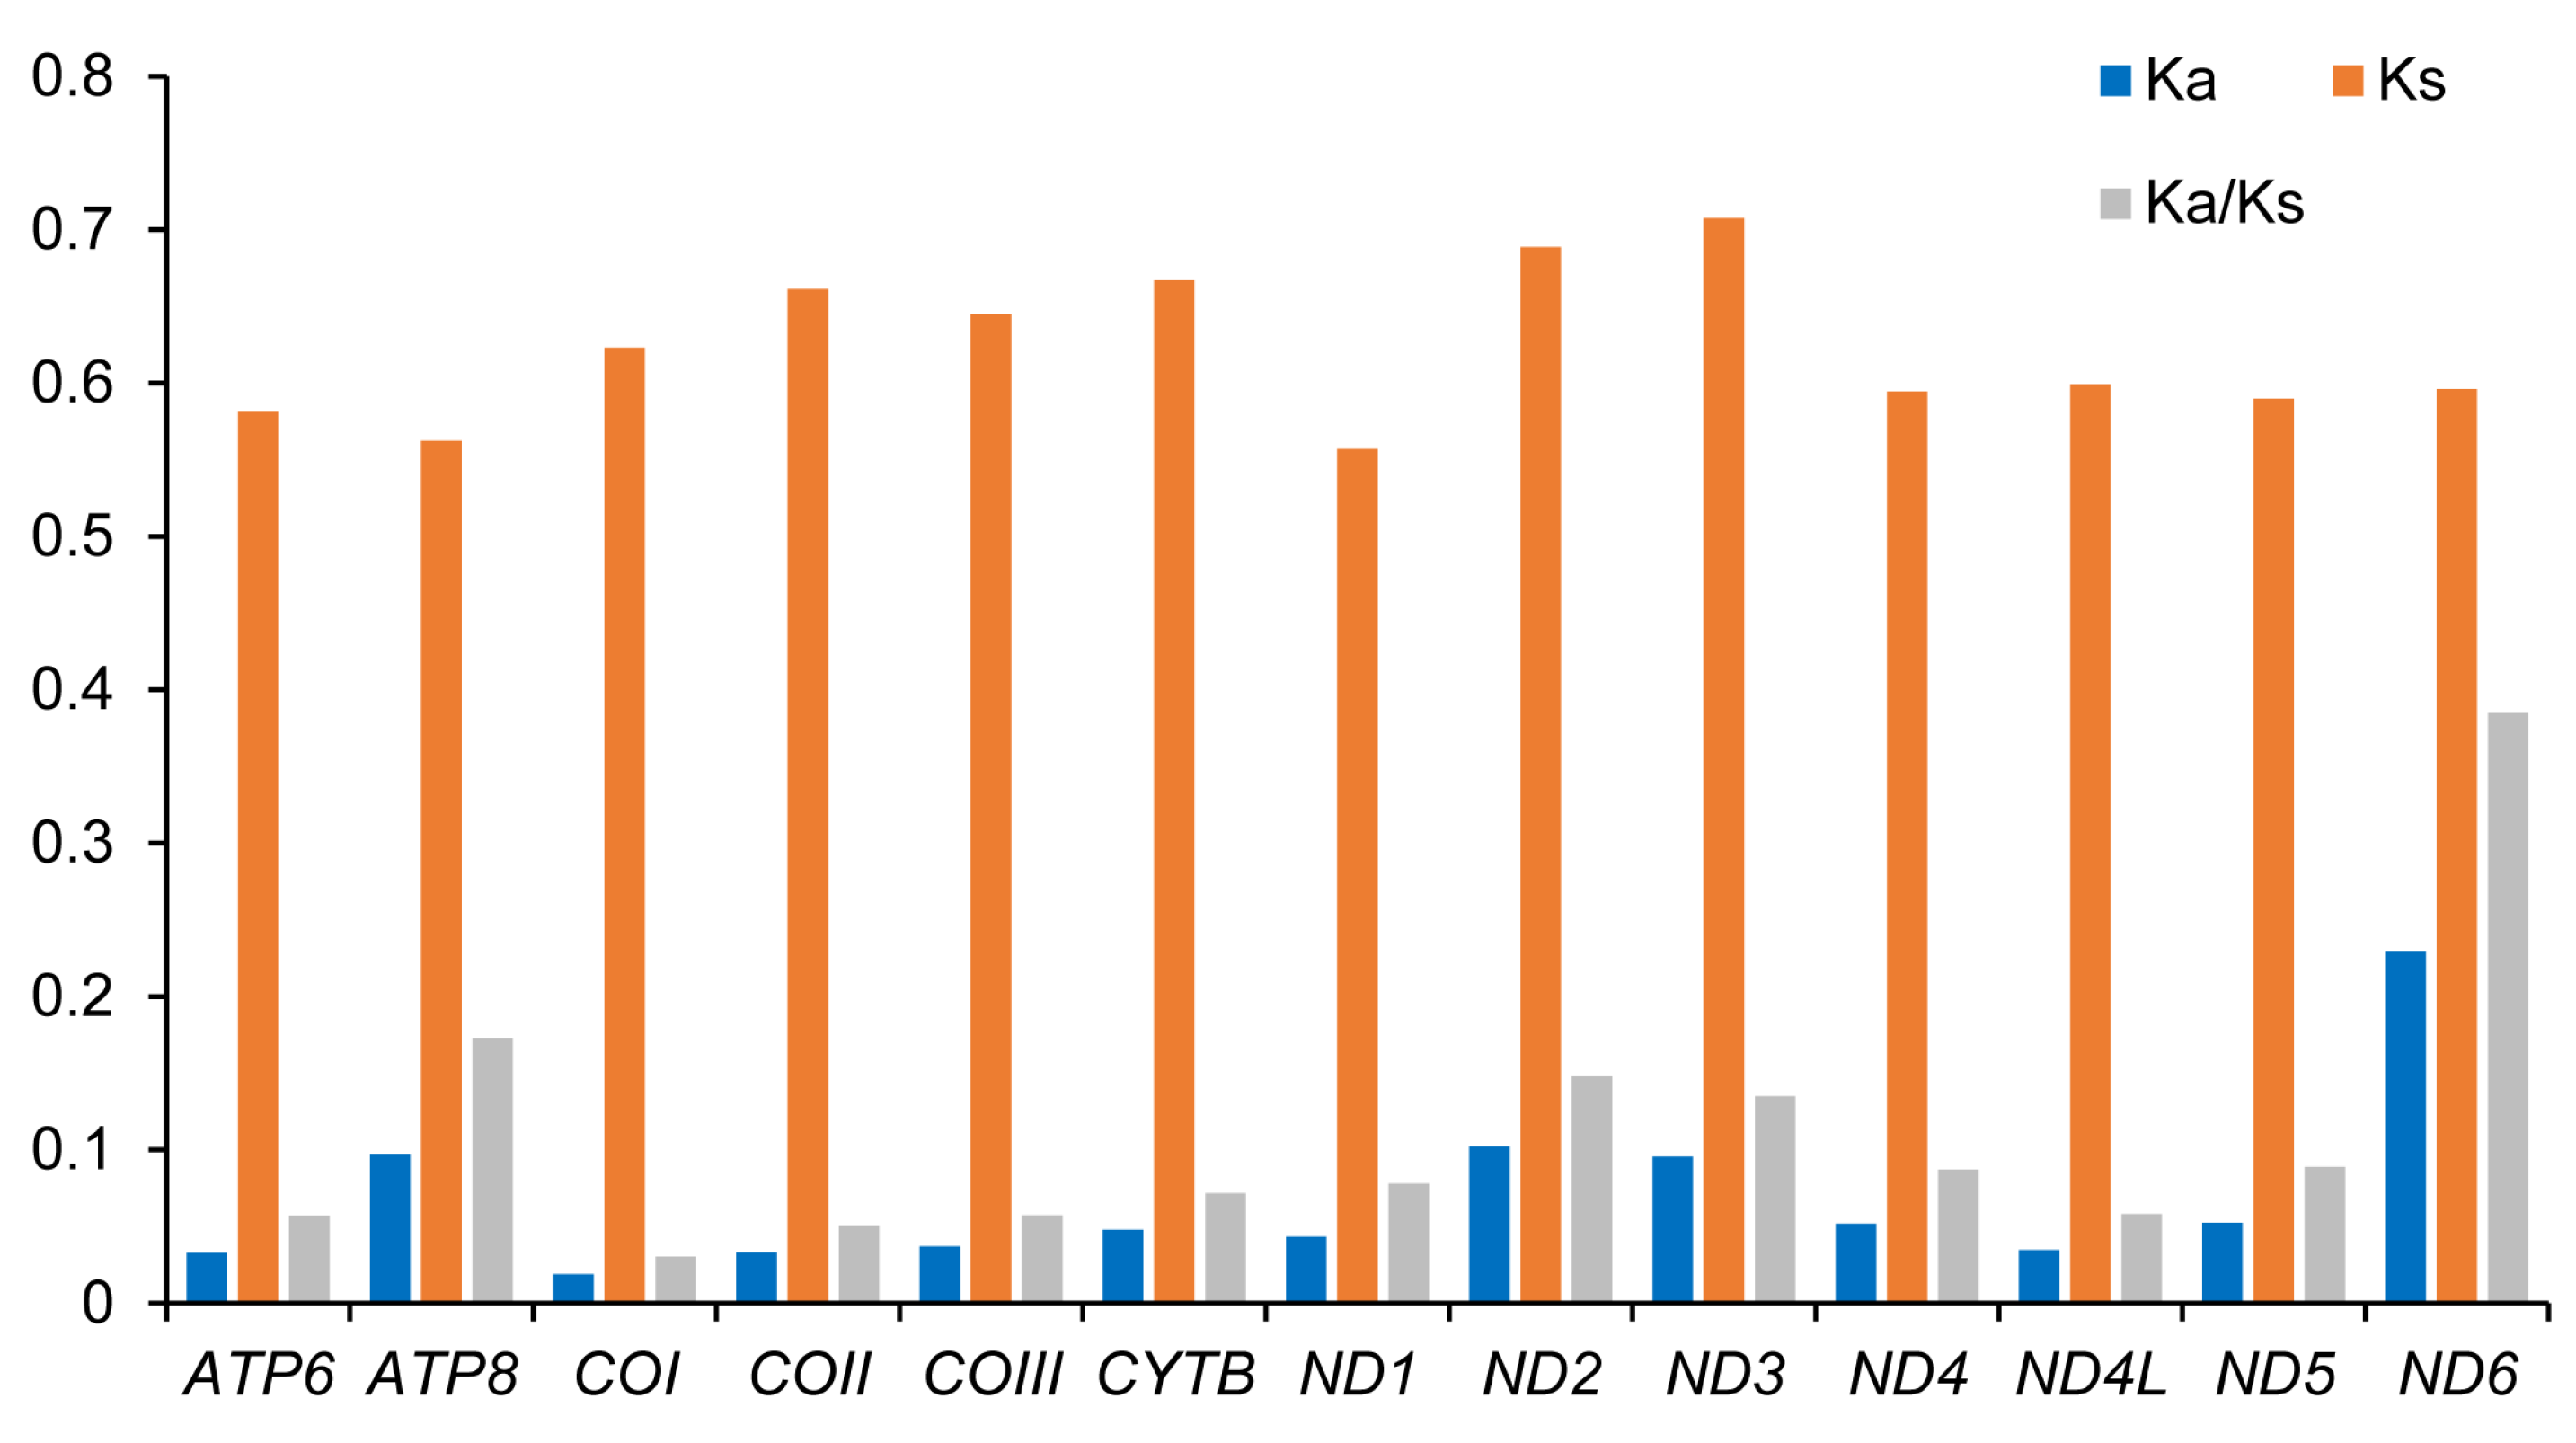
3.3. Protein-Coding Genes

The full length of S. fasciata PCGs was 11,193 bp (excluded the stop codon), with an A + T content of 66.9% (Table 2). In S. fasciata mitogenome, twelve PCGs used the typical start codon ATN (three started with ATT, and nine started with ATG). Meanwhile, ND1 gene used TTG as the start codon (Table 3 and Table S1). Ten PCGs used the standard stop codon TAA or TAG (seven stopped with TAA, and three stopped with TAG), while the remaining three PCGs (COI, COII, and ND5) were terminated with an incomplete stop codon T (Table 3 and Table S1).
In taeniopterygid mitogenomes, eight PCGs initiated with the same start codon, but five PCGs used multiple start codons (both ND2 and ND5 with ATG and GTG, ATP8 with ATT and ATC, ND6 with ATG and ATT, and CytB with ATG and ATC) (Table 3). The unusual start codons TTG and GTG also existed in other Nemouroidea mitogenomes [7,8,9,10,11]. The stop codons were far less variable than the start codons in taeniopterygid mitogenomes. Most PCGs used the same stop codons, except for the CytB gene, which used TAA in Taeniopteryx ugola and TAG in other two taeniopterygid species (Table 3). In addition, we found that three PCGs (COI, COII and ND5) in all three taeniopterygid mitogenomes used truncated stop codons (Table 3). Insect mitogenomes frequently have incomplete stop codons, which are thought to be repaired by polyadenylation after transcription [41,42].
The nonsynonymous substitutions rate (Ka), the synonymous substitutions rate (Ks), and the ratio of Ka/Ks (ω) for each PCG in three taeniopterygid species were calculated (Figure 3). In all PCGs, ND3 showed the highest Ks, whereas ND6 showed the highest Ka and ω values (Figure 3). The ratios of Ka/Ks were all less than 1, indicating the existence of purifying selection in these genes [43]. Therefore, all mitochondrial PCGs could be used to analyze the phylogeny of these species in Taeniopterygidae.

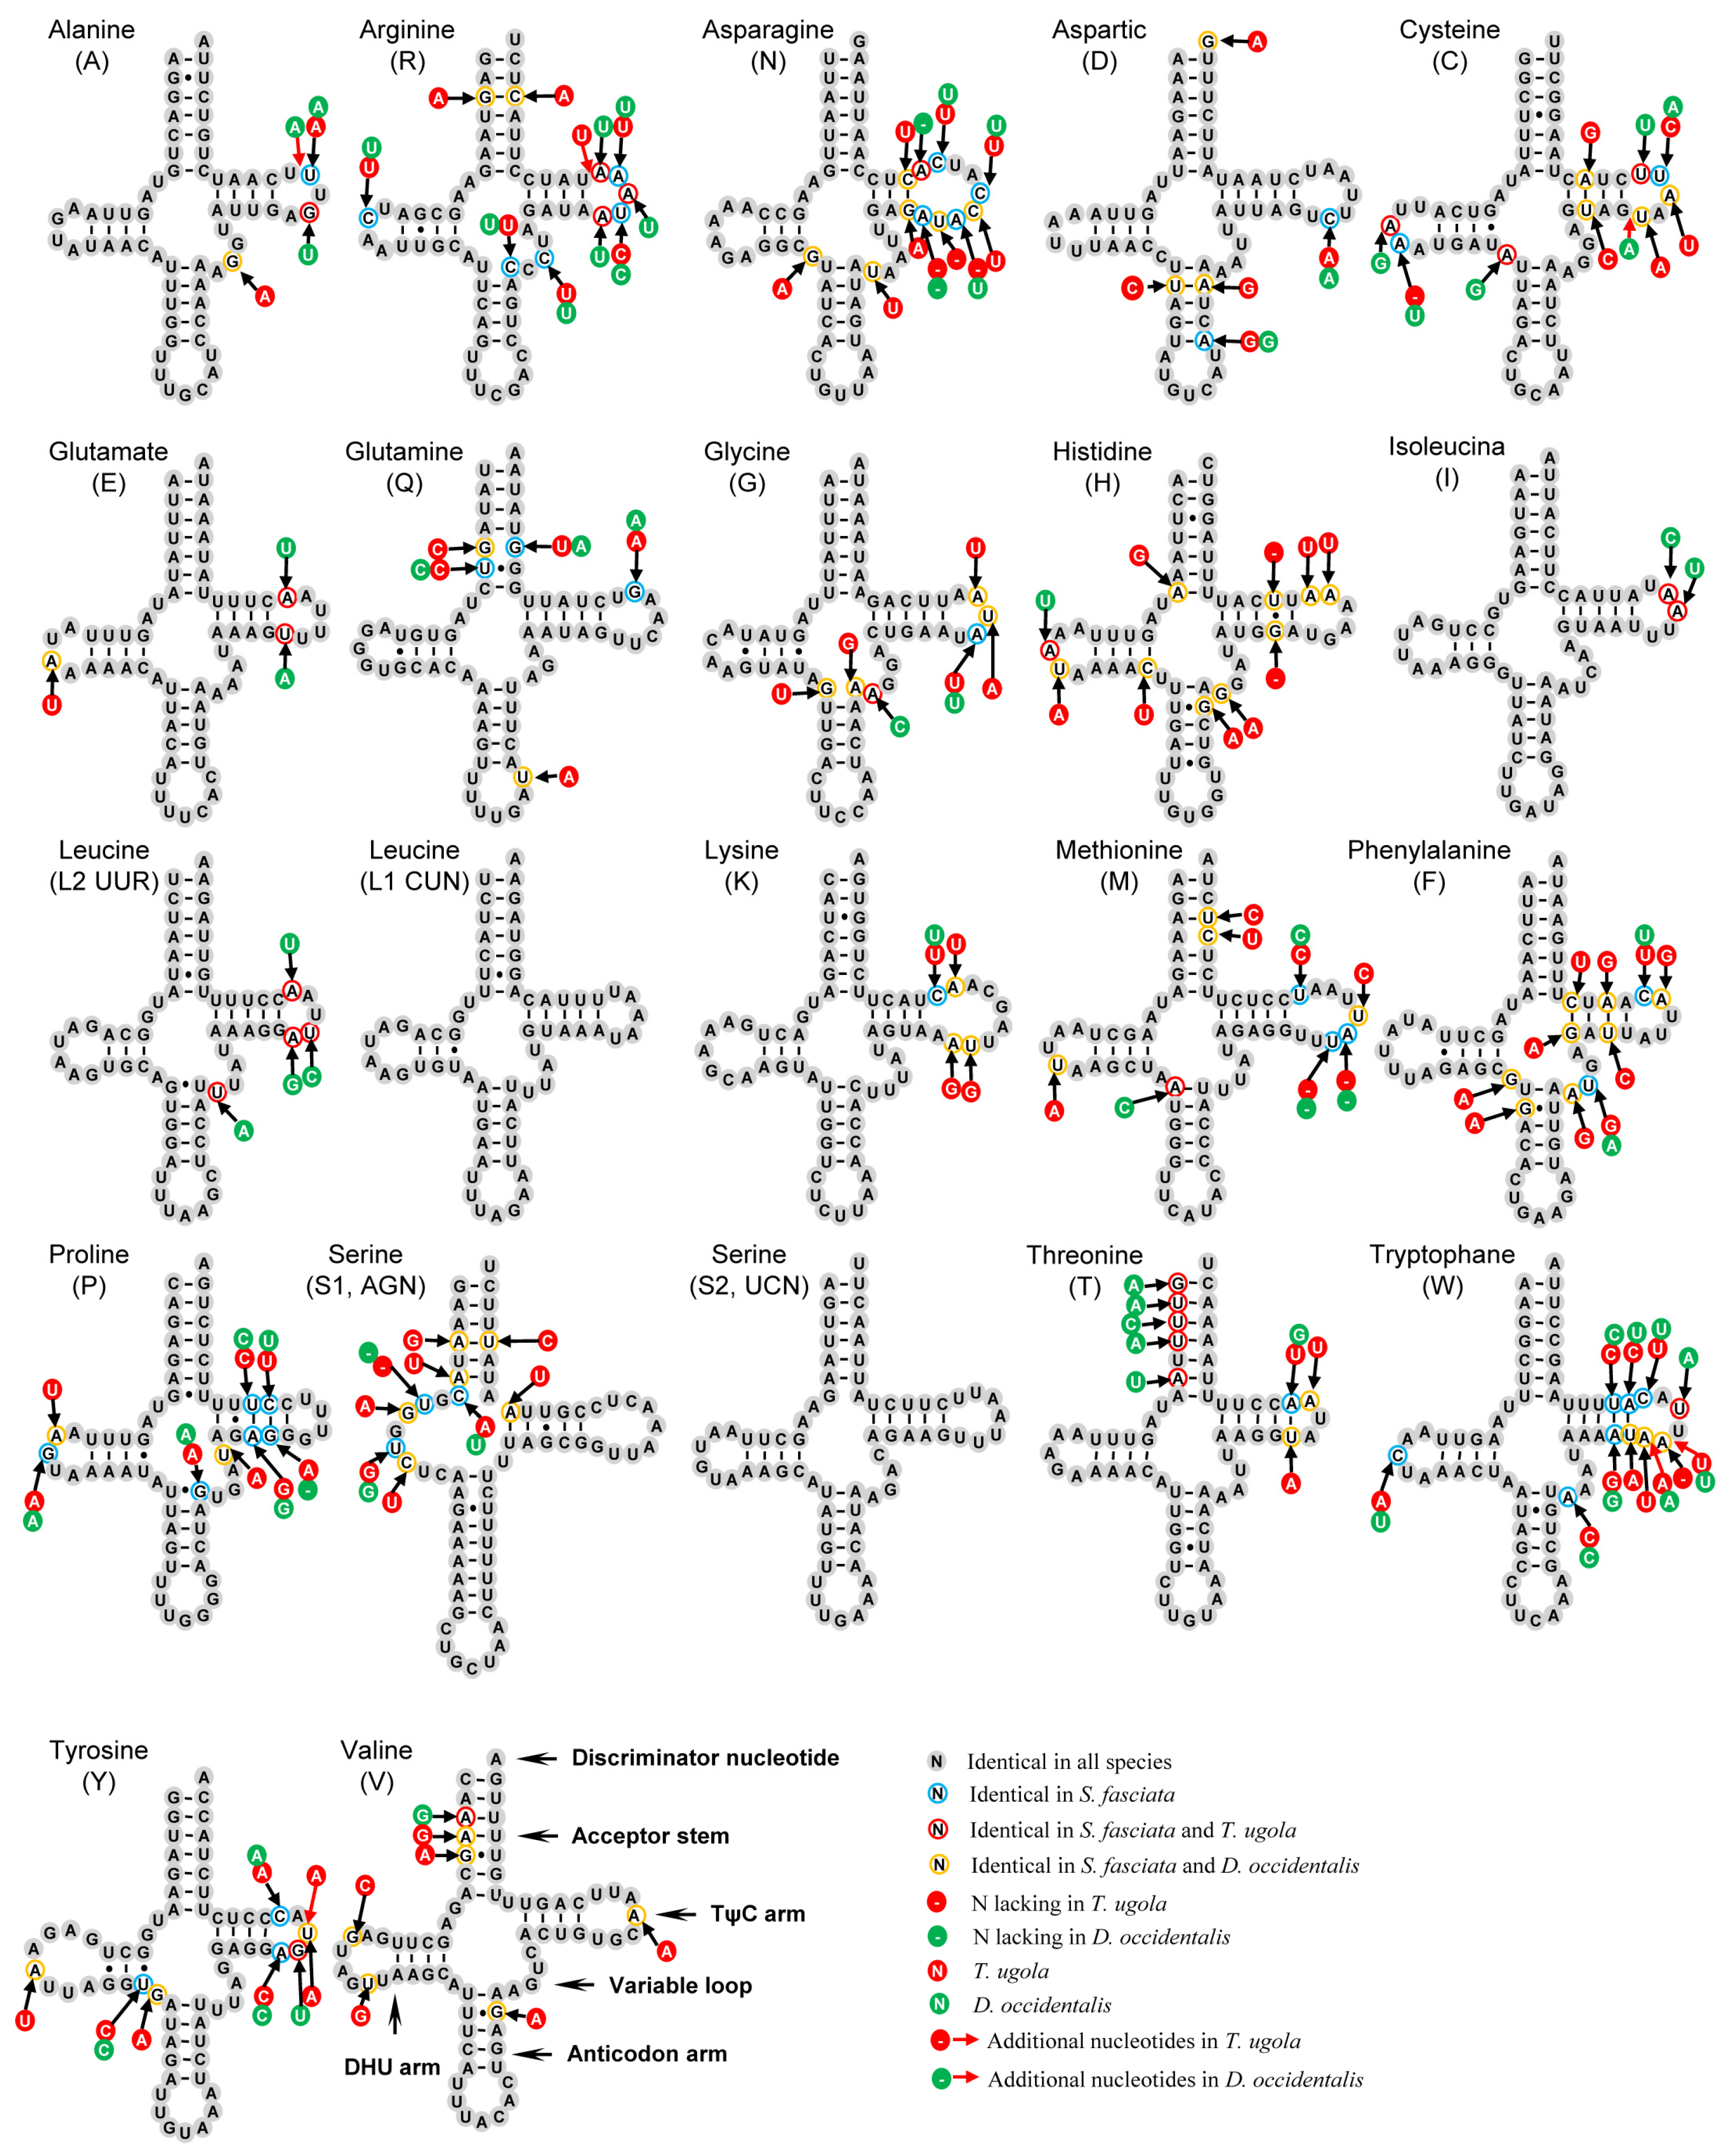
3.4. Transfer and Ribosomal RNA Genes

The 22 tRNAs in S. fasciata mitogenome were of a total length of 1479 bp, ranging in size from 64 to 71 bp (Table 2 and Table S1). The typical clover-leaf structure was found in 21 tRNAs, except for tRNASer(AGN) whose dihydrouridine (DHU) arm is absent (Figure 4). This phenomenon is a typical feature of metazoan mitogenomes [44]. A total of 32 mismatched base pairs were detected in S. fasciata tRNAs based on the secondary structures, such as 26 bp weak G–U pairs, 1 bp U–C mismatch, 1 bp A–G mismatch, 1 bp G–G mismatch and 3 bp A–C mismatches (Figure 4). By contrast, the secondary structures showed the most conserved tRNAs in taeniopterygid mitogenomes were tRNALeu(CUN), tRNASer(UCN), tRNAIle, tRNAAla and tRNAGlu (less than three nucleotides substitution per gene). In addition, the most conserved and variable regions were found in the anticodon arm and TΨC loop, respectively (Figure 4).
The large subunit ribosome gene (lrRNA) and small subunit ribosome gene (srRNA), which were typically found in other insect mitogenomes, were also observed in S. fasciata mitogenome sequenced in this study. The size of lrRNA and srRNA of S. fasciata was 1334 bp and 797 bp, respectively (Table S1). The length of rRNA genes varied from 2119 bp in T. ugola and 2131 bp in S. fasciata. The A + T content ranged from 71.2% in S. fasciata to 72.7% in T. ugola (Table 2). The lrRNA gene had six domains (domain III was absent in arthropods) and 44 helices (Figure S1). Nucleotide variability was unevenly distributed among domains and helices, mainly in domains I, II and VI. Several helices (H837, H845, H991, and H2077) in lrRNA showed high variability at the primary sequence level (Figure S1). The srRNA gene had three domains and 27 helices (Figure S2). Nucleotide variability was unevenly distributed among domains and helices, mainly in helices H47 of domain I (Figure S2).
Overall, the secondary structures of tRNA and rRNA genes of S. fasciata mitogenome are highly conserved. These conserved regions may be involved in the structure and function of RNAs [8,45].

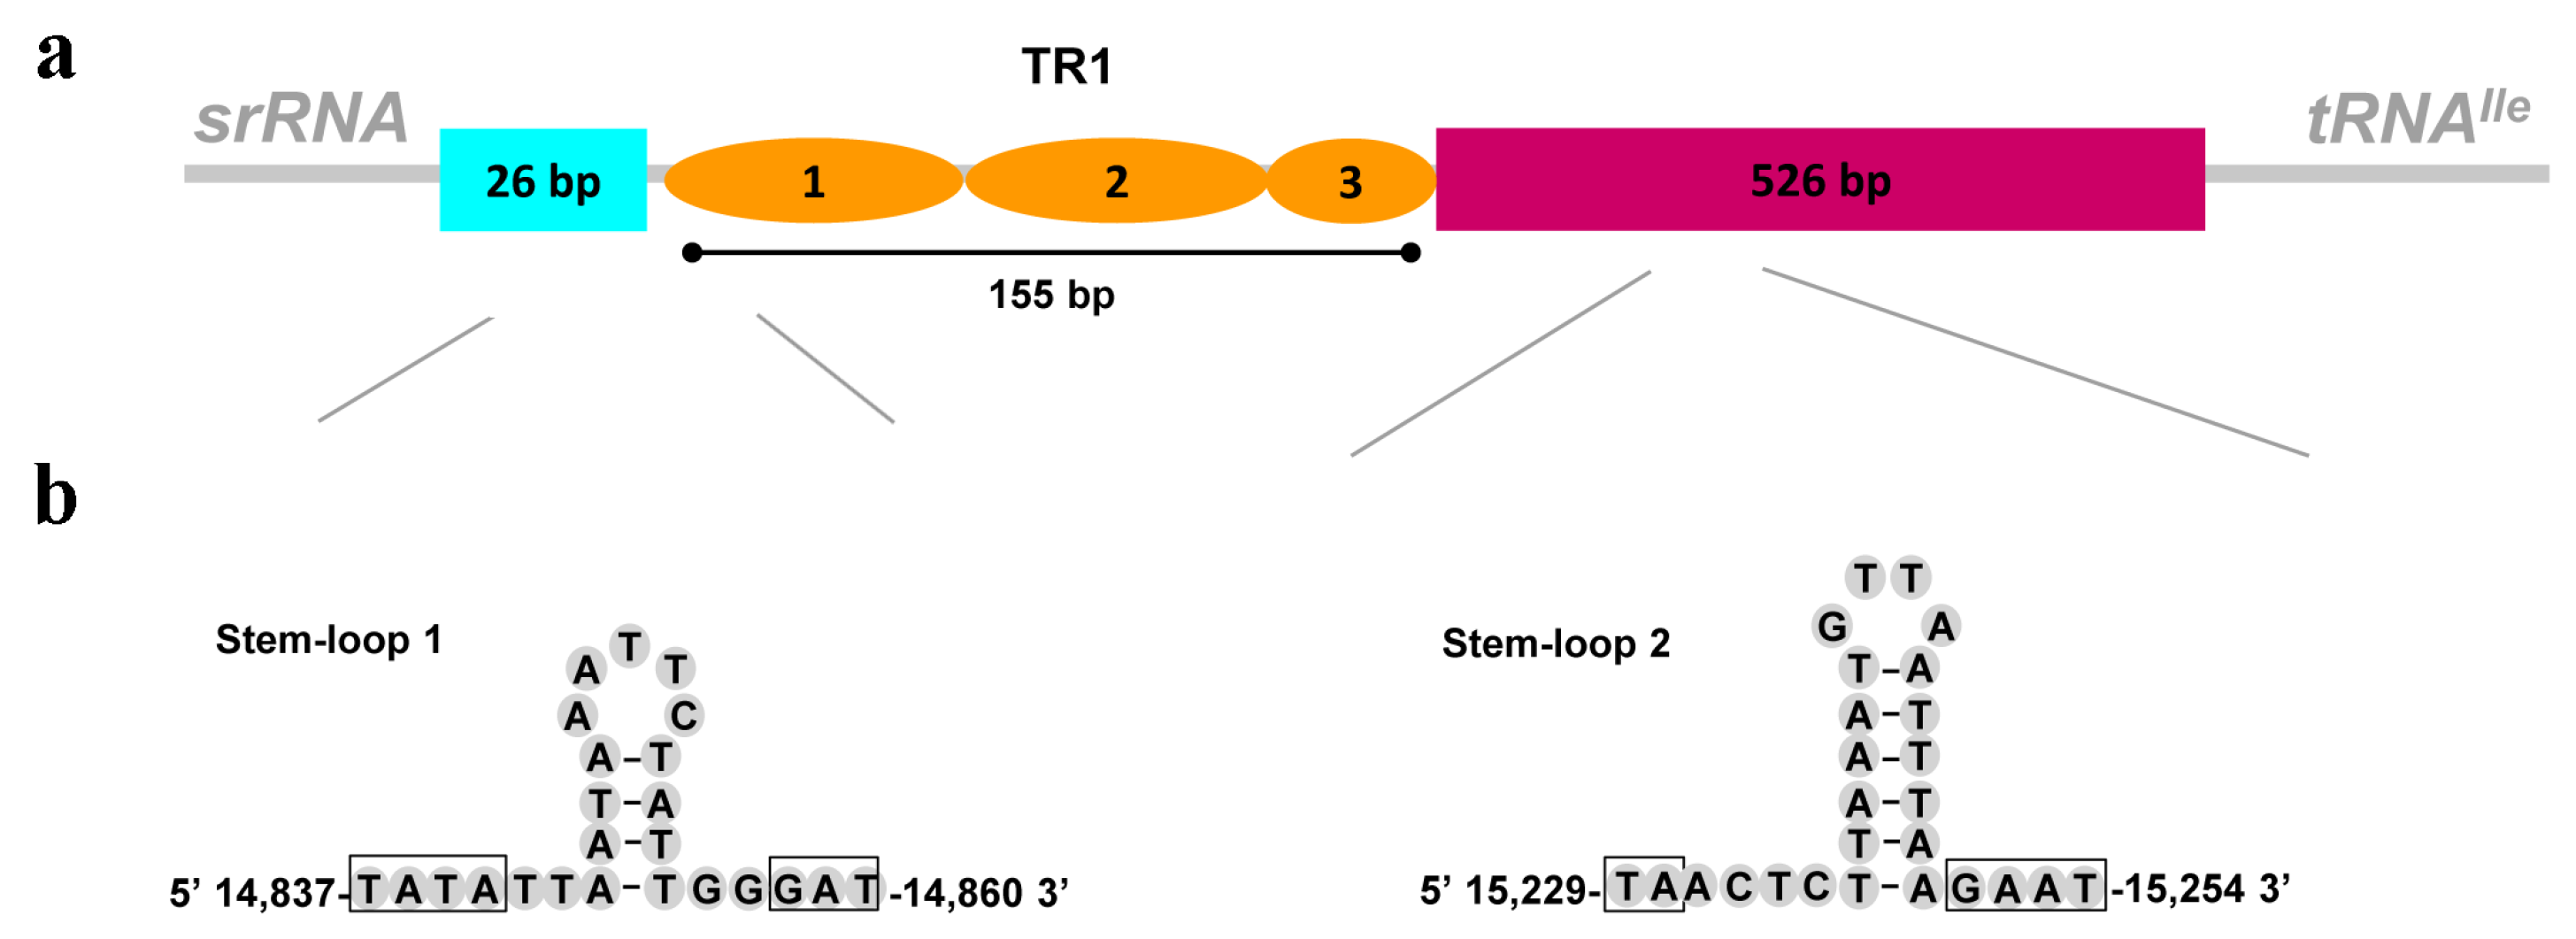
3.5. The Control Region

The length of the control region was highly variable in taeniopterygid mitogenomes, ranging from 537 bp in T. ugola to 1248 bp in D. occidentalis. The A + T content ranged from 71.0% in S. fasciata to 78.9% in T. ugola (Table 2). In the control region of S. fasciata mitogenome, some essential elements were observed: (1) a 26 bp region that was bordered by srRNA; (2) a large tandem repeat sequence (155 bp); and (3) a 526 bp region at the end of the control region (Figure 5a). The tandem repeat sequence included two tandem repeat units plus a partial copy of the repeat. One microsatellite sequence ((TA)5, position 15,184 bp–15,193 bp) was also found in the control region. Microsatellite elements can be used to examine the geographical structure and phylogenetic relationship of species [45].
The stem-loop (SL) structure in Drosophila control region is considered to be the initiation site for secondary chain synthesis [46]. Among some insects, the SL structure showed highly conserved flanking sequences, such as ‘TATA’ sequence at the 5’ end and ‘G(A)nT’ at the 3’ end [47,48]. In this study, two SL structures were found in the control region (Figure 5b). Both flanking ‘TATA’ sequence at the 5’ end and ‘GAT’ at the 3’ end were found in the SL1 (position 14,837 bp–14,860 bp). However, in the SL2 (position 15,229 bp–15,254 bp), only conserved flanking ‘GAAT’ was found at the 3’ end (Figure 5b).
Several poly-N stretch (≥7 bp), such as poly-T (position 15,107 bp–15,027 bp), poly-A (position 15,421 bp–15,427 bp) and poly-C (position 15,483 bp–15,489 bp), were found in the control region of S. fasciata. The poly-T stretch is relatively conserved across insects [49], and it could play a role in transcriptional regulation or serve as a replication start site. [46]. Most of these structure elements are also identified in other taeniopterygid species [7] and stoneflies [8,9,10,11,23,24,25,50,51,52].

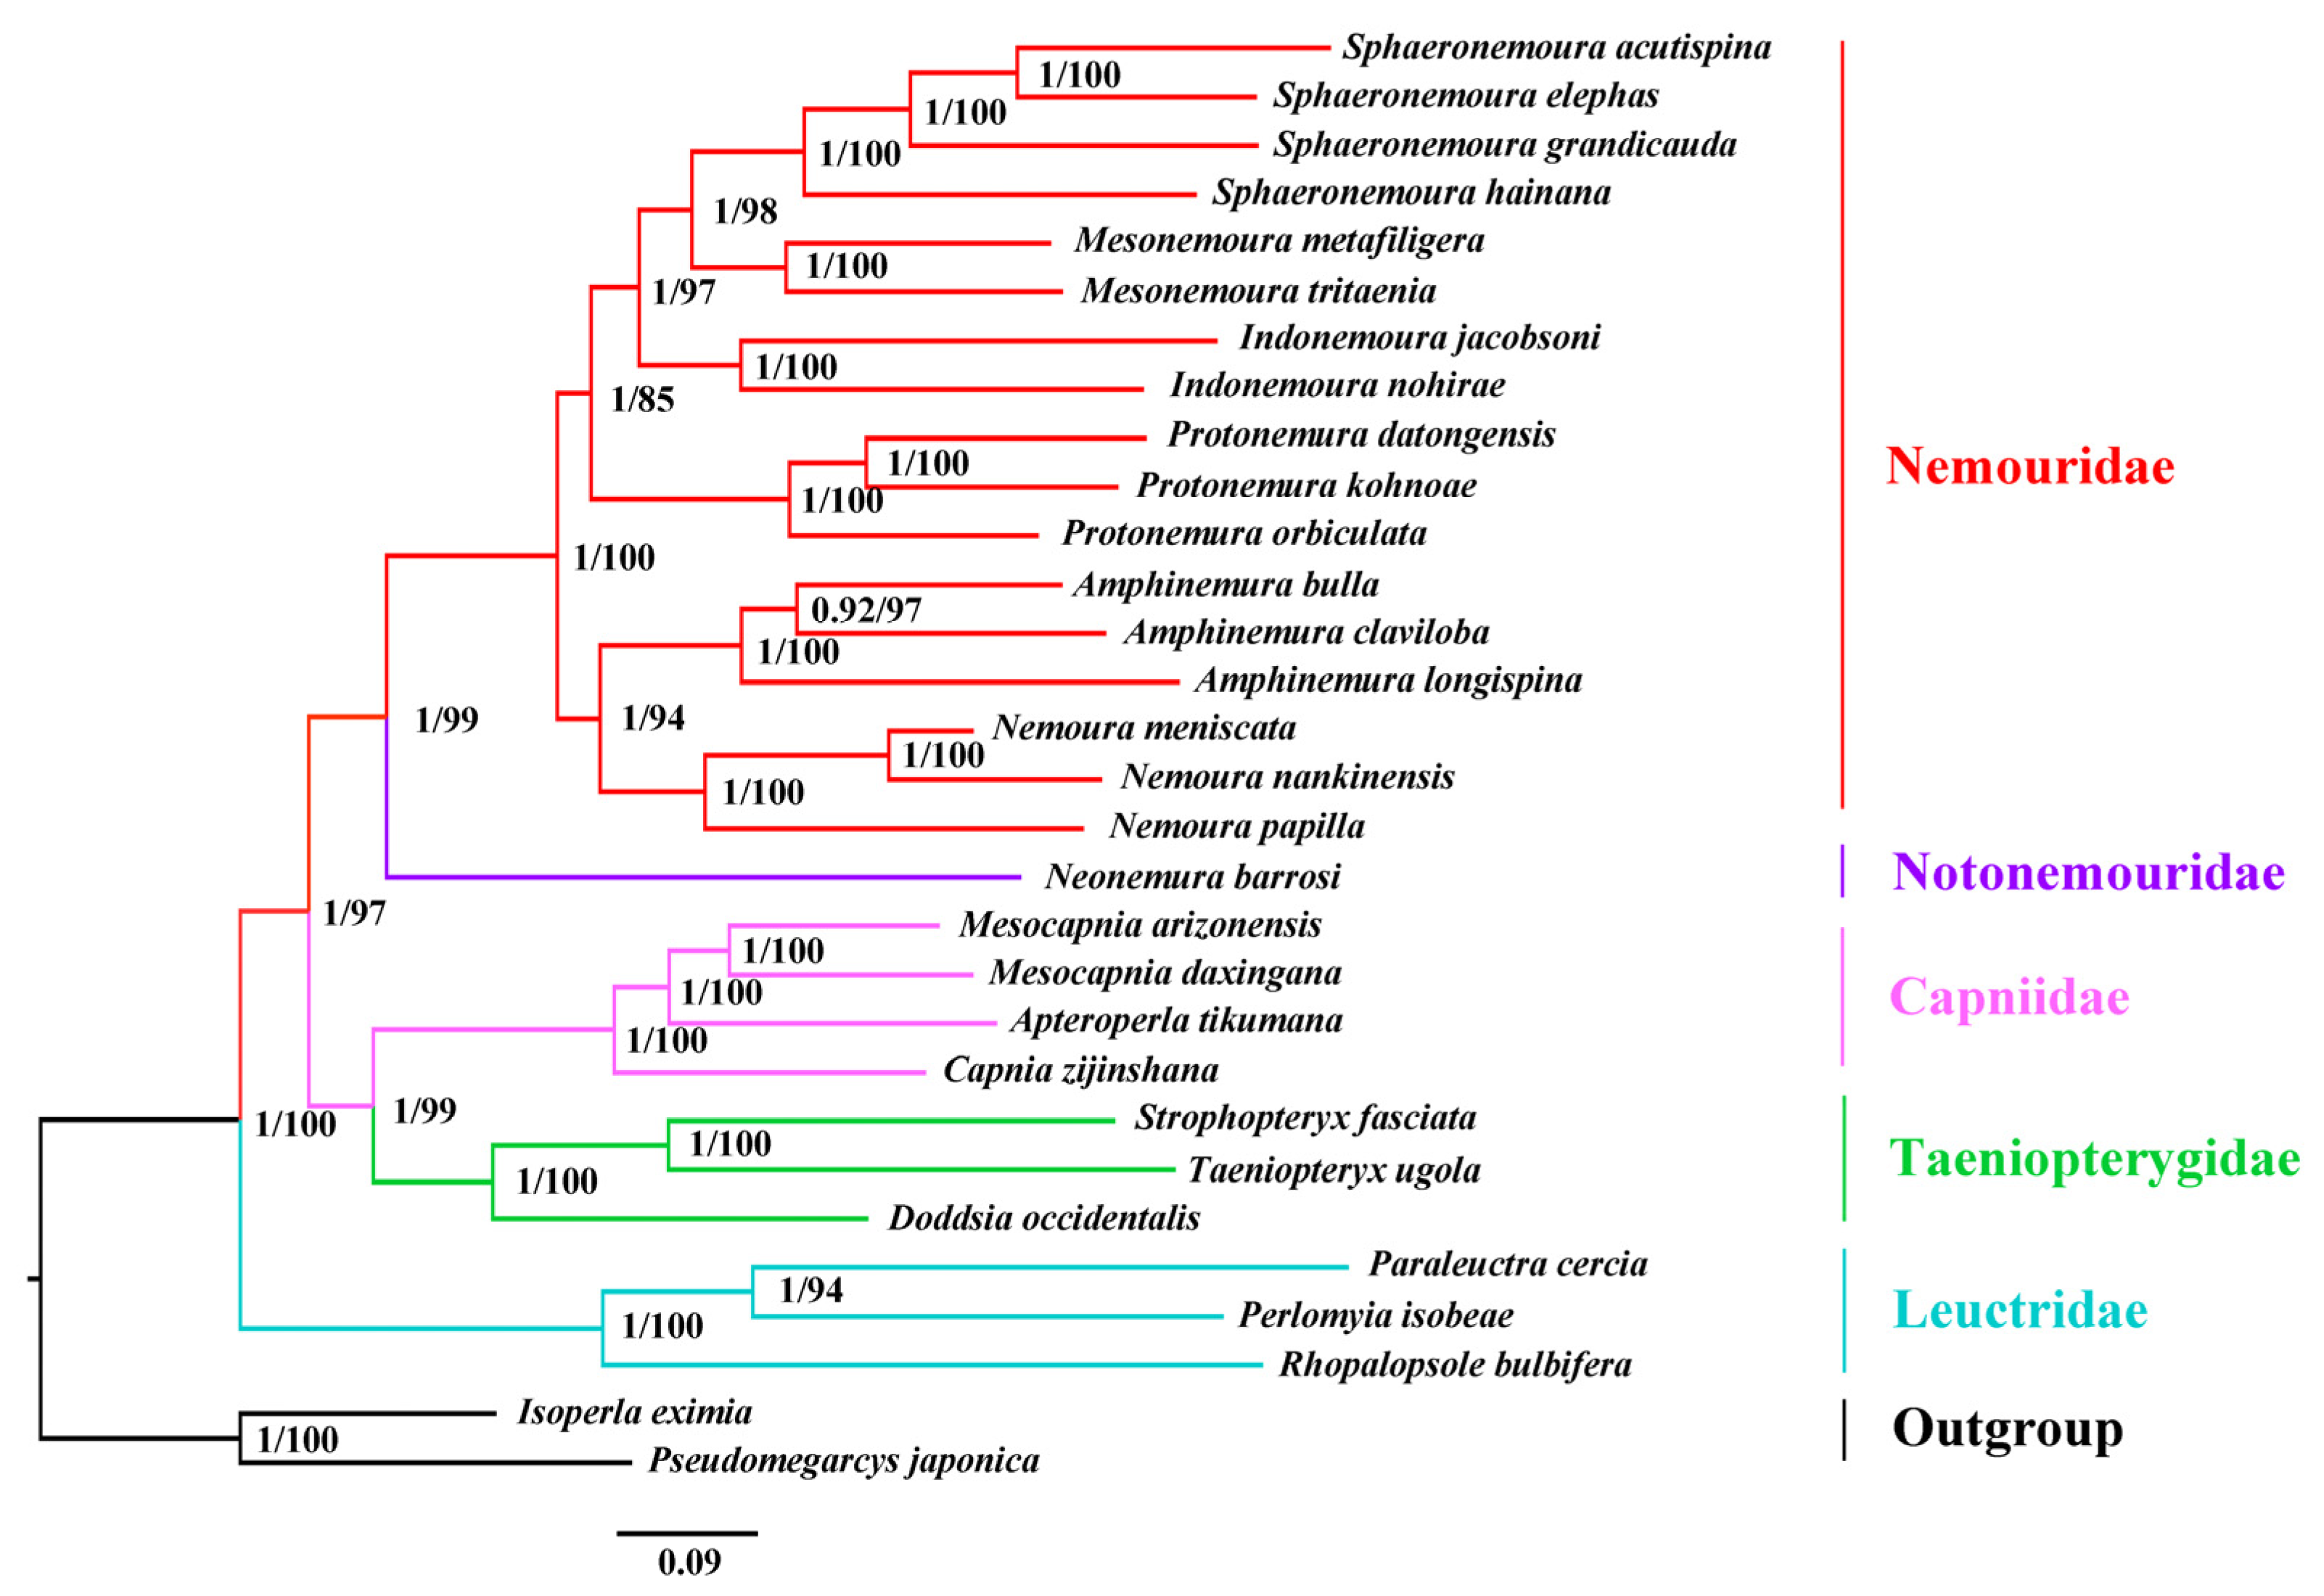
3.6. Phylogenetic Analysis

Two phylogenetic trees were inferred from BI and ML methods and generated the identical topology across the PCGR dataset (Figure 6). The monophyly of each family was well-supported (Bootstrap values (BP) > 97, post-probability values (PP) = 1.00), except for Notonemouridae, which only possesses one species. Strophopteryx fasciata and T. ugola were together (BP = 100, PP = 1.00) and were sister to D. occidentalis (BP = 100, PP = 1.00).
In Nemouridae, the subfamily Amphinemurinae was recovered as paraphyletic. The genus Amphinemura that belongs to Amphinemurinae was sister to Nemoura of the subfamily Nemourinae (PP = 94, BP = 1.00). The sister relationship between Amphinemura and Nemoura is not consistent with the traditional classification [53] but consistent with some mitogenome analyses [8,54]. Considering that only one genera data of Nemourinae is available, more sampling from different genera of this subfamily is needed to test this problem.
This analysis supported Nemouridae as the sister taxon to Notonemouridae (BP = 99, PP = 1.00) (Figure 6). This placement disagrees with some molecular analyses [4,5] but is consistent with previous morphological hypothesis [2] and mitogenome analyses [8,9,11,55]. In Zwick’s study, Capniidae was placed as a sister to Leuctridae and then clustered with Nemouridae plus Notonemouridae [2]. However, this analysis supported a sister relationship between Capniidae and Taeniopterygidae (BP = 99, PP = 1.00) (Figure 6). Although this result differs from the generally accepted hypothesis that the Capniidae and Leuctridae are sister groups [2], there are no molecular studies supporting this hypothesis until now.
Like previous mitogenome studies [8,9], the clade Capniidae + Taeniopterygidae and the clade Chloroperlidae + Perlodidae were grouped together. However, results in this study showed higher stability (BP = 97, PP = 1.00) than previous mitogenome studies (BP = 47/34, PP = 0.56/0.95) [9,12]. In addition, the Leuctridae was the earliest branch within the superfamily Nemouroidea in this study (BP = 100, PP = 1.00). Finally, the relationships of five families in Nemouroidea were recovered as Leuctridae + ((Capniidae + Taeniopterygidae) + (Nemouridae + Notonemouridae)).

4. Conclusions

Nowadays, the phylogeny of Taeniopterygidae was widely accepted based on morphological analyses. However, there are different opinions based on molecular data. Considering only two taeniopterygid mitogenomes are available, more sampling is needed to obtain precise phylogenetic relationships. In this study, the complete mitogenome of S. fasciata was sequenced and analyzed. The complete mitogenome of S. fasciata was a traditional circular DNA molecule and medium-sized when compared with mitogenomes of other taeniopterygid species. Compared with other taeniopterygid mitogenomes, the S. fasciata mitogenome showed itself to be highly conserved in mitogenome size, gene order, nucleotide composition, codon usage and RNA secondary structures. In the control region of the S. fasciata mitogenome, some essential elements (tandem repeats, stem–loop structures, and poly-N stretch, etc.) were observed. Two phylogenetic trees were inferred from BI and ML methods and generated the identical topology across the PCGR dataset. Strophopteryx fasciata and T. ugola were together and were sister to D. occidentalis. The relationships of five families in Nemouroidea were recovered as Leuctridae + ((Capniidae + Taeniopterygidae) + (Nemouridae + Notonemouridae)). These results will help us understand the mitogenome structure of taeniopterygid species and the evolutionary relationship within Plecoptera.

Supplementary Materials

The following supporting information can be downloaded at: https://www.mdpi.com/article/10.3390/genes13071116/s1, Figure S1: Predicted secondary structure of the lrRNA gene in the S. fasciata mitogenome; Figure S2: Predicted secondary structure of the srRNA gene in the S. fasciata mitogenome; Table S1: Organization of the S. fasciata mitochondrial genome; Table S2: Codon number and RSCU in the S. fasciata mitochondrial PCGs.

Author Contributions

Conceptualization, supervision, and funding acquisition, Y.W. and W.L.; investigation, X.G., C.G., X.D. and H.Z.; writing—original draft preparation, X.G. and C.G.; writing—review and editing, Y.W., D.M. and W.L. All authors have read and agreed to the published version of the manuscript.

Funding

This research was funded by the Program for Science & Technology Innovation Talents in Universities of Henan (No. 21HASTIT042), the Key Scientific Research Project of Henan Province (No. 21A210009, 22A210004), and the National Innovation and Entrepreneurship Training program for college students in China (No. 202110467006).

Institutional Review Board Statement

Not applicable.

Informed Consent Statement

Not applicable.

Data Availability Statement

The data that support the findings of this study are deposited in GenBank with accession number ON500674. The data are available from the corresponding authors upon reasonable request.

Acknowledgments

We thank Boris C. Kondratieff (Colorado State University, USA) for sharing the samples.

Conflicts of Interest

The authors declare no conflict of interest.

References

  1. DeWalt, R.E.; Maehr, M.D.; Hopkins, H.; Neu-Becker, U.; Stueber, G. Plecoptera Species File Online. Available online: http://Plecoptera.SpeciesFile.org (accessed on 29 April 2022).
  2. Zwick, P. Phylogenetic System and Zoogeography of the Plecoptera. Annu. Rev. Entomol. 2000, 45, 709–746. [Google Scholar] [CrossRef] [PubMed]
  3. Hynes, H.B.N.; Hynes, M.E. The endemism of Tasmanian stoneflies (Plecoptera). Aquat. Insects 1980, 2, 81–89. [Google Scholar] [CrossRef]
  4. Thomas, M.A.; Walsh, K.A.; Wolf, M.R.; McPheron, B.A.; Marden, J.H. Molecular phylogenetic analysis of evolutionary trends in stonefly wing structure and locomotor behavior. Proc. Natl. Acad. Sci. USA 2000, 97, 13178–13183. [Google Scholar] [CrossRef] [PubMed] [Green Version]
  5. Terry, M.D. Phylogeny of the Polyneopterous Insects with Emphasis on Plecoptera: Molecular and Morpological Evidence. Ph.D. Thesis, Brigham Young University, Provo, UT, USA, 2003; pp. 1–118. [Google Scholar]
  6. Davis, N.G. Application of Next-Generation Transcriptomic Tools for Non-Model Organisms: Gene Discovery and Marker Development within Plecoptera (Insecta). Master’s Thesis, Brigham Young University, Provo, UT, USA, 2013; pp. 1–39. [Google Scholar]
  7. Chen, Z.T.; Du, Y.Z. The first two mitochondrial genomes from Taeniopterygidae (Insecta: Plecoptera): Structural features and phylogenetic implications. Int. J. Biol. Macromol. 2018, 111, 70–76. [Google Scholar] [CrossRef] [PubMed]
  8. Cao, J.J.; Wang, Y.; Li, W.H. Comparative mitogenomic analysis of species in the subfamily Amphinemurinae (Plecoptera: Nemouridae) reveal conserved mitochondrial genome organization. Int. J. Biol. Macromol. 2019, 138, 292–301. [Google Scholar] [CrossRef]
  9. Cao, J.J.; Wang, Y.; Guo, X.; Wang, G.Q.; Li, W.H.; Murányi, D. Two complete mitochondrial genomes from Leuctridae (Plecoptera: Nemouroidea): Implications for the phylogenetic relationships among stoneflies. J. Insect Sci. 2021, 21, 16. [Google Scholar] [CrossRef]
  10. Shen, Y.; Du, Y.Z. The mitochondrial genome of Leuctra sp. (Plecoptera: Leuctridae) and its performance in phylogenetic analyses. Zootaxa 2019, 4671, 571–580. [Google Scholar] [CrossRef]
  11. Zhao, M.Y.; Huo, Q.B.; Du, Y.Z. Molecular phylogeny inferred from the mitochondrial genomes of Plecoptera with Oyamia nigribasis (Plecoptera: Perlidae). Sci. Rep. 2020, 10, 20955. [Google Scholar] [CrossRef]
  12. Ding, S.M.; Li, W.H.; Wang, Y.; Cameron, S.L.; Murányi, D.; Yang, D. The phylogeny and evolutionary timescale of stoneflies (Insecta: Plecoptera) inferred from mitochondrial genomes. Mol. Phylogenet. Evol. 2019, 135, 123–135. [Google Scholar] [CrossRef]
  13. South, E.J.; Skinner, R.K.; DeWalt, R.E.; Kondratieff, B.C.; Johnson, K.P.; Davis, M.A.; Lee, J.J.; Durfee, R.S. Phylogenomics of the North American Plecoptera. Syst. Entomol. 2021, 46, 287–305. [Google Scholar] [CrossRef]
  14. Barr, C.M.; Neiman, M.; Taylor, D.R. Inheritance and recombination of mitochondrial genomes in plants, fungi and animals. New Phytol. 2005, 168, 39–50. [Google Scholar] [CrossRef] [PubMed]
  15. Boore, J.L. Animal mitochondrial genomes. Nucleic Acids Res. 1999, 27, 1767–1780. [Google Scholar] [CrossRef] [PubMed] [Green Version]
  16. Curole, J.P.; Kocher, T.D. Mitogenomics: Digging deeper with complete mitochondrial genomes. Trends Ecol. Evol. 1999, 14, 394–398. [Google Scholar] [CrossRef]
  17. Cameron, S.L.; Lambkin, C.L.; Barker, S.C.; Whiting, M.F. Utility of mitochondrial genomes as phylogenetic markers for insect intraordinal relationships. A case study from flies (Diptera). Syst. Entomol. 2007, 32, 40–59. [Google Scholar] [CrossRef]
  18. Fenn, J.D.; Song, H.; Cameron, S.L.; Whiting, M.F. A preliminary mitochondrial genome phylogeny of Orthoptera (Insecta) and approaches to maximizing phylogenetic signal found within mitochondrial genome data. Mol. Phylogenet. Evol. 2008, 49, 59–68. [Google Scholar] [CrossRef] [PubMed]
  19. Dowton, M.; Cameron, S.L.; Austin, A.D.; Whiting, M.F. Phylogenetic approaches for the analysis of mitochondrial genome sequence data in the Hymenoptera—A lineage with both rapidly and slowly evolving mitochondrial genomes. Mol. Phylogenet. Evol. 2009, 52, 512–519. [Google Scholar] [CrossRef]
  20. Andrews, S. FastQC: A Quality Control Tool for High Throughput Sequence Data. 2010. Available online: http://www.bioinformatics.babraham.ac.uk/projects/fastqc (accessed on 29 April 2022).
  21. Bolger, A.M.; Lohse, M.; Usadel, B. Trimmomatic: A flexible trimmer for Illumina sequence data. Bioinformatics 2014, 30, 2114–2120. [Google Scholar] [CrossRef] [Green Version]
  22. Peng, Y.; Leung, H.C.M.; Yiu, S.M.; Chin, F.Y.L. IDBA-UD: A de novo assembler for single cell and metagenomic sequencing data with highly uneven depth. Bioinformatics 2012, 28, 1420–1428. [Google Scholar] [CrossRef] [Green Version]
  23. Wang, Y.; Cao, J.J.; Li, W.H. The complete mitochondrial genome of the styloperlid stonefly species Styloperla spinicercia Wu (Insecta: Plecoptera) with family-level phylogenetic analyses of the Pteronarcyoidea. Zootaxa 2017, 4243, 125–138. [Google Scholar] [CrossRef]
  24. Wang, Y.; Cao, J.J.; Murányi, D.; Li, W.H. Comparison of two complete mitochondrial genomes from Perlodidae (Plecoptera: Perloidea) and the family-level phylogenetic implications of Perloidea. Gene 2018, 675, 254–264. [Google Scholar] [CrossRef]
  25. Wang, Y.; Cao, J.J.; Li, N.; Ma, G.Y.; Li, W.H. The first mitochondrial genome from Scopuridae (Insecta: Plecoptera) reveals structural features and phylogenetic implications. Int. J. Biol. Macromol. 2019, 122, 893–902. [Google Scholar] [CrossRef] [PubMed]
  26. Kearse, M.; Moir, R.; Wilson, A.; Stones-Havas, S.; Cheung, M.; Sturrock, S.; Buxton, S.; Cooper, A.; Markowitz, S.; Duran, C.; et al. Geneious basic: An integrated and extendable desktop software platform for the organization and analysis of sequence data. Bioinformatics 2012, 28, 1647–1649. [Google Scholar] [CrossRef] [PubMed]
  27. Bernt, M.; Donath, A.; Jühling, F.; Externbrink, F.; Florentz, C.; Fritzsch, G.; Pütz, J.; Middendorf, M.; Stadler, P.F. MITOS: Improved de novo metazoan mitochondrial genome annotation. Mol. Phylogenet. Evol. 2013, 69, 313–319. [Google Scholar] [CrossRef]
  28. Greiner, S.; Lehwark, P.; Bock, R. Organellar genome DRAW (OGDRAW) version 1.3.1: Expanded toolkit for the graphical visualization of organellar genomes. Nucleic Acids Res. 2019, 47, W59–W64. [Google Scholar] [CrossRef] [PubMed] [Green Version]
  29. Abascal, F.; Zardoya, R.; Telford, M.J. TranslatorX: Multiple alignment of nucleotide sequences guided by amino acid translations. Nucleic Acids Res. 2010, 38, W7–W13. [Google Scholar] [CrossRef] [Green Version]
  30. Katoh, K.; Standley, D.M. MAFFT multiple sequence alignment software version 7: Improvements in performance and usability. Mol. Biol. Evol. 2013, 30, 772–780. [Google Scholar] [CrossRef] [Green Version]
  31. Talavera, G.; Castresana, J. Improvement of phylogenies after removing divergent and ambiguously aligned blocks from protein sequence alignments. Syst. Biol. 2007, 56, 564–577. [Google Scholar] [CrossRef] [Green Version]
  32. Tamura, K.; Stecher, G.; Peterson, D.; Filipski, A.; Kumar, S. MEGA6: Molecular evolutionary genetics analysis version 6.0. Mol. Biol. Evol. 2013, 30, 2725–2729. [Google Scholar] [CrossRef] [Green Version]
  33. Perna, N.T.; Kocher, T.D. Patterns of nucleotide composition at fourfold degenerate sites of animal mitochondrial genomes. J. Mol. Evol. 1995, 41, 353–358. [Google Scholar] [CrossRef]
  34. Librado, P.; Rozas, J. DnaSP v5: A software for comprehensive analysis of DNA polymorphism data. Bioinformatics 2009, 25, 1451–1452. [Google Scholar] [CrossRef] [Green Version]
  35. Benson, G. Tandem repeats finder: A program to analyze DNA sequences. Nucleic Acids Res. 1999, 27, 573–580. [Google Scholar] [CrossRef] [PubMed] [Green Version]
  36. Zuker, M. Mfold web server for nucleic acid folding and hybridization prediction. Nucleic Acids Res. 2003, 31, 3406–3415. [Google Scholar] [CrossRef] [PubMed]
  37. Ronquist, F.; Teslenko, M.; van der Mark, P.V.D.; Ayres, D.L.; Darling, A.; Höhna, S.; Larget, B.; Liu, L.; Suchard, M.A.; Huelsenbeck, J.P. MrBayes 3.2: Efficient Bayesian phylogenetic inference and model choice across a large model space. Syst. Biol. 2012, 61, 539–542. [Google Scholar] [CrossRef] [PubMed] [Green Version]
  38. Trifinopoulos, J.; Nguyen, L.T.; von Haeseler, A.; Minh, B.Q. W-IQTREE: A fast online phylogenetic tool for maximum likelihood analysis. Nucleic Acids Res. 2016, 44, W232–W235. [Google Scholar] [CrossRef] [Green Version]
  39. Boore, J.L. Complete mitochondrial genome sequence of the polychaete annelid Platynereis dumerilii. Mol. Biol. Evol. 2001, 18, 1413–1416. [Google Scholar] [CrossRef] [Green Version]
  40. Clary, D.O.; Wolstenholme, D.R. The ribosomal RNA genes of Drosophila mitochondrial DNA. Nucleic Acids Res. 1985, 13, 4029–4045. [Google Scholar] [CrossRef] [Green Version]
  41. Ojala, D.; Montoya, J.; Attardi, G. tRNA punctuation model of RNA processing in human mitochondria. Nature 1981, 290, 470–474. [Google Scholar] [CrossRef]
  42. Boore, J.L. Complete mitochondrial genome sequence of Urechis caupo, a representative of the phylum Echiura. BMC Genom. 2004, 5, 67. [Google Scholar] [CrossRef] [Green Version]
  43. Roques, S.; Fox, C.J.; Villasana, M.I.; Rico, C. The complete mitochondrial genome of the whiting, Merlangius merlangus and the haddock, Melanogrammus aeglefinus: A detailed genomic comparison among closely related species of the Gadidae family. Gene 2006, 383, 12–23. [Google Scholar]
  44. Wolstenholme, D.R. Animal mitochondrial DNA: Structure and evolution. Int. Rev. Cytol. 1992, 141, 173–216. [Google Scholar]
  45. Li, H.; Liu, H.Y.; Song, F.; Shi, A.M.; Zhou, X.G.; Cai, W.Z. Comparative Mitogenomic analysis of damsel bugs representing three tribes in the family Nabidae (Insecta: Hemiptera). PLoS ONE 2012, 7, e45925. [Google Scholar]
  46. Clary, D.O.; Wolstenholme, D.R. Drosophila mitochondrial DNA: Conserved sequences in the A+T-rich region and supporting evidence for a secondary structure model of the small ribosomal RNA. J. Mol. Evol. 1987, 25, 116–125. [Google Scholar] [CrossRef] [PubMed]
  47. Zhang, D.X.; Szymura, J.M.; Hewitt, G.M. Evolution and structural conservation of the control region of insect mitochondrial DNA. J. Mol. Evol. 1995, 40, 382–391. [Google Scholar] [CrossRef]
  48. Song, N.; Liang, A.P. Complete mitochondrial genome of the small brown planthopper, Laodelphax striatellus (Delphacidae: Hemiptera), with a novel gene order. Zool. Sci. 2009, 26, 851–860. [Google Scholar] [CrossRef] [PubMed]
  49. Zhang, D.X.; Hewitt, F.M. Insect mitochondrial control region: A review of its structure, evolution and usefulness in evolutionary studies. Biochem. Syst. Ecol. 1997, 25, 99–120. [Google Scholar] [CrossRef]
  50. Cao, J.J.; Wang, Y.; Huang, Y.R.; Li, W.H. Mitochondrial genomes of the stoneflies Mesonemoura metafiligera and Mesonemoura tritaenia (Plecoptera, Nemouridae), with a phylogenetic analysis of Nemouroidea. ZooKeys 2019, 835, 43–63. [Google Scholar] [CrossRef] [Green Version]
  51. Chen, Z.T.; Du, Y.Z. Comparison of the complete mitochondrial genome of the stonefly Sweltsa longistyla (Plecoptera: Chloroperlidae) with mitogenomes of three other stoneflies. Gene 2015, 558, 82–87. [Google Scholar] [CrossRef]
  52. Chen, Z.T.; Du, Y.Z. First Mitochondrial genome from Nemouridae (Plecoptera) reveals novel features of the elongated control region and phylogenetic implications. Int. J. Mol. Sci. 2017, 18, 996. [Google Scholar] [CrossRef]
  53. Baumann, R.W. Revision of the stonefly family Nemouridae (Plecoptera): A study of the world fauna at the generic level. Smithson. Contrib. Zool. 1975, 211, 1–73. [Google Scholar] [CrossRef] [Green Version]
  54. Wang, Y.; Cao, J.J.; Murányi, D.; Chen, X.L.; Yan, F.M. The complete mitochondrial genome of Amphinemura bulla Shimizu, 1997 (Plecoptera: Nemouridae) from Japan. Mitochondrial DNA Part B 2021, 6, 846–847. [Google Scholar] [CrossRef]
  55. Shen, Y.; Du, Y.Z. The complete mitochondrial genome of Flavoperla biocellata Chu, 1929 (Plecoptera: Perlidae) and the phylogenetic analyses of Plecoptera. PeerJ 2020, 8, e8762. [Google Scholar] [CrossRef] [PubMed] [Green Version]
Figure 1. Circular map of the S. fasciata mitogenome. Genes shown on the inside of the map are transcribed in a clockwise direction, whereas those on the outside of the map are transcribed counterclockwise.
Genes 13 01116 g001
Figure 2. The relative synonymous codon usage (RSCU) in the mitogenome of S. fasciata. PCGs represent protein-coding genes.
Genes 13 01116 g002
Figure 3. Evolutionary rates of taeniopterygid mitogenomes. The non-synonymous substitutions rate (Ka), the synonymous substitutions rate (Ks), and the ratio of the rate of non-synonymous substitutions to the rate of synonymous substitutions (Ka/Ks) for each PCG.
Genes 13 01116 g003
Figure 4. Predicted secondary structures of 22 tRNAs in S. fasciata. Conserved sites within three taeniopterygid species are indicated as black nucleotides within gray spheres. Red arrows correspond to insertions.
Genes 13 01116 g004
Figure 5. Organization of the control region in S. fasciata mitogenome. (a) control region structure of S. fasciata. TR is the abbreviation of tandem repeat units; (b) putative stem–loop structures found in the control region of S. fasciata.
Genes 13 01116 g005
Figure 6. Phylogenetic tree inferred from the sequences of 13 PCGs plus two rRNAs of the mitochondrial genomes of 28 Nemouroidea species and two outgroups. Numbers at nodes are Bayesian posterior probabilities (left) and ML bootstrap values (right).
Genes 13 01116 g006
Table 1. General information of nemourid species used in this study.
FamilySpeciesNumber (bp)Accession Number
CapniidaeApteroperla tikumana15,564NC_027698
Capnia zijinshana16,310KX094942
Mesocapnia arizonensis14,921KP642637 *
Mesocapnia daxingana15,524KY568983 *
LeuctridaeRhopalopsole bulbifera15,599MK111419 *
Paraleuctra cercia15,625MK492251
Perlomyia isobeae15,795MK492252
NemouridaeNemoura meniscata15,895MN944386
Nemoura nankinensis16,602KY940360
Nemoura papilla15,774MK290826
Amphinemura longispina15,709MH085446
Amphinemura bulla15,827MW339348
Amphinemura claviloba15,707MN720741
Indonemoura jacobsoni15,642MH085448
Indonemoura nohirae15,738MH085449
Mesonemoura metafiligera15,739MH085450
Mesonemoura tritaenia15,778MH085451
Protonemura kohnoae15,707MH085452
Protonemura orbiculata15,758MH085453
Protonemura datongensis15,756MT276842
Sphaeronemoura elephas15,846MN944385
Sphaeronemoura grandicauda15,661MH085454
Sphaeronemoura acutispina15,016MH085455 *
Sphaeronemoura hainana15,260MK111420 *
NotonemouridaeNeonemura barrosi14,852MK111418 *
TaeniopterygidaeTaeniopteryx ugola15,353MG589786
Doddsia occidentalis16,020MG589787
Strophopteryx fasciata15,527ON500674
Perlodidae (Outgroup)Isoperla eximia16,034MG910457
Pseudomegarcys japonica16,067MG910458
* Incomplete mitogenome sequence.
Table 2. Mitochondrial nucleotide composition in three taeniopterygid species.
RegionFeatureS. fasciataD. occidentalisT. ugola
Whole mitgenomeSize (bp)15,52716,02015,353
A + T%68.168.469.8
AT-skew0.030.020.02
GC-skew−0.18−0.21−0.15
Protein-coding genesSize (bp)11,19311,14811,223
A + T%66.966.868.6
AT-skew−0.19−0.20−0.20
GC-skew−0.03−0.010.03
tRNAsSize (bp)147914771471
A + T%70.970.871.3
AT-skew0.03−0.01−0.02
GC-skew−0.130.130.13
rRNAsSize (bp)213121262119
A + T%71.272.472.7
AT-skew−0.05−0.06−0.05
GC–skew0.280.280.28
Control regionSize (bp)7071248537
A + T%71.072.778.0
AT-skew0.070.010.02
GC-skew−0.16−0.30−0.20
Table 3. Start and stop codons of three taeniopterygid mitogenomes.
GeneStart CodonStop Codon
S. fasciataT. ugolaD. occidentalisS. fasciataT. ugolaD. occidentalis
ND2ATGGTGATGTAATAATAA
COIATTATTATTT-T-T-
COIIATGATGATGT-T-T-
ATP8ATTATCATTTAATAATAA
ATP6ATGATGATGTAATAATAA
COIIIATGATGATGTAATAATAA
ND3ATTATTATTTAGTAGTAG
ND5ATGGTGATGT-T-T-
ND4ATGATGATGTAATAATAA
ND4LATGATGATGTAATAATAA
ND6ATGATTATTTAATAATAA
CYTBATGATGATCTAGTAATAG
ND1TTGTTGTTGTAGTAGTAG
Publisher’s Note: MDPI stays neutral with regard to jurisdictional claims in published maps and institutional affiliations.

