Article

The Influence of the Atlantic Multidecadal Oscillation on the Choco Low-Level Jet and Precipitation in Colombia

by
Wilmar Loaiza Cerón
1,2,*,
Rita Valeria Andreoli
3,
Mary Toshie Kayano
4,
Rodrigo Augusto Ferreira de Souza
3,
Charles Jones
5 and
Leila M. V. Carvalho
5
1
Department of Geography, Faculty of Humanities, Universidad del Valle. Calle 13 #100–00, Cali, P.O. Box 25360, Colombia
2
Postgraduation Program CLIAMB, Instituto Nacional de Pesquisas da Amazônia (INPA)-Universidade do Estado do Amazonas (UEA), Ave. André Araújo, 2936, Manaus CEP 69060–001, Brazil
3
Universidade do Estado do Amazonas, Escola Superior de Tecnologia, Av. Darcy Vargas, 1200, Parque 10 de Novembro, Manaus, AM 69050–020, Brazil
4
Instituto Nacional de Pesquisas Espaciais, Centro de Previsão de Tempo e Estudos Climáticos, Divisão de Modelagem e Desenvolvimento. Av. dos Astronautas, 1758, São José dos Campos, SP 12227–010, Brazil
5
Department of Geography, University of California, Santa Barbara, CA 94720, USA
*
Author to whom correspondence should be addressed.
Atmosphere 2020, 11(2), 174; https://doi.org/10.3390/atmos11020174
Submission received: 23 December 2019 / Revised: 4 February 2020 / Accepted: 5 February 2020 / Published: 7 February 2020
(This article belongs to the Special Issue Central America and Caribbean Hydrometeorology and Hydroclimate)

Abstract

:
This study examines the influence of the Atlantic Multidecadal Oscillation (AMO) on the Choco Low-level Jet (CJ) variations during the 1983–2016 period. Considering the September–November (SON) 925 hPa zonal wind index in the CJ core, a significant breakpoint occurs in 1997 with larger values after 1997. The changes in the CJ and Caribbean Low-Level Jet (CLLJ), and their related ocean-atmospheric patterns and impacts on precipitation over Colombia were analyzed considering separately the 1983–1996 and 1998–2016 periods, which overlap the cold and warm AMO phases, respectively. During the 1998–2016 period, the negative sea surface temperature (SST) anomalies in the tropical Pacific Ocean and the positive ones in the Caribbean Sea and Tropical North Atlantic (TNA) strengthen the CJ and weaken the CLLJ, and moisture is transported into Central and Western Colombia increasing the rainfall there. Our results indicate that part of the CJ strengthening after 1997 was due to a higher percentage of intense CJ events coinciding with La Niña events during the warm AMO and cold Pacific Decadal Oscillation (PDO) background. However, the AMO-related SST and sea level pressure (SLP) variations in the TNA seem to be more crucial in modulating the CJ and CLLJ intensities, such that CJ is weakened (intensified) and CLLJ is intensified (weakened) before (after) 1997. As far as we know, the relations of the CJ and CLLJ intensities to the AMO phases were not examined before and might be useful for modeling studies.

Graphical Abstract

1. Introduction

Northwestern South America (SA) has a complex atmospheric dynamics modulated by several factors such as the Intertropical Convergence Zones (ITCZ) of the Atlantic and Pacific Oceans, moisture transport from the Amazon Basin, the trade winds, and the local topography characterized by three branches of the Andes in Colombia. The dynamical factors, interacting with the local processes, determine the spatiotemporal variability of precipitation in the area [1]. The ITCZ, through its meridional migration, modulates the annual rainfall cycle, which is bimodal or unimodal over Northwestern South America [2,3,4,5,6]. The rainfall regimes in six Colombian regions are illustrated in Figure 1: the northern and central Pacific region of Colombia (NCP), the Upper Patía Basin (UPB), the Pacific region of Southern Colombia (SP), the Middle Magdalena Basin (MMB), the Upper Magdalena Basin (UMB), and the Upper Cauca Basin (UCB). The NCP region has uniformly distributed rainfall year-round without a defined dry season, due to the persistence of the ITCZ, the convergence of the trade winds at the equator and the Choco Low-Level Jet (CJ), which interacts with the mesoscale convective systems [7,8] (Figure 1a). The SP region presents a bi-modal annual cycle with two wet seasons, one in April–May (AM) and the other in October–January, and dry seasons in June–September and February–March (Figure 1c). The Colombia Andean region, which includes the MMB, UMB, and UCB, experiences an annual bi-modal cycle with two wet seasons, one in AM and the other in September–November (SON), and dry seasons in December–February (DJF) and June–August (JJA), mainly due to the ITCZ crossing twice the equator [2,4] (Figure 1d–f). However, the annual rainfall cycle in northwestern SA is not entirely explained by the meridional migration of the ITCZ. The connection of the ITCZ and the dynamics of three Low-Level Jets (LLJs), are fundamental in transporting water vapor from oceanic to continental masses [9,10,11,12] and might influence local precipitation patterns. Namely the CJ [7,9,13], the Caribbean Low-Level Jet (CLLJ) [14,15,16,17], and Corriente de Los Llanos Orientales, or Eastern Andes Jet are important precipitation-generating mechanisms in the region.
The CJ exhibits an annual cycle with strengthening in SON and weakening from March to May (MAM) [7,16,18,19]. Serna et al. [20] found speeds varying from 5 m/s to 7 m/s in the CJ core during the boreal autumn (SON); while the lowest speeds not exceeding 3 m/s were observed during MAM and DJF. During SON, the CJ modulates the wet season over western and central Colombia [7]. On the other hand, the CLLJ has a semiannual cycle, with peaks in DJF and JJA and is centered at 15°N with no significant latitudinal migrations during the year, differently from the CJ [14,21,22,23]. Still, both the CJ and CLLJ present interannual variations attributed to the El Niño-Southern Oscillation (ENSO), which in part explain the precipitation variability in the Colombian territory [1,14,24,25,26,27,28]. Recently, Navarro et al. [29] and Serna et al. [20] showed that the CJ, CLLJ, and the precipitation response to the ENSO in northwestern SA depend on the region. Thus, previous studies have shown that most of the atmospheric moisture transport into Colombia comes from the Pacific, Atlantic, and continental sources (moisture recycling in the Magdalena, Amazon, and Orinoco basins) [11,16,28,30]. The main moisture sources vary throughout the year: The Caribbean Sea and Tropical North Atlantic (TNA) in association with the CLLJ are the primary sources during DJF; and the Eastern Pacific in the vicinity of Peru and Chile in association with the CJ, during SON [19]. The mesoscale convective systems cause strong advection along the western coast of SA in SON and might be affected by the CJ [19]. Thus, the moisture flow associated with the CJ and CLLJ feeds the systems that cause intense precipitation over the Colombia Andean and Pacific regions, fundamental to the economic and environmental sustainability of the country [7,31,32]. Thus, a better understanding of the factors responsible for the CJ variability during the wet season of Colombia might provide useful information for regional climate monitoring purposes.
While the CJ variability on seasonal and interannual time scales has been previously investigated, its low-frequency variations were not. The Atlantic Multidecadal Oscillation (AMO) is one phenomenon that might be related to the low-frequency variations in the CJ. The AMO manifests itself as an internal mode of sea surface temperature (SST) variability with the same sign anomalies in a main center at 55°N and in a secondary center at 15°N in the North Atlantic [33,34,35,36]. Several studies have provided evidence that the AMO modulates the inter-annual climate variability in many regions in SA [37,38,39,40]. Furthermore, the AMO connects to the Pacific through a multidecadal timescale Walker cell associated with the slowly evolving mean SST state in the tropical Pacific and Atlantic Oceans [41,42,43]. This relation is such that the AMO in the warm (cold) phase induces a strengthening (weakening) of the trade winds in the eastern equatorial Pacific, which through the Bjerknes feedback process, lead to the cooling (warming) in the Eastern Pacific [41,42,44]. The strengthening of Walker cell and the Eastern Pacific cooling since the early 1990s are linked to the Atlantic warming in the 30°S–60°N sector, which induces an abnormal acceleration of the Pacific trades [41]. Kayano et al. [40] discussed the negative relation of the SST anomaly pattern in the Atlantic and Pacific Oceans in a multidecadal time scale in terms of the low-frequency backgrounds associated with the AMO and the Pacific Decadal Oscillation (PDO), such that the warm AMO (WAMO) phase relates to the cold PDO (CPDO) phase and the cold AMO (CAMO) phase relates to the warm PDO (WPDO) phase. They also showed that these backgrounds affect the interannual climate variability. The influence of the AMO on the South American Low-Level Jet was previously analyzed [45]. Nevertheless, the influence of the AMO on the CJ variations was not examined before. This aspect is investigated here using data during the 1983–2016 period. We also analyzed the precipitation anomalies over Colombia associated with the CJ events under distinct AMO phases. Section 2 presents the data and methodology; followed by the results and discussions in Section 3, and finally the conclusions of the paper are in Section 4.

2. Data and Methodology

Figure 1 shows the CJ area of influence, the CBC [46,47,48,49,50], which extends longitudinally over the Darien province, eastern Panama and northwestern Ecuador and covers 187,000 km2, 53% of which is in Colombia [51]. The UMB and MMB cover the Andean region, inhabited by about 75% of the Colombian population and is the major developed center of the country [52]. The UCB is the second most important source of surface water and crosses the western part of the country where there is a high demand for domestic, agricultural, and industrial water supplies [53]. This figure also illustrates the CJ and CLLJ.
Monthly precipitation data were extracted from the Climate Hazards Group InfraRed Precipitation with Station Data (CHIRPS, 2019) [54], version v2.0, created and administered by the U.S. Geological Survey and University of California, Santa Barbara [55,56]. This dataset has information in the 50°S–50°N band in all longitudes from 1981 to the present with a horizontal resolution of 0.05°. Funk et al. [55] evaluated the CHIRPS precipitation during the rainy season in areas of complex terrain such as Colombia and Peru and found that the CHIRPS estimates were comparable to those of the Global Precipitation Climatology Centre (GPCC) dataset. The monthly reconstructed SST dataset (NOAA/ERSST, 2018) [57], version 5, derived from the International Comprehensive Ocean-Atmosphere Dataset, with a horizontal resolution of 2° was also used [58]. In addition, the monthly zonal (u) and meridional (v) winds, specific humidity (q) at 1000 to 300 hPa pressure levels, 500 hPa vertical velocity in pressure coordinates and Sea Level Pressure (SLP) data were obtained from the European Centre for Medium-Range Weather Forecasts Interim Reanalysis (ECMWF/ERA-I, 2018) [59,60]. These data are in a horizontal resolution of 1° and provide reliable representation of the atmospheric patterns. The ECMWF/ERA-I dataset reproduces some of Colombia’s climatic characteristics not well represented in previous reanalyses such as ERA-40 and NCEP/NCAR [30,61,62]. The ECMWF/ERA-I dataset presents a special sensitivity to the local orographic features of the Pacific region of Colombia and of the Caribbean basin, which exhibit the greatest complexity due to the presence of the Andes mountain range and the spatial variability of the moisture transport processes [30]. All variables were obtained for the 1983–2016 period in the following domains: 15° N–5° S and 85° W–65° W for precipitation; 40° N–40° S and 120° E–0°, for the SST, SLP and vertical velocity; 100° W–60° W and 20° N–10° S for the 925 hPa zonal and meridional winds, and the variables of the vertically integrated moisture flux. The 1983–2016 period was the common period with available data for the datasets used here (CHIRPS, NOAA/ERSST and ECMWF/ERA-I).
The vertically integrated moisture flux (VIMFC) and its convergence were calculated from the integration from surface pressure ( p o ) up to 300 hPa, since there is less water vapor above 300 hPa, and the moisture measurements at these levels are subject to large instrumental errors [28,63]. The calculation was conducted according to the equations:
Q u = 1 g p o p t ( q u ) d p
Q v = 1 g p o p t ( q v ) d p
where Q u and Q v represent the zonal and meridional moisture fluxes integrated from the surface p o up to the pressure at the top of the layer, p t (300 hPa), g is the acceleration due to gravity (m s−2), and q is the specific humidity (kg kg−1). The vertically integrated moisture flux unit is given in kg m−1 s−1.
Following previous studies, the index defined as the 925 hPa zonal wind average along 80° W and between 2° N and 7° N was constructed to examine the variability of the CJ [7,9,16,28]. Poveda et al. [9] used the 925 hPa horizontal wind fields over northern SA, to characterize the CJ and the CLLJ, and their associated moisture transport on monthly and seasonal scales. This index was obtained for the SON wet season. This season was chosen because it coincides with that when the highest CJ activity occurs. First, the homogeneity of the SON zonal wind index during the 1983–2016 period was tested. Following previous suggestion that a combination of statistical methods is more effective in assessing inhomogeneities [64,65], we used three homogeneity tests: (1) the nonparametric Pettitt test [66] to seek change points along the time series, estimating the p-values using Monte Carlo resampling, (2) the Buishand range test [67], and (3) the Standard Normal Homogeneity Test (SNHT) [68,69]. These tests were extensively used to detect homogeneity in historical series of hydrometeorological variables [70,71,72,73,74], and have some common features, but also some differences. Buishand range and Pettit tests detect interruptions in the middle of a time series, while SNHT, near the beginning and end of a series [75]. The Buishand range test and SNHT assume that the values are normally distributed, but the Pettitt test does not, since it is based on the ranks of the elements of a series rather than on the values themselves. This approach of the Pettitt test also implies that it is less sensitive to outliers than the other tests [64,65]. According to Wijngaard et al. [64], if all tests neglect the null hypothesis, or two out of three detect the breaking point in the same time step, that time step is assumed as a breaking point and the time series is non homogeneous. Here, the homogeneity tests were considered at the 0.05 significance level (p-value).
Once the break point is detected, the SON zonal wind speed percentiles were used to classify the SON seasons with high to weak CJ activity, separately for periods before and after the breaking point. Then, for each period, the SON seasons with high CJ activity are those with R > 0.50. This rank value implies that 50% of the years are classified with high CJ activity.
Afterwards, the oceanic and atmospheric patterns associated with the high CJ activity during the Colombian wet season (SON) were determined using the composite analysis. Composite analysis is recognized as an effective technique to identify conditions observed during specific climate states and provide valuable information of the physical mechanisms involved [76]. Composite analyses for the years before and after breaking point were performed separately. The difference composites between these two periods are also presented. Composites of the 925 hPa wind, and of the standardized anomalies of the precipitation, SST, SLP, VIMFC, and 500 hPa vertical velocity in pressure coordinate were obtained. Monthly standardized anomalies of the variables refer to the means and standard deviation of the 1983–2016 period. The statistical significances of the composites and of the difference composites were tested using the Student’s t-test for significance of the mean and of the difference between two means [77,78]. We consider the degrees of freedom as the number of events and the significance tests were applied at the 95% confidence level.
In addition, the SST data for the 1870–2016 period were used here to construct the SON SST anomaly mean states for the periods before and after the breakpoint. In this case, as proposed by Kayano et al. [40,79], the linear trend of the 1870–2016 time series at each grid point was removed to eliminate the effects of climate change. The standardized monthly anomalies for the period 1983–2016 in the domain limited at 60° N, 60° S, 120° E and the Greenwich longitude were obtained. In this case, the means and standard deviations were in relation to the 1983–2016 period. The AMO index [34] and the PDO index [80] were obtained from the NOAA [81,82].

3. Results and Discussions

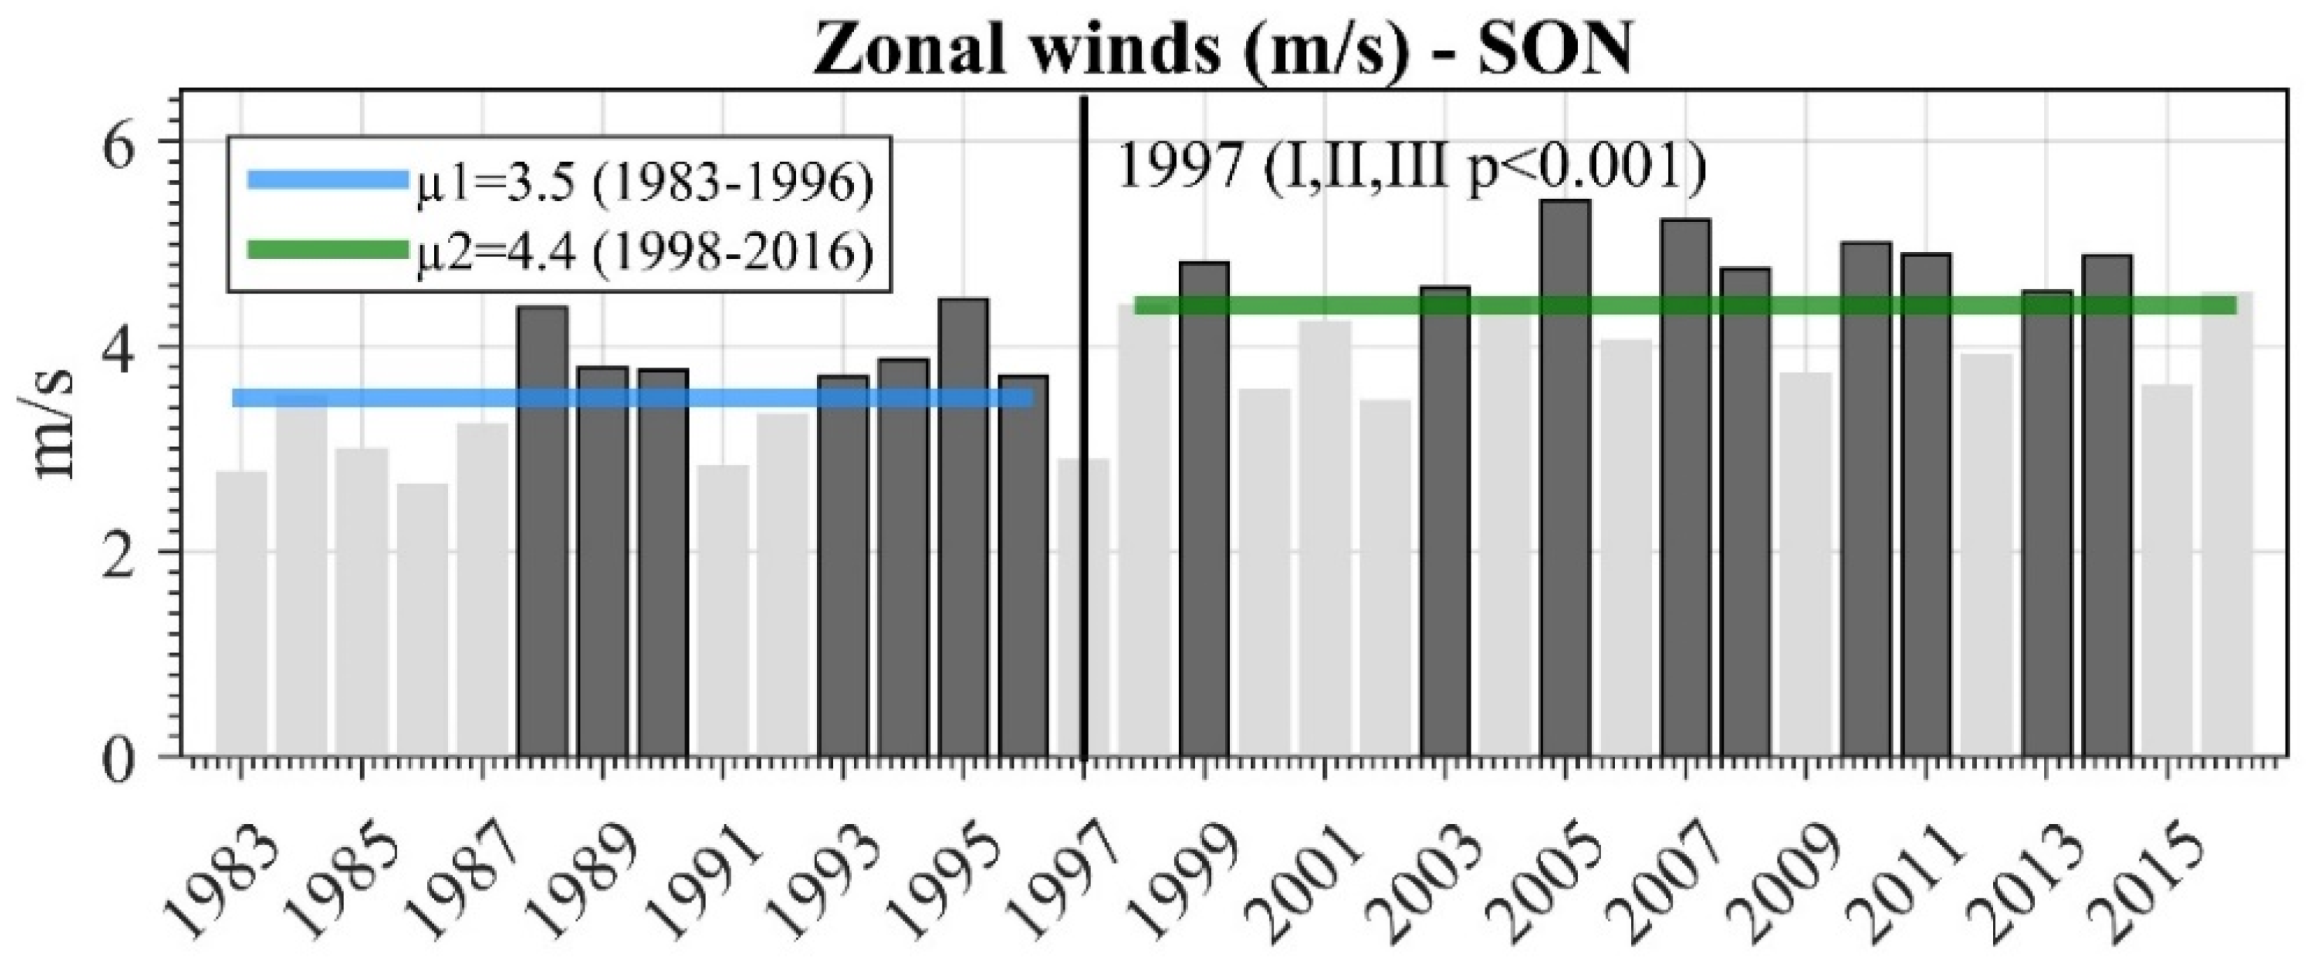
3.1. Changes in Zonal Wind Index

The SON zonal wind index shows an upward break in 1997 (p < 0.001) identified with the three statistical tests (Figure 2). The rupture year in 1997 justifies to split the SON zonal wind index into two times series, one spanning over the 1983–1996 period and the other over the 1998–2016 period, defined from now on as periods before and after 1997. In Figure 2 the straight lines parallel to the x-axis represent the averages of the 1983–1996 and 1998–2016 periods. The SON index reaches mean (maximum) values around 3.5 (4.5) m/s during 1983–1996 and 4.4 (5.4) m/s during 1998–2016. These values are consistent with those previously found to characterize the CJ [9,11,12,20]. Thus, the SON index shows higher values after 1997 than before.
The zonal wind speed percentiles were used to classify the SON seasons with high to weak activity separately for the 1983–1996 and 1998–2016 periods. The percentile rank (R) time series were constructed by ranking the SON zonal wind values from 1 to 14 (19) and dividing them by 14 (19), which is the number of years in the 1983–1996 (1998–2016) period. The years with zonal wind above the 50th percentile in the periods before and after 1997 are listed in Table 1 and represented by the dark gray bars in Figure 2.
In addition, the periods before and after 1997 overlap those with distinct low-frequency SST backgrounds associated with the PDO and the AMO previously discussed by Kayano et al. [40,79]. In fact, SST anomaly mean state during the 1983–1996 period shows features of the CAMO/WPDO and that during 1998–2016, of the WAMO/CPDO background (Figure 3a,b). Additionally, the CJ and AMO indices are significantly and positively correlated with a correlation of 0.93, and the CJ and PDO indices are significantly and negatively correlated with a correlation of −0.69 (Figure 3c). These results indicate that the AMO and PDO backgrounds after 1997 contribute to strengthen the CJ, and those before 1997, to weaken the CJ. Therefore, our analyses for the two selected periods can be interpreted in terms of the multidecadal variability.

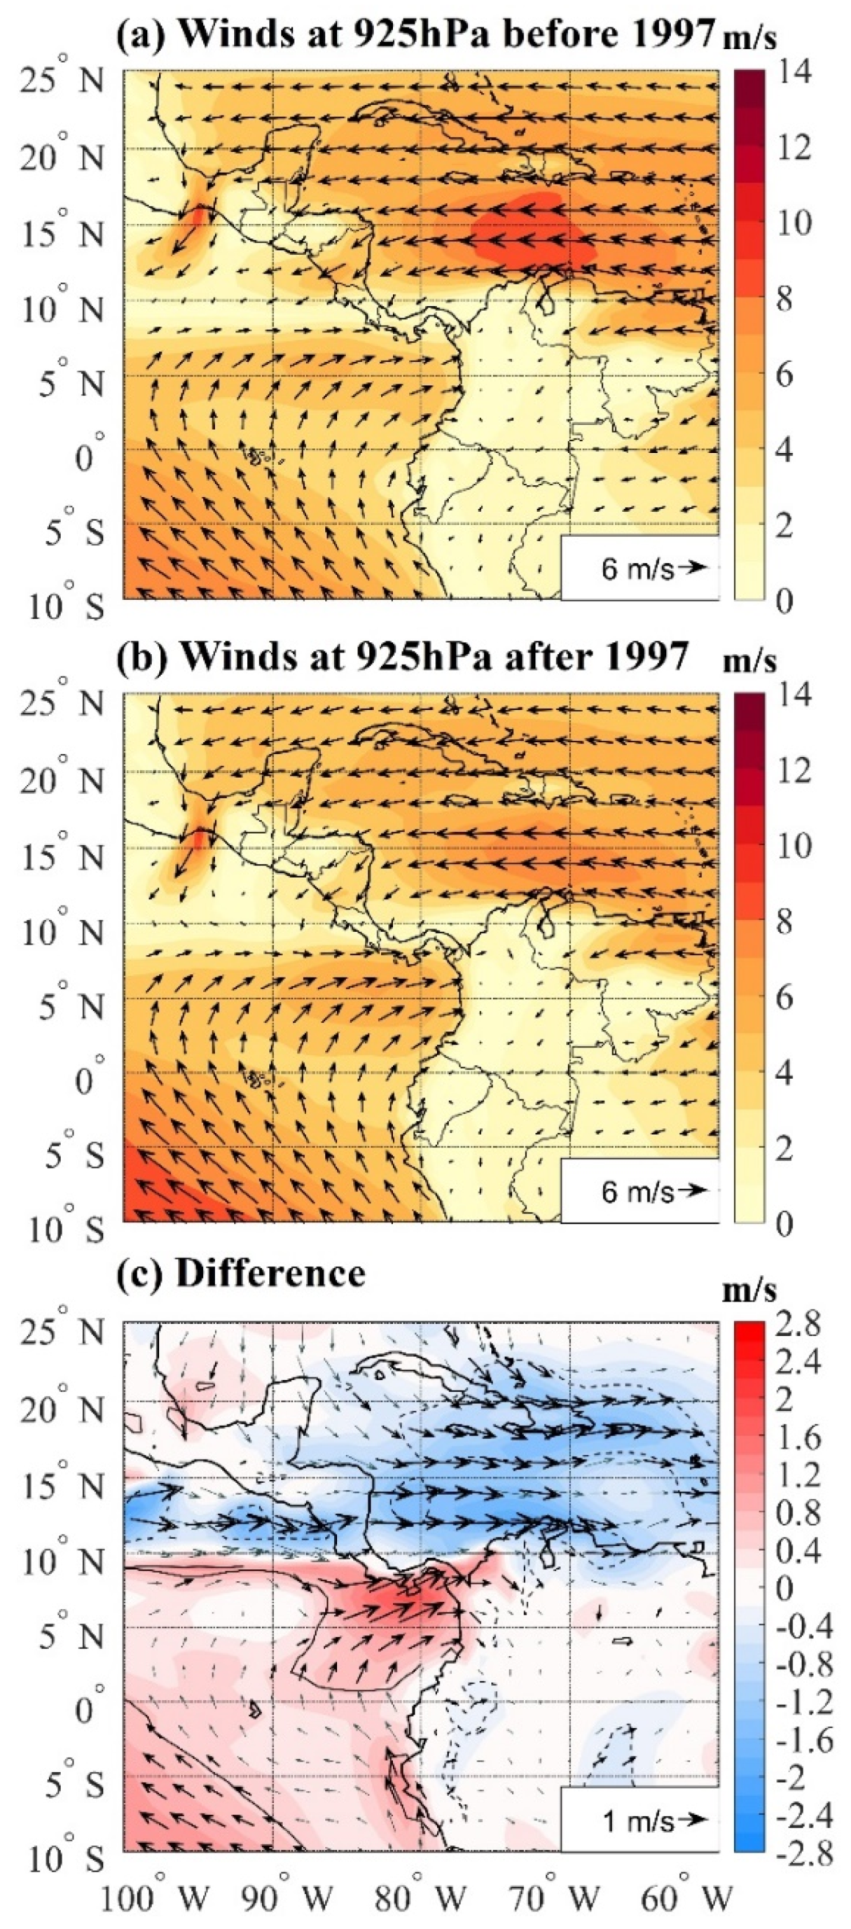
3.2. Composites of the 925 hPa Winds

Figure 4 shows the 925 hPa wind vector pattern in northwestern SA for the years before and after 1997. The CJ is well established during both periods with winds of 5–6 m/s centered around 5° N (Figure 4a,b). These results are consistent with previous studies on the presence of the CJ during SON when the maximum annual peak of the winds occurs [7,9,12]. Meanwhile, the CLLJ speed varies from 8 m/s to 10 m/s over the Colombian Caribbean at 70°–80° W and 12°–15° N. A notable feature is the inverse relationship between the CJ and CLLJ intensities, with a strong (weak) CJ and a weak (strong) CLLJ after (before) 1997. Additionally, the CJ is clearly observed over the easternmost fringe of the tropical Pacific west of the coast of Peru and Colombia, with a strong southerly component (Figure 4a,b). According to Poveda and Mesa [7] and Poveda et al. [9], this characteristic is explained by (1) topographic lifting; (2) predominant north–south orientation of the SA northwestern coast; and (3) SST and SLP gradients between the Ecuador–Peru cold tongue and the Western Colombian coast. Figure 4c shows the difference composite of the 925 hPa winds between the two analyzed periods. In this case, the scalar field refers to the difference of the wind magnitudes. The positive anomalies in the CJ region indicate the CJ strengthening, and the negative anomalies around 15° N in the CLLJ region indicate its weakening after 1997 (Figure 4c).

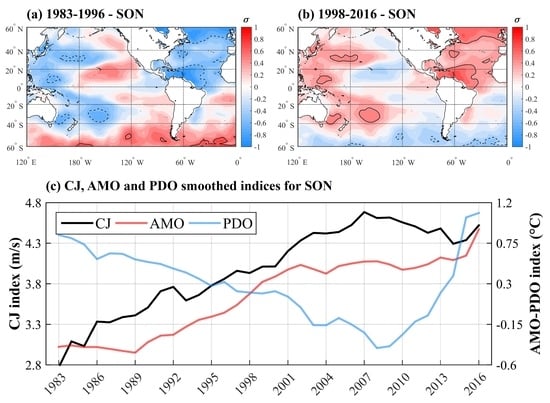
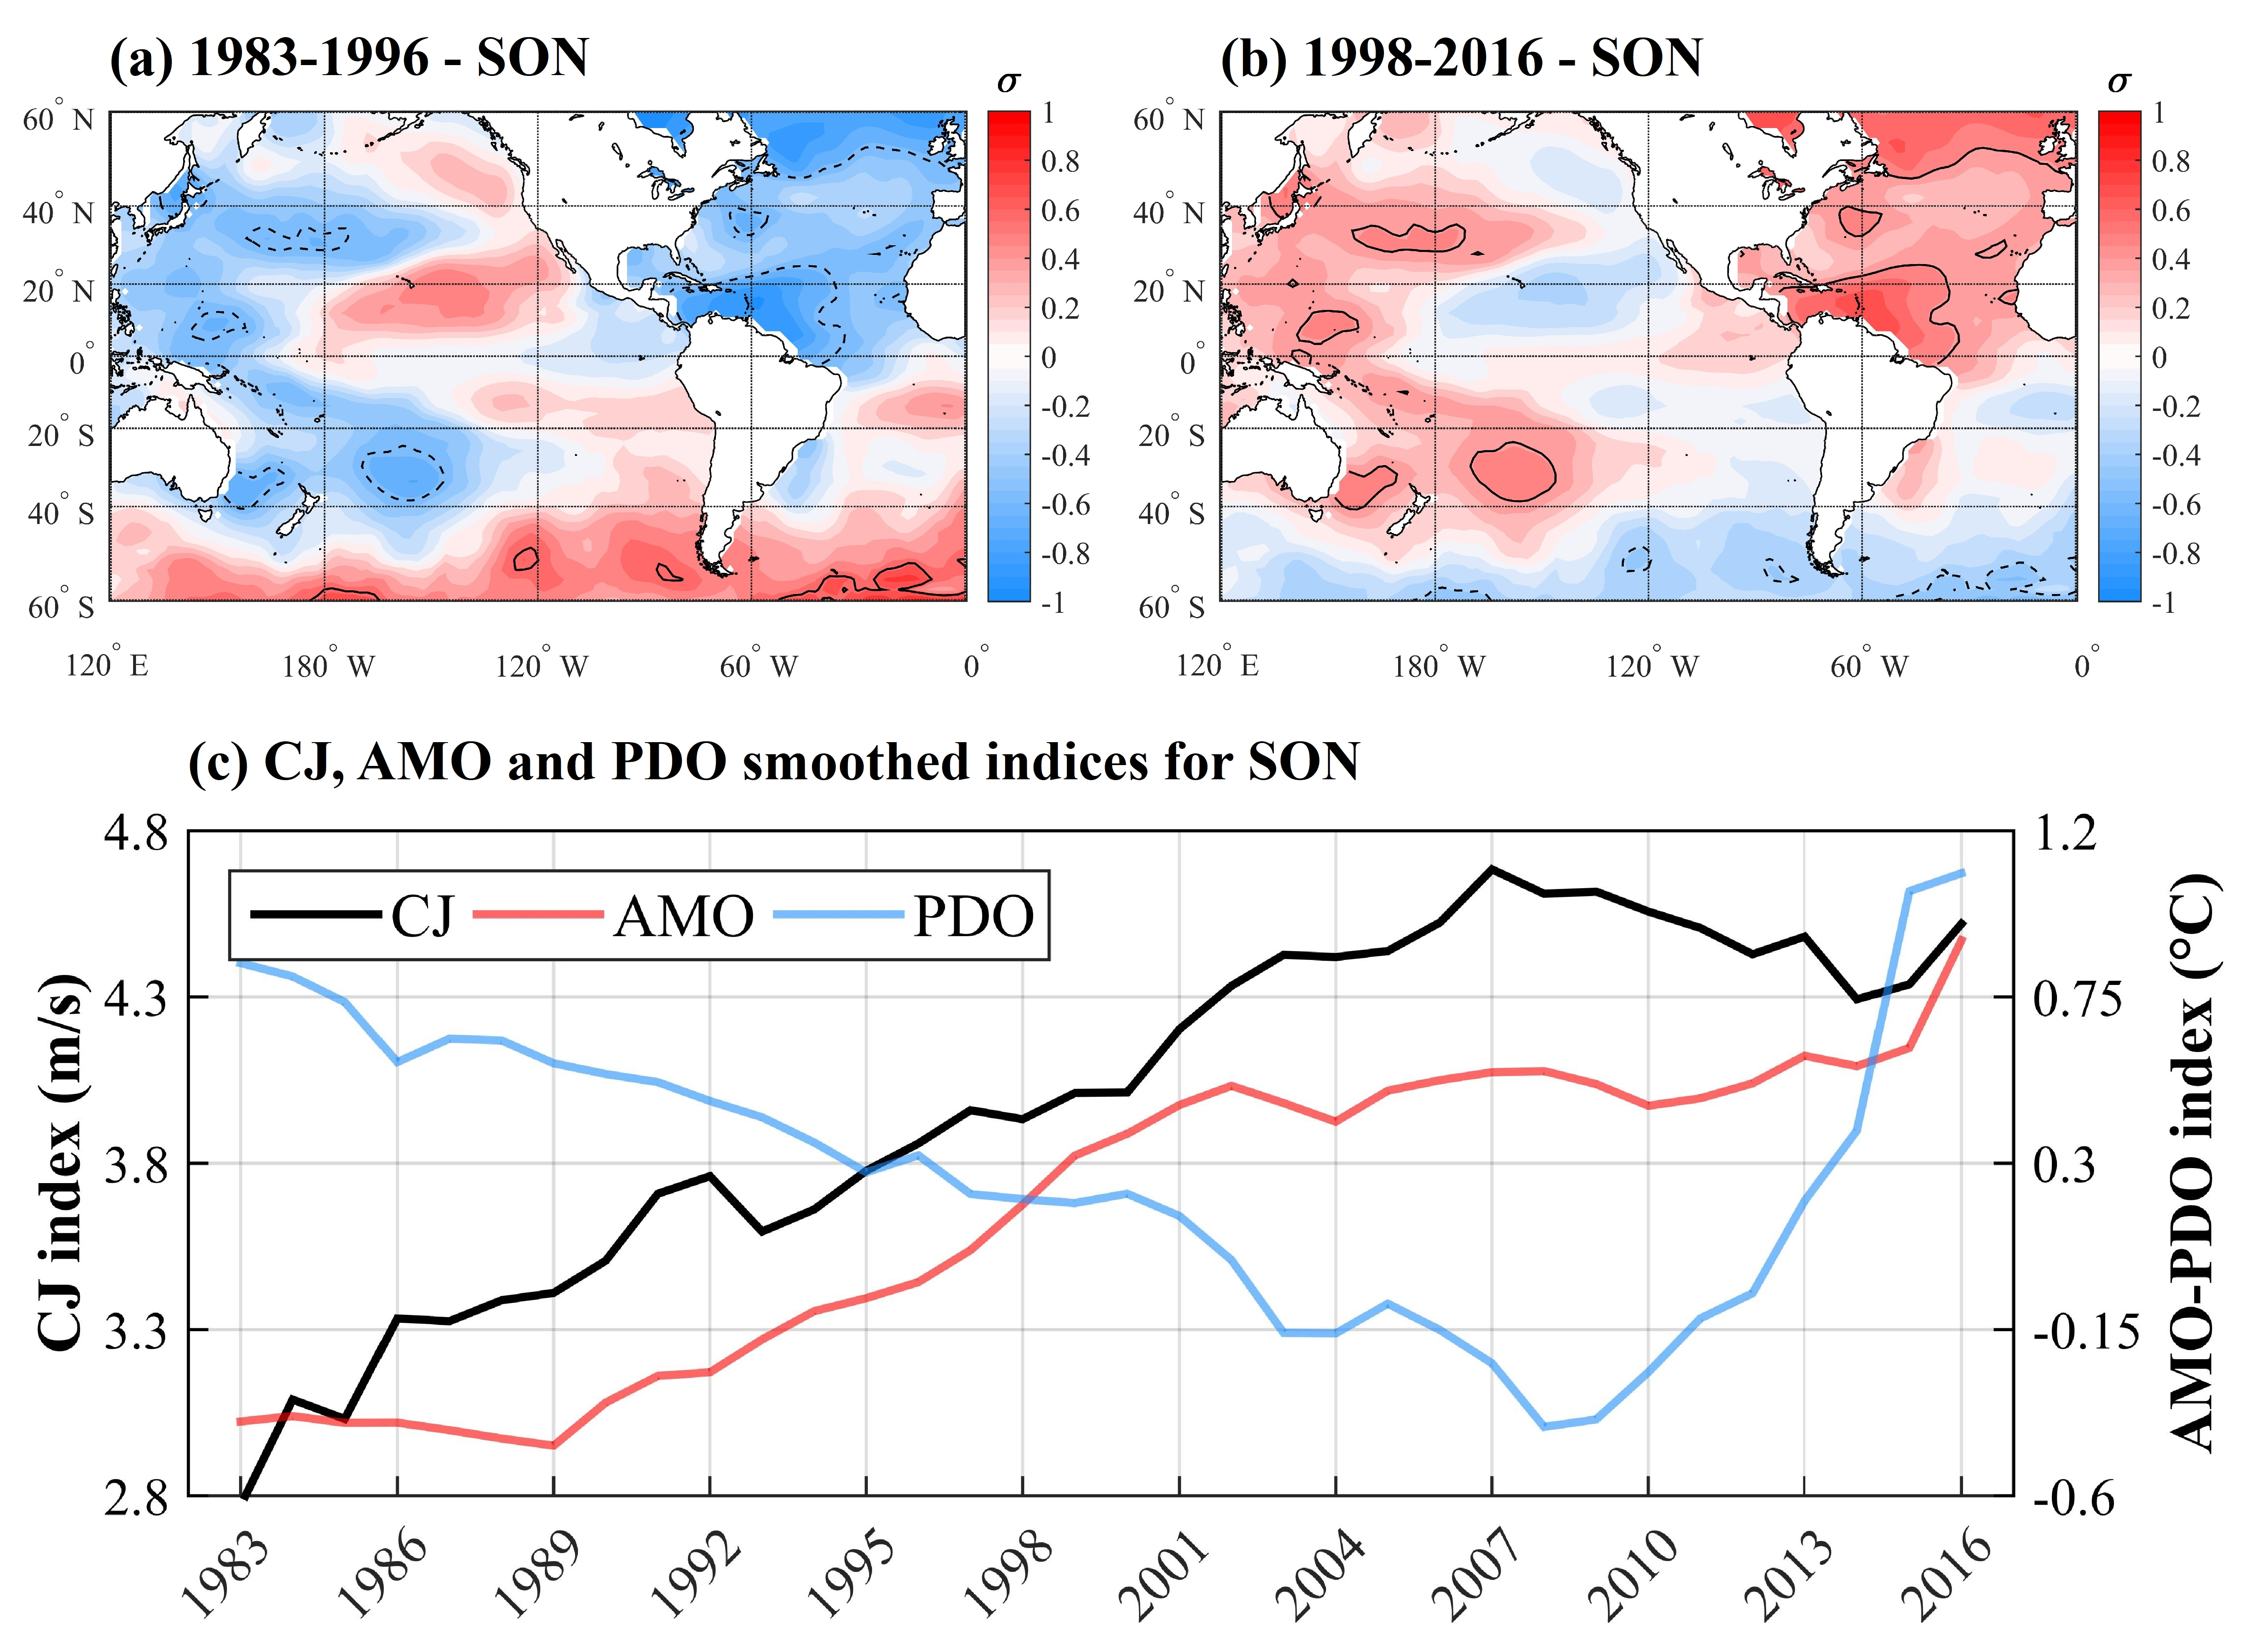
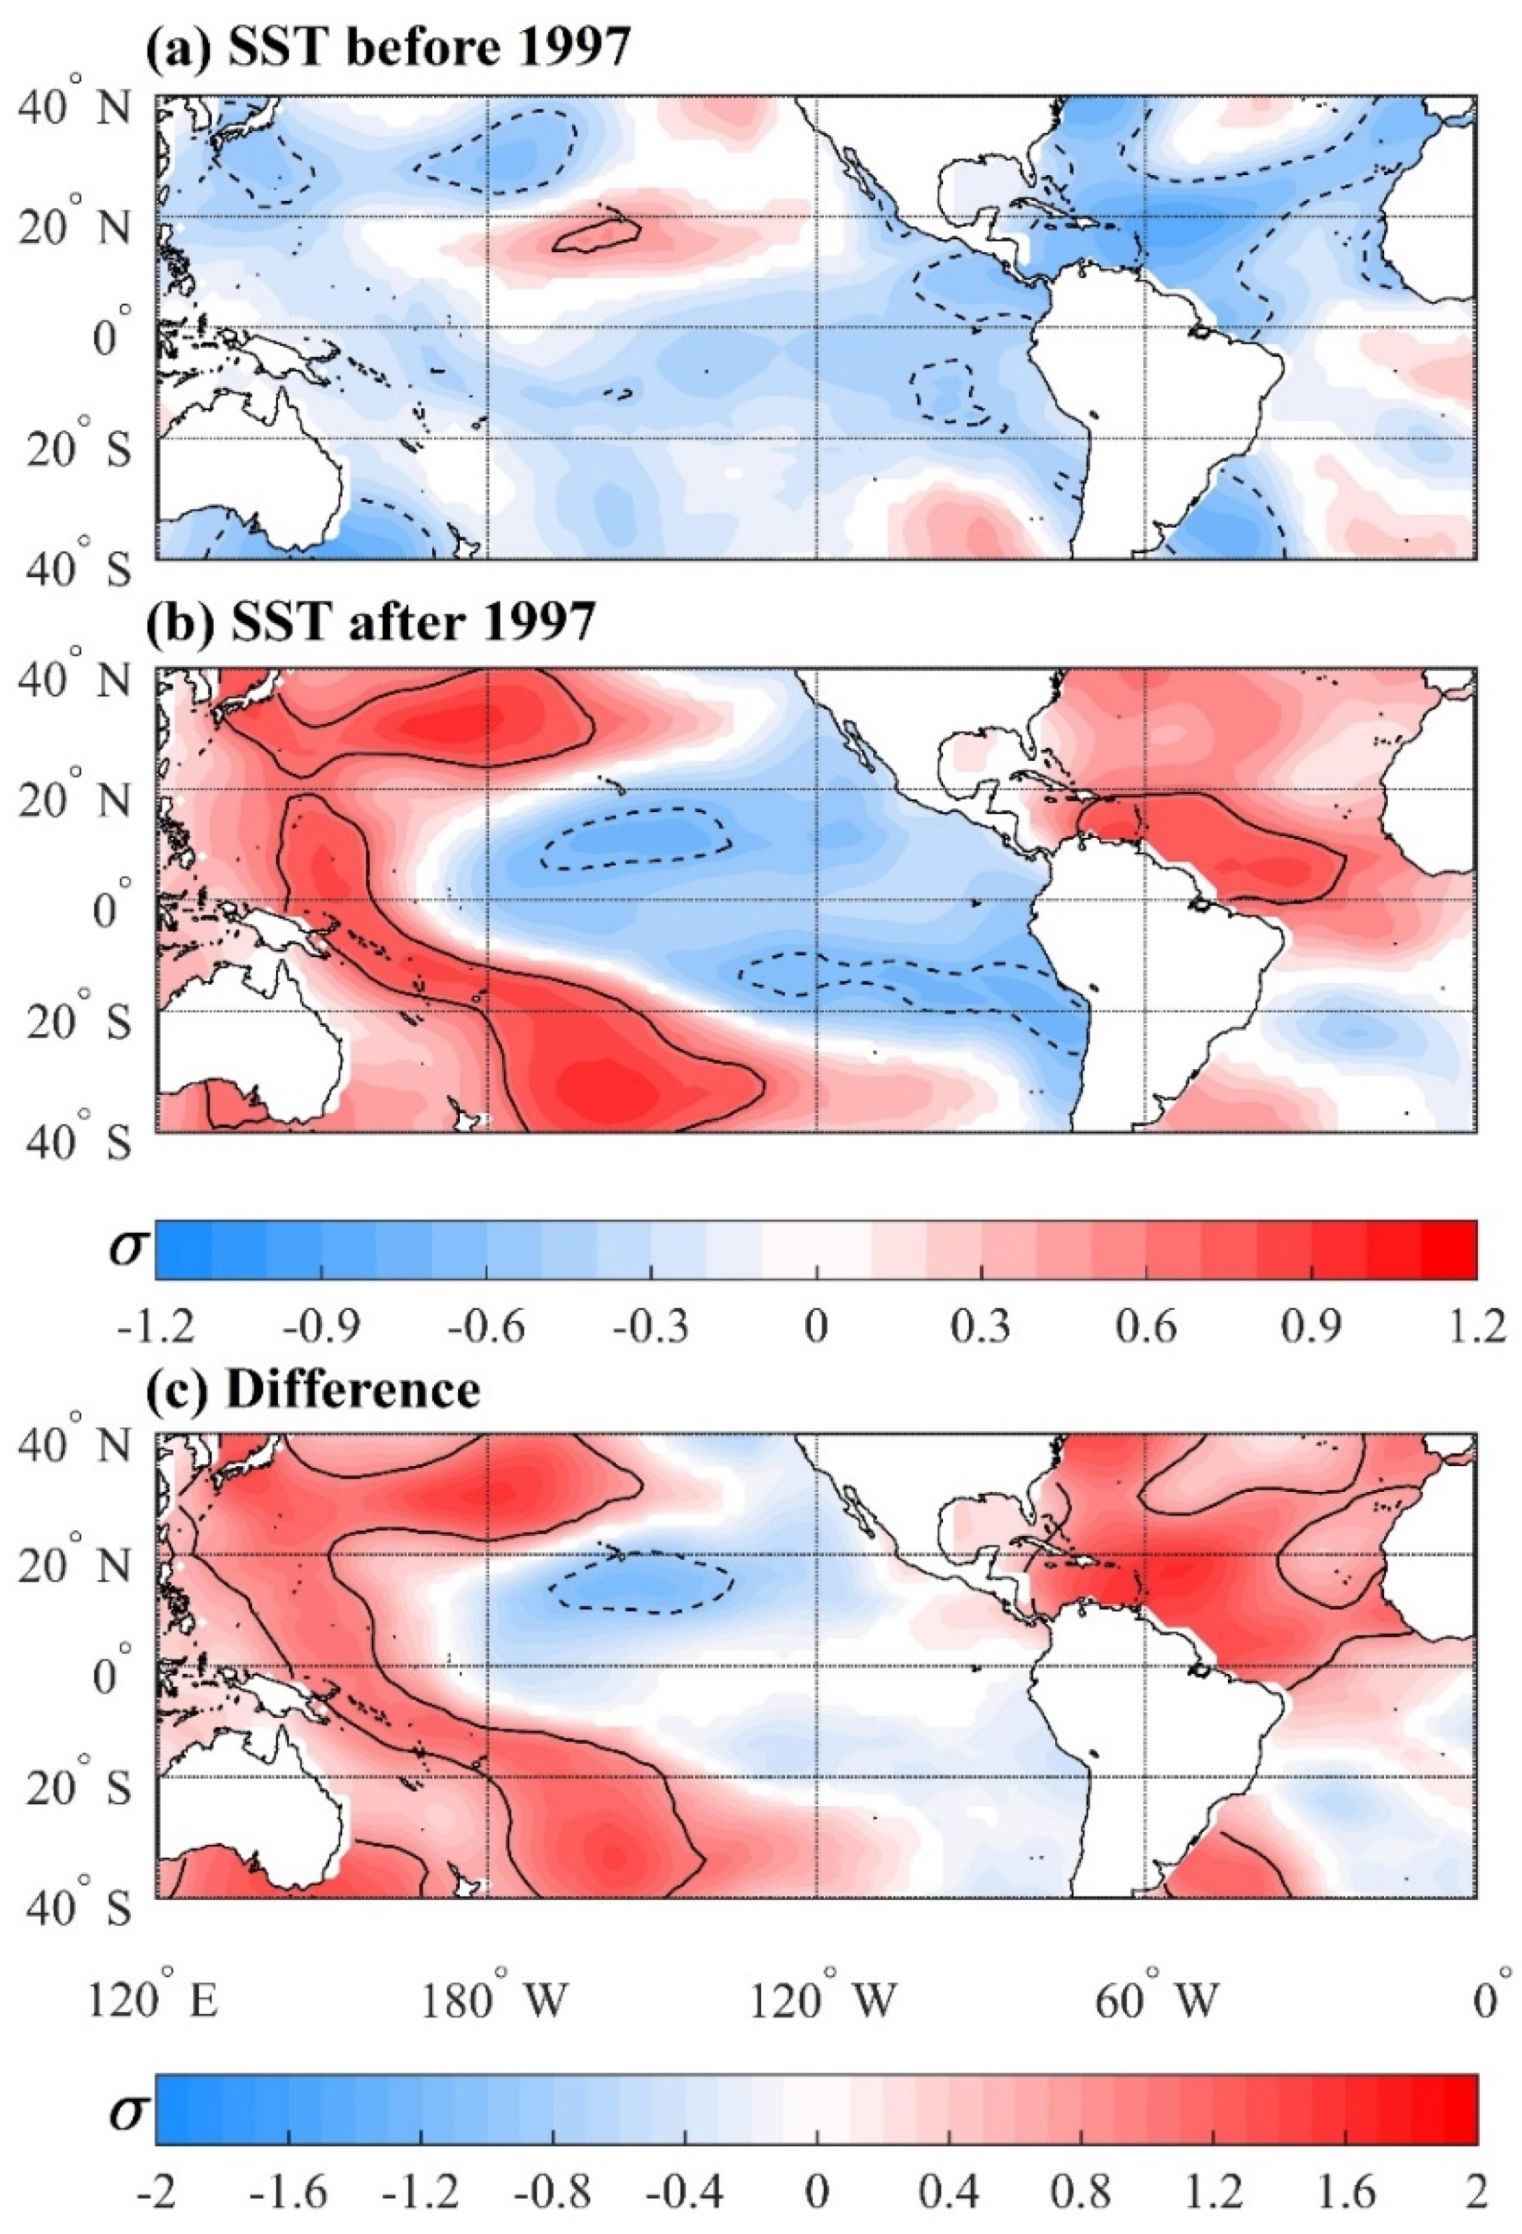
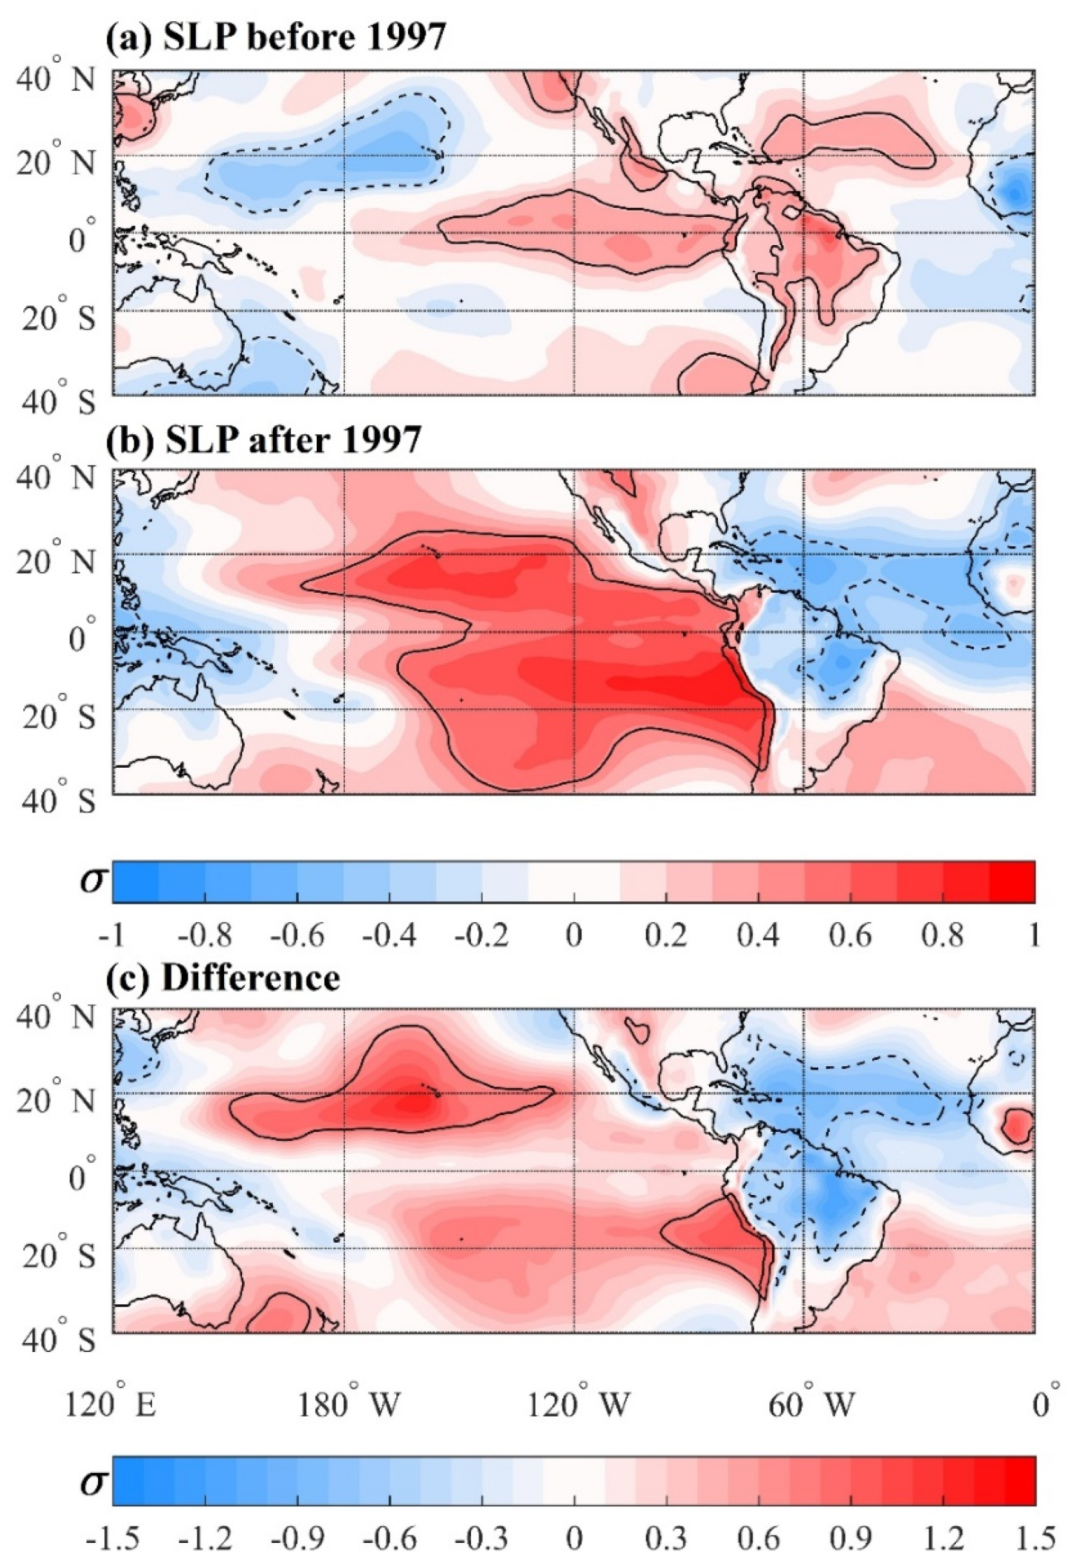
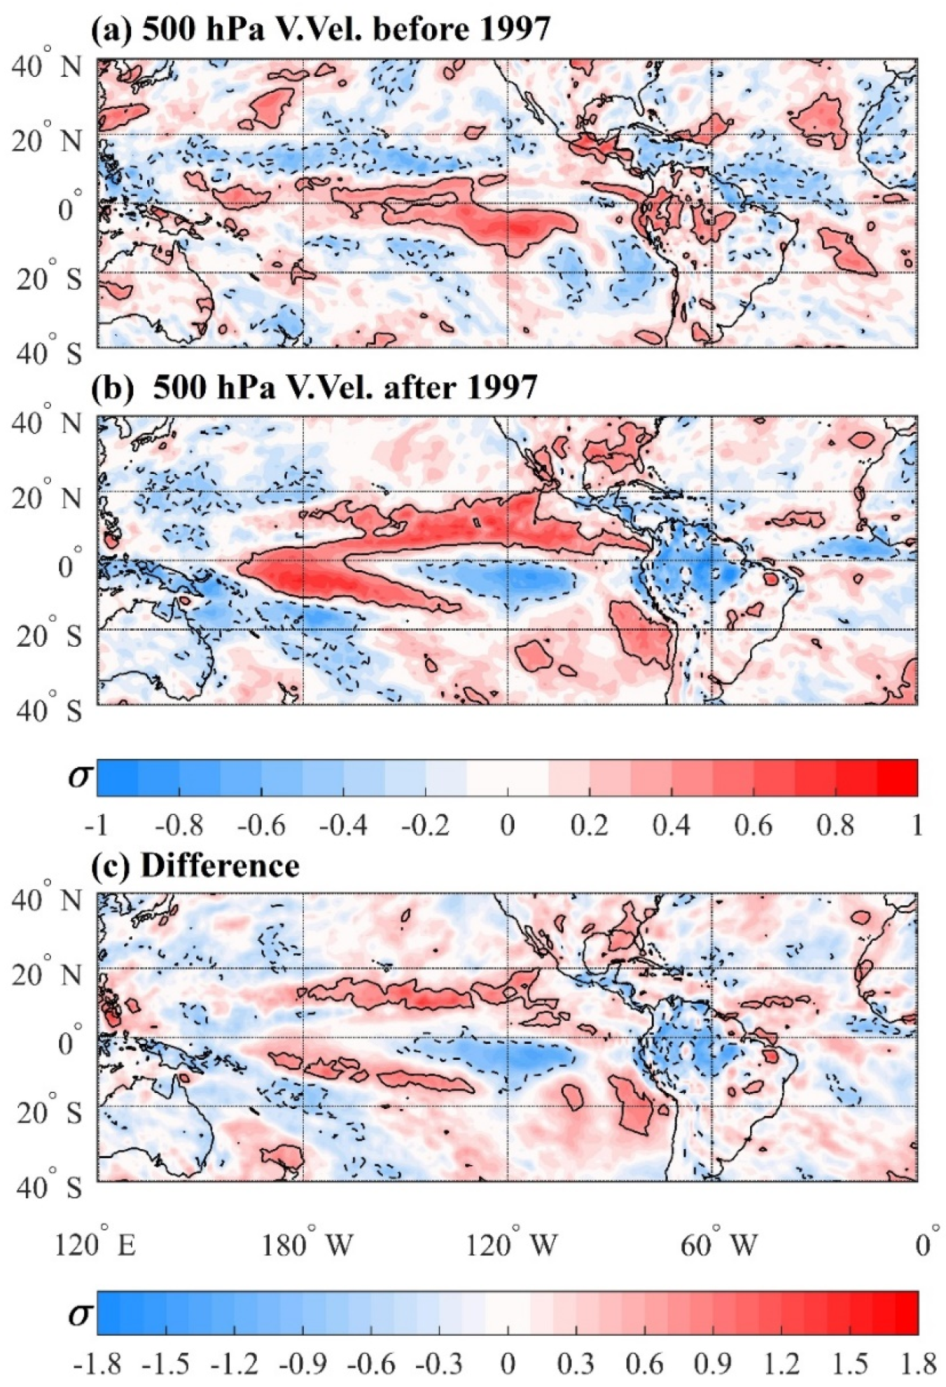
3.3. Composites of the SST, SLP, and 500 hPa Vertical Velocity Anomalies

Figure 5, Figure 6 and Figure 7 show the SST, SLP, and 500 hPa vertical velocity anomaly composites during the periods before and after 1997. Before 1997, significant negative SST anomalies are found in an area that extends from the west coast of Central America and SA to the central-western tropical Pacific, in the western TNA and Caribbean Sea (Figure 5a). On the other hand, after 1997 (Figure 5b), the SST anomaly composite is characterized by an anomalous cooling in most of the eastern tropical Pacific with significant negative anomalies in the area limited at 130° W, 90° W, 20° S, and 15° S, surrounded by an anomalous warming in a boomerang-shaped area, which extends over the Australasian region. At the same time, positive SST anomalies are observed in the TNA with the significant values to the south of 20° N. Then, the most significant difference composite of the SST anomalies occurs in the TNA region, the western tropical and subtropical Pacific (Figure 5c). However, it seems that the differences in the TNA are more important for the study domain.
During the 1983–1996 period, the negative SST anomalies in western TNA favor the establishment of positive SLP anomalies in the TNA area centered at 25° N and in most of tropical SA (Figure 5a and Figure 6a). However, neutral SLP anomalies prevail between the two areas of positive SLP anomalies. This SLP anomaly pattern in the TNA and tropical SA induces an anomalous meridional SLP gradient, and a meridional circulation cell with the anomalous ascending motions in the extreme northern SA and the Caribbean Sea and descending motions in northwestern SA is established (Figure 7a). In addition, an east–west SLP anomalous gradient with neutral to negative SLP anomalies in the western tropical Pacific and significant positive SLP anomalies in the central and eastern equatorial Pacific is also noted during the 1983–1996 period (Figure 6a). This anomalous SLP gradient is not too strong, so the associated east–west cell features its anomalous sinking branch in the western and central equatorial Pacific (center at 5° S, 120° W), and neutral to negative vertical velocity anomalies occur in the eastern equatorial Pacific (Figure 7a). Regionally, an anomalous equatorial east–west cell with weak anomalous ascending motions in the eastern equatorial Pacific and anomalous descending motions in Northwestern SA is noted (Figure 7a). This regional east–west cell intensifies the trade winds in the extreme Eastern Pacific, weakening the CJ (Figure 4a).
During the 1998–2016 period, the positive SST anomalies in the TNA with the largest values to the south of 20° N contribute to the establishment of the negative SLP in the TNA south of 25° N (the largest values at 15° N, 60° W) and in most of the South American sector north of 20° N (the largest values in central-eastern SA) (Figure 6b). For this period, the significant positive SLP anomalies occur in the central and Eastern Pacific in the 40° S–30° N band. These SLP anomalies define the zonal inter-basin gradient, which is intensified due to the SST gradient between the eastern equatorial Pacific (negative SST anomalies) and the equatorial Atlantic (positive SST anomalies). However, these anomalies do not define a basin wide east–west cell. Regionally, in the eastern equatorial Pacific and the adjacent South American region, the vertical velocity anomaly pattern features almost opposite sign anomalies of those described for the period before 1997 (Figure 7b). Indeed, a region with weak descending motions in the eastern equatorial Pacific separate two regions with the significant anomalous ascending motions, one in the central equatorial Pacific (center at 5° S, 120° W) and the other in Northern and Northwestern SA (Figure 7b). These weak descending motions in the eastern equatorial Pacific and the anomalous ascending motions in the northern and northwestern SA form a regional anomalous east–west cell, whose zonal part decelerates the easterlies in the eastern equatorial Pacific, thus the CJ is intensified after 1997 (Figure 4b). The difference composites represent the intensification (weakening) of the SLP in the Pacific (tropical Atlantic and SA) associated with the anomalous warming (cooling) in the TNA (tropical Pacific) and the intensification of the east–west cell with downward (upward) motions in the eastern equatorial Pacific (Northern and Northwestern SA) after 1997 (Figure 6c and Figure 7c).
At the same time, when the surface waters in the Caribbean and TNA are abnormally warm (cold) and negative (positive) SLP anomalies are centered in these regions, the CLLJ is anomalously weak (strong) (Figure 4a,b). The negative relation of SST and SLP in the Caribbean Sea is consistent with the Gill’s theoretical work [83]. In this respect, an anomalous equatorial heating (positive SST anomalies) generates an atmospheric response involving low pressure at a low-level to the northwest of the heating associated with a Rossby wave train. The low pressure then decelerates the easterlies (CLLJ) in the heating region [14]. Thus, the weak (strong) easterlies in the CLLJ region are associated with the positive (negative) SST and negative (positive) SLP anomalies in the TNA during the period after (before) 1997 (Figure 5a,b and Figure 6a,b).

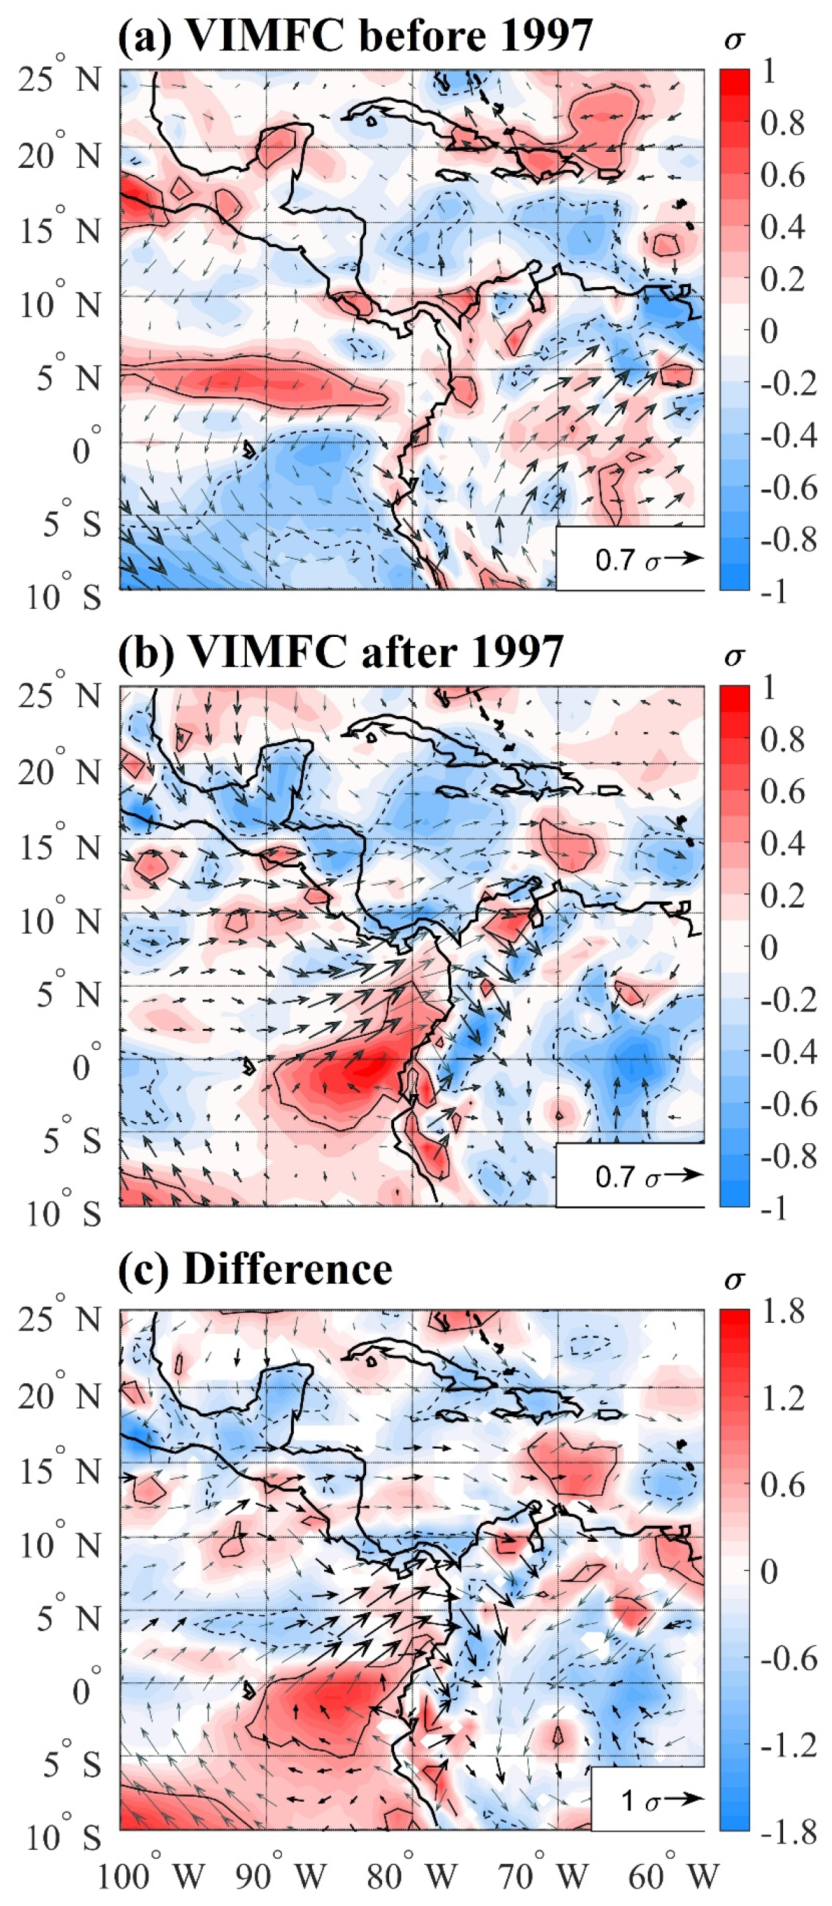
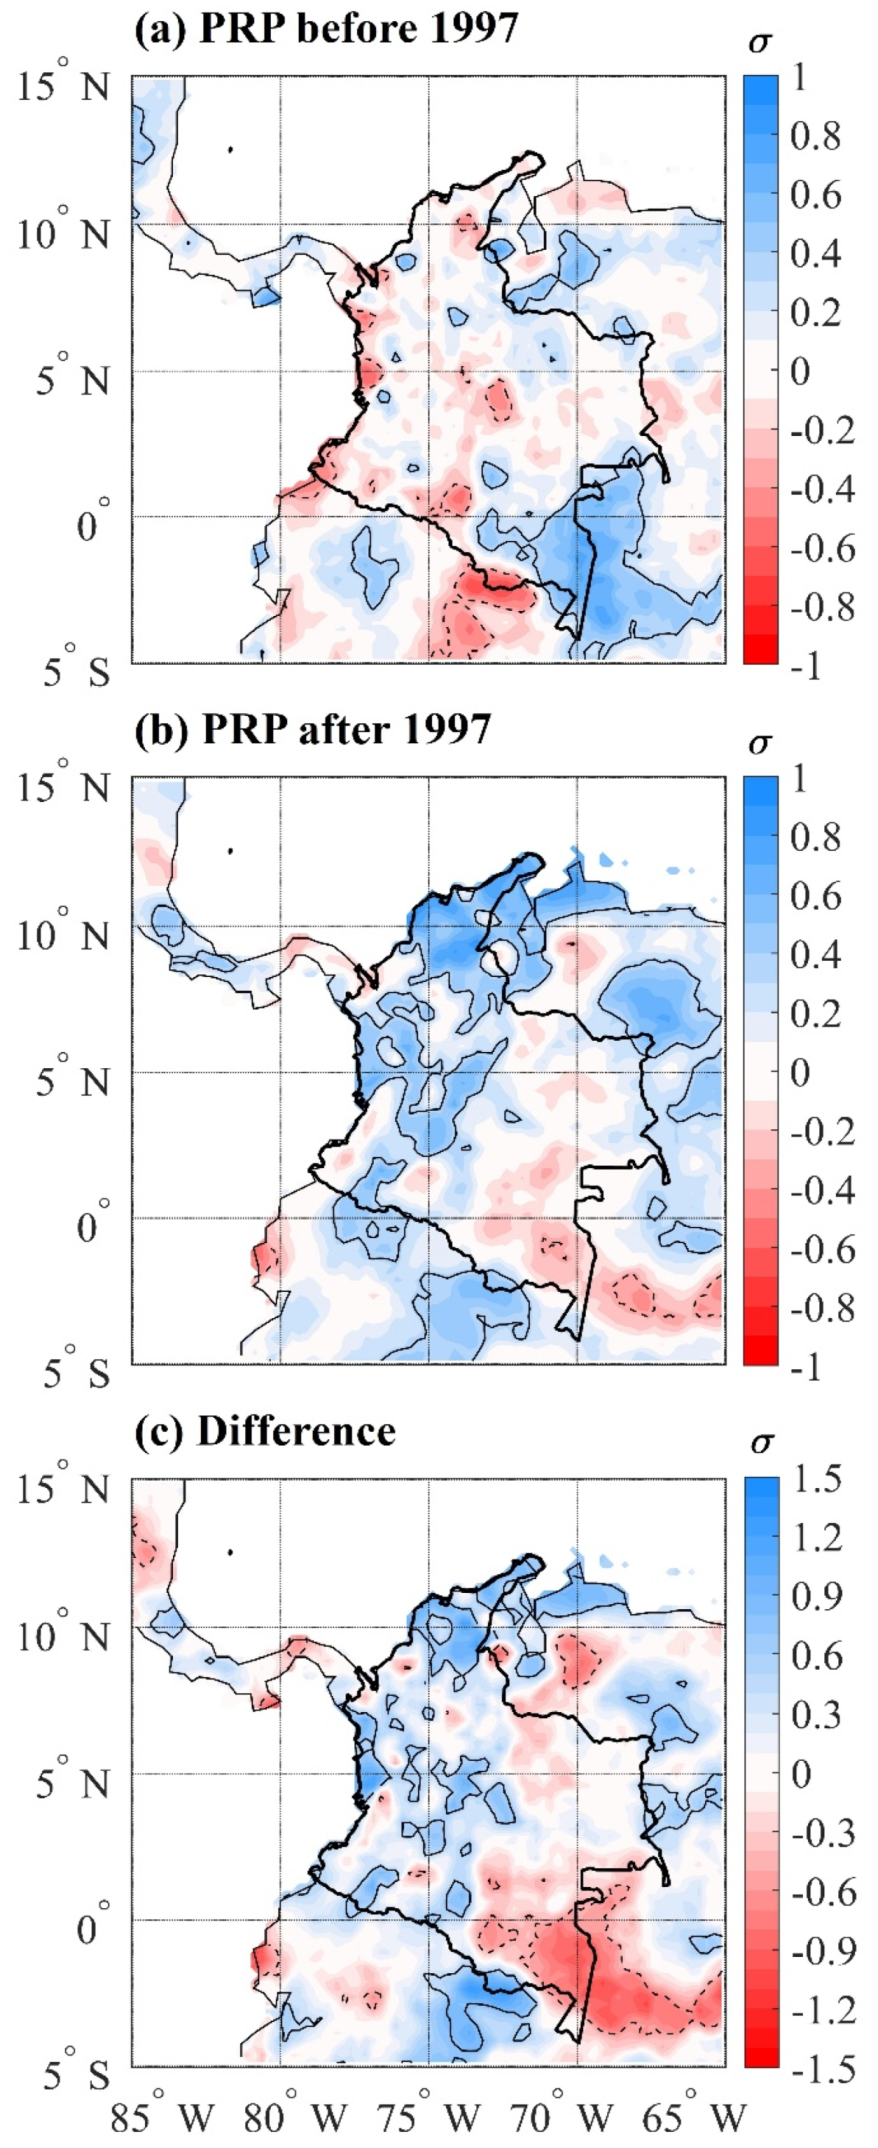
3.4. Composites of the VIMFC and Precipitation Anomalies

Since the low-frequency climate variability reflects changes in the CJ and CLLJ intensities (Figure 4), the moisture transport from the Pacific and Atlantic into northwestern SA is also altered. The VIMFC anomaly pattern before 1997 features a divergent flow extending from Northeastern Colombia towards the Caribbean Sea (Figure 8a), which is associated with a meridional cell with downward motions over Northwestern SA and upward motions over extreme Northern SA and the Caribbean Sea (Figure 7a). After 1997, the stronger CJ increases the moisture transport from the Eastern Pacific off the Ecuadorian coast and Southwestern Colombia to the interior of the Colombian territory (3° S–9° N and 78° W–73° W). This occurs in a southwest–northeast oriented band almost parallel to the coast in an inner area, mainly over the Andean region and the Northern Pacific (Figure 4b and Figure 8b).
After 1997, moisture convergence is also noted over the Colombian Caribbean due to the moisture flux from the Eastern Pacific, which crosses the Central American isthmus and converges in the Northern Caribbean region (Figure 8b). The CJ intensification and the consequent moisture flow towards Colombia are associated with a regional east–west cell that weakens the trades in the extreme eastern equatorial Pacific (Figure 7b). At the same time, a warming in the Caribbean Sea and TNA induces a weakening of the CLLJ and allows the moisture transport from the Eastern Pacific associated with a strengthened CJ. The VIMFC difference anomaly pattern clearly illustrates the CJ intensification after 1997 (Figure 8c).
After 1997, consistent with the circulation anomaly patterns, positive precipitation anomalies occur over northwestern SA (NCP, the Colombian Andes, represented by the MMB, UMB, and UCB regions) and normal conditions prevail over southwestern Colombia (SP and UPB regions) (Figure 9b,c). This precipitation pattern is caused by a strong CJ and a weak CLLJ, which contribute to intensify the moisture transport from the Eastern Pacific into western Colombia between 3° S and 9° N (Figure 4c and Figure 8c). On the other hand, before 1997, normal precipitation prevails in most of the Colombian territory, except in southeastern Colombia, where positive precipitation anomalies are noted (Figure 9a). The differences between the two periods reflect the positive anomalies in northwestern Colombia in the period after 1997 and the positive anomalies in Southeastern Colombia in the period before 1997 (Figure 9c).

4. Conclusions

In the present study, we investigated the hypothesis that the anomalous SST mean states associated with the AMO cause changes in the Choco Low-Level Jet (CJ) intensity during the 1983–2016 period. Years with intense CJ activity were selected using the September–November (SON) zonal wind index defined as the average 925 hPa zonal wind along 80° W and between 2° N and 7° N. This index during the 1983–2016 period shows a significant breakpoint in 1997, with higher values after 1997. Thus, the selections of intense CJ events were done separately for the 1983–1996 and 1998–2016 periods using the 50th percentile.
The 1983–1996 and 1998–2016 periods overlap the periods when the Atlantic Multi-decadal Oscillation (AMO) and the Pacific Decadal Oscillation (PDO) are in the cold AMO and warm PDO (CAMO/WPDO), and in the warm AMO and cold PDO (WAMO/CPDO), respectively. Kayano et al. [40,79] showed that these SST anomaly backgrounds affect the El Niño-Southern Oscillation (ENSO) related rainfall anomalies in South America (SA) through low-frequency changes in the Walker cell. These changes in the Walker cell have been previously documented with an intensification during the last three decades [41,84]. Kayano et al. [40,79] showed that the negative low-frequency relation between the Atlantic and Pacific during the WAMO/CPDO background reinforces the anomalous cooling in the tropical Pacific, which favors the La Niña settling and leads to the higher percentage of La Niña events. Of seven intense CJ events identified before 1997 and nine after 1997, respectively, two (1988 and 1995) and four (1999, 2007, 2010, 2011) of them coincided with the La Niña occurrences. Thus, 28% of the intense CJ events before 1997, and 44% after 1997 coincided with the La Niña occurrences. Previous studies indicated a strengthening of the CJ under La Niña [28]. Thus, our results suggest that part of the strengthening of the CJ after 1997 was due to the higher percentage of intense CJ events coinciding with La Niña events.
However, the present analysis indicates that the AMO-related SST anomalies in the Tropical North Atlantic (TNA) have important role in affecting the CJ and the Caribbean Low-Level Jet (CLLJ) intensities. Previously, Wang [14] found that the CLLJ holds a negative (positive) relation with the SST (SLP) anomalies in the TNA during the 1950–2006 period. However, the SST and SLP variations in the TNA are modulated by the AMO. Consistent with Gill’s theoretical results [83], the negative (positive) SST anomalies in the TNA (Figure 5a,b) generate to the northwest a high (low) pressure system at the low-level (Figure 6a,b), which in turn accelerates (decelerates) the easterlies in the cooling (warming) region, intensifying (weakening) the CLLJ before (after) 1997 (Figure 4a,b). The SLP anomalous patterns in the tropical Pacific feature positive anomalies in the eastern side and negative to neutral anomalies in the western side before and after 1997. In both cases, a basin wide Walker cell is not established. Rather, the anomalous descending (ascending) motions in the central equatorial Pacific (center at 5° S, 120° W) are surrounded by weak ascending (descending) motions in the eastern equatorial Pacific before (after) 1997 (Figure 7a,b). These weak ascending (descending) motions in the eastern equatorial Pacific together with the anomalous descending (ascending) motions in Northwestern (Northern and Northwestern) SA form a regional anomalous east–west cell, whose zonal part accelerates (decelerates) the easterlies in the eastern equatorial Pacific, thus the CJ is weakened (intensified) before (after) 1997. It is worth noting that the anomalous descending (ascending) motions and consistent positive (negative) SLP in Northwestern (Northern and Northwestern) SA are modulated by the SST anomalies in the TNA.
Arias et al. [28] found a negative relation between the intensities of the CJ and CLLJ during the 2010–2012 La Niña. However, they explained this relation in terms of the SST variations in both the TNA and tropical Pacific. Our results show that the AMO-related SST and SLP variations in the TNA are more crucial in modulating the CJ and CLLJ intensities in multidecadal time scale, such that CJ is weakened (intensified) and CLLJ is intensified (weakened) before (after) 1997.
After 1997, the intensified CJ favors circulation from the ocean to the continent increasing the moisture transport into central and western Colombia, and the weakened CLLJ favors the moisture transport from the Eastern Pacific to the Caribbean Sea. Consistently, after 1997, positive precipitation anomalies are especially significant on the North and Central Pacific (NCP) and the Colombian Andes (mainly in Northern Andean region), while normal conditions prevail in the southern Pacific and Southern Andean region (Figure 4b and Figure 9b). The precipitation differences over the Colombian Andes region are mainly due to a strong CJ and a weak CLLJ favoring moisture transport towards the interior of Colombia and across the western margin of the Colombian Andes.
Our results provided observational arguments that the multidecadal SST background in the TNA alters the local and regional circulation patterns, which in turn cause variations in the CJ and CLLJ. This aspect seems to be an important advance in the investigation of the ocean-atmospheric mechanisms related to these LLJs. Our results have implications to the Colombian rainfall distribution because these LLJs are the main mechanisms transporting moisture into Colombia. These results are fundamental for the planning and implementation of strategies for climate risk prevention, adaptation strategies, and mitigation against extreme hydro-climatic events that occur in association with the LLJs.

Author Contributions

Conceptualization: W.L.C, R.V.A., and M.T.K. Methodology: W.L.C, R.V.A., and M.T.K. Software was managed by W.L.C., and R.A.F.d.S. Validation: W.L.C, R.V.A., and M.T.K. Formal analysis: W.L.C, R.V.A., and M.T.K. Investigation: W.L.C, R.V.A., and M.T.K. Data curation: W.L.C., and R.A.F.d.S. Original draft preparation: W.L.C, R.V.A., and M.T.K. Reviewing and editing: W.L.C, R.V.A., M.T.K., C.J., and L.M.V.C. Visualization: W.L.C., C.J., and L.M.V.C. Supervision: R.V.A., M.T.K., and R.A.F.d.S. All authors have read and agreed to the published version of the manuscript.

Funding

The first author was supported by the Doctoral Scholarship of the Coordenação de Aperfeiçoamento de Pessoal de Nível Superior—Brasil (CAPES)—Finance Code 001 and Universidad del Valle (Cali-Colombia). The Conselho Nacional de Desenvolvimento Científico e Tecnológico (CNPq) of Brazil partially supported the second and third authors under grants 305942/2015-8 and 302322/2017-5, respectively.

Conflicts of Interest

The authors declare no conflict of interest. The founding sponsors had no role in the design, analysis and interpretation of data, in the writing manuscript, or in the decision to publish the results.

References

  1. Sierra, J.P.; Arias, P.A.; Vieira, S.C. Precipitation over Northern South America and its seasonal variability as simulated by the CMIP5 models. Adv. Meteorol. 2015, 2015. [Google Scholar] [CrossRef] [Green Version]
  2. Pabón-Caicedo, J.D.; Eslava-Ramírez, J.A.; Gómez-Torres, R.E. Generalidades de la distribución espacial y temporal de la temperatura del aire y de la precipitación en Colombia. Meteorol. Colomb. 2001, 4, 47–59. [Google Scholar]
  3. Hastenrath, S. The Intertropical Convergence Zone of the Eastern Pacific revisited. Int. J. Clim. 2002, 22, 347–356. [Google Scholar] [CrossRef]
  4. Poveda, G.; Waylen, P.R.; Pulwarty, R.S. Annual and inter-annual variability of the present climate in northern South America and southern Mesoamerica. Palaeogeogr. Palaeoclim. Palaeoecol. 2006, 234, 3–27. [Google Scholar] [CrossRef]
  5. Guzmán, D.; Ruíz, J.F.; Cadena, M. Regionalización De Colombia Según La Estacionalidad De La Precipitación Media Mensual, A Través Análisis De Componentes Principales (ACP); IDEAM: Bogotá, Colombia, 2014.
  6. Hoyos, I.; Baquero-Bernal, A.; Hagemann, S. How accurately are climatological characteristics and surface water and energy balances represented for the Colombian Caribbean Catchment Basin? Clim. Dyn. 2013, 41, 1269–1290. [Google Scholar] [CrossRef]
  7. Poveda, G.; Mesa, O.J. On the Existence of Lloró (the Rainiest Locality on Earth): Enhanced Ocean-Land-Atmosphere Interaction by a Low-Level Jet. Geophys. Res. Lett. 2000, 27, 1675–1678. [Google Scholar] [CrossRef] [Green Version]
  8. Zea, J.A.; León, G.E.; Eslava, J.A. Influencia de sistemas extratropicales en Colombia. Meteorol. Colomb. 2000, 1, 31–40. [Google Scholar]
  9. Poveda, G.; Jaramillo, L.; Vallejo, L.F. Seasonal precipitation patterns along pathways of South American low-level jets and aerial rivers. Water Resour. Res. 2014, 50, 98–118. [Google Scholar] [CrossRef]
  10. Morales, J.; Arias, P.; Martínez, J. Role of Caribbean low-level jet and Choco jet in the transport of moisture patterns towards Central America. Conf. Proc. Pap. 2017, 1, 4861. [Google Scholar]
  11. Bedoya-Soto, J.M.; Aristizábal, E.; Carmona, A.M.; Poveda, G. Seasonal Shift of the Diurnal Cycle of Rainfall Over Medellin’s Valley, Central Andes of Colombia (1998–2005). Front. Earth Sci. 2019, 7, 92. [Google Scholar] [CrossRef]
  12. Yepes, J.; Poveda, G.; Mejía, J.F.; Moreno, L.; Rueda, C. Choco-jex: A research experiment focused on the Chocó low-level jet over the far eastern Pacific and western Colombia. Bull. Am. Meteorol. Soc. 2019, 100, 779–796. [Google Scholar] [CrossRef]
  13. Gallego, D.; García-Herrera, R.; Gómez-Delgado, F.D.P.; Ordoñez-Perez, P.; Ribera, P. Tracking the moisture transport from the Pacific towards Central and northern South America since the late 19th century. Earth Syst. Dyn. 2019, 10, 319–331. [Google Scholar] [CrossRef] [Green Version]
  14. Wang, C. Variability of the Caribbean Low-Level Jet and its relations to climate. Clim. Dyn. 2007, 29, 411–422. [Google Scholar] [CrossRef] [Green Version]
  15. Wang, C.; Lee, S.K.; Enfield, D.B. Impact of the Atlantic warm pool on the summer climate of the Western Hemisphere. J. Clim. 2007, 20, 5021–5040. [Google Scholar] [CrossRef]
  16. Durán-Quesada, A.M.; Gimeno, L.; Amador, J. Role of moisture transport for Central American precipitation. Earth Syst. Dyn. 2017, 8, 147–161. [Google Scholar] [CrossRef] [Green Version]
  17. Whyte, F.S.; Taylor, M.A.; Stephenson, T.S.; Campbell, J.D. Features of the Caribbean low level jet. Int. J. Climatol. 2008, 28, 119–128. [Google Scholar] [CrossRef]
  18. Poveda, G.; Jaramillo, A.; Gil, M.M.; Quiceno, N.; Mantilla, R.I. Seasonally in ENSO-related precipitation, river discharges, soil moisture, and vegetation index in Colombia. Water Resour. Res. 2001, 37, 2169–2178. [Google Scholar] [CrossRef]
  19. Sakamoto, M.S.; Ambrizzi, T.; Poveda, G. Moisture Sources and Life Cycle of Convective Systems over Western Colombia. Adv. Meteorol. 2011, 2011, 1–11. [Google Scholar] [CrossRef]
  20. Serna, L.M.; Arias, P.A.; Vieira, S.C. Las corrientes superficiales de chorro del Chocó y el Caribe durante los eventos de El Niño y El Niño Modoki. Rev. la Acad. Colomb. Ciencias Exactas Físicas y Nat. 2018, 42, 410–421. [Google Scholar] [CrossRef]
  21. Durán-Quesada, A.M.; Gimeno, L. Revisión de los campos medios característicos del jet de bajo nivel del Caribe y algunas evaluaciones energéticas. Av. en Cienc. la Tierra. 2010, 1, 1–38. [Google Scholar]
  22. Amador, J.A. A Climatic Feature of the Tropical Americas: The Trade Wind Easterly Jet. Top. Meteorol. y Oceanogr. 1998, 5, 91–102. [Google Scholar]
  23. Amador, J.A. The Intra-Americas Sea low-level jet: Overview and future research. Ann. N. Y. Acad. Sci. 2008, 1146, 153–188. [Google Scholar] [CrossRef] [Green Version]
  24. Carvajal, Y.; Grisales, C.; Mateus, J. Correlación de variables macrocllmáticas del océano pacífico con los caudales en los ríos interandinos del valle del cauca (Colombia). Rev. Peru. Biol. 1999, 6, 9–17. [Google Scholar]
  25. Poveda, G.; Álvarez, D.M.; Rueda, Ó.A. Hydro-climatic variability over the Andes of Colombia associated with ENSO: A review of climatic processes and their impact on one of the Earth’s most important biodiversity hotspots. Clim. Dyn. 2011, 36, 2233–2249. [Google Scholar] [CrossRef]
  26. García, M.C.; Piñeros, B.A.; Bernal, Q.F.A.; Ardila, R.E. Variabilidad climática, cambio climático y el recurso hídrico en Colombia. Rev. Ing. 2012, 36, 60–64. [Google Scholar]
  27. Amador, J.A.; Alfaro, E.J.; Lizano, O.G.; Magaña, V.O. Atmospheric forcing of the eastern tropical Pacific: A review. Prog. Oceanogr. 2006, 69, 101–142. [Google Scholar] [CrossRef]
  28. Arias, P.A.; Martínez, J.A.; Vieira, S.C. Moisture sources to the 2010–2012 anomalous wet season in northern South America. Clim. Dyn. 2015, 45, 2861–2884. [Google Scholar] [CrossRef]
  29. Navarro-Monterroza, E.; Arias, P.A.; Vieira, S.C. El Niño-Oscilación del Sur, fase Modoki, y sus efectos en la variabilidad espacio-temporal de la precipitación en Colombia. Rev. la Acad. Colomb. Ciencias Exactas Físicas y Nat. 2019, 43, 120–132. [Google Scholar] [CrossRef]
  30. Hoyos, I.; Dominguez, F.; Cañón-Barriga, J.; Martínez, J.A.; Nieto, R.; Gimeno, L.; Dirmeyer, P.A. Moisture origin and transport processes in Colombia, northern South America. Clim. Dyn. 2018, 50, 971–990. [Google Scholar] [CrossRef]
  31. Poveda, G.; Mesa, O.J. La corriente de chorro superficial del oeste (“del Chocó”) y otras dos corrientes del chorro en Colombia: Climatología y variabilidad durante las fases ENSO. Rev. Académica Colomb. Ciencias la Tierra 1999, 23, 517–528. [Google Scholar]
  32. Rueda, O.A.; Poveda, G. Variabilidad espacial y temporal del chorro del Chocó y su efecto en la hidroclimatología del Pacífico Colombiano. Meteorol. Colomb. 2006, 10, 132–145. [Google Scholar]
  33. Enfield, D.B.; Mestas-Nuñez, A.M. Multiscale variabilities in global sea surface temperatures and their relationships with tropospheric climate patterns. J. Clim. 1999, 12, 2734–2746. [Google Scholar] [CrossRef]
  34. Enfield, D.B.; Mestas-Nuñez, A.M.; Trimble, P.J. The Atlantic multidecadal oscillation and its relation to rainfall and river flows in the continental U.S. Geophys. Res. Lett. 2001, 28, 2077–2080. [Google Scholar] [CrossRef] [Green Version]
  35. Goldenberg, S.B.; Landsea, C.W.; Mestas-Nuñez, A.M.; Gray, W.M. The recent increase in Atlantic hurricane activity: Causes and implications. Science 2001, 293, 474–479. [Google Scholar] [CrossRef] [Green Version]
  36. Mestas-Nuñez, A.M.; Enfield, D.B. Eastern equatorial pacific SST variability: ENSO and non-ENSO components and their climatic associations. J. Clim. 2001, 14, 391–402. [Google Scholar] [CrossRef] [Green Version]
  37. Kayano, M.T.; Capistrano, V.B. How the Atlantic multidecadal oscillation (AMO) modifies the ENSO influence on the South American rainfall. Int. J. Clim. 2014, 34, 162–178. [Google Scholar] [CrossRef]
  38. Kayano, M.T.; Capistrano, V.B.; Andreoli, R.V.; De Souza, R.A.F. A further analysis of the tropical Atlantic SST modes and their relations to north-eastern Brazil rainfall during different phases of Atlantic Multidecadal Oscillation. Int. J. Clim. 2016, 36, 4006–4018. [Google Scholar] [CrossRef] [Green Version]
  39. Kayano, M.T.; Rosa, M.B.; Rao, V.B.; Andreoli, R.V.; De Souza, R.A.F. Relations of the low-level extratropical cyclones in the southeast Pacific and South Atlantic to the Atlantic multidecadal oscillation. J. Clim. 2019, 32, 4167–4178. [Google Scholar] [CrossRef] [Green Version]
  40. Kayano, M.T.; Andreoli, R.V.; Souza, R.A.F. de El Niño–Southern Oscillation related teleconnections over South America under distinct Atlantic Multidecadal Oscillation and Pacific Interdecadal Oscillation backgrounds: La Niña. Int. J. Clim. 2019, 39, 1359–1372. [Google Scholar] [CrossRef]
  41. McGregor, S.; Timmermann, A.; Stuecker, M.F.; England, M.H.; Merrifield, M.; Jin, F.F.; Chikamoto, Y. Recent Walker circulation strengthening and pacific cooling amplified by Atlantic warming. Nat. Clim. Chang. 2014, 4, 888–892. [Google Scholar] [CrossRef] [Green Version]
  42. Kucharski, F.; Ikram, F.; Molteni, F.; Farneti, R.; Kang, I.S.; No, H.H.; King, M.P.; Giuliani, G.; Mogensen, K. Atlantic forcing of Pacific decadal variability. Clim. Dyn. 2016, 46, 2337–2351. [Google Scholar] [CrossRef]
  43. Kucharski, F.; Parvin, A.; Rodriguez-Fonseca, B.; Farneti, R.; Martin-Rey, M.; Polo, I.; Mohino, E.; Losada, T.; Mechoso, C.R. The teleconnection of the tropical Atlantic to Indo-Pacific sea surface temperatures on inter-annual to centennial time scales: A review of recent findings. Atmosphere 2016, 7, 29. [Google Scholar] [CrossRef] [Green Version]
  44. England, M.H.; Mcgregor, S.; Spence, P.; Meehl, G.A.; Timmermann, A.; Cai, W.; Gupta, A.S.; Mcphaden, M.J.; Purich, A.; Santoso, A. Recent intensification of wind-driven circulation in the Pacific and the ongoing warming hiatus. Nat. Clim. Chang. 2014, 4, 222–227. [Google Scholar] [CrossRef]
  45. Jones, C.; Carvalho, L.M.V. The influence of the Atlantic multidecadal oscillation on the eastern Andes low-level jet and precipitation in South America. NPJ Clim. Atmos. Sci. 2018, 1, 1–7. [Google Scholar] [CrossRef] [Green Version]
  46. Myers, N. Threatened biotas: “hot spots” in tropical forests. Environmentalist 1988, 82483, 187–208. [Google Scholar] [CrossRef]
  47. Myers, N. The biodiversity challenge: Expanded hot-spots analysis. Environmentalist 1990, 10, 243–256. [Google Scholar] [CrossRef] [Green Version]
  48. Myers, N.; Mittermeier, R.A.; Mittermeier, C.G.; Da Fonseca, G.A.B.; Kent, J. Biodiversity hotspots for conservation priorities. Nature 2000, 403, 853–858. [Google Scholar] [CrossRef]
  49. Mittermeier, R.A.; Gil, P.R.; Hoffmann, M.; Pilgrim, J. Hotspots: Earth’s Biologically Richest and Most Threatened Terrestrial Ecoregions; Cemex: San Pedro, Mexico, 2004. [Google Scholar]
  50. Marchese, C. Biodiversity hotspots: A shortcut for a more complicated concept. Glob. Ecol. Conserv. 2015, 3, 297–309. [Google Scholar] [CrossRef] [Green Version]
  51. El Chocó Biogeográfico: Ambiente Físico. Available online: https://issuu.com/diversidadbiotica/docs/namee92314 (accessed on 6 February 2020).
  52. Higgins, A.; Restrepo, J.C.; Ortiz, J.C.; Pierini, J.; Otero, L. Suspended sediment transport in the Magdalena River (Colombia, South America): Hydrologic regime, rating parameters and effective discharge variability. Int. J. Sediment Res. 2016, 31, 25–35. [Google Scholar] [CrossRef]
  53. Gutiérrez, J.P.; Van Halem, D.; Rietveld, L.C. Particulate matter characterization of Cauca River water in Colombia. Hydrol. Earth Syst. Sci. Discuss. 2016, 1–20. [Google Scholar] [CrossRef]
  54. Climate Hazards Group Infrared Precipitation with Stations (CHIRPS) CHIRPS Data. Available online: https://www.chc.ucsb.edu/data/chirps/ (accessed on 6 January 2019).
  55. Funk, C.; Peterson, P.; Landsfeld, M.; Pedreros, D.; Verdin, J.; Shukla, S.; Husak, G.; Rowland, J.; Harrison, L.; Hoell, A.; et al. The climate hazards infrared precipitation with stations-A new environmental record for monitoring extremes. Sci. Data 2015, 2, 1–21. [Google Scholar] [CrossRef] [Green Version]
  56. Funk, C.; Peterson, P.; Landsfeld, M.; Pedreros, D.; Verdin, J.; Rowland, J.; Romero, B.; Husak, G.; Michaelsen, J.; Verdin, A. A Quasi-Global Precipitation Time Series for Drought Monitoring Data Series 832. US Geol. Surv. Data Ser. 2014, 832, 1–12. [Google Scholar]
  57. National Oceanic and Atmospheric Administration. Extended Reconstructed Sea Surface Temperature (NOAA/ERSST) SST Data. Available online: https://www.esrl.noaa.gov/psd/data/gridded/ (accessed on 10 July 2018).
  58. Huang, B.; Thorne, P.W.; Banzon, V.F.; Boyer, T.; Chepurin, G.; Lawrimore, J.H.; Menne, M.J.; Smith, T.M.; Vose, R.S.; Zhang, H.M. Extended reconstructed Sea surface temperature, Version 5 (ERSSTv5): Upgrades, validations, and intercomparisons. J. Clim. 2017, 30, 8179–8205. [Google Scholar] [CrossRef]
  59. European Centre for Medium-Range Weather Forecasts Interim Reanalysis (ECMWF/ERA-I) Atmospheric Data. Available online: http://apps.ecmwf.int/datasets/data/interim-full-moda/levtype=pl/ (accessed on 6 June 2019).
  60. Dee, D.P.; Uppala, S.M.; Simmons, A.J.; Berrisford, P.; Poli, P.; Kobayashi, S.; Andrae, U.; Balmaseda, M.A.; Balsamo, G.; Bauer, P.; et al. The ERA-Interim reanalysis: Configuration and performance of the data assimilation system. Q. J. R. Meteorol. Soc. 2011, 137, 553–597. [Google Scholar] [CrossRef]
  61. Trenberth, K.E.; Fasullo, J.T.; Mackaro, J. Atmospheric moisture transports from ocean to land and global energy flows in reanalyses. J. Clim. 2011, 24, 4907–4924. [Google Scholar] [CrossRef]
  62. Hoyos, I.; Baquero-Bernal, A.; Jacob, D.; Rodríguez, B.A. Variability of extreme events in the Colombian Pacific and Caribbean catchment basins. Clim. Dyn. 2013, 40, 1985–2003. [Google Scholar] [CrossRef]
  63. Satyamurty, P.; Da Costa, C.P.W.; Manzi, A.O. Moisture source for the Amazon Basin: A study of contrasting years. Theor. Appl. Clim. 2013, 111, 195–209. [Google Scholar] [CrossRef]
  64. Wijngaard, J.; Tank, A.; Konnen, G. Homogeneity of 20TH century european daily temperature and precipitation series. Int. J. Clim. 2003, 679–692. [Google Scholar] [CrossRef]
  65. Costa, A.C.; Soares, A. Trends in extreme precipitation indices derived from a daily rainfall database for the South of Portugal. Int. J. Clim. 2009, 29, 1956–1975. [Google Scholar] [CrossRef]
  66. Pettitt, A.N. A Non-Parametric Approach to the Change-Point Problem. Appl. Stat. 1979, 28, 126–135. [Google Scholar] [CrossRef]
  67. Buishand, T.A. Some methods for testing the homogeneity of rainfall records. J. Hydrol. 1982, 58, 11–27. [Google Scholar] [CrossRef]
  68. Alexandersson, H. A homogeneity test applied to precipitation data. J. Clim. 1986, 6, 661–675. [Google Scholar] [CrossRef]
  69. Alexandersson, H.; Moberg, A. Homogenization of Swedish Temperature Data. Part I: Homogeneity Test for Linear Trends. Int. J. Clim. 1997, 17, 25–34. [Google Scholar] [CrossRef]
  70. Peterson, T.C.; Easterling, D.R.; Karl, T.R.; Groisman, P.; Nicholls, N.; Plummer, N.; Torok, S.; Auer, I.; Boehm, R.; Gullett, D.; et al. Homogeneity Adjustments of in Situ Atmospheric Climate Data: A Review. Int. J. Clim. 1998, 18, 1493–1517. [Google Scholar] [CrossRef]
  71. Aguilar, E.; Peterson, T.; Obando, P.R.; Frutos, R.; Retana, J.A.; Solera, M.; Soley, J.; García, I.G.; Araujo, R.M.; Santos, A.R.; et al. Changes in precipitation and temperature extremes in Central America and northern South America, 1961–2003. J. Geophys. Res. Atmos. 2005, 110, 1–15. [Google Scholar] [CrossRef]
  72. Martínez, M.D.; Serra, C.; Burgueño, A.; Lana, X. Time trends of daily maximum and minimum temperatures in Catalonia (ne Spain) for the period 1975–2004. Int. J. Clim. 2009, 290, 267–290. [Google Scholar] [CrossRef] [Green Version]
  73. Santos, M.; Fragoso, M. Precipitation variability in Northern Portugal: Data homogeneity assessment and trends in extreme precipitation indices. Atmos. Res. 2013, 131, 34–45. [Google Scholar] [CrossRef]
  74. Zahradníček, P.; Brázdil, R.; Štěpánek, P.; Řezníčková, L. Differences in wind speeds according to measured and homogenized series in the Czech Republic, 1961–2015. Int. J. Clim. 2019, 39, 235–250. [Google Scholar] [CrossRef] [Green Version]
  75. Hawkins, D.M. Testing a sequence of observations for a shift in location. J. Am. Stat. Assoc. 1977, 72, 180–186. [Google Scholar] [CrossRef]
  76. Boschat, G.; Simmonds, I.; Purich, A.; Cowan, T.; Pezza, A.B. On the use of composite analyses to form physical hypotheses: An example from heat wave-SST associations. Sci. Rep. 2016, 6, 1–10. [Google Scholar]
  77. Panofsky, H.G.; Brier, G.W. Some Applications of Statistics to Meteorology; Mineral Industries Extension Services, Ed.; Pennsylvania State University: Pennsylvania, PA, USA, 1958. [Google Scholar]
  78. Wilks, D.S. Statistical Methods in the Atmospheric Sciences, 3rd ed.; Academic Press: San Diego, CA, USA, 2011; ISBN 9780123850232. [Google Scholar]
  79. Kayano, M.T.; Andreoli, R.V.; De Souza, R.A.F. Pacific and Atlantic multidecadal variability relations to the El Niño events and their effects on the South American rainfall. Int. J. Clim. 2019. [Google Scholar] [CrossRef]
  80. Mantua, N.J.; Hare, S.R.; Zhang, Y.; Wallace, J.M.; Francis, R.C. A Pacific Interdecadal Climate Oscillation with Impacts on Salmon Production. Bull. Am. Meteorol. Soc. 1997, 78, 1069–1079. [Google Scholar] [CrossRef]
  81. NOAA. Available online: https://www.esrl.noaa.gov/psd/data/timeseries/AMO/ (accessed on 6 February 2020).
  82. NOAA. Available online: https://www.ncdc.noaa.gov/teleconnections/pdo/ (accessed on 6 February 2020).
  83. Gill, A.E. Some simple solutions for heat-induced tropical circulation. Q. J. R. Meteorol. Soc. 1980, 106, 447–462. [Google Scholar] [CrossRef]
  84. Barichivich, J.; Gloor, E.; Peylin, P.; Brienen, R.J.W.; Schöngart, J.; Espinoza, J.C.; Pattnayak, K.C. Recent intensification of Amazon flooding extremes driven by strengthened Walker circulation. Sci. Adv. 2018, 4, 1–7. [Google Scholar] [CrossRef] [Green Version]
Figure 1. Study area with annual precipitation regimens. Each graph (af) represents the monthly average based on the CHIRPS precipitation for 1983–2016. (a) NCP: North and Central Pacific. (b) UPB: Upper Patía Basin. (c) SP: South Pacific. (d) MMB: Middle Magdalena Basin. (e) UMB: Upper Magdalena Basin. (f) UCB: Upper Cauca Basin. The red arrow illustrates the CJ, and the blue arrow, the CLLJ.
Atmosphere 11 00174 g001
Figure 2. Histogram of the zonal wind index in September-November (SON) during the 1983–2016 period. The line parallel to the ‘y’ axis shows the breakpoint according to homogeneity Tests; p shows the p-values for the Pettit test (I), Buishand (II), and SNHT (III) homogeneity tests. The horizontal blue and green lines indicate the average before and after 1997, respectively. Dark gray bars represent years with zonal wind above the 50th percentile in the periods before and after 1997.
Atmosphere 11 00174 g002
Figure 3. Mean standardized SST anomaly patterns in September-November (SON) during the (a) 1983–1996 and (b) 1998–2016. The continuous (dashed) line encompasses positive (negative) significant values at the 95% confidence level using the Student’s t test. (c) Time series of the Choco Jet (CJ), AMO, and PDO indices smoothed with a 10-year running mean filter for SON during the 1983–2016 period. The AMO index was multiplied by 3.
Atmosphere 11 00174 g003
Figure 4. Composites of the 925 hPa winds during SON events: (a) Before 1997, (b) after 1997 and (c) the difference (after minus before). In (c), vectors in bold indicate regions with significant changes in wind speed and continuous (dashed) contours encompass positive (negative) values significant at the 95% confidence level. The arrow at the right-bottom corner of each panel illustrates the base magnitude of the vector in m/s.
Atmosphere 11 00174 g004
Figure 5. Standardized SST anomalies during SON events: (a) Before 1997, (b) after 1997, and (c) the difference (after minus before). Composites were based on the monthly standardized anomalies regarding the 1983–2016 period. Continuous (dashed) contours encompass positive (negative) values which are significant at the 95% confidence level.
Atmosphere 11 00174 g005
Figure 6. Standardized SLP anomalies during SON events: (a) Before 1997, (b) after 1997, and (c) the difference (after minus before). The display is the same as in Figure 5.
Atmosphere 11 00174 g006
Figure 7. Standardized 500 hPa vertical velocity in the pressure coordinate anomalies during SON events: (a) Before 1997, (b) after 1997, and (c) the difference (after minus before). The display is the same as in Figure 5.
Atmosphere 11 00174 g007
Figure 8. Standardized anomalies of VIMFC (vectors) and its convergence (shades) during SON events: (a) Before 1997, (b) after 1997, and (c) the difference (after minus before). In (a)–(c), vectors in bold indicate regions with significant changes and continuous (dashed) contours encompass positive (negative) values which are significant at the 95% confidence level. The arrow at the bottom of each panel illustrates the base magnitude of the VIMFC vector in σ.
Atmosphere 11 00174 g008
Figure 9. Standardized precipitation anomalies during SON events: (a) Before 1997, (b) after 1997, and (c) the difference (after minus before). The display is the same as in Figure 5.
Atmosphere 11 00174 g009
Table 1. Years with CJ events for the periods before and after 1997.
Before1988–1989–1990–1993–1994–1995–1996
After1999–2003–2005–2007–2008–2010–2011–2013–2014

