
Evolution of the Groundwater Flow System since the Last Glacial Maximum in the Aksu River Basin (Northwest China)
Abstract
:1. Introduction
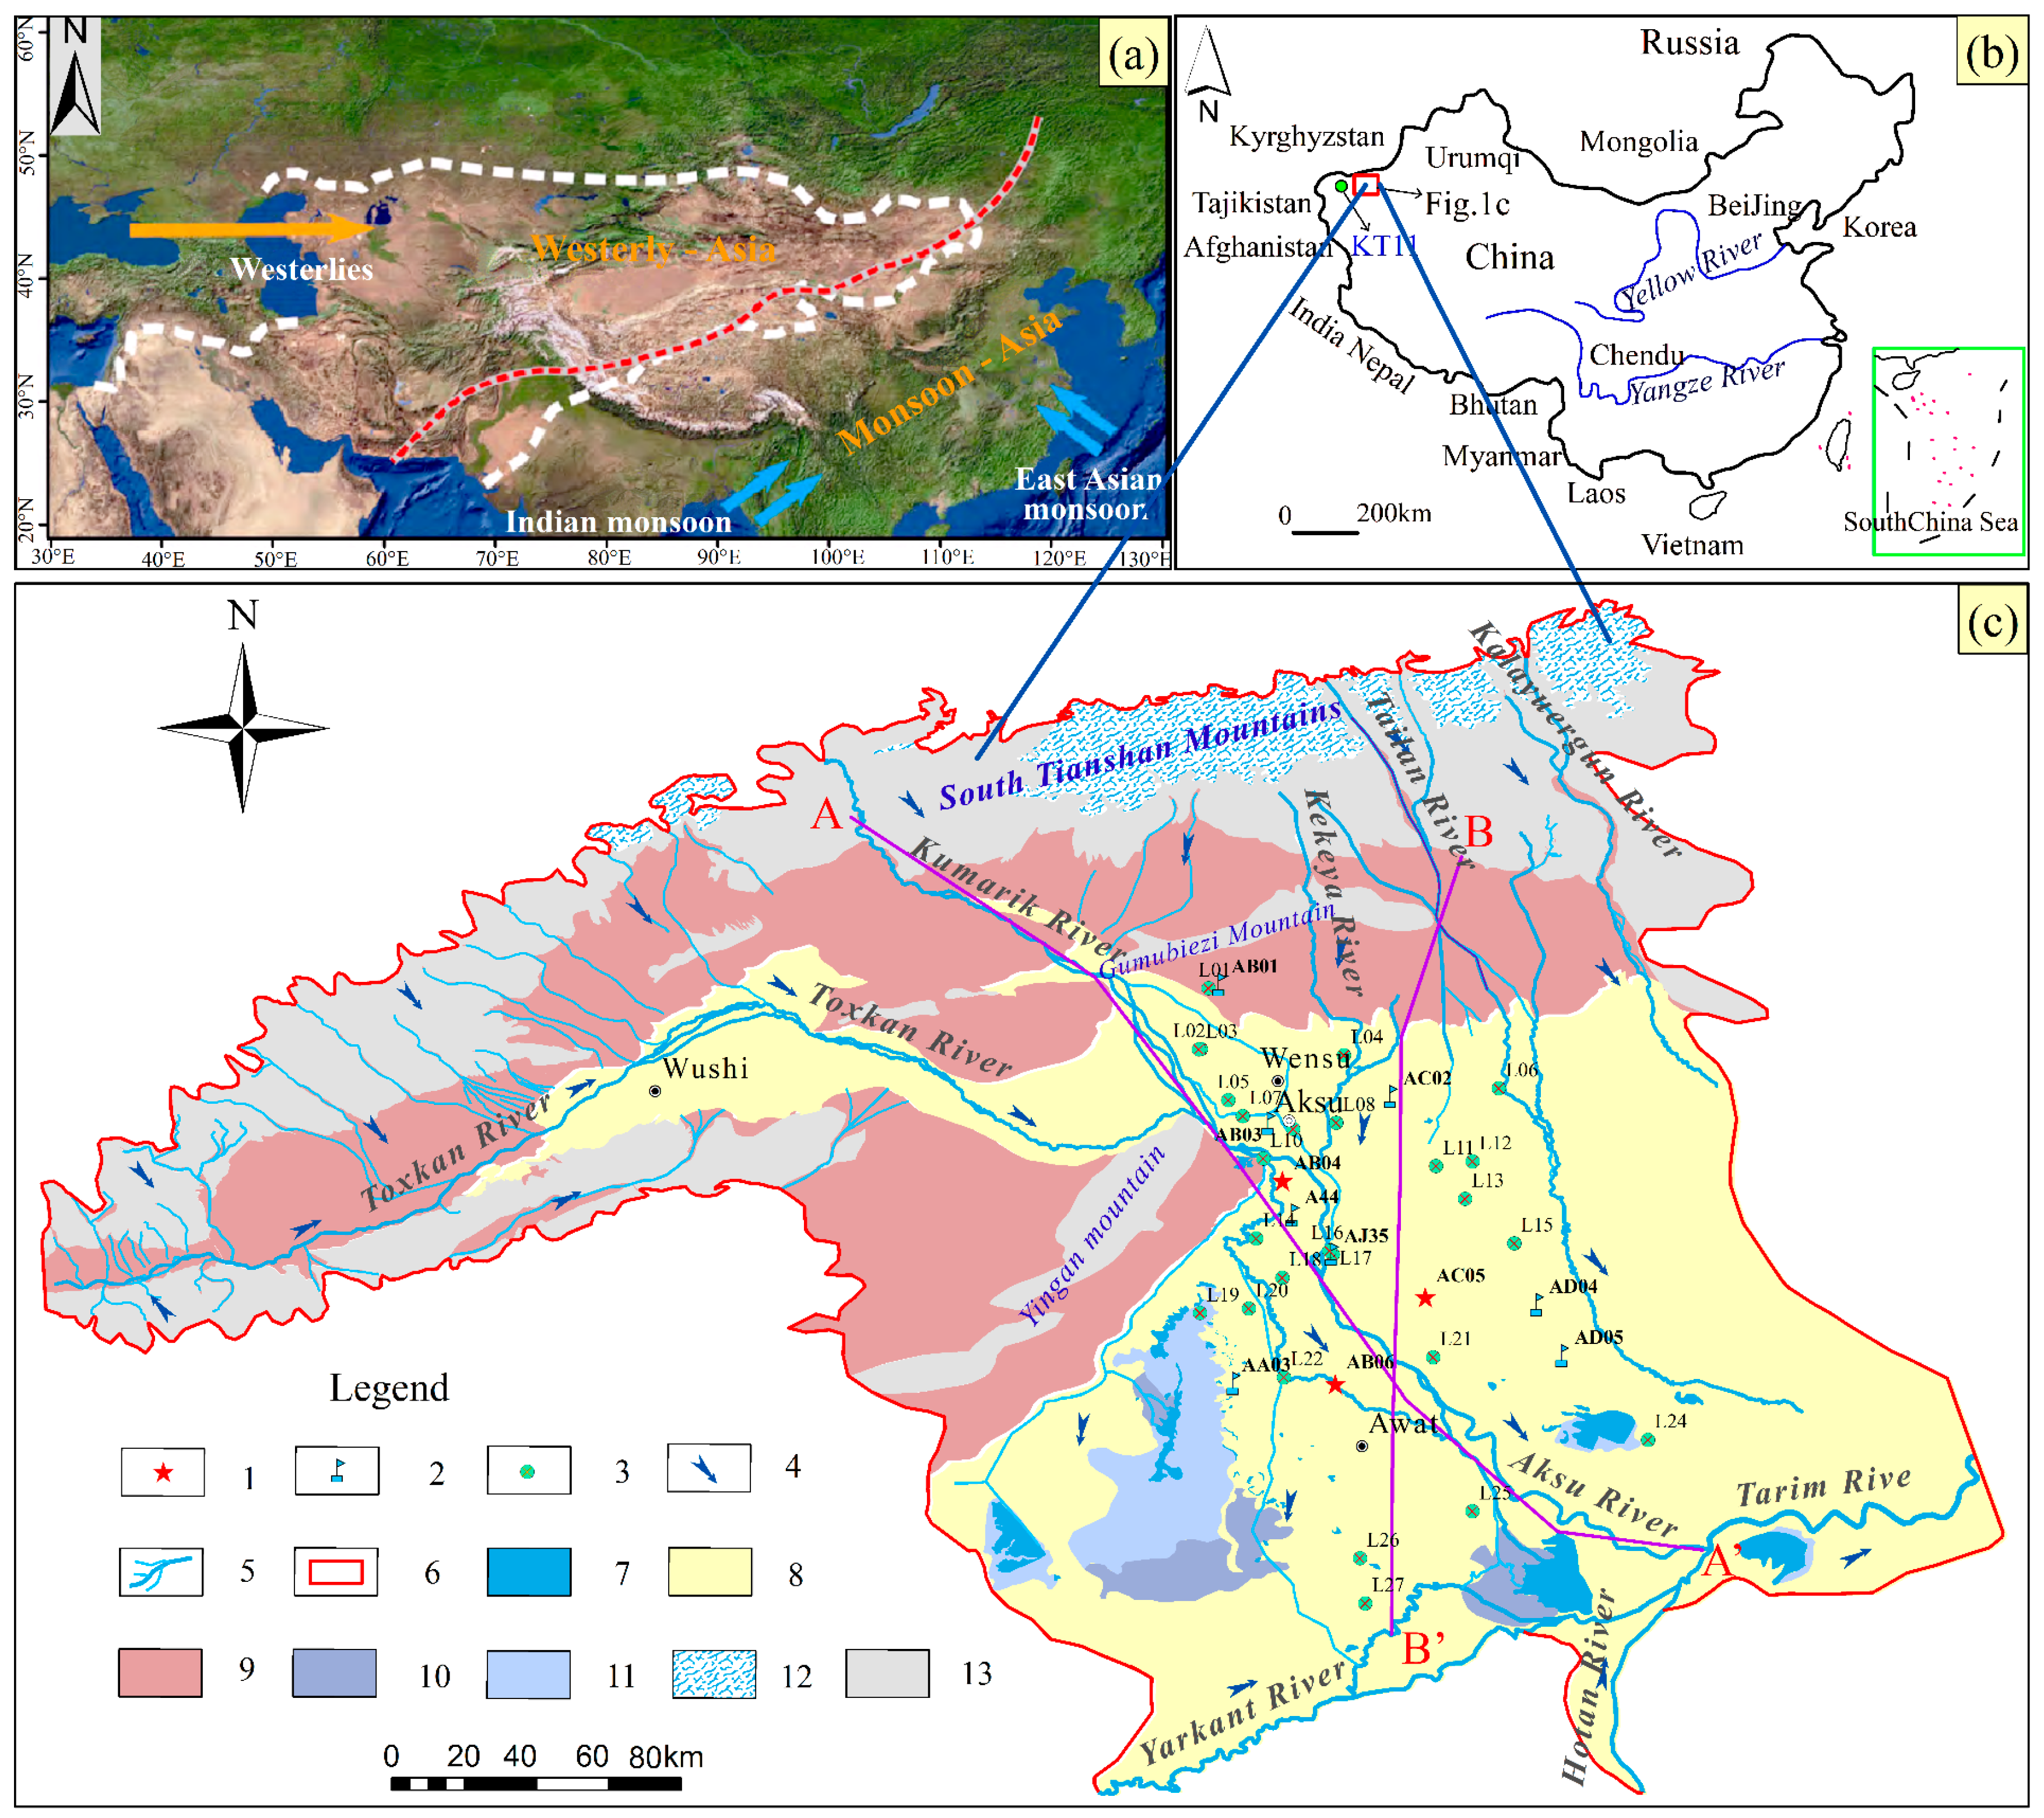
2. Study Area
2.1. Study Area
2.2. Hydrogeological Conditions
3. Date and Methods
3.1. Particle Size Analysis
3.2. Geophysical Probing Technique
4. Results
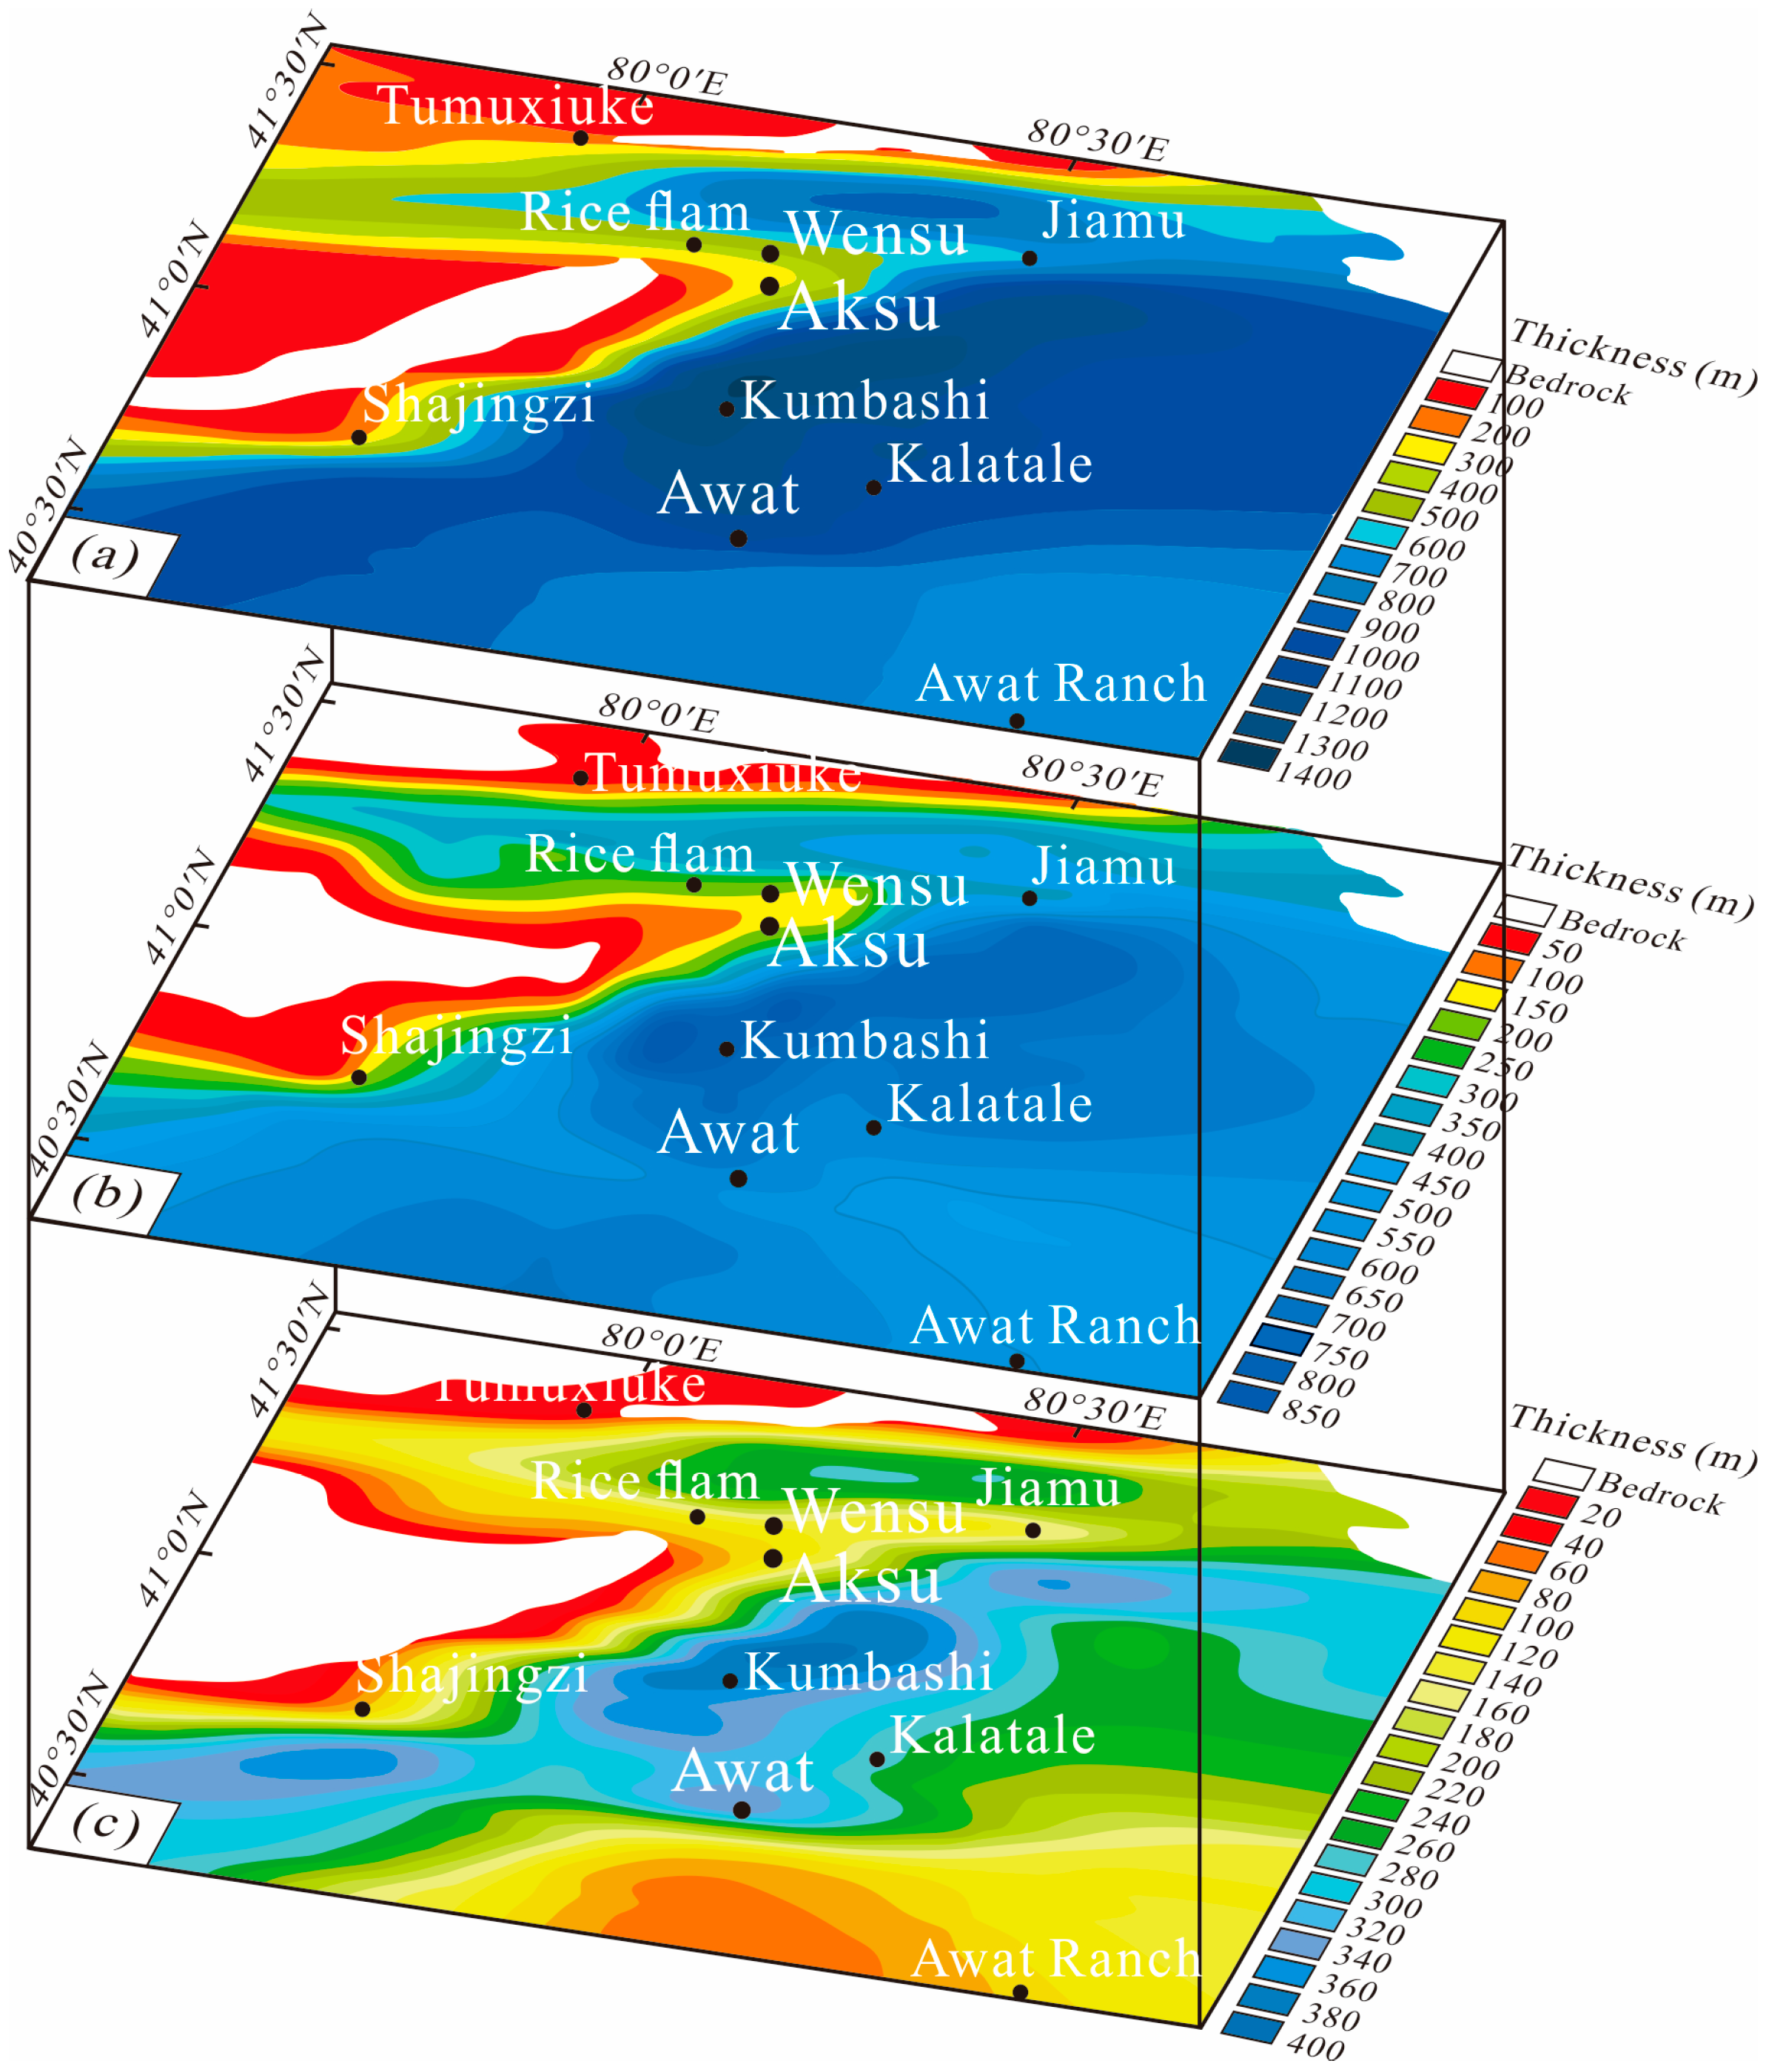
4.1. Burial Depth of Quaternary Unconsolidated Sediment Derived from Geophysical Inversion
4.2. Glacial Sedimentary Sequence and Neotectonism
4.3. Sedimentary Facies in Quaternary Aquifer Systems
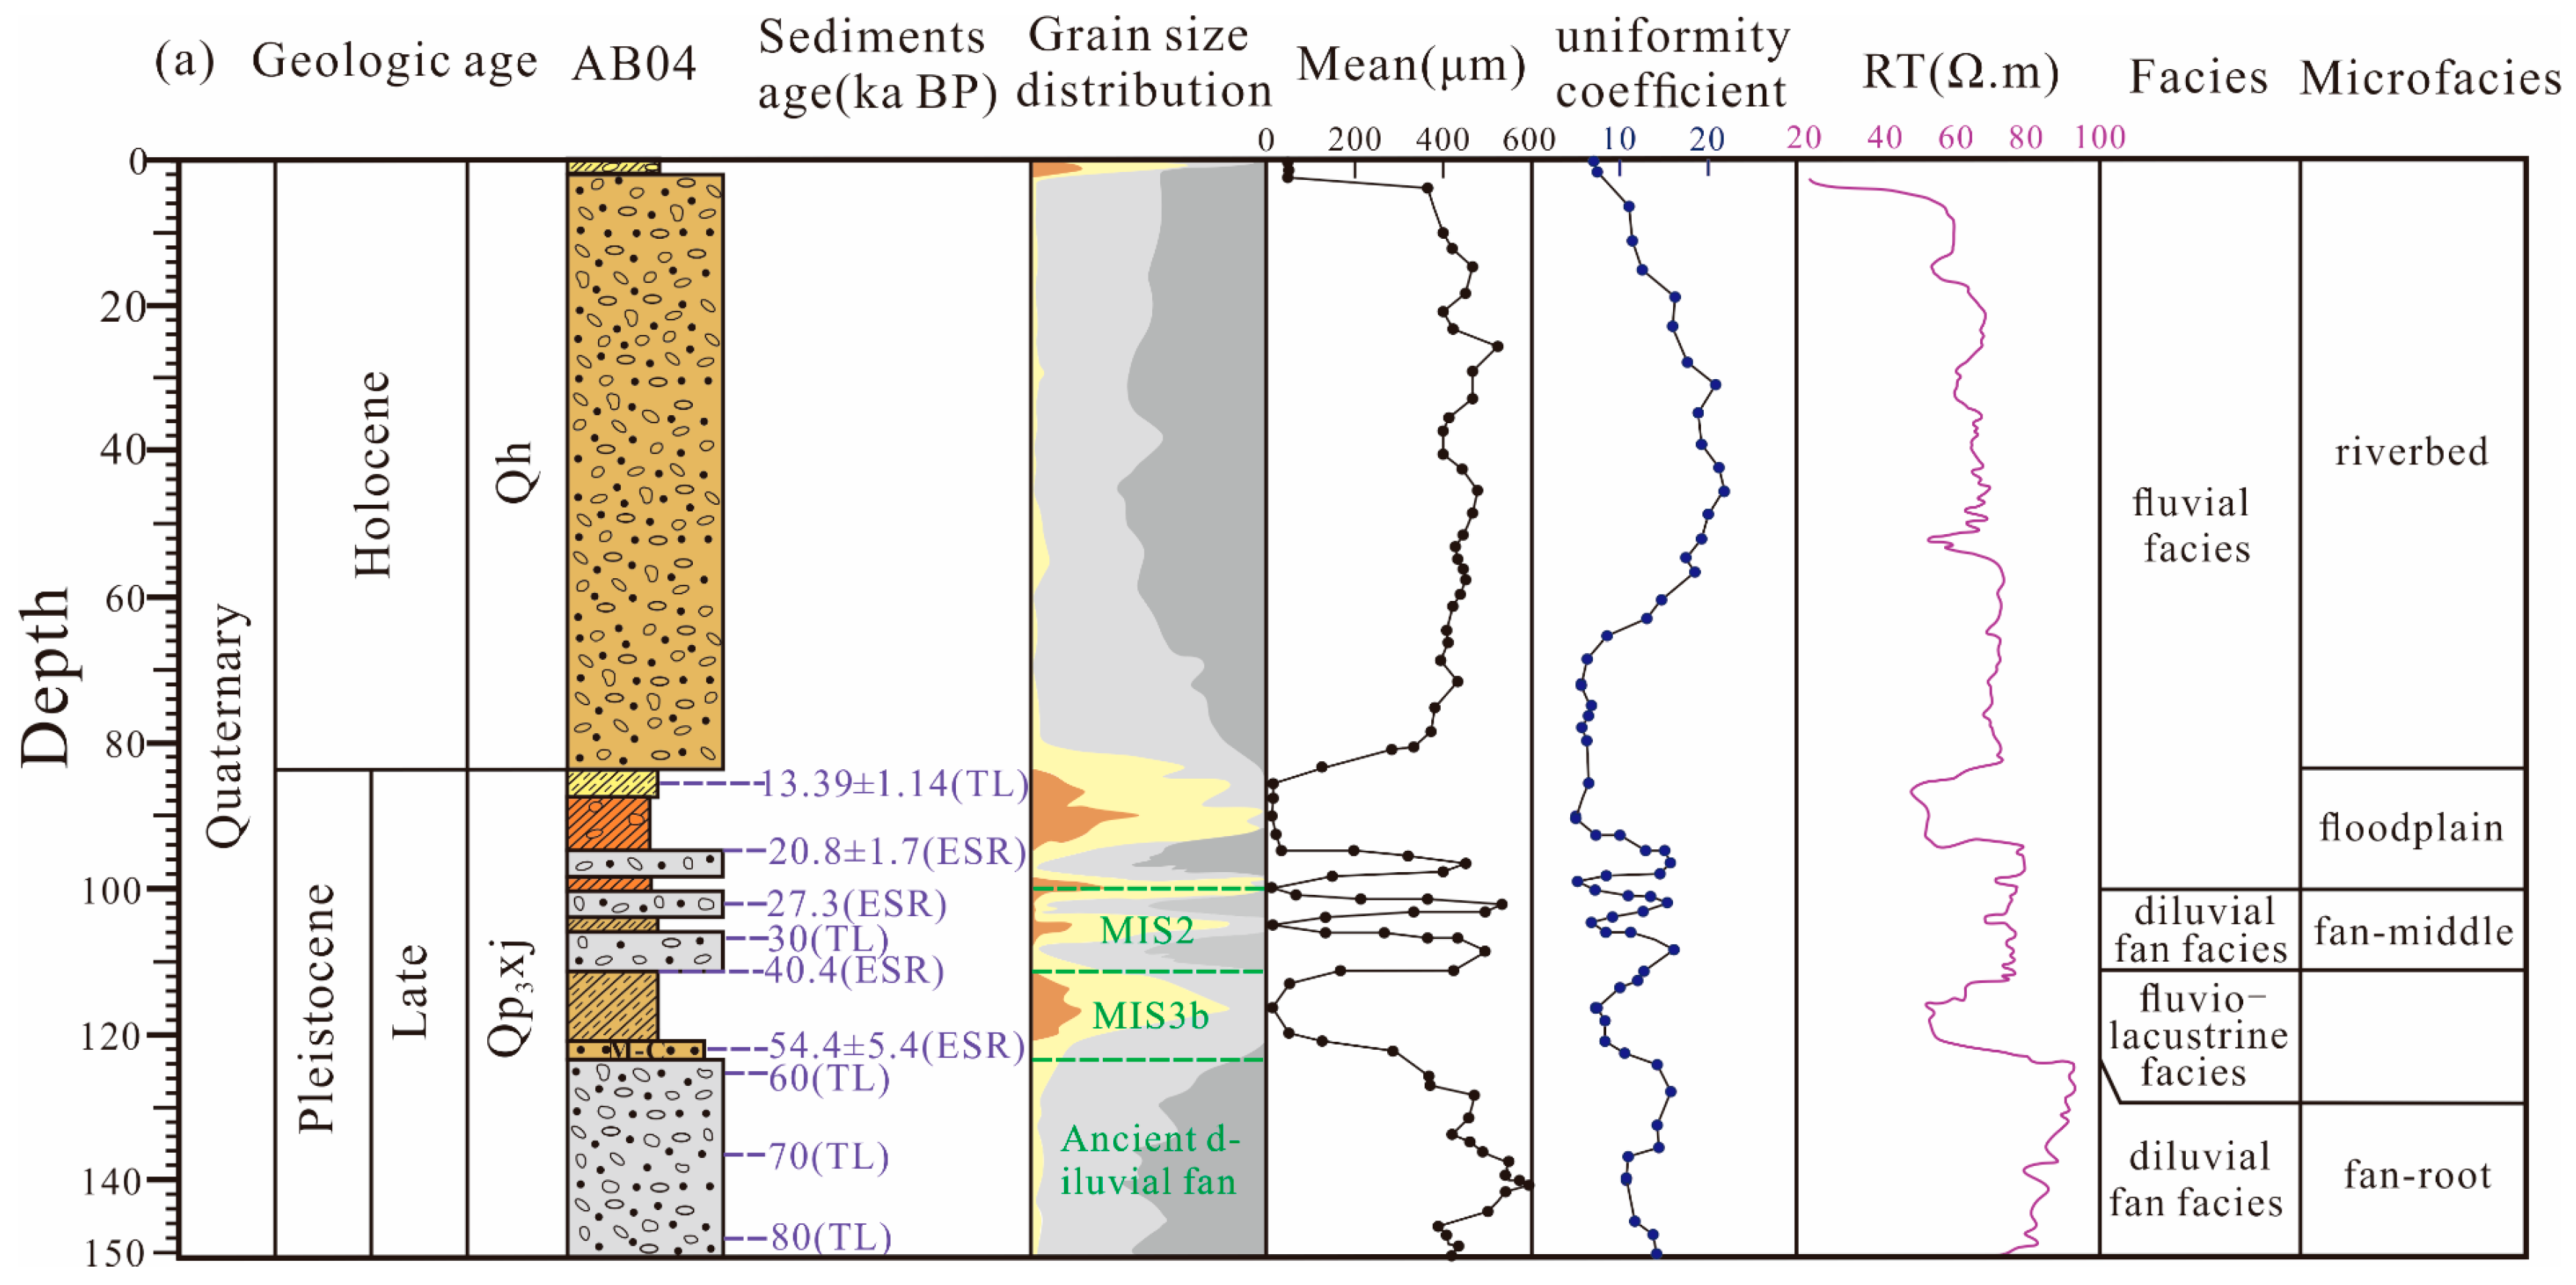
4.3.1. Parameters Determined by Particle Size Analysis
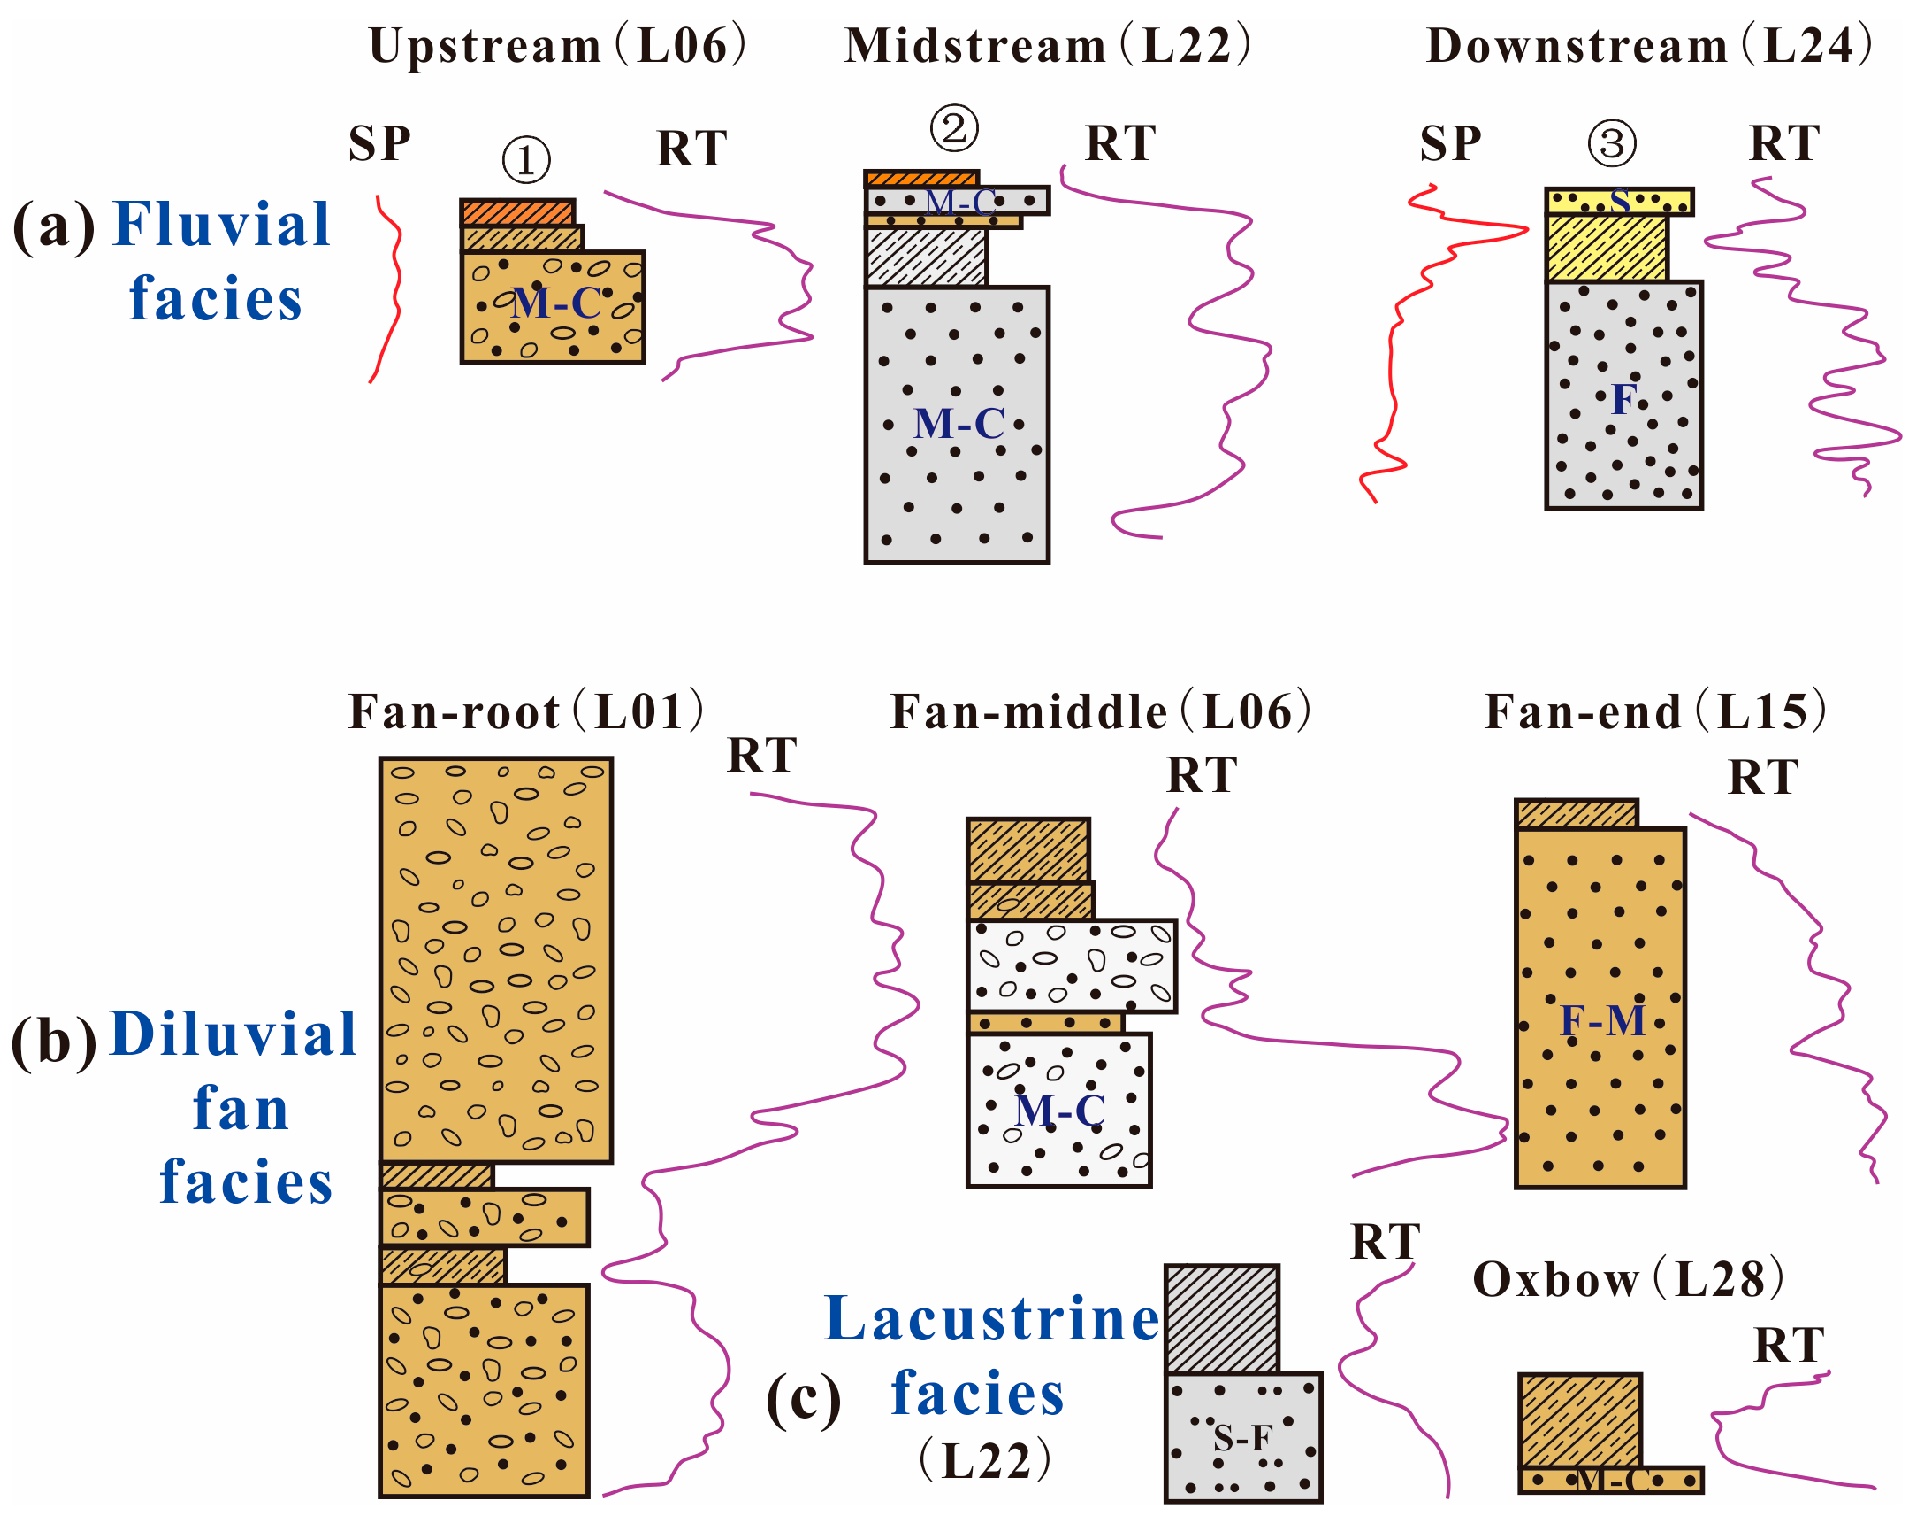
4.3.2. Electrofacies Analysis
4.3.3. Sedimentary Facies Division
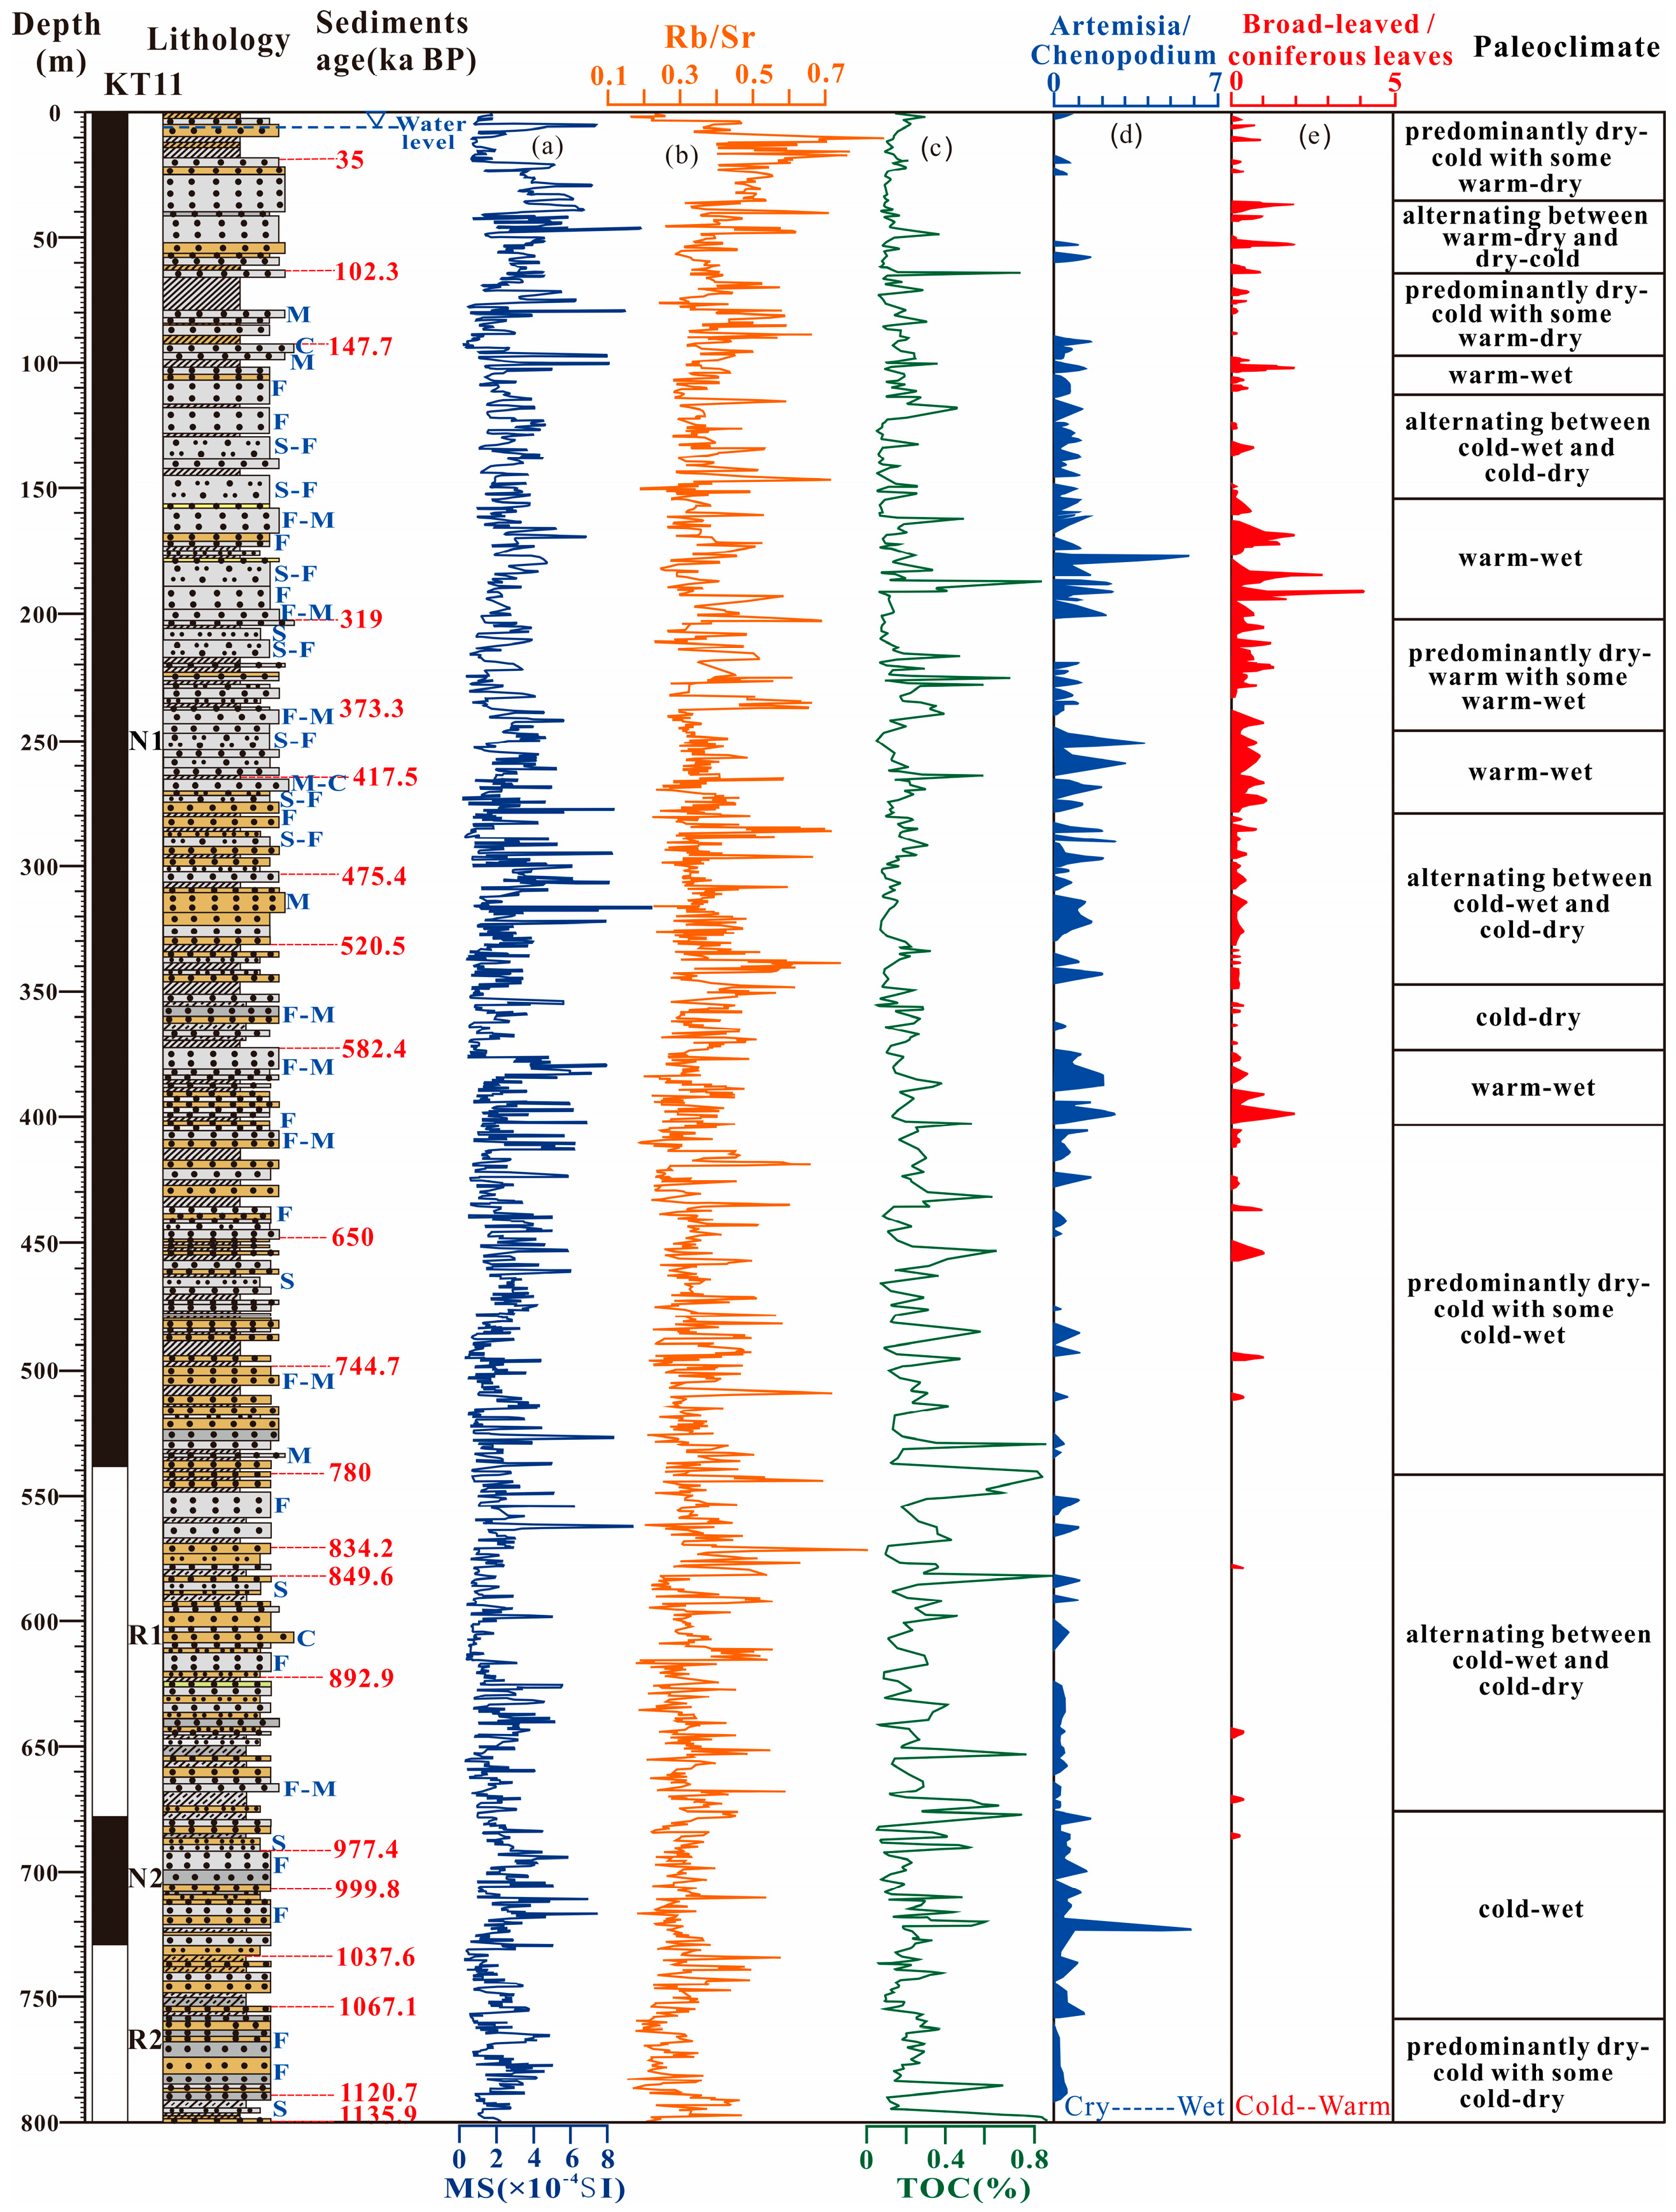
4.4. Characterization of the Palaeoclimatic Evolution
4.4.1. Quaternary Palaeoclimatic Evolutionary Sequence
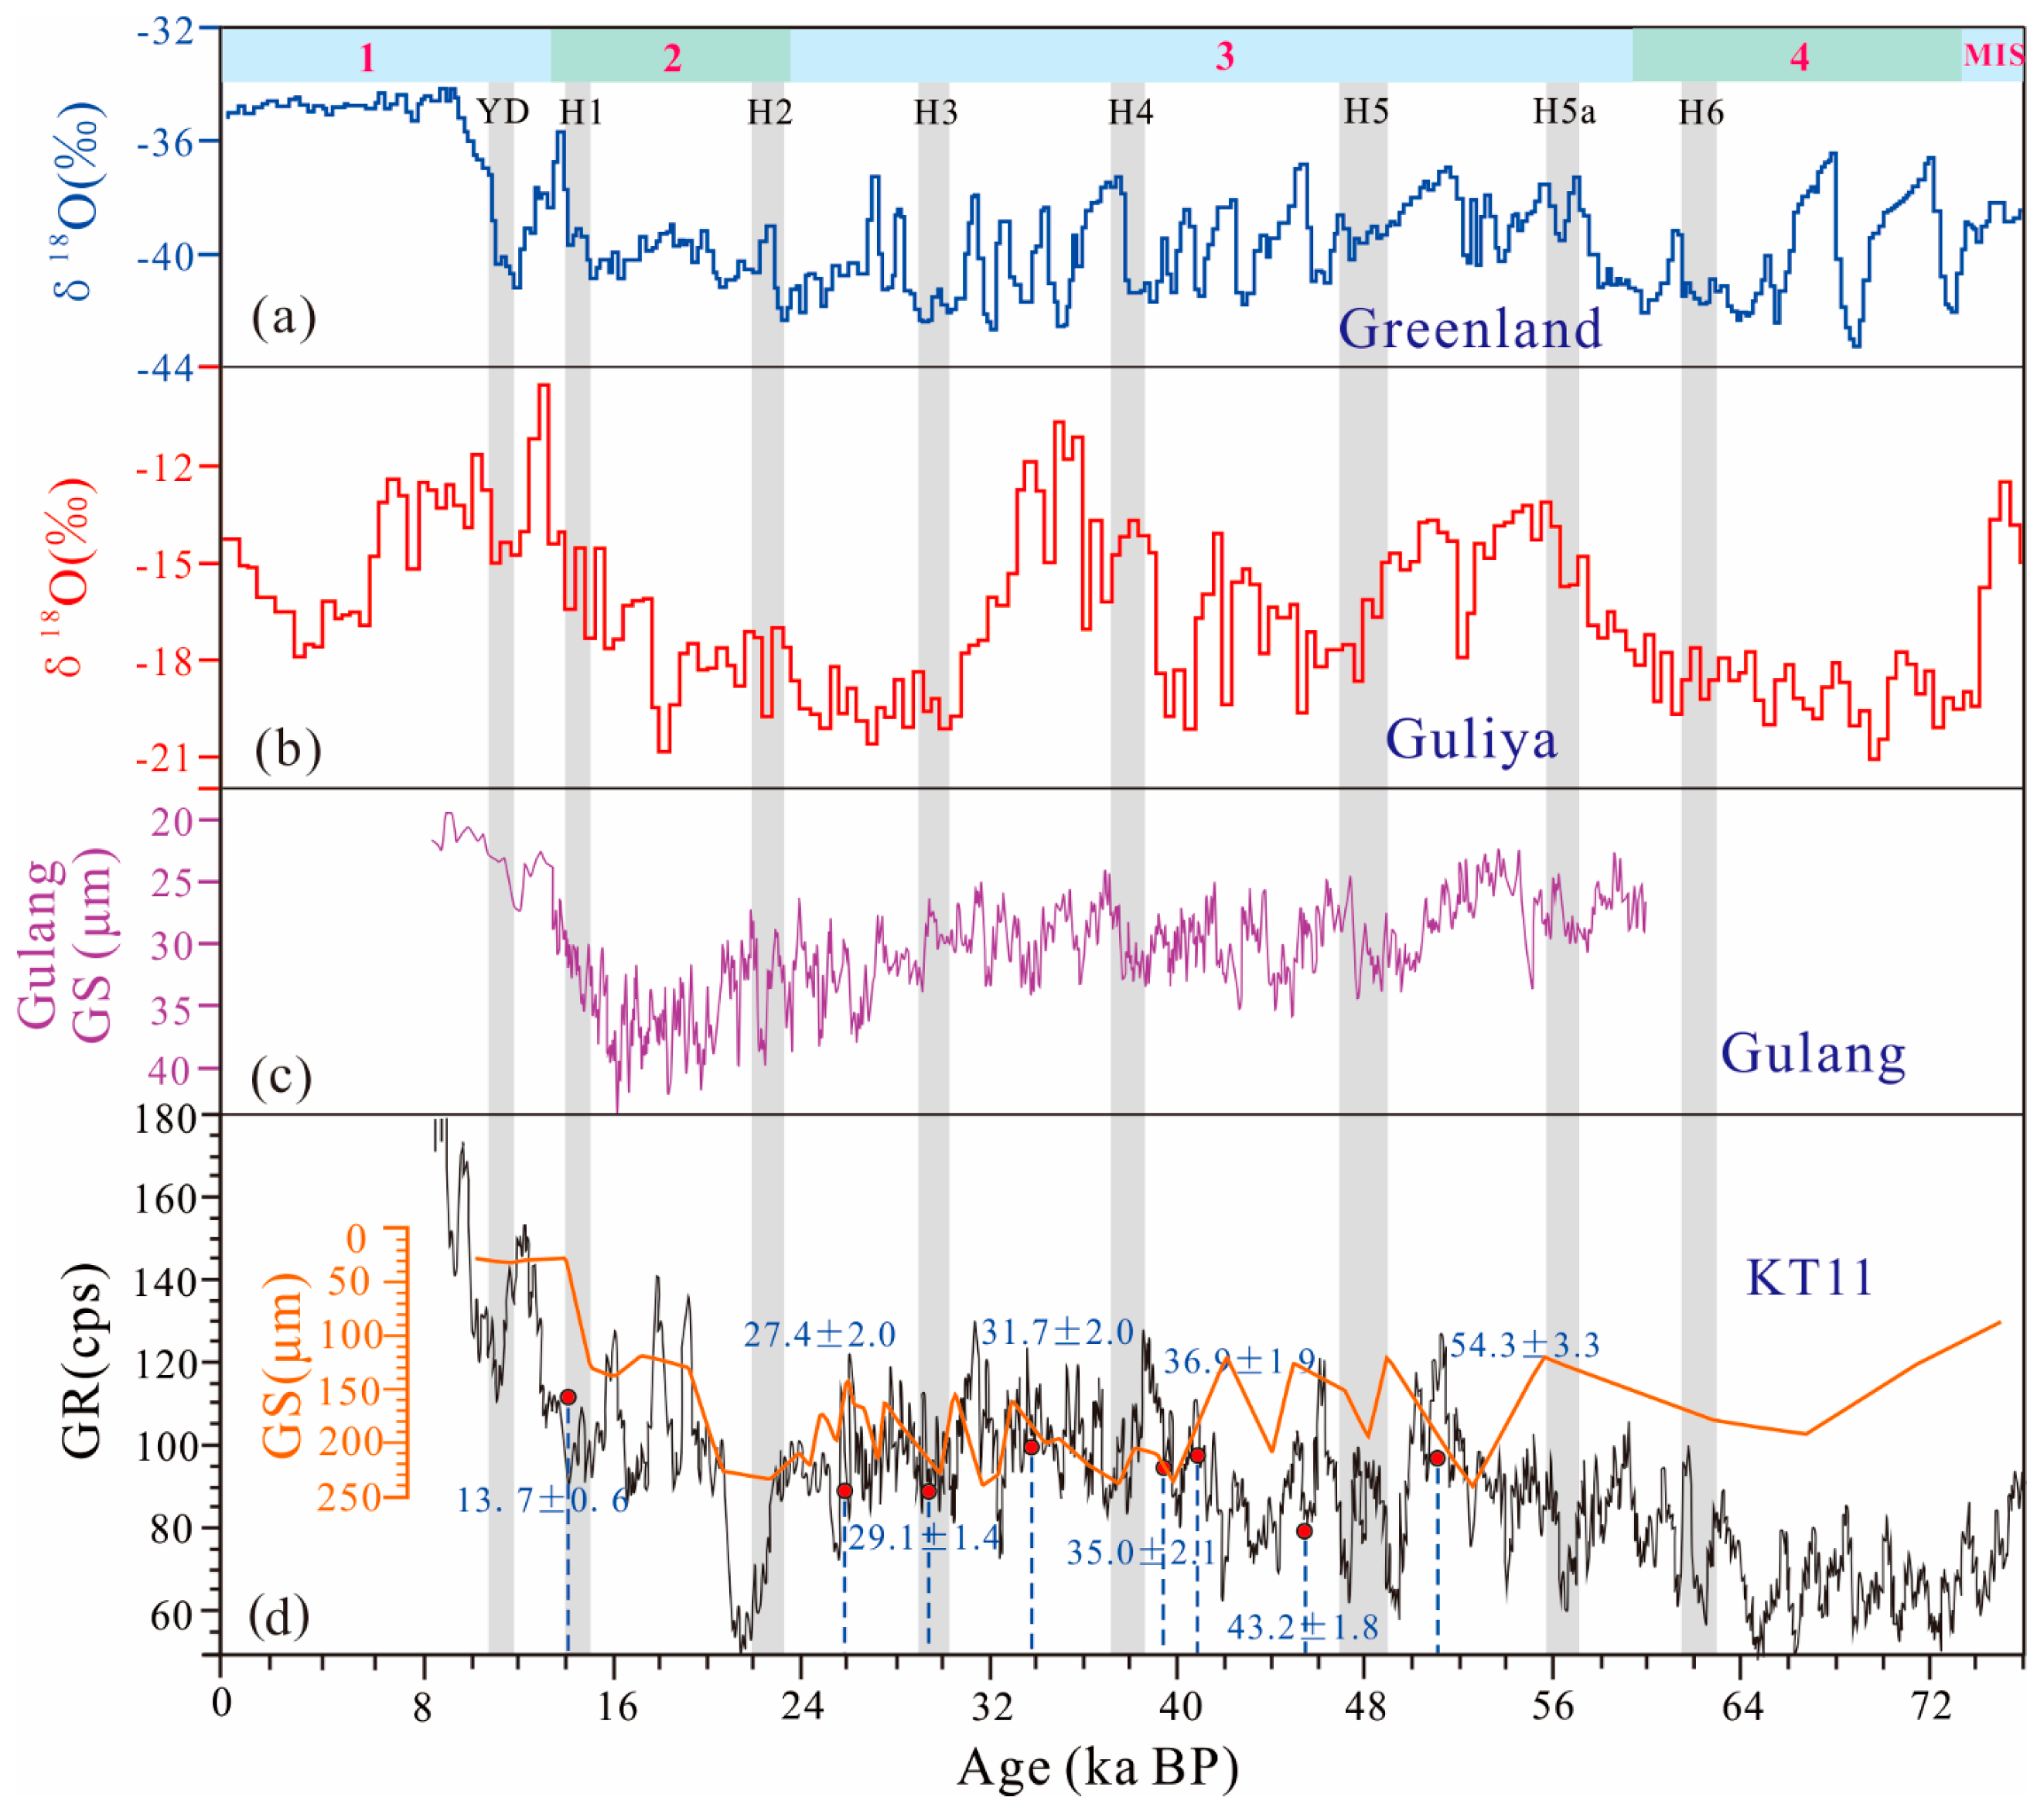
4.4.2. Climate Change since the LGM
4.5. The Existing Age of Groundwater in the Aksu River Basin
5. Discussion
5.1. The Sedimentary Environment Evolution Characteristics of the Aquifer System
5.2. Evolutionary Pattern of the GFS since the LGM
6. Conclusions
- (1)
- During the evolution history of the sedimentary environment of the Quaternary aquifer system, the study area underwent at least seven stable-erosive periods, and the sedimentary facies were characterized by the diluvial fan and fluvial facies dominating in the upper reaches and fluvial, lacustrine, and fluvial-lacustrine transitional facies dominating in the middle and lower reaches. The sedimentary environment underwent a process from deep downcutting in the LGM to the deposition of fluvial facies with the rapid filling of coarse-grained sediments in the LDP period and then to the deposition of lacustrine facies with stable fine-grained sediments in the HMP. Moreover, the transition of the middle and deep aquifer system from coarse-grained facies to fine-grained facies in the shallow aquifer system was closely related to the fluctuation in the river level, showing that the hydrodynamic conditions were gradually weakened and tended to stabilize. The results showed that in the Aksu River Basin, there was a complex coupling relationship among the glacial sedimentary sequence of the Tomur Peak area, climatic evolution, neotectonic movement and sedimentary facies of the foreland basin.
- (2)
- Since the Quaternary, the climate around the Tarim Basin has had similar spatial and temporal evolutionary characteristics, and it can be divided into four stages: a cold-dry climate in the early Pleistocene, warm-humid climate in the middle Pleistocene, long-term dry-cold climate from the late Pleistocene to the Holocene, and warm-arid climate since the Holocene. The climatic evolution of the Aksu River Basin is basically consistent with that of the Tarim Basin; the basin responded to most of the global climate events from the LIA to MIS12, and the results demonstrate the gradual aridification process of the climate in the study area affected by the westerly circulation since the LGM.
- (3)
- During the LGM, tectonic uplift and climate change controlled the strength of the driving forces of groundwater in the study area; and these results, combined with the existing groundwater age distribution in the Aksu River Basin, allowed the evolution of the GFS to be divided into three stages: an era of intense downscaling, followed by a phase of gradual downscaling, and finally a relatively stable period. Since Stages III, the regional GFSs that formed in Stages I and II were preserved in the deep basin, and the middle aquifer system was also fully circulated, both of which were considered stable systems. In the last 2.0 ka BP, as the river system has fully developed and artificial reservoirs and water diversion channels have been constructed, high and low riverbeds and inter-river low-lying lands interconnected with each other, as potential water sources or sinks depending on the season, which resulted in the formation of an active localized GFS.
Author Contributions
Funding
Data Availability Statement
Acknowledgments
Conflicts of Interest
References
- Wang, J.Z.; Jia, H.J. Sediment record of environmental change at Late Lop Nur (Xinjiang, NW China) from 13.0 to 5.6 cal ka BP. Chin. J. Oceanol. Limnol. 2017, 35, 1070–1078. [Google Scholar] [CrossRef]
- Wang, C.S.; Hazen, R.M.; Cheng, Q.M.; Stephenson, M.H.; Zhou, C.H.; Fox, P.; Shen, S.Z.; Oberhansli, R.; Hou, Z.Q.; Ma, X.G.; et al. The Deep-Time Digital Earth program: Data-driven discovery in geosciences. Natl. Sci. Rev. 2021, 8, nwab027. [Google Scholar] [CrossRef]
- Tóth, J. Gross-Formational Gravity-Flow of Groundwater: A Mechanism of the Transport Accumulation of Petroleum (The Generalized Hydraulic Theory of Petroleum Migration) in Problems Migration; Rober, W.H., III, Cordell, R.J., Eds.; AAPG Studies in Geology: Tulsa, OK, USA, 1980; pp. 121–167. [Google Scholar]
- Edmunds, W.M.; Fellman, E.; Goni, I.B.; Prudhomme, C. Spatial and temporal distribution of groundwater recharge in northern Nigeria. Hydrogeol. J. 2002, 10, 205–215. [Google Scholar] [CrossRef]
- Han, D.M.; Liang, X.; Currell, M.J.; Song, X.F.; Chen, Z.Y.; Jin, M.G.; Liu, C.M.; Han, Y. Environmental isotopic and hydrochemical characteristics of groundwater systems in Daying and Qicun geothermal fields, Xinzhou Basin, Shanxi, China. Hydrol. Process. 2010, 24, 3157–3176. [Google Scholar] [CrossRef]
- Sorg, A.; Mosello, B.; Shalpykova, G.; Allan, A.; Hill Clarvis, M.; Stoffel, M. Coping with changing water resources: The case of the Syr Darya river basin in Central Asia. Environ. Sci. Policy 2014, 43, 68–77. [Google Scholar] [CrossRef]
- Lei, M.; Zhou, J.L.; Zhou, Y.Z.; Sun, Y.; Ji, Y.Y.; Zeng, Y.Y. Spatial distribution, source apportionment and health risk assessment of inorganic pollutants of surface water and groundwater in the southern margin of Junggar Basin, Xinjiang, China. J. Environ. Manag. 2022, 319, 115757. [Google Scholar] [CrossRef] [PubMed]
- Huo, Z.; Feng, S.; Kang, S.; Li, W.; Chen, S. Effect of climate changes and water-related human activities on annual stream flows of the Shiyang River basin in arid north-west China. Hydrol. Process. 2008, 22, 3155–3167. [Google Scholar] [CrossRef]
- Wang, G.Y.; Shen, Y.P.; Zhang, J.G.; Wang, S.D.; Mao, W.Y. The effects of human activities on oasis climate and hydrologic environment in the Aksu River Basin, Xinjiang, China. Environ. Earth Sci. 2010, 59, 1759–1769. [Google Scholar] [CrossRef]
- Dong, W.; Cui, B.; Liu, Z.; Zhang, K. Relative effects of human activities and climate change on the river runoff in an arid basin in northwest China. Hydrol. Process. 2014, 28, 4854–4864. [Google Scholar] [CrossRef]
- Tóth, J. A theoretical analysis of groundwater flow in small drainage basins. J. Geophys. Res. 1963, 68, 4795–4812. [Google Scholar] [CrossRef]
- Engelen, G.B.; Jones, G.P. Developments in the analysis of groundwater flow systems. Int. Assoc. Hydrol. Sci. 1986, 163, 2–8. [Google Scholar]
- Toth, J. Gravitational System of Groundwater: Theory, Evaluation, Utilization; Cambridge University Press: New York, NY, USA, 2009; p. 297. [Google Scholar]
- Liang, X.; Zhang, R.Q.; Jin, M.G. Groundwater Flow Systems: Theory, Application and Investigation; Geological Publishing House: Beijing, China, 2015; p. 24. (In Chinese) [Google Scholar]
- Inbar, N.; Rosenthal, E.; Magri, F.; Alraggad, M.; Moller, P.; Flexer, A.; Guttman, J.; Siebert, C. Faulting patterns in the Lower Yarmouk Gorge potentially influence groundwater flow paths. Hydrol. Earth Syst. Sci. 2019, 23, 763–771. [Google Scholar] [CrossRef]
- Zhang, Z.G.; Shi, D.H.; Ren, F.H.; Yin, Z.Z.; Sun, J.C.; Zhang, C.Y. Evolution of Quaternary groundwater system in North China Plain. Sci. China (Ser. D) 1997, 40, 276–283. [Google Scholar] [CrossRef]
- Zhang, R.Q.; Liang, X.; Jin, M.G. The evolution of groundwater flow systems in the Quaternary of Hebei Plain since the last glacial maximum. Earth Sci. Front. 2013, 20, 217–226, (In Chinese, with English Abstract). [Google Scholar]
- Liang, X.; Zhang, J.W.; Lan, K.; Shen, S.; Ma, T. Hydrochemical characteristics of groundwater and analysis of groundwater flow systems in Jianghan Plain. Bull. Geol. Sci. Technol. 2020, 39, 21–33, (In Chinese, with English Abstract). [Google Scholar]
- Zhang, J.W.; Liang, X.; Jin, M.G.; Li, J.; Shen, S.; Wang, L.X.; Ma, T. Evolution of the groundwater flow system driven by the sedimentary environment since the Last Glacial Maximum in the central Yangtze River Basin. J. Hydrol. 2022, 610, 127997. [Google Scholar] [CrossRef]
- Sun, D.H.; Bloemendal, J.; Yi, Z.Y.; Zhu, Y.H.; Wang, X.; Zhang, Y.B.; Li, Z.J.; Wang, F.; Han, F.; Zhang, Y. Palaeomagnetic and palaeoenvironmental study of two parallel sections of late Cenozoic strata in the central Taklimakan Desert: Implications for the desertification of the Tarim Basin. Palaeogeogr. Palaeoclimatol. Palaeoecol. 2011, 300, 1–10. [Google Scholar] [CrossRef]
- Bi, Z.W.; Yang, Z.J.; Xu, J.M.; Song, S.H.; Hou, H.B.; Chen, J. Grain-size characteristics and sediment environment of Quatenary sediments in the central Tarim basin. Arid Land Geogr. 2009, 32, 335–339, (In Chinese, with English Abstract). [Google Scholar]
- Xu, J.M.; Yang, Z.J.; Bi, Z.W.; Guo, X.H.; Zhang, J.P.; Zhang, H.R. Carbon, oxygen isotopic characteristic and their paleoenvironment significance from Quaternary sediment in the Tarim basin. J. Eng. Geol. 2007, 15 (Suppl. S1), 50–54, (In Chinese, with English Abstract). [Google Scholar]
- Bai, Y.L.; Wang, J.R.; Tian, K.; Wang, D.Q.; Zhao, N. Element geochemistry characteristic from the 72-51 ka BP lake sediments in the northern margin of Kongqi River, Xinjiang. Arid Land Geogr. 2016, 39, 477–485, (In Chinese, with English Abstract). [Google Scholar]
- Su, J.; Liu, Y.X.; Bai, Y.L. Grain size characteristics of late Pleistocene lacustrine sediments in eastern Tarim Basin and their paleoenvironmental significance. West-China Explor. Eng. 2017, 1, 157–164, (In Chinese, with English Abstract). [Google Scholar]
- Sun, Z.C.; Feng, X.J.; Li, D.M.; Yang, F.; Qu, Y.H.; Wang, H.J. Cenozoic Ostracoda and palaeoenvironments of the northeastern Tarim Basin, western China. Palaeogeogr. Palaeoclimatol. Palaeoecol. 1999, 148, 37–50. [Google Scholar] [CrossRef]
- Luo, C.; Peng, Z.C.; Yang, D.; Liu, W.G.; Zhang, Z.F.; He, J.F.; Chou, C.N. A lacustrine record from Lop Nur, Xinjiang, China: Implications for paleoclimate change during Late Pleistocene. J. Asian Earth Sci. 2009, 34, 38–45. [Google Scholar]
- Yan, S.; Qin, X.Y. Quaternary environmental evolution of the Lop Nur region, NW China. Acta Micropalaeontol. Sin. 2000, 17, 165–169. [Google Scholar]
- Yan, F.H.; Ye, Y.Y.; Mai, X. The sporo-pollen assemblage in the luo 4 drilling of Lop Lake in Uygur autonomus region of Xinjiang and its significance. Seisimol. Geol. 1983, 5, 75–81, (In Chinese, with English Abstract). [Google Scholar]
- Wang, C.S.; Wang, T.T.; Chen, X.; Gao, Y.; Zhang, L.M. Paleoclimate implications for future climate change. Earth Sci. Front. 2017, 24, 1–17, (In Chinese, with English Abstract). [Google Scholar]
- Lin, J.X.; Zhang, J.; Ju, Y.J.; Wang, Y.; Lin, F.; Zhang, J.P.; Wang, S.F.; Wei, M.R. The lithostratigrapuy, magnetostratigraphy, and climatostratigraphy in the Lop Nur region, Xinjiang. J. Stratigr. 2005, 29, 317–322. [Google Scholar]
- Zhang, R.; Li, L.; Nai, W.H.; Gu, Y.S.; Huang, C.J.; Ogg, J.; Li, Q.H.; Lu, C.X.; Wang, Z.X. Astronomical forcing of terrestrial climate recorded in the Pleistocene of the western Tarim Basin, NW China. Palaeogeogr. Palaeoclimatol. Palaeoecol. 2019, 530, 78–89. [Google Scholar] [CrossRef]
- Zhang, R.; Yin, Q.Z.; Nai, W.H.; Wang, Z.X.; Lu, H.; Huang, C.J.; Gu, Y.S.; Li, L.; Wang, Y.S.; Liu, L.J. Orbital and Millennial-Scale Climate Variability over the Past 76 ka in the Western Tarim Basin, Northwest China. J. Earth Sci. 2023, 34, 173–180. [Google Scholar] [CrossRef]
- Head, M.J. Formal subdivision of the Quaternary System/Period: Present status and future directions. Quat. Int. 2019, 500, 32–51. [Google Scholar] [CrossRef]
- Chen, F.H.; Chen, J.H.; Huang, W. A discussion on the westerly-dominated climate model in mid-latitude Asia during the modern interglacial period. Earth Sci. Front. 2009, 16, 23–32. (In Chinese) [Google Scholar] [CrossRef]
- Xu, J.H.; Chen, Y.N.; Lu, F.; Li, W.H.; Zhang, L.J.; Hong, Y.L. The nonlinear trend of runoff and its response to climate change in the Aksu River, western China. Int. J. Climatol. 2011, 31, 687–695. [Google Scholar] [CrossRef]
- Fan, Y.T.; Chen, Y.N.; Li, W.H. Increasing precipitation and baseflow in Aksu River since the 1950s. Quat. Int. 2014, 336, 26–34. [Google Scholar] [CrossRef]
- Liu, S.Y.; Ding, Y.J.; Shangguan, D.H. Glacier retreat as a result of climate warming and increased precipitation in the Tarim River Basin, Northwest China. Ann. Glaciol. 2006, 43, 91–96. [Google Scholar] [CrossRef]
- Feng, S.; Hu, Q.; Huang, W.; Ho, C.H.; Li, R.; Tang, Z. Projected climate shift under future global warming from multi-model, multi-scenario, CMIP5 simulations. Glob. Planet. Change 2014, 112, 41–52. [Google Scholar] [CrossRef]
- Chen, F.H.; Yu, Z.C.; Yang, M.L.; Ito, E.; Wang, S.M.; Madsen, D.B.; Huang, X.Z.; Zhao, Y.; Sato, T.; Birks, H.J.B.; et al. Holocene moisture evolution in arid central Asia and its out-of-phase relationship with Asian monsoon history. Quat. Sci. Rev. 2008, 27, 351–364. [Google Scholar] [CrossRef]
- Pan, Y.X.; Dai, S.E. Report of 1:200,000 Regional Hydrogeological Survey in Aksu Prefecture, Xinjiang; Xinjiang Geological Archive: Urumqi, China, 1979. [Google Scholar]
- Blatt, H. Sedimentary Petrology; Freeman W H and Company: New York, NY, USA, 1982; p. 564. [Google Scholar]
- Yuan, H.Q.; Wang, L.; Yu, Y.H.; Zhang, D.J.; Xu, F.M.; Liu, H.T. Review of sedimentary grain size analysis methods. J. Jilin Univ. (Earth Sci. Ed.) 2019, 49, 380–393. [Google Scholar]
- Wang, Z.M.; Long, H.S. Different hydrocarbon accumulation histories in the Kelasu-Yiqikelike structural belt of the Kuqa foreland basin. Acta Geol. Sin. Engl. Ed. 2010, 84, 1195–1208. [Google Scholar]
- Wen, L.; Li, Y.J.; Zhang, G.Y.; Zhang, G.Y.; Tian, Z.J.; Peng, G.X.; Qiu, B.; Huang, Z.B.; Luo, J.C.; Zhang, Q. Evolution of fold-thrust belts and Cenozoic uplifting of the South Tianshan Mountain range in the Kuqa region, Northwest China. J. Asian Earth Sci. 2017, 135, 327–337. [Google Scholar] [CrossRef]
- Neng, Y.; Xie, H.W.; Yin, H.W.; Li, Y.; Wang, W. Effect of basement structure and salt tectonics on deformation styles along strike: An example from the Kuqa fold–thrust belt, West China. Tectonophysics 2018, 730, 114–131. [Google Scholar] [CrossRef]
- Zhang, J.F.; Zhang, Y.Y.; Gao, Y.J. Silurian hydrocarbon exploration breakthrough and its implications in the Shajingzi structural belt of Tarim Basin, NW China. Pet. Explor. Dev. 2022, 49, 233–246. [Google Scholar] [CrossRef]
- Turner, S.A.; Cosgrove, J.W.; Liu, J.G. Controls on lateral structural variability along the Keping Shan Thrust Belt, SW TianShan Foreland, China. Geol. Soc. Lond. Spec. Publ. 2010, 348, 71–85. [Google Scholar] [CrossRef]
- Chen, Z.L.; Wang, Z.X.; Han, F.B.; Zhang, W.G.; Zhang, Q.; Zhou, Z.J.; Wang, X.H.; Xiao, W.F.; Han, S.Q.; Zhou, Z.J.; et al. Late Cretaceous–Cenozoic uplift, deformation, and erosion of the SW Tianshan Mountains in Kyrgyzstan and Western China. Int. Geol. Rev. 2018, 60, 1019–1037. [Google Scholar] [CrossRef]
- Zhao, J.D. Preliminary Study on Evolution Sequence of Quaternary Glaciers in Jengish Chokusu Area; Tianshan MountainsProQuest Digital Dissertations; South China Normal University: Guangzhou, China, 2007; (In Chinese, with English Abstract). [Google Scholar]
- Jia, Y.; Shi, Y.; Wang, S.; Jiang, X.; Li, S.; Wang, A.; Li, X. Lake expanding events in the Tibetan Plateau since 40 kaBP. Sci. China (Ser. D) 2001, 44 (Suppl. S1), 301–315. [Google Scholar] [CrossRef]
- Zhang, H.C.; Wunnemann, B.; Ma, Y.Z.; Peng, J.L.; Pachur, H.; Li, J.J.; Qi, Y.; Chen, G.J.; Fang, H.B.; Feng, Z.D. Lake level and climate changes between 42000 and 18000 14C yr BP in the Tengger Desert, northwestern China. Quat. Res. 2002, 58, 62–72. [Google Scholar] [CrossRef]
- Yang, B.; Shi, Y.F. Warm-humid climate in Northwest China during the period of 40-30ka BP: Geological records and origin. Quat. Sci. 2003, 23, 60–68, (In Chinese, with English Abstract). [Google Scholar]
- Zhao, J.D.; Liu, S.Y.; He, Y.Q.; Song, Y.G. Quaternary glacial chronology of the Ateaoyinake River Valley, Tianshan Mountains, China. Geomorphology 2009, 103, 276–284. [Google Scholar] [CrossRef]
- Zhao, J.; Song, Y.; King, J.W.; Liu, S.; Wang, J.; Wu, M. Glacial geomorphology and glacial history of the Muzart River valley, Tianshan Range, China. Quat. Sci. Rev. 2010, 29, 1453–1463. [Google Scholar] [CrossRef]
- Zhao, J.D.; Liu, S.Y.; He, Y.Q.; Deng, X.F.; ShangGuan, D.H. The Glacial Sediments Sequences in the Ateaoyinake River Valley, Tianshan Mountains. Acta Geogr. Sin. 2006, 61, 491–500. [Google Scholar]
- He, M.L.; Xu, M.; Zhang, Q.; Zhao, X.; Ren, R. Preliminary study on valley variation in the mountain pass of Kumalake River of South Tianshan Mountain since the Quaternary. South-North Water Sci. Technol. 2013, 11, 62–66, (In Chinese, with English Abstract). [Google Scholar]
- Folk, R.L.; Ward, W.C. Brazos River bar: A study in the significance of grain size parameters. J. Sediment. Petrol. 1957, 27, 3–26. [Google Scholar] [CrossRef]
- Wang, Y.N.; Li, S.; Yu, B. Spatial variability analysis of permeability coefficient in Aksu River Basin. China Rural Water Hydropower 2021, 1, 64–75, (In Chinese, with English Abstract). [Google Scholar]
- Lisa, C.; Or, M.B.; Zvi, B.; Michael, L. Late Quaternary lacustrine deposits of the Dead Sea basin: High resolution sequence stratigraphy from downhole logging data. Quat. Sci. Rev. 2019, 210, 175–189. [Google Scholar]
- Shi, Y.F.; Zheng, B.X.; Su Zhen Mu, Y.Z. Study of Quaternary glaciation in Mts. Tomur-Hantengri area, Tianshan. J. Glaciol. Geocryol. 1984, 6, 1–14, (In Chinese, with English Abstract). [Google Scholar]
- Kukla, G.; Heller, F.; Liu, X.M.; Xu, T.C.; Liu, T.S.; An, Z.S. Pleistocene climate in China dated by magnetic susceptibility. Geology 1988, 16, 811–814. [Google Scholar] [CrossRef]
- Gallet, S.; Jahn, B.; Torii, M. Geochemical characterization of the Luochuan loess-paleosol sequence, China, and paleoclimatic implications. Chem. Geol. 1996, 133, 67–88. [Google Scholar] [CrossRef]
- Wang, Z.; Xu, H.; Zhan, Q.; Saito, Y.; He, Z.; Xie, J.; Li, X.; Dong, Y. Lithological and Palynological Evidence of Late Quaternary Depositional Environments in the Subaqueous Yangtze Delta, China. Quat. Res. 2010, 73, 550–562. [Google Scholar] [CrossRef]
- Nai, W.H.; Li, B.; Chang, Z.Y.; Wang, Y.X.; Han, Y.J.; Tian, Y.N. Report on 1:100,000 Hydrogeological and Environmental Geological Survey of the Kashgar Delta, Xinjiang; No.2 Hydrogeological and Engineering Geological Team, Xinjiang Bureau of Geology and Mineral Resources Exploration and Development: Urumqi, China, 2018. (In Chinese) [Google Scholar]
- Heinrich, H. Origin and Consequences of Cyclic Ice Rafting in the Northeast Atlantic Ocean during the Past 130000 Years. Quat. Res. 1988, 29, 142–152. [Google Scholar] [CrossRef]
- Bond, G.; Broecker, W.; Johnsen, S.; McManus, J.; Labeyrie, L.; Jouzel, J.; Bonani, G. Correlations between Climate Records from North Atlantic Sediments and Greenland Ice. Nature 1993, 365, 143–147. [Google Scholar] [CrossRef]
- Huang, X.Z.; Chen, F.H.; Fan, Y.X.; Yang, M.L. Dry late-glacial and early Holocene climate in arid central Asia indicated by lithological and palynological evidence from Bosten Lake, China. Quat. Int. 2009, 194, 19–27. [Google Scholar] [CrossRef]
- Li, Y.; Song, Y.G.; Lai, Z.P.; Han, Z.P.; Han, L.; An, Z.S. Rapid and Cyclic Dust Accumulation during MIS 2 in Central Asia Inferred from Loess OSL Dating and Grain-Size Analysis. Sci. Rep. 2016, 6, 32365. [Google Scholar] [CrossRef] [PubMed]
- Liu, X.K.; Chen, J.H.; Chen, S.Q.; Wang, H.P.; Huang, W.; Feng, S.; Chen, F.H. Abrupt climate change in arid central Asia during the Holocene: A review. Earth-Sci. Rev. 2023, 242, 104450. [Google Scholar] [CrossRef]
- Lifton, N.; Beel, C.; Haattestrand, C.; Kassab, C.; Rogozhina, I.; Heermance, R.; Oskin, M.; Burbank, D.; Blomdin, R.; Gribenski, N.; et al. Constraints on the late Quaternary glacial history of the Inylchek and Sary-Dzaz valleys from in situ cosmogenic 10Be and 26Al, eastern Kyrgyz Tian Shan. Quat. Sci. Rev. 2014, 101, 77–90. [Google Scholar] [CrossRef]
- NGRIP Members (North Greenland Ice Core Project Members). High-Resolution Record of Northern Hemisphere Climate Extending into the Last Interglacial Period. Nature 2004, 431, 147–151. [Google Scholar] [CrossRef]
- Yao, S.D.; Xu, B.Q.; Pu, J.C. Climate change on orbital and suborbital timescales recorded by the Guliya ice core in the Tibetan Plateau. Sci. China (Ser. D) 2001, 31, 287–294. (In Chinese) [Google Scholar]
- Sun, Y.B.; Clemens, S.C.; Morrill, C.; Lin, X.P.; Wang, X.L.; An, Z.S. Influence of Atlantic Meridional Overturning Circulation on the East Asian Winter Monsoon. Nat. Geosci. 2012, 5, 46–49. [Google Scholar] [CrossRef]
- Huang, W.; Chen, J.H.; Zhang, X.J.; Feng, S.; Chen, F.H. Definition of the core zone of the “westerlies-dominated climatic regime”, and its controlling factors during the instrumental period. Sci. China Earth Sci. 2015, 58, 676–684. [Google Scholar] [CrossRef]
- Mix, A.C.; Bard, E.; Schneider, R. Environmental processes of the ice age: Land, oceans, glaciers. Quat. Sci. Rev. 2001, 20, 627–657. [Google Scholar] [CrossRef]
- Clark, P.U.; Dyke, A.S.; Shakun, J.D.; Carlson, A.E.; Clark, J.; Wohlfarth, B.; Mitrovica, J.X.; Hostetler, S.W.; McCabe, A.M. The last glacial maximum. Science 2009, 325, 710e714. [Google Scholar] [CrossRef]
- Hughes, P.D.; Gibbard, P.L.; Ehlers, J. Timing of glaciation during the last glacial cycle: Evaluating the concept of a global ‘Last Glacial Maximum’ (LGM). Earth Sci. Rev. 2013, 125, 171e198. [Google Scholar] [CrossRef]
- Feng, Q.; Su, Z.Z.; Jin, H.J. Study on desert evolution and climate change in Tarim River Basin since 12 kaBP. Sci. China (Ser. D) 1999, 42, 101–112. [Google Scholar] [CrossRef]
- Wünnemann, B.; Mischke, S.; Chen, F.H. A Holocene sedimentary record from Bosten Lake, China. Palaeogeogr. Palaeoclimatol. Palaeoecol. 2006, 234, 223–238. [Google Scholar] [CrossRef]
- Zhong, W.; Tueerxun, K.; Shu, Q.; Wang, L.G. Paleoclimatic and Paleoenvironmental evolution since about 25 ka BP in the Taitema Lake area, south Xinjiang. Arid. Geogr. 2005, 28, 183–187, (In Chinese, with English Abstract). [Google Scholar]
- Li, Y.; Morrill, C. Multiple factors causing Holocene lake-level change in monsoonal and arid central Asia as identified by model experiments. Clim. Dyn. 2010, 35, 1119–1132. [Google Scholar] [CrossRef]
- Zhang, R. Orbital and Millennial-Scale Climate Changes during the Middle Pleistocene from Western Tarim Basin, Northwest China, ProQuest Digital Dissertations, CNKI, Beijing, China, 2020. (In Chinese, with English Abstract).
- Xiao, J.; Liu, G.N.; Nie, Z.Y.; Chen, Y.X.; Peng, X.; Liu, B.B.; Han, Y.S.; Cui, Z.J. Glacial evidence of aridification in the Tianshan Mountains since the Last Glacial. J. Glaciol. Geocryol. 2018, 40, 434–447, (In Chinese, with English Abstract). [Google Scholar]
- Liu, J.L.; Guo, X.G.; Chen, D.L.; Li, J.; Yue, B.S.; Zeng, X.M. Diversification and historical demography of the rapid racerunner (Eremias velox) in relation to geological history and Pleistocene climatic oscillations in arid Central Asia. Mol. Phylogenetics Evol. 2019, 130, 244–258. [Google Scholar] [CrossRef]
- Yu, B. The Research on Groundwater Circulation in the Aksu River Basin Based on Isotope Technology, ProQuest Digital Dissertations, CNKI, Beijing, China, 2021. (In Chinese with English Abstract).
- Fu, B.H.; Lin, A.M.; Kano, K.; Maruyama, T.; Guo, J.M. Quaternary folding of the eastern Tian Shan, northwest China. Tectonophysics 2003, 369, 79–101. [Google Scholar] [CrossRef]
- Yang, X.P.; Ran, Y.K.; Chen, J.W.; Chen, L.C.; Xu, X.W. Terrace deformation measurement and crustal shortening of several new fold belts in Keping nappe structure. Sci. China (Ser. D) 2006, 36, 905–913. [Google Scholar]
- Hubert-Ferrari, A.; Suppe, J.; Gonzalez-Mieres, R.; Wang, X. Mechanisms of active folding of the landscape (southern Tian Shan, China). J. Geophys. Res. 2007, 112, B03S09. [Google Scholar] [CrossRef]
- Loury, Y.; Rolland, S.; Guillot, A.V.; Mikolaichuk, P.; Lanari, O.; Bruguier, O.; Bosch, D. Crustal-scale structure of South Tian Shan: Implications for subduction polarity and Cenozoic reactivation. In Geological Evolution of Central Asian Basins and the Western Tian Shan Range Geological Society; Brunet, M.-F., McCann, T., Sobel, E.R., Eds.; Special Publications: London, UK, 2015; Volume 424, pp. 1–31. [Google Scholar]
- Wu, C. Landform Environment Evolution of North China; Science Press: Beijing, China, 2008. (In Chinese) [Google Scholar]
- Osman, M.B.; Tierney, J.E.; Zhu, J.; Tardif, R.; Hakim, G.J.; King, J.; Poulsen, C.J. Globally resolved surface temperatures since the Last Glacial Maximum. Nature 2021, 599, 239–244. [Google Scholar] [CrossRef]
- Mischke, S.; Wünnemann, B. The Holocene salinity history of Bosten Lake (Xinjiang, China) inferred from ostracod species assemblages and shell chemistry: Possible palaeoclimatic implications. Quatern Int. 2006, 154–155, 100–112. [Google Scholar] [CrossRef]
- Zhang, C.; Feng, Z.; Yang, Q.; Gou, X.; Sun, F. Holocene environmental variations recorded by organic-related and carbonate-related proxies of the lacustrine sediments from Bosten Lake, northwestern China. Holocene 2010, 20, 363–373. [Google Scholar] [CrossRef]
- Gong, Z.; Li, S.H.; Li, B. The evolution of a terrace sequence along the Manas River in the northern foreland basin of Tian Shan, China, as inferred from optical dating. Geomorphology 2014, 213, 201–212. [Google Scholar] [CrossRef]
- Wu, C.Y.; Alimujiang Dai, X.Y.; Wu, G.D.; Chen, J.B. Discovery of the Late-Quaternary activity along the eastern segment of maidan fault in southwest Tianshan and its tectonic implication. Seismol. Geol. 2014, 36, 976–990, (In Chinese, with English Abstract). [Google Scholar]
- Yang, Y.X.; Gao, Y.J.; Zhang, J.F.; Zhou, X.G.; Zhang, J.H.; Miao, M.Q. New understanding of petroleum geological conditions of Wensu bulge in Tarim Basin, Xinjiang. Geol. Surver China 2019, 6, 11–16, (In Chinese, with English Abstract). [Google Scholar]
- Zhang, J.H.; Yang, Y.X.; Gao, Y.J.; Li, S.M.; Yu, B.S.; Yu, B.S.; Gong, X.X.; Bai, Z.K.; Miao, M.Q.; Zhang, Y.Y.; et al. Geochemistry and source of crude oils in the Wensu uplift, Tarim Basin, NW China. J. Pet. Sci. Eng. 2022, 208, 109448. [Google Scholar] [CrossRef]
- Yin, A.; Nie, S.; Craig, P.; Harrison, T.M.; Ryerson, F.J.; Qian, X.L.; Yang, G. Late Cenozoic tectonic evolution of the southern Chinese Tian Shan. Tectonics 1998, 17, 1–27. [Google Scholar] [CrossRef]
- Yang, X.P.; Ran, Y.K.; Cheng, J.W.; Chen, L.C.; Xu, W. Measurement of terrace deformation and crustal shortening of some renascent fold zones within Kalpin nappe structure. Sci. China Ser. D Earth Sci. 2007, 50, 33–42. [Google Scholar] [CrossRef]
- Liu, J.M.; Wang, Q.; Nie, X.H.; Gao, G.; Zhang, L.L.; Zhang, Z.G.; Xiang, Y. Analysis on the Characteristics of the Kalpin M_S5. 3 Earthquake Sequence of December 1, 2013, and Anomalies before the Earthquake. Earthq. Res. China 2017, 31, 381–394. [Google Scholar]
- Li, J.Y.; Zhang, Q.; Zhang, G.Y.; Yang, H.J.; Yang, X.Z.; Shi, J.; Neng, Y.; Chen, Y.G.; Wen, L. Late Cenozoic trans-tensional fault belt discovered on the boundary of the Await Sag in the northwestern Tarin Basin. Int. J. Earth Sci. (Geol. Rundsch.) 2015, 104, 1253–1265. [Google Scholar] [CrossRef]
- Wu, C.Y. Late Quaternary Activity of the East-Northeastern Trending Faults in the Southwestern Tianshan and Their Role in the Tectonic Deformation of the Tianshan Mountains. Ph.D. Thesis, Institute of Geology, China Earthquake Administration, Beijing, China, 2016. [Google Scholar]
- Bai, Z.K.; Lu, X.X.; Song, Z.X.; Qiu, H.J.; Zhou, X.G.; Gao, Y.J.; Qi, Y.M.; Zhu, L.C.; Fu, X.T.; Zhou, Y.Y. Characteristics of boundary fault systems and its hydrocarbon controlling on hydrocarbon accumulation in Awati Sag, Tarim Basin, China. China Geol. 2019, 2, 94–107. [Google Scholar] [CrossRef]
- Li, Y.J.; Sun, L.D.; Yang, H.J.; Zhang, G.Y.; Qi, Y.M.; Sang, H.; Wang, Y.R.; Liu, Y.L.; Zhang, Q.; Wen, L. The Late Cenozoic tensor-shear fault zones around Awati Sag, NW Tarim Basin. Chin. J. Geol. 2013, 48, 109–123, (In Chinese, with English Abstract). [Google Scholar]
- McArthur, J.M.; Banerjee, D.M.; Hudson-Edwards, K.A.; Mishra, R.; Purohit, R.; Ravenscroft, P.; Cronin, A.; Howarth, R.J.; Chatterjee, A.; Talukder, T.; et al. Natural organic matter in sedimentary basins and its relation to arsenic in anoxic groundwater: The example of West Bengal and its worldwide implications. Appl. Geochem. 2004, 19, 1255–1293. [Google Scholar] [CrossRef]


| IDX | Tomur River | Tailan River | Ateaoyinake River | Muzhaerte River | Events | ||||
|---|---|---|---|---|---|---|---|---|---|
| Stage (ka BP) | GSS | Stage (ka BP) | GSS | Stage (ka BP) | GSS | Stage (ka BP) | GSS | ||
| 1 | 1.35–1.8 | I | 1.5–1.6 | I | 1.6–1.7 | I | LIA | ||
| 2 | <8 | II | 6.3 | II | 7.3 ± 0.8 (OSL) | I | II | NG | |
| 3 | 12.4, 13.0 | III (Inside) | 12.3 ± 1.2 (OSL) | II (Inside) | YD | ||||
| 4 | 20.1 ± 1.5, 18.7 ± 1.3, 20.8 ± 1.7 | III | 16.2, 4.1, 6.9, 16.8, 17.7, 21.7 | III (Outside) | 15.0, 18.3, 21.5, 27.2, 28.7 | II (Outside) | 13.6, 24.5, 25.3 | III (Band One) | LGM (MIS2) |
| 5 | 46.5 ± 4.7, 51.3 ± 5.1, 54.4 ± 5.4 | III | 39.5, 40.4 | III (Band two) | MIS3b | ||||
| 6 | 56.1 ± 5.6, 64.4 ± 6.4 | IV | 64.2, 71.7 | III (Band three) | MIS4 | ||||
| 7 | 134.4 ± 13 | IV | 143.6, 147.6 | IV | 155.8 ± 15.6, 234.8 ± 23.5 | V | 208.1 | IV | MIS6 |
| 8 | 418.9 ± 40 440.6 ± 42 | V | V | 453 ± 45.3 | VI | MIS12 | |||
| IDX | Stage (ka BP) | Stable-Erosive Cycles | Sediment-Erosive Rate (m/ka) | Terraces |
|---|---|---|---|---|
| 1 | 10–20 | Stable period | 0.7 | I |
| 2 | 20–30 | Erosive period (submaximum) | 3.3 | II |
| 3 | 30–40 | Stable period | 0.6 | |
| 4 | 40–60 | Erosive period | 1 | III |
| 5 | 60–70 | Stable period | 0.8 | |
| 6 | 70–80 | Erosive period (maximum) | 8.2 | IV |
| 7 | 80–100 | Stable period | 1.3 |
| Parameter | Gravel-Cobble or Gravel | Sand Gravel | Sand | Clay |
|---|---|---|---|---|
| Size | Vary greatly, more than 2 mm | Vary greatly, 0.25–2 mm or more | Coarse sand 1–2 mm, medium sand 0.5–1 mm, fine sand 0.2–0.5 mm | Less than 0.05 mm, powder form |
| Rounding and sorting | General, local better | Middle | well | |
| Sedimentary environment | Diluvial fan, palaeochannel, moraine, etc. | Alluvial–diluvial fan, palaeochannel, etc. | palaeochannel, floodplains, oxbow lakes, etc. | Alluvial plains, lakes, etc. |
| RT | Vary greatly, 30–100 Ω.m | Vary greatly, 30–100 Ω.m | 10–50 Ω.m | 10–30 Ω.m |
| SP | General negative anomaly | General negative anomaly | Generally negative anomaly, occasionally positive anomaly | Very little change |
| Porosity | 30% | 30% | 40% | 50% |
| Hydraulic conductivity | 25 m·d−1–42 m·d−1 | 25 m·d−1–30 m·d−1 | 2 m·d−1–25 m·d−1 | Aquitard |
| Curve shape | Medium to high anomaly amplitude, funnel shape or box shape | Medium to high anomaly amplitude, box or bell shaped | Abnormal obvious, regular, bell, finger and tooth shape | Medium amplitude, low RT value, mostly left convex shape |
| IDX | Sedimentary | Major LC | PS Range (Avg.) μm | Cu | RT Curve Shape | Sedimentary Faces | Sedimentary Microfacies | |
|---|---|---|---|---|---|---|---|---|
| AB04 | I (0–100 m) | 0–83 m | sand + gravel (>95%) | 442–468 (455) | 5–22 (14) | box, finger shape | fluvial faces | riverbed |
| 83–100 m | silt + sand (90%) | 6–496 (129) | 5–14 (8) | flood plain | ||||
| II (100–111 m) | sand + gravel (80%) | 9–496 (334) | 7–21 (16) | tooth shape | diluvial fan facies | fan-root | ||
| III (111–123 m) | silt + sand (93%) | 9–340 (174) | 2–7 (4) | left convex shape | fluvio-lacustrine facies | low-lying land | ||
| IV (123–150 m) | sand + gravel (>95%) | 496–577 (536) | 20–22 (21) | funnel shape | diluvial fan facies | fan-root | ||
| AB06 | I (0–14 m) | silt + sand (>95%) | 5–268 (94) | 2–15 (9) | fluvio-lacustrine facies | |||
| II (14–123 m) | silt + sand (>95%) | 6–268 (149) | 8–15 (6) | bell shape | fluvial faces | riverbed or flood plain | ||
| III (123–125.4 m) | clay + silt (>95%) | 5–6 (5.5) | 6–10 (8) | left convex shape | lacustrine facies | low-lying land | ||
| IV (125.4–168.1 m) | silt + sand (>95%) | 6–268 (163) | 2–8 (4.8) | box shape | fluvial faces | |||
| V (168.1–188.6 m) | silt + sand (91%) | 6–268 (129) | 2–15 (6.5) | tooth shape | fluvio-lacustrine facies | |||
| VI (188.6–196.1 m) | clay + silt (>95%) | 8–94 (51) | 4–15 (9.6) | left convex shape | lacustrine facies | shallow lake | ||
| VII (196.1–234.1 m) | silt + sand (93%) | 8–268 (181) | 2–15 (6.6) | box shape | fluvial faces | flood plain | ||
| VIII (234.1–250.2 m) | silt + sand (89%) | 8–268 (123) | 2–15 (7.3) | tooth shape | fluvio-lacustrine facies | |||
| Boreholes | Evolution Stages | Depth (m) | Interval Ages (ka BP) | Climate Change |
|---|---|---|---|---|
| AB04 | I | 0–83.5 | 0–13 | warm-dry |
| II | 83.5–100.2 | 13–27 | cold-dry | |
| III | 100.2–111.2 | 27–40 | warm-wet | |
| IV | 111.2–123.2 | 40–60 | cold-wet | |
| V | 123.2–150.6 | 60–80 | warm-wet | |
| AB06 | I | 0–13.8 | 0–10 | warm-dry |
| II | 13.8–101 | 10–27 | cold-dry | |
| III | 101–123 | 27–40 | warm-wet | |
| IV | 123–139 | 40–60 | cold-wet | |
| V | 139–168.1 | 60–100 | warm-wet | |
| VI | 168.1–196.1 | 100–235 | cold-wet | |
| VII | 196.1–250.2 | 235–450 | warm-wet |
|
Evolution Stages | Height of the Lake Surface | Sporo Pollen Assemblage | Particle Size |
Interval Ages
(ka BP) |
Climate
Change |
|---|---|---|---|---|---|
| I | low | Ephedra, Artemisia, Chenopodium mainly | decrease | 0–0.3 | warm-dry |
| II | high | Chenopodium, Artemisia, Ephedra, Gramineae mainly | increase | 0.3–0.8 | warmer-drier |
| III | low | Chenopodium and Artemisia mainly | decrease | 0.8–1.3 | warm-dry |
| IV | Artemisia, Chenopodium mainly | increase | 1.3–2.7 | cold-dry |
Disclaimer/Publisher’s Note: The statements, opinions and data contained in all publications are solely those of the individual author(s) and contributor(s) and not of MDPI and/or the editor(s). MDPI and/or the editor(s) disclaim responsibility for any injury to people or property resulting from any ideas, methods, instructions or products referred to in the content. |
© 2023 by the authors. Licensee MDPI, Basel, Switzerland. This article is an open access article distributed under the terms and conditions of the Creative Commons Attribution (CC BY) license (https://creativecommons.org/licenses/by/4.0/).
Share and Cite
Su, H.; Deng, Y.; Nai, W.; Zhang, R.; Huang, J.; Li, P.; Yang, H.; Chen, L.; Wang, N. Evolution of the Groundwater Flow System since the Last Glacial Maximum in the Aksu River Basin (Northwest China). Water 2023, 15, 3459. https://doi.org/10.3390/w15193459
Su H, Deng Y, Nai W, Zhang R, Huang J, Li P, Yang H, Chen L, Wang N. Evolution of the Groundwater Flow System since the Last Glacial Maximum in the Aksu River Basin (Northwest China). Water. 2023; 15(19):3459. https://doi.org/10.3390/w15193459
Chicago/Turabian StyleSu, Hu, Yinger Deng, Weihua Nai, Rui Zhang, Jihan Huang, Pengjie Li, Hongkun Yang, Lin Chen, and Ning Wang. 2023. "Evolution of the Groundwater Flow System since the Last Glacial Maximum in the Aksu River Basin (Northwest China)" Water 15, no. 19: 3459. https://doi.org/10.3390/w15193459