Article

Exploration for Platinum-Group Minerals in Till: A New Approach to the Recovery, Counting, Mineral Identification and Chemical Characterization

IOS Services Géoscientifiques Inc., 1319 Boulevard Saint-Paul, Chicoutimi, QC G7J 3Y2, Canada
*
Author to whom correspondence should be addressed.
Minerals 2021, 11(3), 264; https://doi.org/10.3390/min11030264
Submission received: 4 February 2021 / Revised: 26 February 2021 / Accepted: 27 February 2021 / Published: 4 March 2021

Abstract

:
The discovery of new mineral deposits contributes to the sustainable mineral industrial development, which is essential to satisfy global resource demands. The exploration for new mineral resources is challenging in Canada since its vast lands are mostly covered by a thick layer of Quaternary sediments that obscure bedrock geology. In the course of the recent decades, indicator minerals recovered from till heavy mineral concentrates have been effectively used to prospect for a broad range of mineral deposits including diamond, gold, and base metals. However, these methods traditionally focus on (visual) investigation of the 0.25–2.0 mm grain-size fraction of unconsolidated sediments, whilst our observations emphasize on higher abundance, or sometimes unique occurrence of precious metal (Au, Ag, and platinum-group elements) minerals in the finer-grained fractions (<0.25 mm). This study aims to present the advantages of applying a mineral detection routine initially developed for gold grains counting and characterization, to platinum-group minerals in <50 µm till heavy mineral concentrates. This technique, which uses an automated scanning electron microscopy (SEM) equipped with an energy dispersive spectrometer, can provide quantitative mineralogical and semi-quantitative chemical data of heavy minerals of interest, simultaneously. This work presents the mineralogical and chemical characteristics, the grain size distribution, and the surface textures of 2664 discrete platinum-group mineral grains recovered from the processing of 5194 glacial sediment samples collected from different zones in the Canadian Shield (mostly Quebec and Ontario provinces). Fifty-eight different platinum-group mineral species have been identified to date, among which sperrylite (PtAs2) is by far the most abundant (n = 1488; 55.86%). Textural and mineral-chemical data suggest that detrital platinum-group minerals in the studied samples have been derived, at least in part, from Au-rich ore systems.

1. Introduction

Despite historically high mineral exploration spending over the past decades, there has been no corresponding increase in new discoveries [1]. The industry is facing a challenge in regard of resource renewal, and new exploration methods are needed, particularly for targeting ore deposits buried under glacial sediment and areas of transported cover that does not respond properly to geophysics, such as in vast areas of the subarctic zone (e.g., Alaska, Canada, Scandinavia, Siberia) [2]. In such environment, the glacial sediments, although perceived as a hindrance to exploration, led to development of methods capable of detecting the signal from the mineral deposits as they are eroded and dispersed in the sediments. Till geochemistry and indicator mineral methods have therefore been instrumental in discovering underlying mineral resources [3]. Dominantly used for gold [4] and diamond exploration [5,6,7], the technique of using the dispersion of minerals considered as footprints of metallogenic environment has recently expanded interest to other commodities including Ni-Cu-platinum-group element deposits [8,9,10,11].
Platinum, Pd, Rh, Ir, Ru, and Os, known as platinum-group elements (PGE), are used in a wide variety of industrial applications (vehicles catalysts, fertilizer synthesis, etc.) that are considered as strategic and critical worldwide [12]. Still, approximately 90 percent of PGE originates from South Africa and Russia and they are barely mined out in other industrialized countries [13]. This issue mostly relates to the difficulty of prospecting for this group of metals, notably due to their low abundance, mineralogical complexities, and lack of geophysical or geochemical signatures outside of nickel sulfide occurrences. Hence, the current work aims at presenting the results obtained over the course of the last five years of processing glacial sediment samples using an automated mineral sorting method capable to detect, analyze, and classify platinum-group minerals (PGM) from glacial sediments, and present the usefulness of this new approach for the exploration of PGE-bearing deposits.

1.1. Platinum-Group Elements (PGE) and Their Distribution

Platinum group elements have similar physical and chemical properties and occur closely related in nature. These metals are of the rarest elements occurring in the bulk Earth crust, and due to their highly siderophile nature, are mainly concentrated in the dense metallic core [14]. The PGE belong to Group VIII transition metals in the periodic table of elements with Fe, Co, and Ni. Thus, in natural systems they have the ability to be engaged in both metal-metal and covalent bonding to form solid solution with one another, or compounds with siderophiles (e.g., Fe), chalcogenides (e.g., S, Se, Te), or semi-metals (e.g., As, Sb, Te) [8,15]. In nature, these metals form PGE-dominated complexes and alloys, which are known as the platinum-group minerals (PGM), which constitute a very diverse group of minerals (>140 named discrete PGMs) [16].
In magmatic settings, in presence of sulfur or semi-metals (such as As) and due to instability of metallic Fe, the PGE behave as highly chalcophile instead of siderophile elements [16]. Thus, the PGE have high partition coefficients for sulfides in sulfur-saturated magmatic systems [17,18]. Hence, about 99% of the global PGE resources are hosted in magmatic sulfide deposits [19]. Thus, although geochemical characteristics of the PGE allow them to be involved in a great variety of geological processes, our insight into their distribution, and PGMs formation and diversity have mainly been developed by the study of magmatic systems, mostly large layered mafic-ultramafic intrusions (e.g., Bushveld, Stillwater, and Great Dyke complexes). In these, major PGE ore deposits are found as reef-type deposits [17,20], magmatic breccia type such as the Lac des Iles palladium deposit [20], and conduit-type deposits such as those in the Noril’sk-Talnakh area (Russia), which formed as a result of circulation and eruption of vast volume of mafic magma that formed the Siberian Trap Large Igneous Province [21]. Other magmatic deposit types having their importance for the study of the PGMs diversity and composition come from Uralian-Alaskan-type complexes and ophiolite complexes ([22] and references therein).
In contrast to the PGMs associated with magmatic systems, there is a poor understanding about the PGEs’ distribution and mobility during hydrothermal activities and how PGMs may physiochemically modify under low temperature conditions and/or in the surface secondary environment. This is important because the PGMs concentration in placer deposits principally originates from low temperature degradation of large mafic layered intrusions, ophiolitic and/or Uralian-Alaskan-type complexes [23].
Different studies suggest that PGMs composed of native metals and alloys do not typically undergo phase transitions within temperature and/or pressure ranges of geological significance, and they also tend to be relatively resistant to geochemical processes during which lithophile elements can be fractionated and modified in silicate and non-silicate rocks [24,25,26]. Nevertheless, Hanley [27] discussed the alteration of PGM assemblages precipitated from high temperature liquids at lower temperatures during metamorphism, hydrothermal processes, and/or surficial weathering.

1.2. Exploration for Platinum-Group Minerals

For a long time, placer deposits were the only PGM sources, but currently their contribution to the global resources is less than 4% [28]. The discovery of some primary PGE deposits such as the Merensky Reef of the Bushveld Complex (South Africa), the JM Reef of the Stillwater Complex (MT, USA), the Main Sulfide Zone of the Great Dyke (Zimbabwe), the Noril’sk-Talnakh deposits (Russia), the Sudbury Igneous Complex (Canada), and the Lac des Iles Complex (Canada) has decreased the role of PGM placers as single PGE sources. However, the study of PGM assemblages in dispersion halos remains topical as a prospecting tool for both primary and placer PGE deposits [10]. Nowadays, indicator mineral methods are significantly used exploration tools for detecting a variety of ore deposit types including diamond, gold, Ni-Cu, PGE, U, porphyry Cu, massive sulfide, and tungsten deposits [3,29,30,31,32,33,34,35,36,37,38,39]. A great advantage of indicator mineral methods is their extremely low detection limits that enable tracing the dispersion of eroded mineral deposits in surficial glacial sediments, in which minerals contain a wealth of information in regard of the metallogenic environment they originate from.
Platinum-group minerals seem to be the best indicator for tracing their own deposits including magmatic deposits (e.g., Ni-Cu) and the less common hydrothermal and sedimentary deposit types ([13] and references therein). The abundance of indicator minerals such as Au and PGM in sediments depends on their contents in the primary source rocks/deposits, the degree of weathering of these sources, mechanisms of transport and dispersion of indicator minerals after liberation from host rocks/deposits, and their ability to resist against mechanical and/or chemical modifications (e.g., fluvial, glacial, fluvioglacial, aeolian) [8,40]. This also controls the efficiency of techniques used to concentrate and sort these minerals. These factors must be taken into account in every sampling plan [40].

1.3. Conventionnal Analytical Methods: MLA and QEMSCAN

Heavy mineral concentrates with the grain sizes <50 µm commonly contain fine-grained indicator minerals that either formed originally into minute crystals or were comminuted and abraded during transport. Most gold and PGM grains are silt-size and occur in the < 50 µm heavy mineral fractions [8,41,42]. Given the small nature of the grains, their diversity, and their typically metallic grey colors that confuse them with numerous other mineral species, preparing representative samples and/or samples suitable for optical examination and geochemical characterization of Au and PGMs using conventional analytical methods is neither time- nor cost-effective.
From developments in the 1970s [43], the use of automated scanning electron microscopy (SEM) such as MLA (mineral liberation analysis) and QEMSCAN (Quantitative Evaluation of Minerals by Scanning Electron Microscope) has enabled circumventing the difficulties associated with their visual sorting from the <250 µm fraction of heavy mineral concentrates (HMC) from samples. The advantages of applying these automated SEM-based techniques include: (1) efficiency and rapidity—energy dispersive (ED) spectra of 200,000 particles (median particle size of 30 µm) can be collected within 6 h [44]; (2) the detection of grains of low abundances (one grain compared to initial samples is equivalent to ppt level, required to detect such low abundance metals; (3) the possibility of identifying and using new indicator minerals not previously recognized; (4) data collection on certain physical properties of minerals such as grain size distribution, mineral liberation, and mineral association, which can contribute to provenance discrimination [45,46,47].
In spite of the aforementioned advantages, neither MLA nor QEMSCAN can provide quantitative chemical analysis, both using EDS spectrum matching and analytical proxy stored in a library. Thus, these techniques are fairly rigid in regard of which minerals they detect, and thus face challenges: (1) in identification of unexpected mineral species that their corresponding energy dispersive X-ray spectra do not already exist in the mineral reference library; (2) as typical formula of each mineral is used, compositional variation in minerals (e.g., Au in potarite, Ag and/or Pd enrichment in Au particles), which reflects characteristics of their source, may not be distinguished. Accordingly, MLA and QEMSCAN are limited for the characterization of PGMs; for instance, because these can form complex phase series with elemental substitutions (cooperite, braggite, and vysotskite), solid-solution alloys (e.g., Ir-rich osmium and Os-rich iridium) that cannot be differentiated by these techniques. As for gold, the characterization method must be able to estimate trace elements abundances (Te, Hg, Ag, Pd, Cu) considering their implications in provenance studies [48]. To overcome the given restrictions when dealing with HMC > 250 µm, complementary studies commonly consider such mineral identification using optical microscopy, and chemical and crystallographic analyses such as EPMA (electron probe micro-analyzer), LA-ICP-MS (laser ablation inductively coupled plasma mass spectrometry), and EBSD (electron backscatter diffraction). However, as mentioned earlier, these methods are not properly applicable to very fine mineral fractions because, even if these minerals can be located in the heavy mineral concentrate, they can hardly be manipulated and the grain size or inclusion- or alteration-free surface of the majority of these minerals would be smaller than the beam size used in LA-ICP-MS. Moreover, as MLA or QEMSCAN are not capable to scan more than about 40,000 grains per hour, analyzing a grain mount of <50 µm HMC may take numerous hours. Thus, such studies are commonly costly and are not affordable for most mineral exploration companies.
Another limitation with MLA or QEMSCAN applied to fine-grained fraction of HMC is that samples shall be mounted in epoxy and polished. Manufacturing and polishing a monolayer mineral mount is difficult, meaning that an excess of material is required to obtain a volume that can be cut and polished. It also means that the surface textures of the grains are removed and their outline/shape is affected. Many studies have shown that the surface textures of indicator minerals are diagnostic of transport media and physicochemical conditions of secondary environment in which detrital grains are deposited ([49] and references therein). Moreover, the shape and surface texture of grains, whether they are affected by erosion marks, is historically used to estimate the distance that the grains travelled from their source rocks [50].
Finally, the most underrated difficulty in using PGM as indicator mineral remains their intrinsic smallness. Platinum-group minerals rarely exceed 100 µm in diameter and, therefore, may not be efficiently recovered by conventional heavy mineral concentration techniques. Their size is more comparable to gold grains, the concentration and sorting of which require different techniques than those usually applied to indicator minerals. At such size, they are not efficiently recovered by gravimetric methods, either at shaking table or heavy liquids. Since the quantity of material that can be scanned by MLA or QEMSCAN is limited to a fraction of a gram (especially in precious metal minerals exploration program), more sophisticated concentration techniques are needed to achieve statistical representativeness [50].
In this regard, the current study circumvented these difficulties by introducing an approach based on a recent development on gold grain recovery (ARTGoldTM or Advanced Recovery Technique for gold grains) complemented with automated SEM-based technology. These developments overcome the aforementioned restrictions in recovery and characterization of indicator minerals, are fully applicable for the platinum-group minerals, and can be implemented as routine procedure in the course of regional gold exploration surveys. The current study investigates a database of 2664 PGM grains recovered from 5194 glacial sediments samples from 24 different surveys. The exact sampling locations of these projects are not disclosed to reserve the IOS Services Géoscientifiques (IOS-SG) clients’ rights and no issues relating to mineral exploration within these projects are to be discussed. As shown in Figure 1, most of the surveys are from various parts of the Superior Province, a major Archean craton of the Canadian Shield, dominantly in the Abitibi and James Bay areas. Still, two surveys are from the lower Proterozoic Cape Smith belt New-Québec Orogen, Nunavik region, two others are from the middle Proterozoic Grenville Province, and one is from the upper Paleozoic of the Appalachian (Figure 1). It must be noted that all these samples have originally been collected for gold exploration or regional assessment, and none was specifically for PGM sources.

2. Materials and Methods

The procedure used for the current study has been developed and implemented in the IOS-SG installations originally to commercially process glacial sediments for their gold grain contents. The procedure has been developed to automate the gold grain counting and systematize their concentration. At the onset of its use, the unexpected frequent occurrence of PGM in samples has been noted, and data about these were systematically collected. The large datasets generated afterwards is here investigated for (indicator) mineral (and surficial geochemical) exploration, geo-metallurgical and/or geo-environmental purposes.

2.1. Sample Preparation

Collecting 10 to 20 kg of sandy sediment and 20 to 40 kg of clay-rich sediment is usually recommended for Au and PGE heavy mineral surveys/exploration programs [8,52,53]. However, according to industry practice, glacial sediment samples submitted for gold grain assessments are typically of 10 kg or less. Upon reception at the laboratory, samples are registered and queued to be processed based on the ARTGoldTM protocol as follows. (1) Samples are soaked with a wetting agent and sieved in a mechanized vibrating screen stack to remove coarser (>1 mm) particles. Fine particles are decanted in a settling tank. (2) Gravimetric separation of wet sieved <1000 µm fraction proceeds with an in-house vibrating micro-corrugated sluice, or fluidized bed. A super-concentrate of 100 to 200 mg is typically obtained from 10 to 20 kg till sample using a single pass. (3) To assess the recoveries (quality control vs. quality assurance: QA/QC), tails of the fluidized bed are stored and reprocessed for about 10% of the sample population. (4) Magnetite and other ferromagnetic minerals are removed from the dried super-concentrate with a hand magnet.
The super-concentrates received in the micro-analysis laboratory are sieved with a disposable 50 µm woven polyester mesh. The material >50 µm is sent for visual examination under a research grade stereomicroscope for standard visual sorting (“picking”), whereas the material <50 µm is dusted on a 4 × 4 cm double sided carbon tape to form a monolayer of heavy mineral grains for automated scanning electron microscope routine.

2.2. Analytical Method

ARTGoldTM is originally an automated gold grain counting routine implemented on a SEM and based on the AZtec Feature platform (Oxford Instruments, OI, Abingdon, UK). Two instruments were used, a Zeiss EVO MA15 HD (Carl Zeiss AG, Oberkochen, Germany) with a LaB6 emitting source equipped with an OI X-Max 150 mm2 energy dispersive spectrometer (EDS-SDD) and a Zeiss Sigma 300 VP FEG-SEM (Carl Zeiss AG, Oberkochen, Germany) coupled with the OI Ultim-Max 170 mm2 detector. The method relies on backscattered images, which are acquired using multi-segments backscattered electron detector to discriminate grain density. The EDS analyses, trigged on minerals with an apparent atomic density in excess of 5 g/cc, are semi-quantitative with the current configuration, as they are conducted with a short counting time, a high working distance (11–12 mm), are standardless (using factory calibration) and are normalized to 100%. Analyses are performed under variable pressure mode (40 Pa) and with an accelerating voltage of 20 kV. Using partial pressure helps in regard to draining the electron, the principle being that nitrogen in the chamber is ionized by the electron beam, creating a channel of plasma that conducts the electron. However, the main reason is to avoid excessive outgassing of the carbon-tape substratum that causes distortion of the surface. Specimen current is monitored daily on the Zeiss EVO as it varies overtime due to filament wearing. It is adjusted to ensure maximum output count rate with the EDS, with less than 30% dead time. The current on the Sigma 300 VP is stable overtime and the need of adjustment is limited. The AZtec 4.2 software (OI, Abingdon, UK) is used to acquire the BSE images, to detect particles, to acquire EDS spectra, and for their deconvolution into chemical analyses. Nitrogen, present in the chamber under variable pressure mode, causes the diffusion of the electron beam, which then interacts with the material adjacent to the targeted area over a distance estimated to 100 μm radius. Thus, some elements from the substrate, such as carbon and chlorine, have been excluded from the analyses and the signal on the gold or PGM grains is typically be contaminated by the adjacent mineral phases. The analyses are thus normalized to 100% for the range of elements of interest, excluding contaminants.
A mosaic of 520 to 560 backscattered electron (BSE) images of 1.92 mm × 1.44 mm (1024 × 768 pixels for a resolution of 1.88 μm/pixel) are acquired per sample mounts to locate and then identify heavy mineral phases (e.g., gold, bismuthides and tellurides, PGMs, scheelite, galena, etc.) among more than one million grain of the 0–50 μm size fraction on a single 3.5 cm diameter circular mounts.
Minerals with a density in excess of 5 g/cc are discriminated given their relatively high brightness correlating with their high average atomic number. The brightness threshold is set to exclude monazite, as this mineral is ubiquitous in the heavy mineral fraction and would hinder the speed of the acquisition process. Most minerals of interest have a density higher than monazite, and the effectiveness of recovery of minerals with a lower density on the fluidized bed was not investigated. Semi-quantitative chemical microanalyses (300,000 counts, or approximately 1–2 s) are automatically acquired in the center of every detected particle. Depending on how many very-dense grains exist in a super-concentrate that need an EDS analysis, scanning a 4 cm × 4 cm sample typically takes about an hour. Minerals are classified based on their chemical composition using a classification tree, and those containing Au, Ag, or PGE are automatically selected for further analyses. In this step, a high-resolution BSE image of 144 μm × 108 μm (1024 × 768 pixels for a resolution of 0.14 μm/pixel) is acquired and a point analysis is performed with 500,000 effective counts for every precious metal bearing grains.
Platinum-group minerals are then identified based on their chemical compositions and using the K-means algorithm [54]. To this end, the chemistry of unknown minerals is compared to an evolving large in-house dataset built over time by compiling literature data of Au-, Ag-, and PGE-bearing minerals. The classifier suggests the two most probable mineral names for each mineral composition and report the classification accuracy. The accuracy is generally above 95%, except in few cases where the composition does not match the existing entries of the training dataset, or where chemical substitutions create complications (e.g., Se-rich or Cu-rich braggite), or near the limits between phases belonging to mineral series (e.g., laurite-erlichmanite, cooperite-braggite-vysotskite). In these latter cases, a specialist clarifies and fixes the mineral identification using graph projections and calculations.
At the end of every ARTGoldTM project, a mosaic of backscatter electron (BSE) images of all identified and analyzed precious metal minerals (PMM) is created to provide an overview for further sediment provenance discrimination. The mosaic depicted in Figure 2 illustrates 166 PMM grains (excluding gold grains) found in a single project sampled in the Nunavik region (Nunavik, QC, Canada). The PMMs are sorted based on their grain sizes. It is worth mentioning that, in addition to Au and PGMs, Ag-bearing minerals comprise another group of PMM detected and analyzed by the routine. Native Ag (Figure 5a), acanthite (Ag2S; Figure 5b), hessite (Ag2Te; Figure 5c), and matildite (AgBiS2) are the common Ag-bearing minerals detected, though Ag is mostly concentrated in Au-Ag alloys in the studied samples.

3. Results

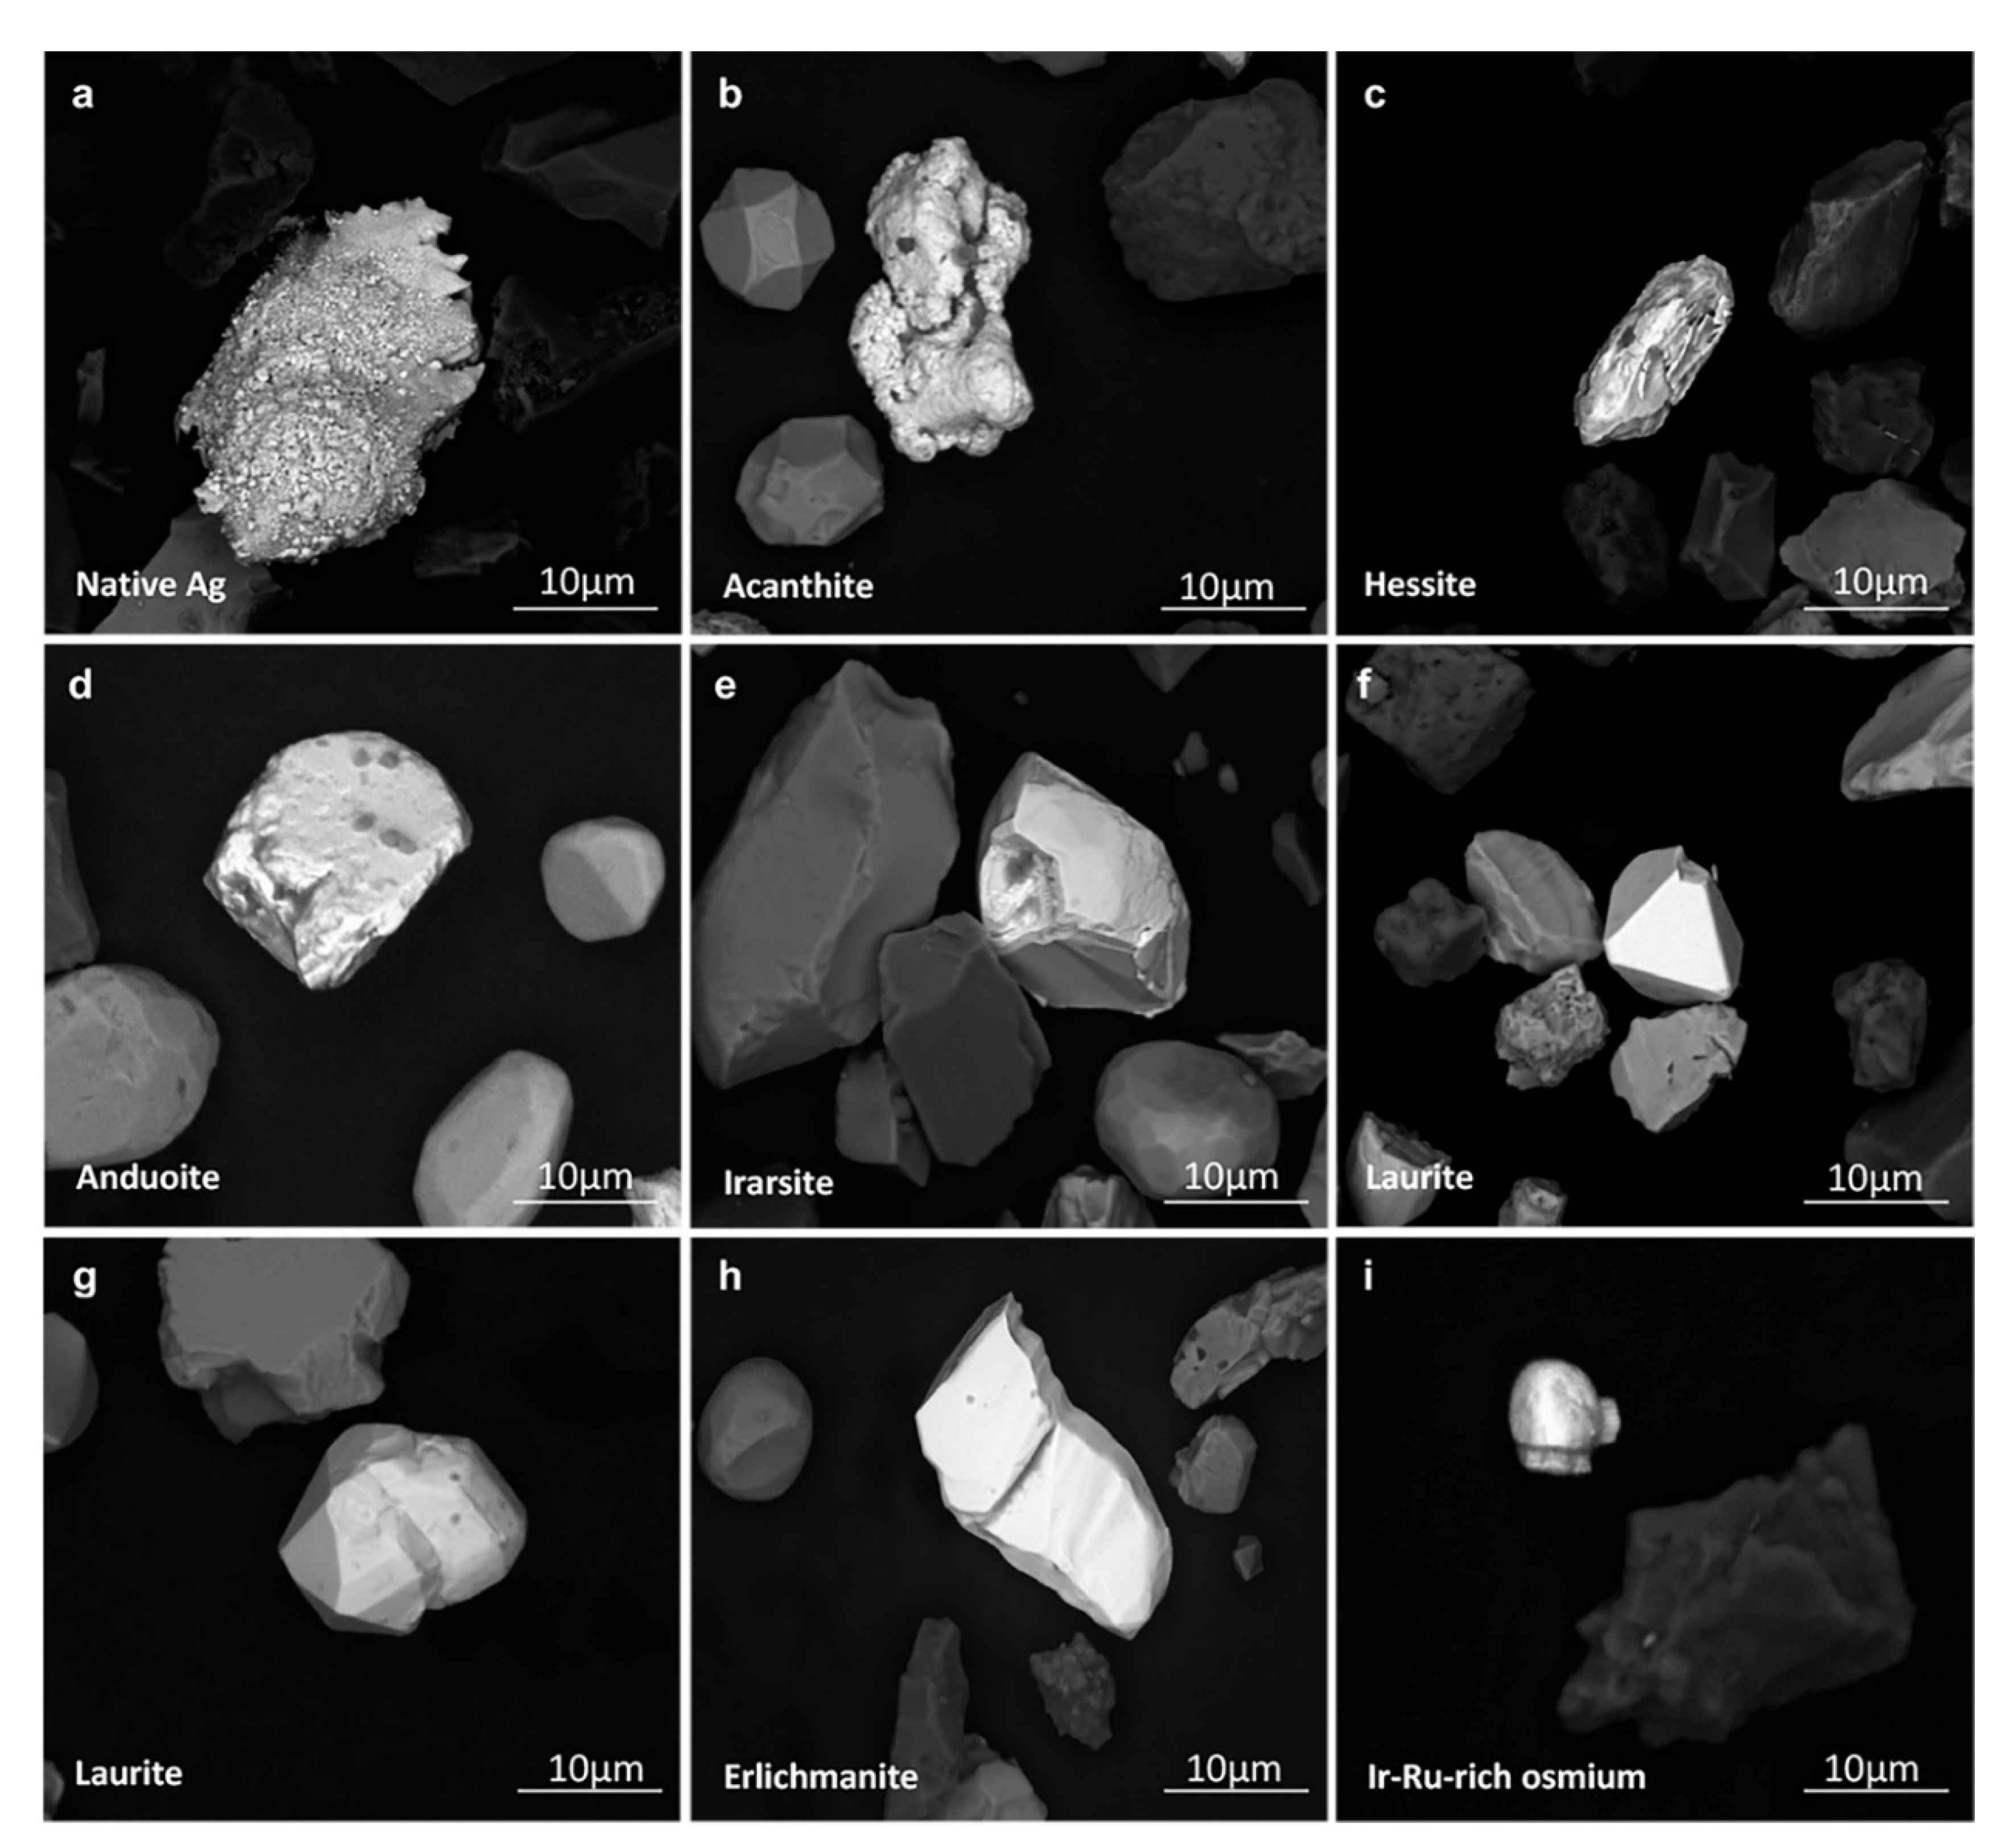
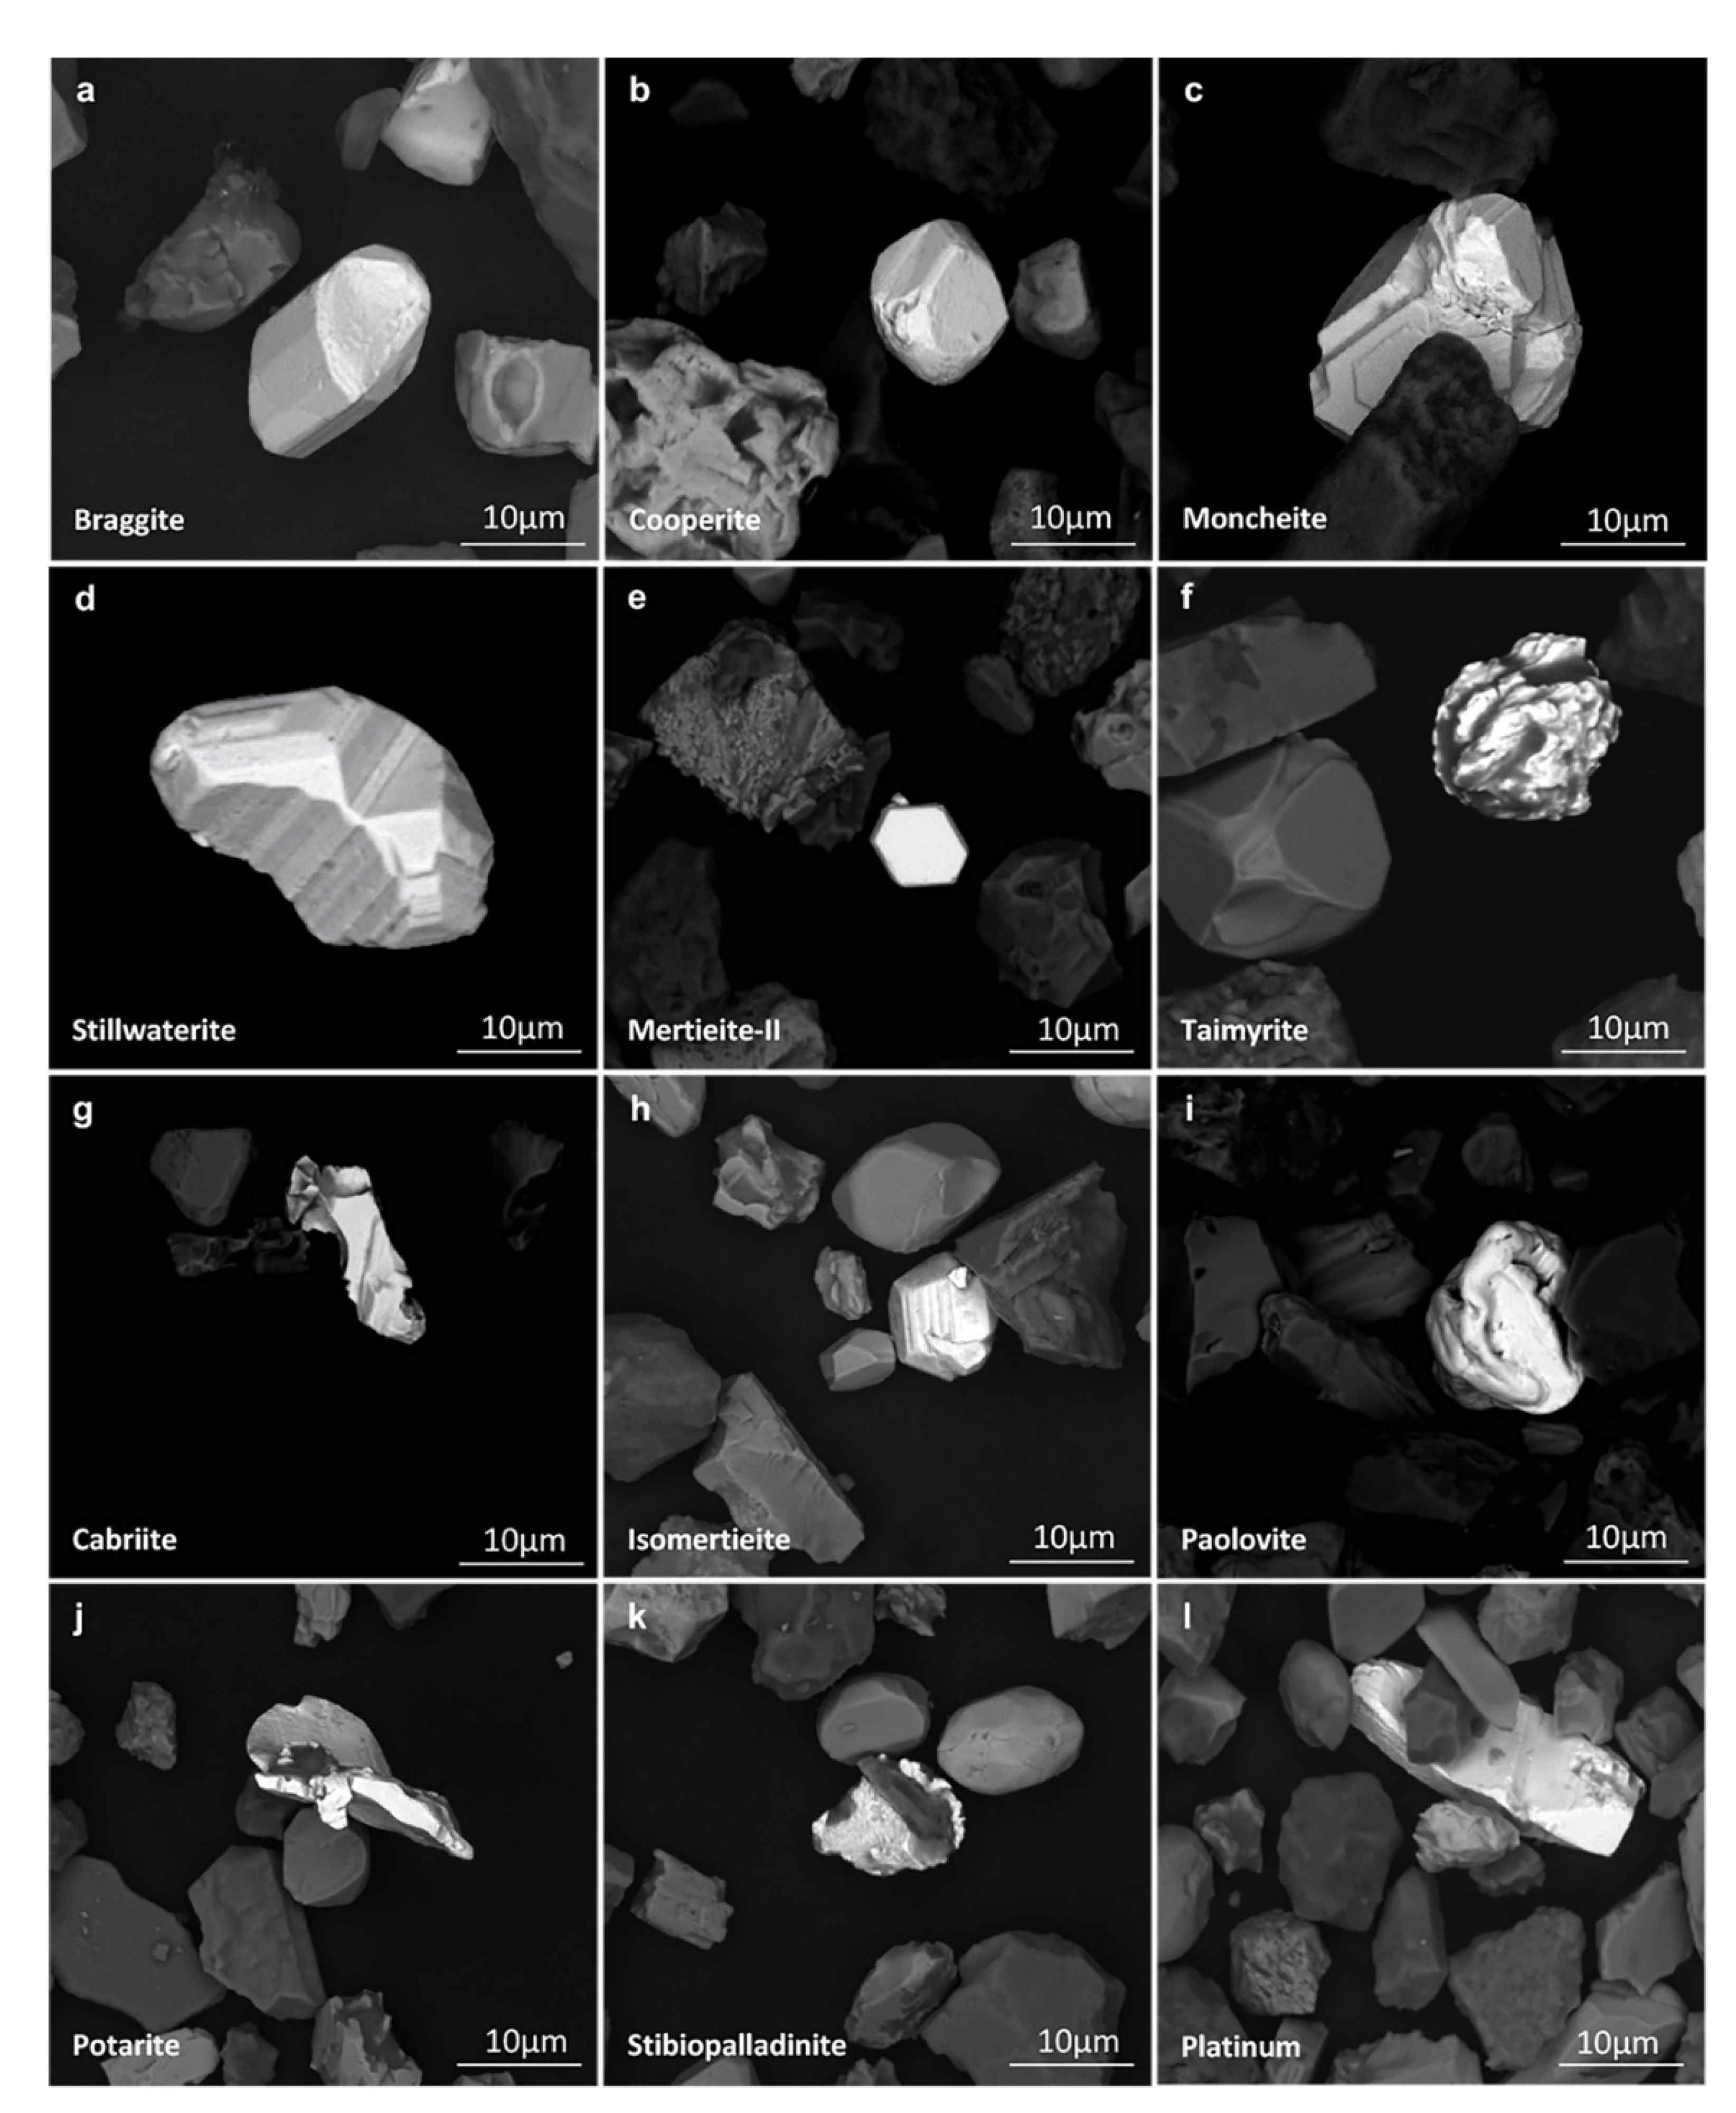
3.1. Distribution of Various Platinum-Group Mineral Species in Till

A total of 2664 discrete PGM grains have been identified and analyzed in heavy mineral super-concentrates obtained from processing of till samples. The diversity and distribution of PGMs found in the studied samples are illustrated in Figure 3 and Figure 4, and selected backscatter electron (BSE) images of relatively abundant PGE-bearing minerals are displayed in Figure 5 and Figure 6. As a result, the recovered and analyzed PGMs (on average one PGM grain per two till samples) are composed of 58 different mineral species among which sperrylite (PtAs2) is by far the most abundant (Figure 3). The sperrylite grains (n = 1488) represent 55.86% of the total population. The Pt + Pd sulfides, including cooperite (PtS) and braggite [(Pt,Pd,Ni)S], are frequently observed (n = 240, 9.01%; and n = 227, 8.52%, respectively; Figure 6a,b). In contrast, the Pd sulfide vysotskite is much less abundant as only 11 grains have been identified (0.4%). In Figure 3, the category identified as Pt includes native platinum grains but also diverse Pt-dominated alloys. Iron is commonly alloyed with platinum, but since Fe is excluded from the analyses (due to secondary fluorescence), isoferroplatinum (Pt3Fe), tetraferroplatinum (PtFe), tulameenite (Pt2CuFe), and ferronickelplatinum (Pt2FeNi) could not be differentiated and, if present, they have been included in the Pt category. In addition, PGM species whose individual abundance is <0.5% (less than 13 grains) of the population are grouped as “Others” in Figure 3. This group consists of a variety of rare PGM species (Table 1) including taimyrite (Figure 6f), cabriite (Figure 6g), paolovite (Figure 6i), anduoite (Figure 5d), atheneite, vysotskite, hollingworthite, tatyanaite, vincentite, mitrofanovite, hongshiite (PtCu; may be tulameenite but Fe is excluded from the analysis), palladium-dominated alloys, palladian weishanite (here referred to (Pd(±Pt)AuHg)), osarsite, stannopalladinite, naldretteite, niggliite, omeiite, ruarsite, zvyagintsevite, arsenopalladinite, chrisstanleyite, iridarsenite, palarstanide, palladseite, and rustenburgite. There are also some mineral species that have only been detected as single grains (equivalent of ppt level) including kotulskite, merenskyite, atokite, kingstonite, padmaite, palladobismutharsenide, plumbopalladinite, sudovikovite, telargpalite, and ungavaite. Backscatter electron images of PGMs in Figure 5 and Figure 6 exemplify how PGMs in surficial sediment differ in grain sizes, shapes, and textures (e.g., free or interlocked minerals; euhedral, fractured, or with abraded edges).
Based on the geochemical behavior of the PGE, many studies have shown that Os, Ir, and Ru (the iridium-like platinum-group elements, IPGE) behave as compatible elements during partial melting and fractional crystallization, whereas Rh, Pt, and Pd (the palladium-like platinum-group elements, PPGE) behave as incompatible elements [55,56,57]. Thus, the identified grains have been subdivided into two groups of PGMs according to their composition: the PPGE PGMs and the IPGE PGMs (Figure 4a). The PPGE PGMs are considerably more abundant (93.66%, n = 2495) than the IPGE PGMs which account for 6.34% (n = 169) of the total PGMs identified. The PGMs in which Pt is the dominant metal represent 76.20% (n = 2030) of the total population, whilst Pd-rich minerals correspond to 16.74% (n = 446) of the PGMs. As a result, Pt- and Pd-rich minerals clearly dominate the PGM population (representing nearly 93%). In contrast, Rh-rich PGMs are rarely abundant constituting 0.71% (n = 19) of the identified grains (Figure 4b). Within the IPGE PGMs population, IPGE alloys are identified (Figure 3) and include Os-dominated, Ir- dominated and Ru-dominated alloys as well as rutheniridosmine. As shown in Figure 4b, Os is the dominant metal in 2.40% (n = 64) of the PGMs closely followed by Ru (2.06%, n = 55) and Ir (1.88%, n = 50). Anduoite (Figure 5d), irarsite (Figure 5e), laurite (Figure 5f,g), erlichmanite (Figure 5h), and Ir-Ru-rich osmium (Figure 5i) are IPGE PGM species variably abundant in the studied till samples (Figure 3; Table 1).

3.2. Chemical Signature of Abundant Platinum-Group Minerals
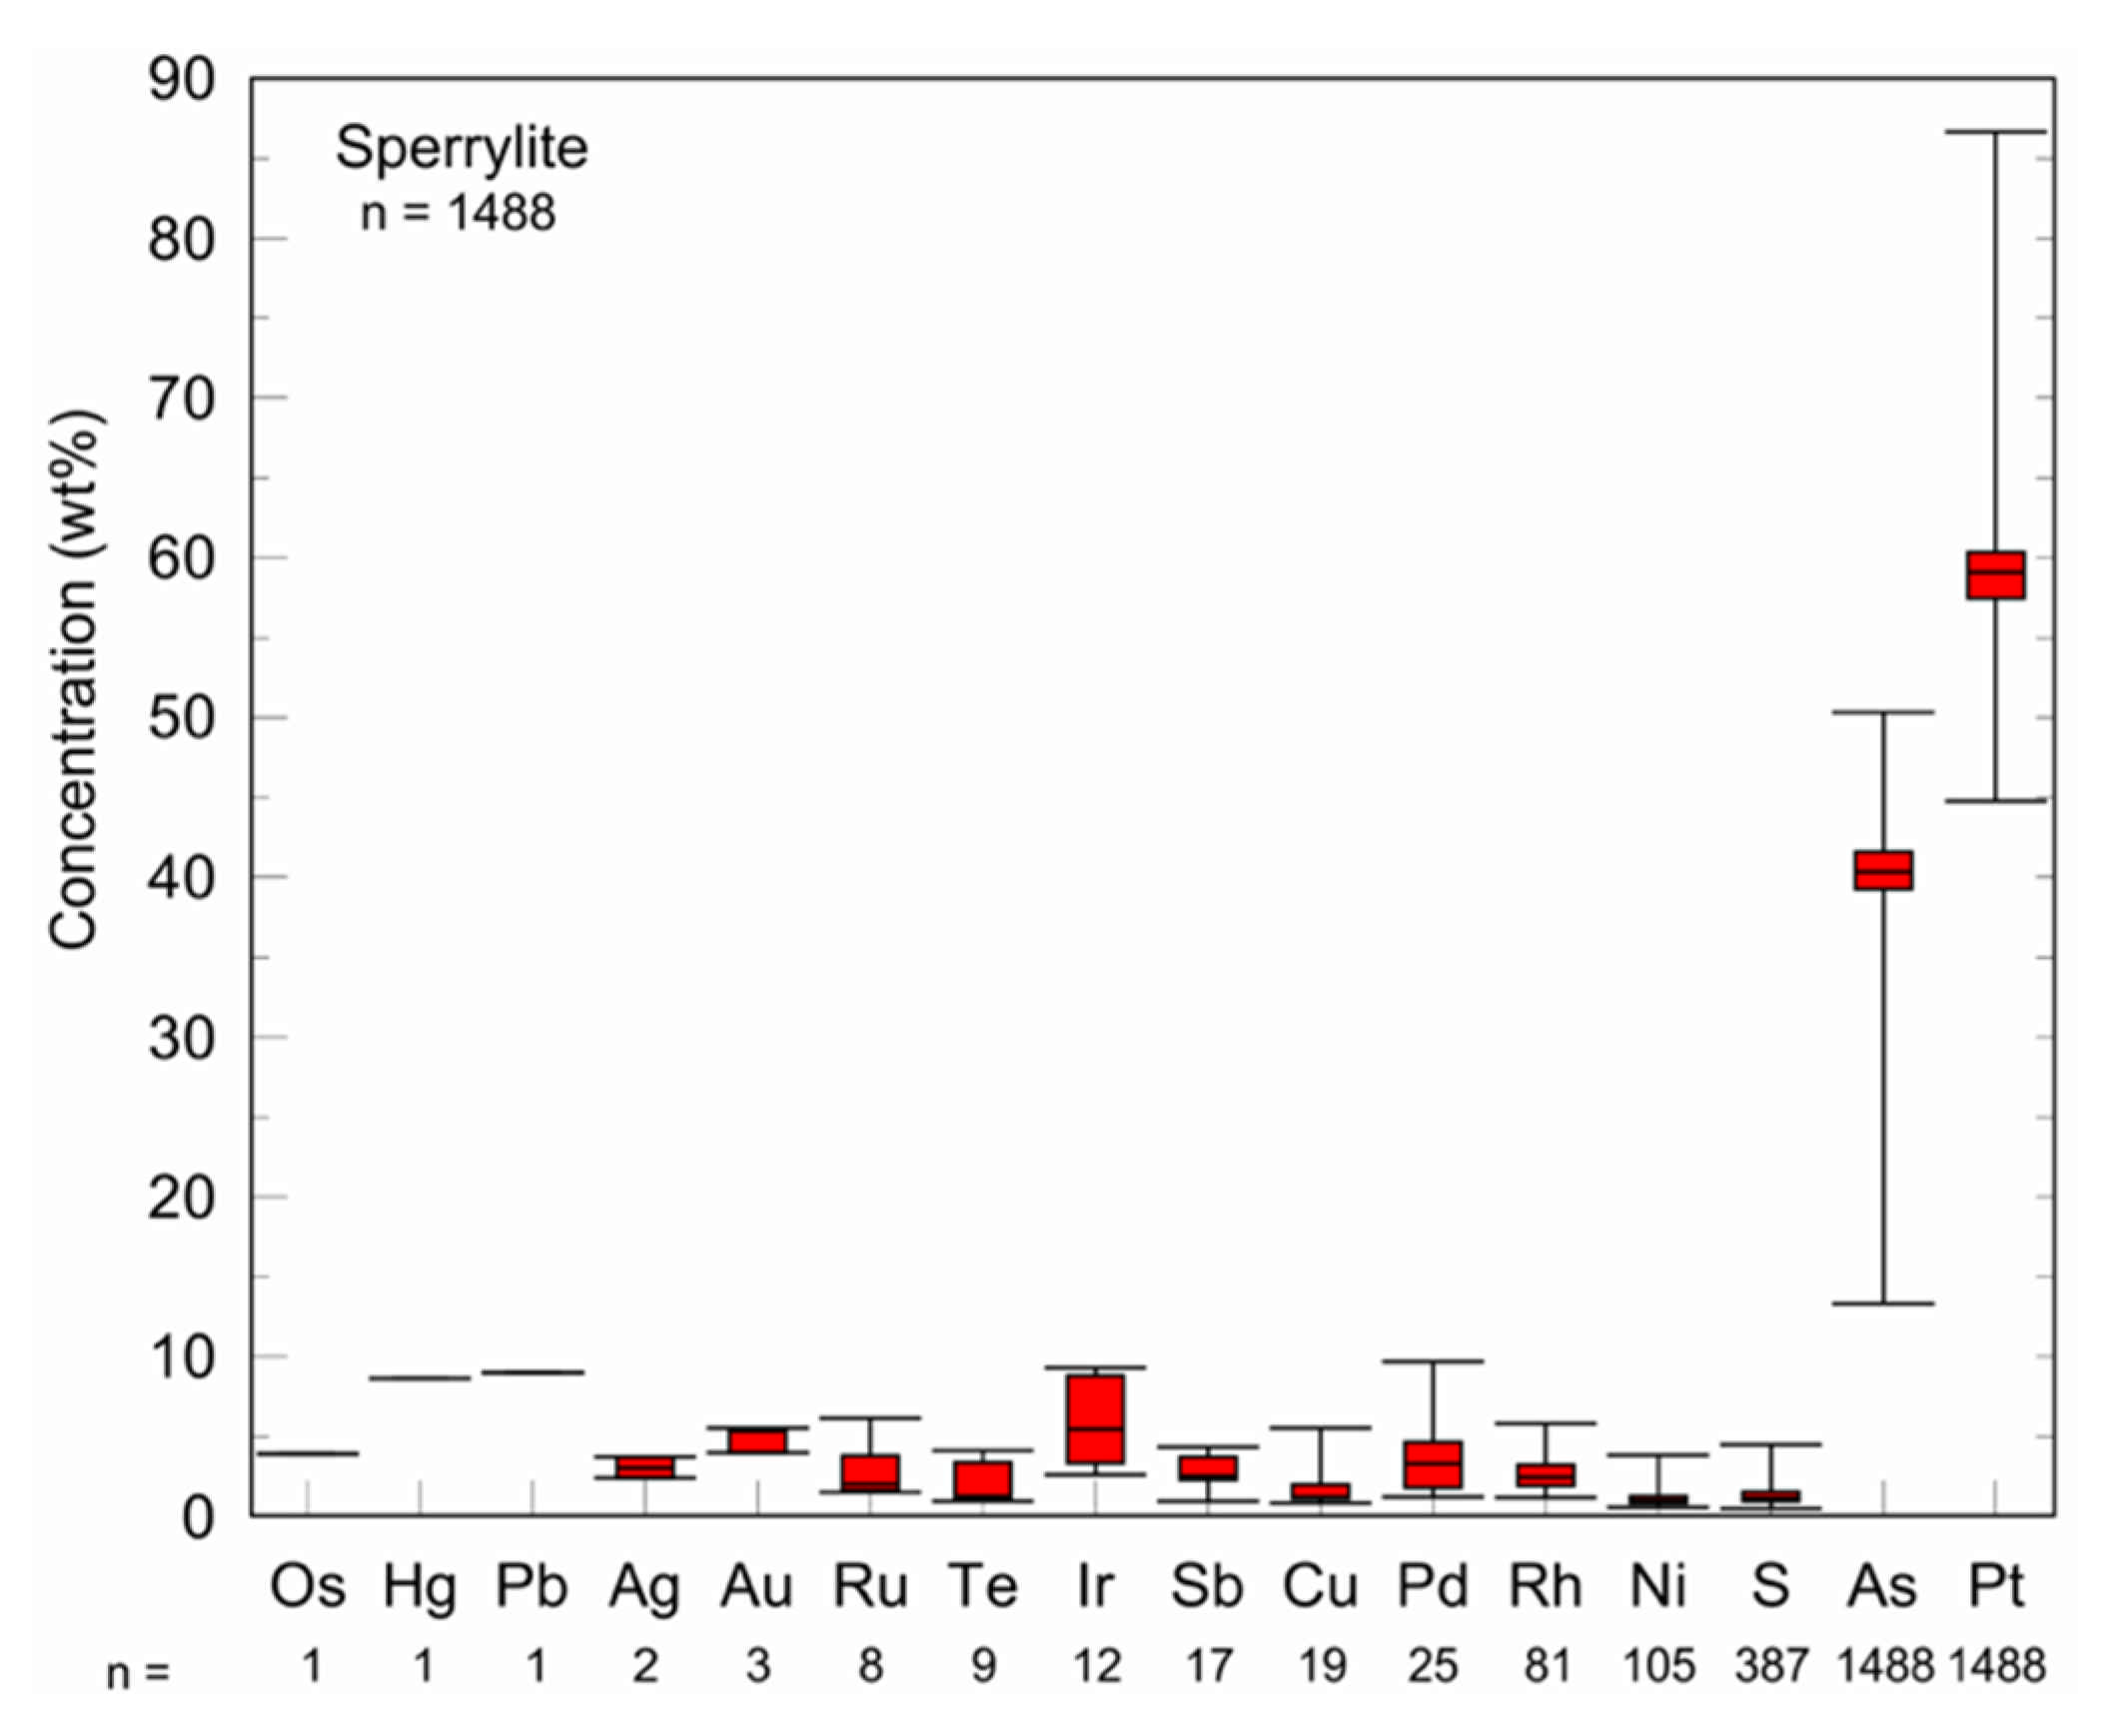
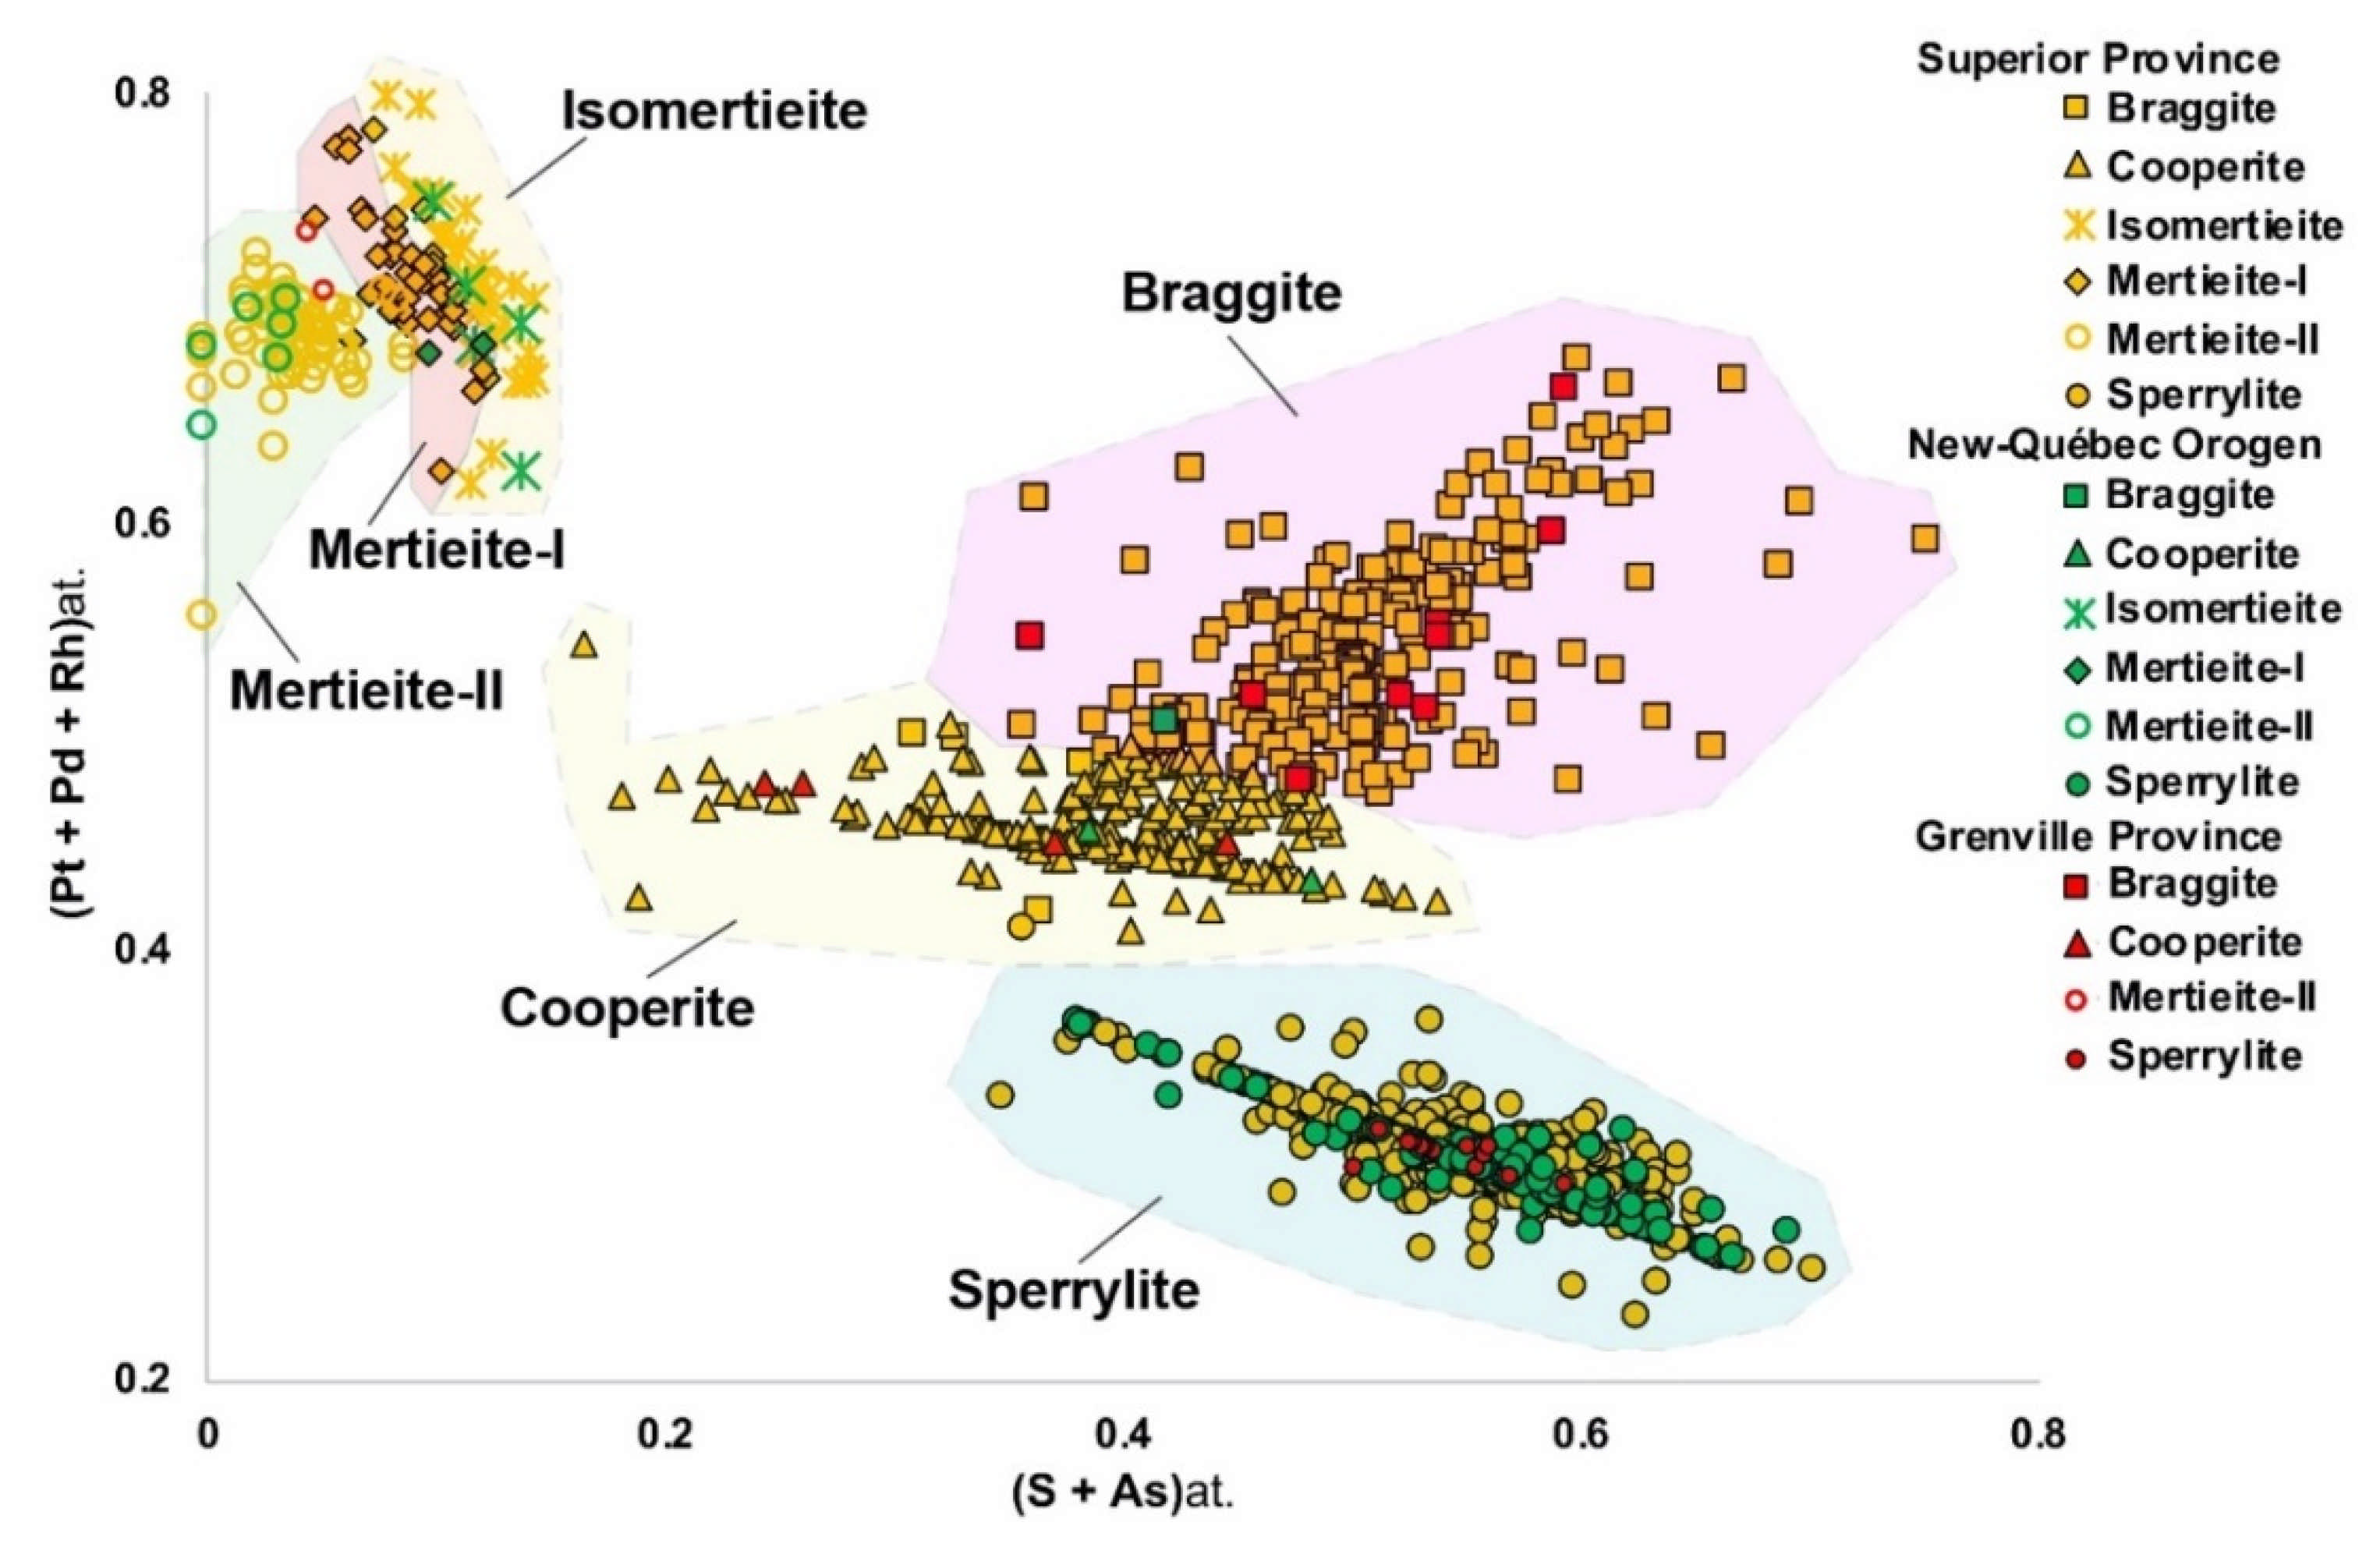
3.2.1. Sperrylite

Sperrylite corresponds to more than half of the PGM population recovered from the studied till samples. The box and whisker plots in Figure 7 show the range of variation in the composition of Pt and As and their substituting elements in 1488 analyzed sperrylite grains, including some As-poor and Pt-rich grains probably representing altered grains. These analyses are semi-quantitative (standardless), thus, they have been normalized to 100% and with a detection limit in the order of 1% for most metals. As a result, the individual concentration of the substituting elements does not exceed 10 wt% (Figure 7). However, some of these elements are only measured in a few grains (1 ≥ Os, Hg, Pb, Ag, Au, Ru, Te, Ir, Sb, Cu, and Pd ≤ 25), whereas sperrylite contains Rh (81 grains), Ni (105 grains), and S (387 grains) more often. The proportions of As and Pt are not necessarily stoichiometric and may vary over a wide range, though 50% of the grains contain ≤ 40 wt% As, while the median concentration for Pt in sperrylite is 59 wt%. An average of 4.9 wt% Au is also measured in 3 sperrylite grains (Figure 7).

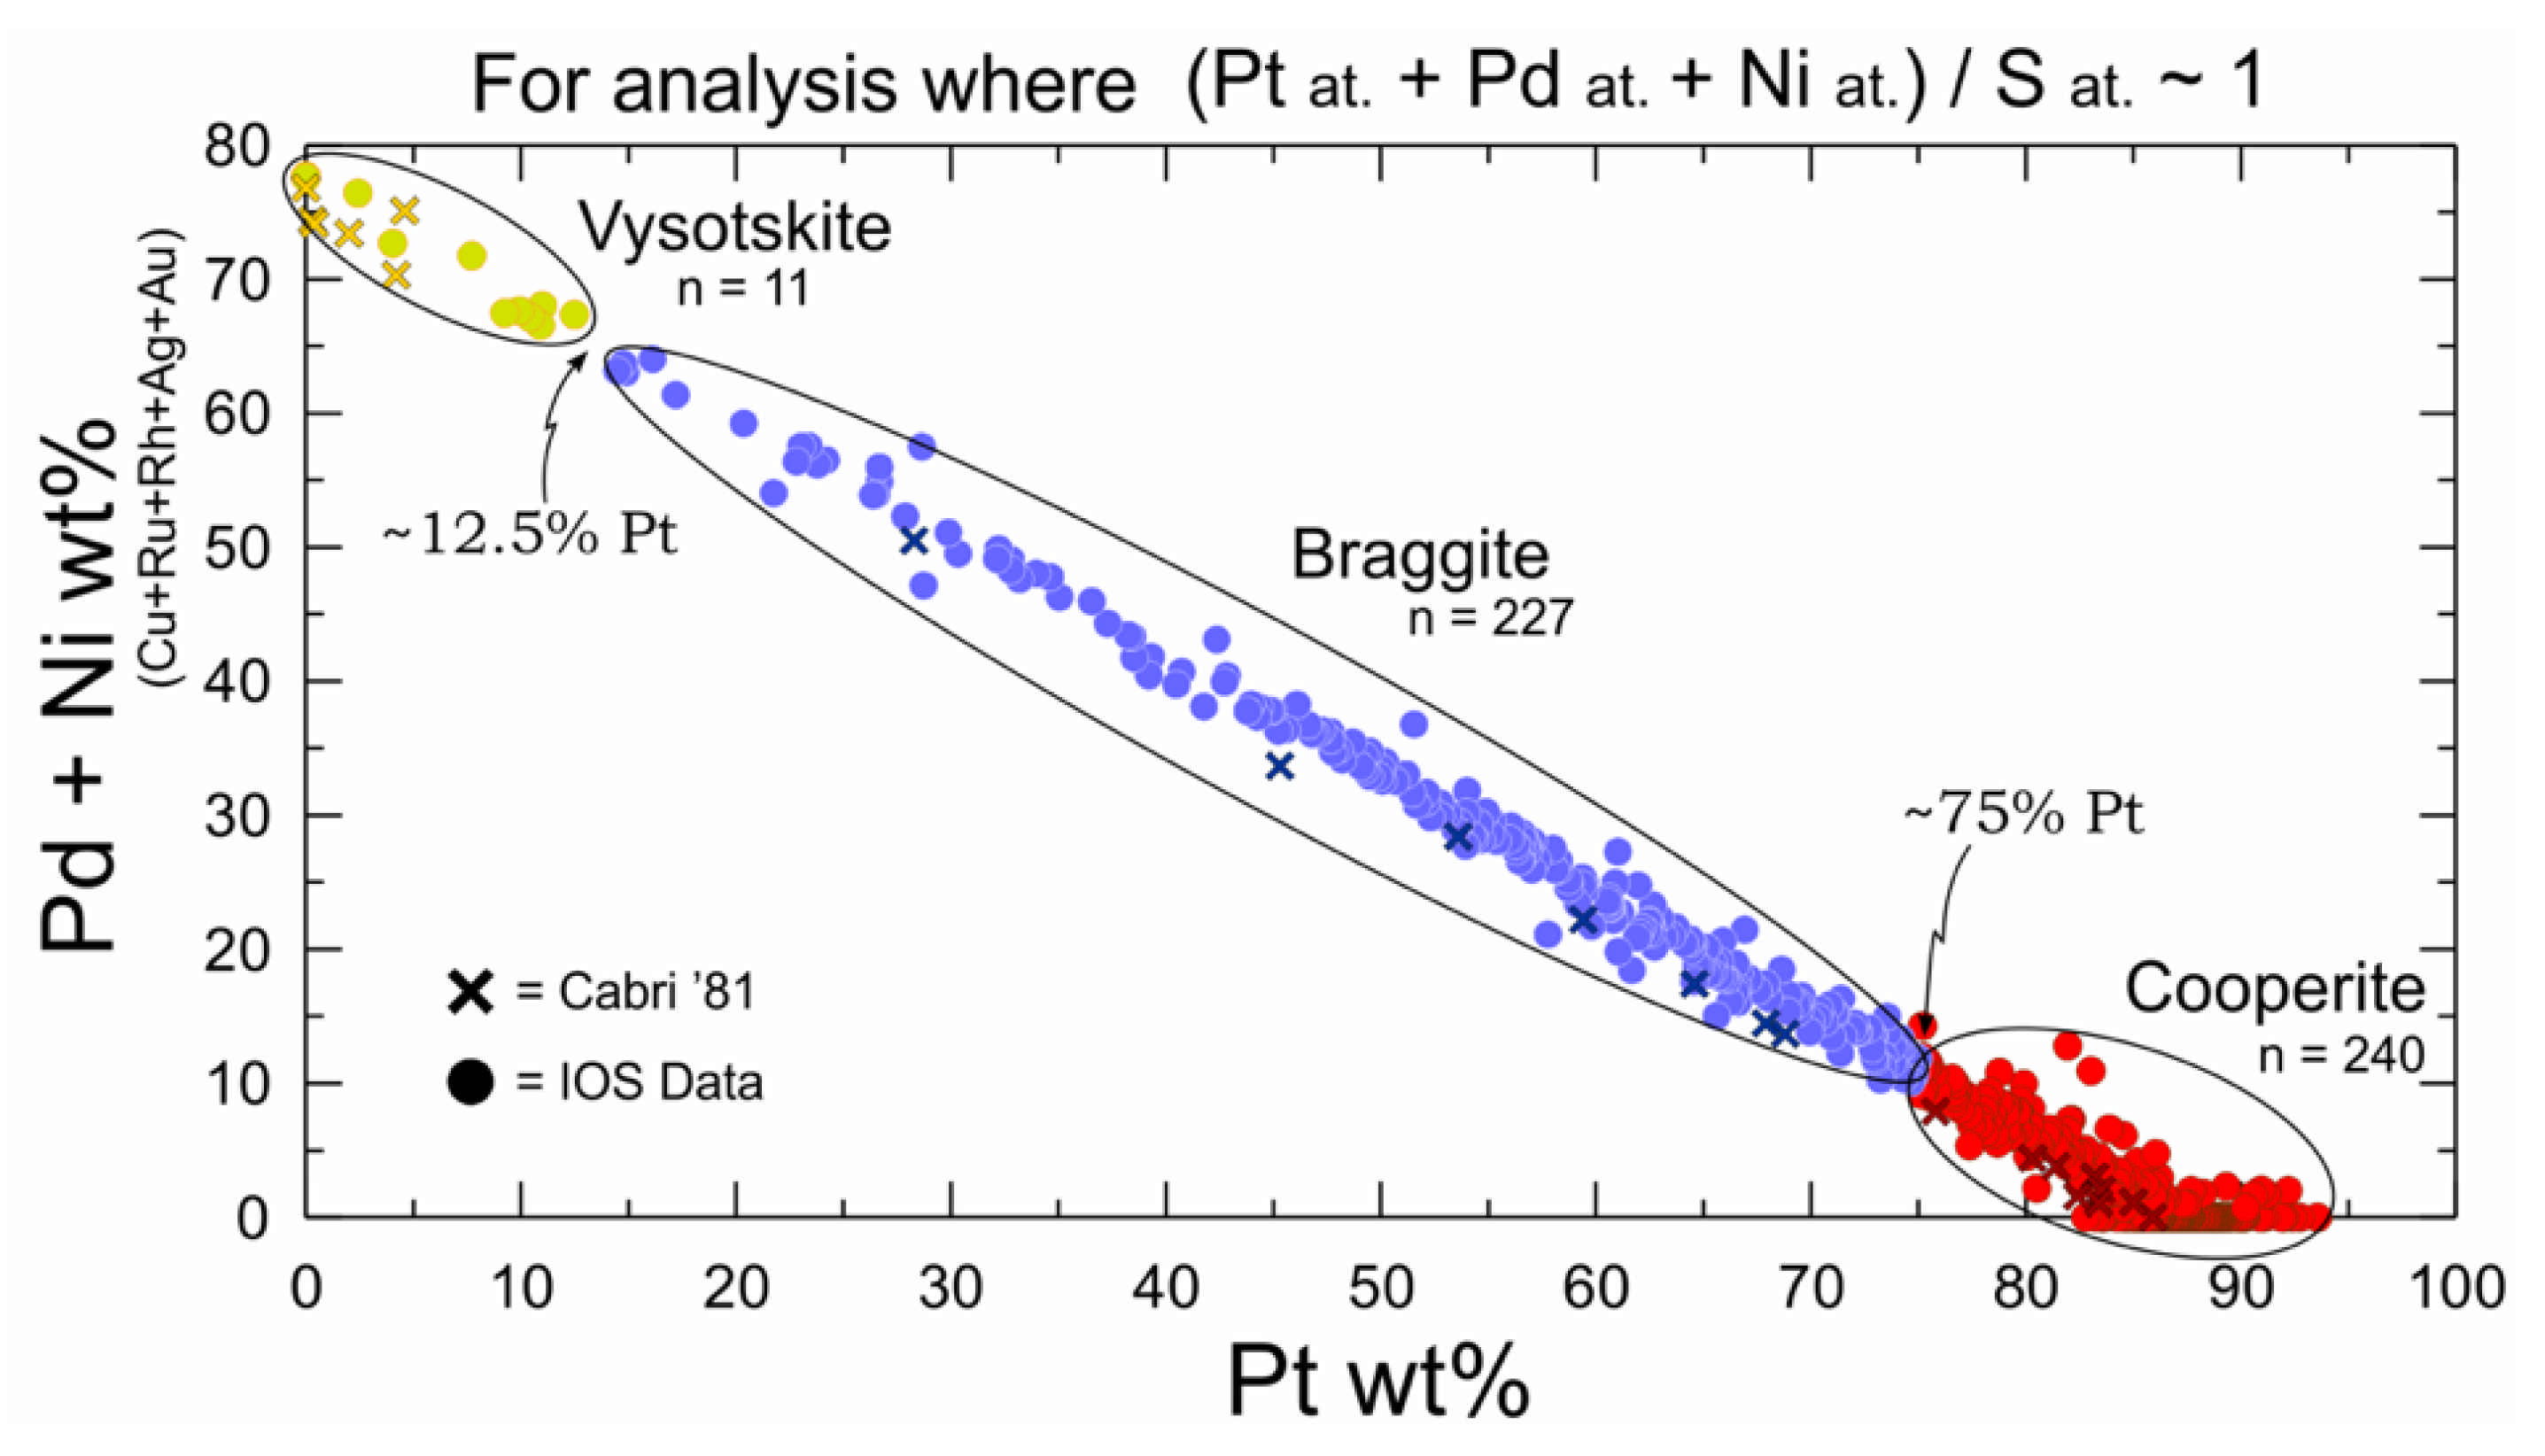
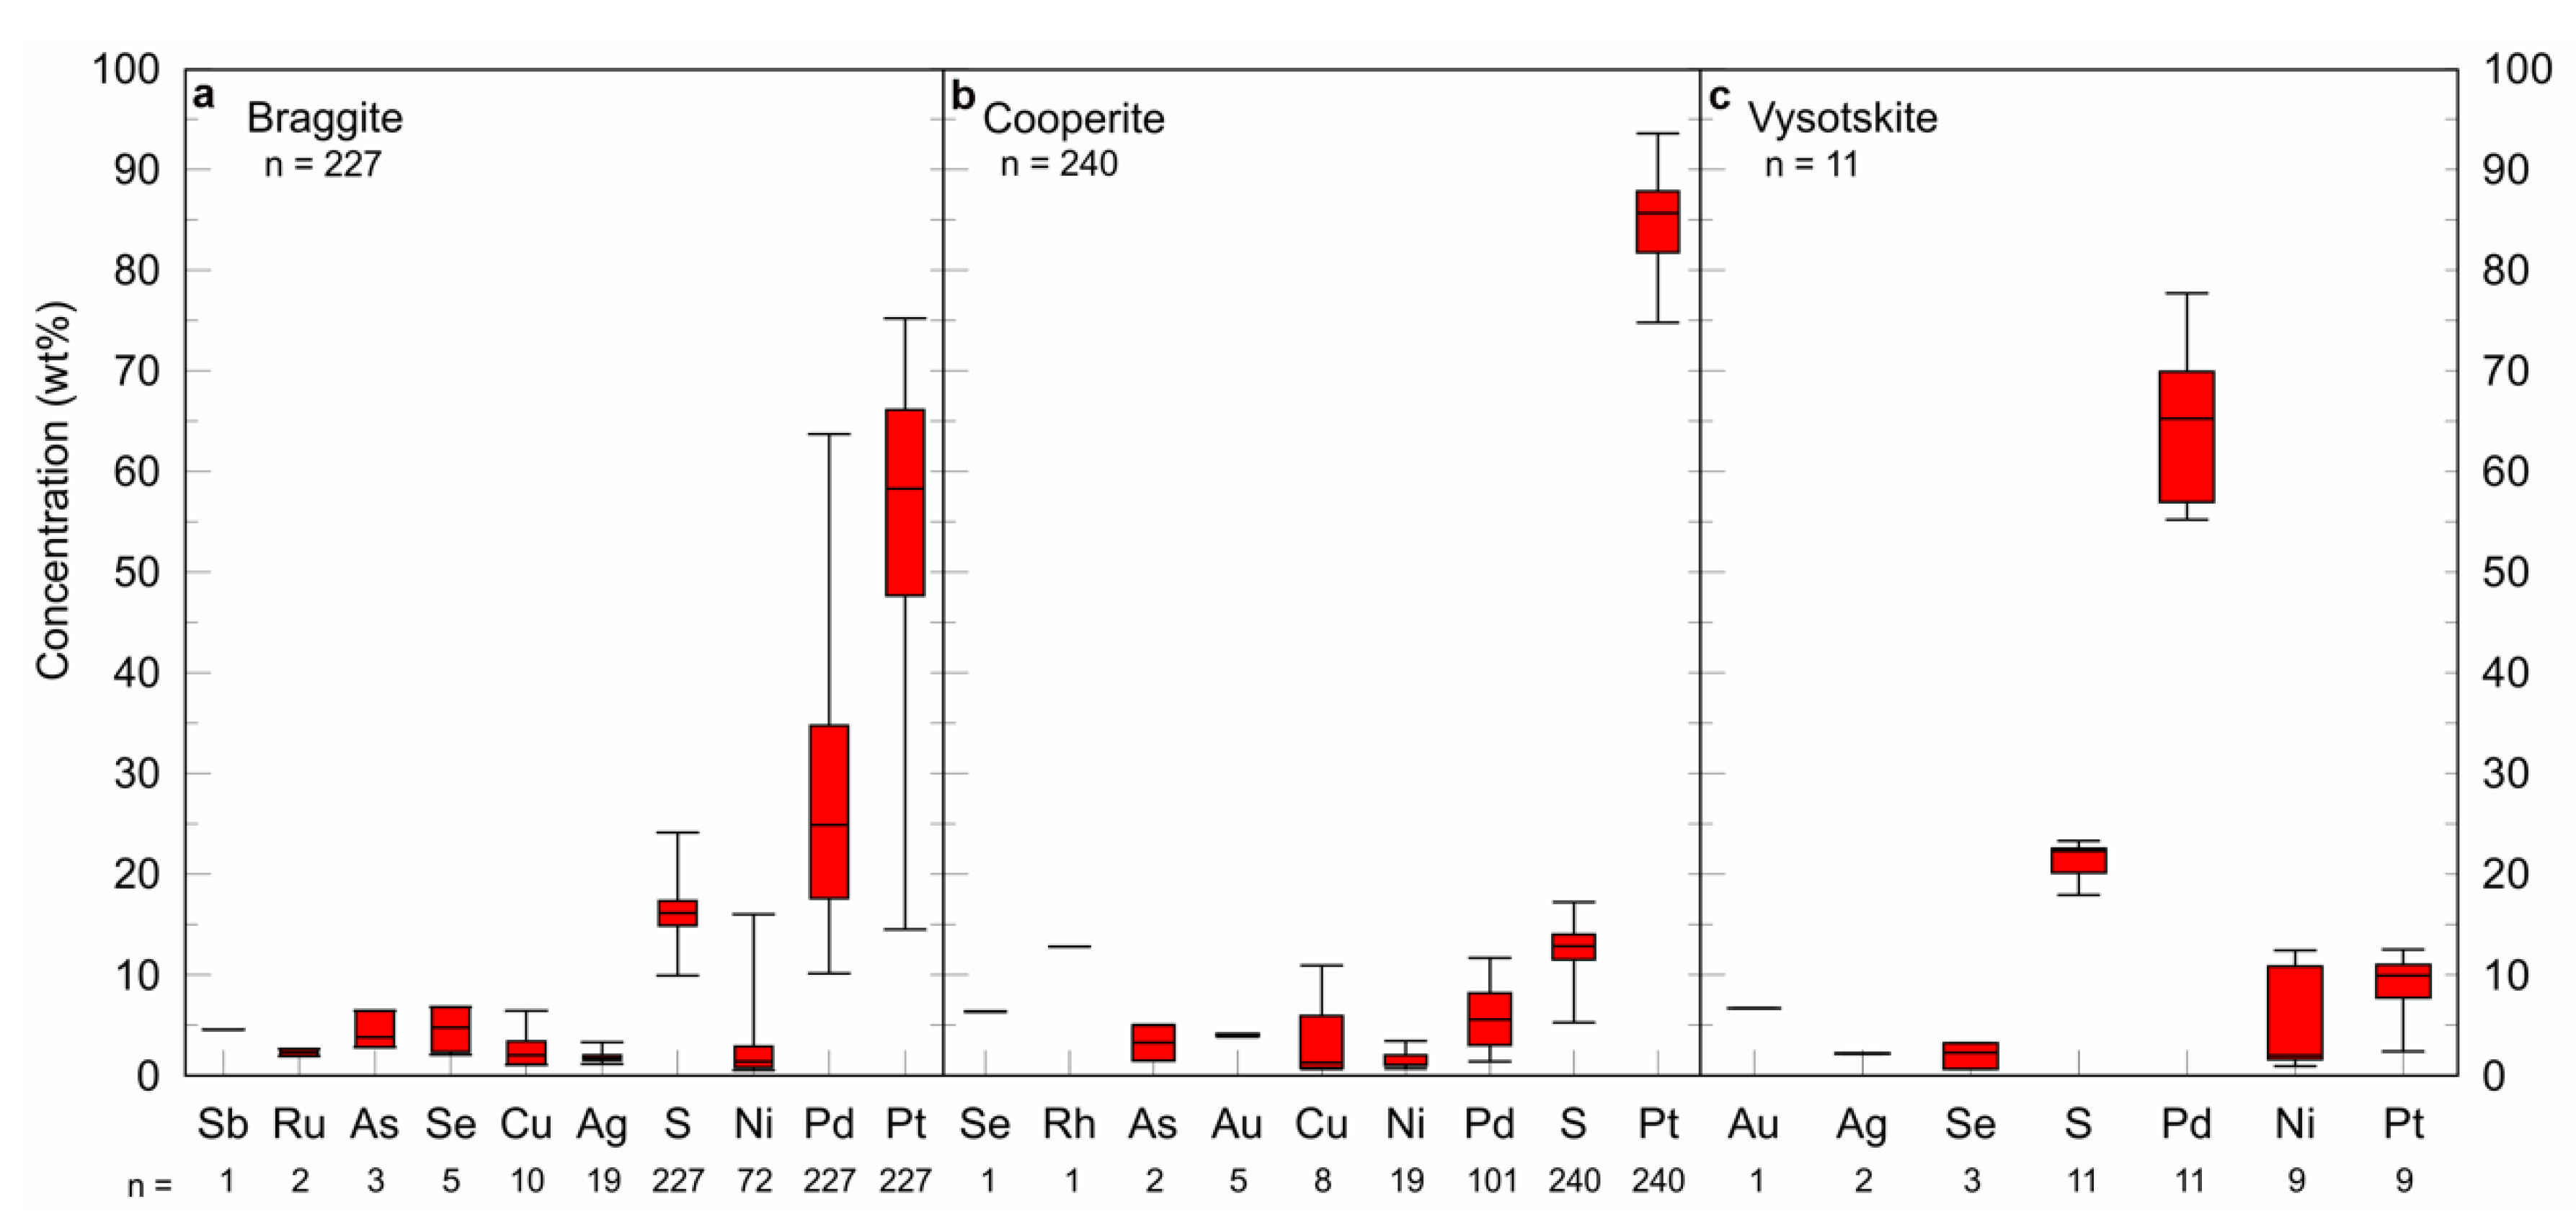
3.2.2. Braggite-Cooperite-Vysotskite Series

Following sperrylite, cooperite and braggite (Figure 6a,b) are ranked the most abundant PGMs in the till samples. These minerals along with vysotskite form an isomorphous solid-solution series ((Pt,Pd,Ni)S), though cooperite is ideally PtS, braggite (Pd,Pt)S, and vysotskite PdS [8,58]. Some studies have already established chemical classification schemes for differentiating among the PGE-bearing nickeloan sulfides [25,58]. However, the suggested classifications mostly consider differences in the content of major constituents (Pd, Pt, S, ±Ni), and therefore, they do not reflect the variable composition of any substituting elements (e.g., Cu, Ru, Rh, Au, Ag) in the given minerals. These classifications do not also define the range of elemental compositions that can be used for differentiating among a Pd-rich cooperite and a Pt-rich braggite, as well as braggite and Pt-rich vysotskite (Figure 8). Hence, Figure 8 yields a classification diagram for PPGE PGMs satisfying the following condition ((Pt at. + Pd at. + Ni at. + others at.)/S at. ~1) to discriminate between cooperite, braggite, and vysotskite based on their compositional variation. Analyses by Cabri [25] are included to help in defining the fields. Given that the limit between cooperite and braggite, and between braggite and vysotskite are not explicitly specified in the literature, they were set based on how they cluster. As a result, the limit between cooperite and braggite is fixed at 75 wt% Pt, which means 240 analyses having Pt > 75 wt% correspond to cooperite (Figure 8). Similarly, the limit between vysotskite and braggite is fixed at 12.5 wt% Pt such that 227 analyses satisfying the aforementioned condition and also having 12.5 wt% > Pt < 75 wt% correspond to braggite, whereas 11 analyses having Pt < 12.5 wt% are clustered as vysotskite (Figure 8).
Elemental variation in the composition of braggite, cooperite and vysotskite is illustrated by a box and whisker plots in Figure 9a–c. Although forming a solid solution series, and within a fixed range of Pt composition, these PGMs show a variety range of values for Pd, Ni and substituting elements. For instance, whereas braggite is composed of 10 < Pd < 64 wt% (Figure 9a), and cooperite consists of 1.4 ≤ Pd ≤ 12 wt% (Figure 9b), the Pd contents in vysotskite vary from > 55 to < 78 wt%. In addition, the range of Ni values, which was measured in ~31.0% of braggite grains and ~8.0% of cooperite grains is as follows: Ni ≥ 0.5 to ≤ 16.0 wt% for braggite and > 0.7 to < 3.5 wt% for cooperite (Figure 9a,b). Vysotskite commonly (82.0%) contains of 0.9 < Ni < 12.5 wt% (Figure 9c). Variable contents of Sb, Ru, As Se, Cu, and Rh are measured in braggite and cooperite (Figure 9a,b), whilst 19 braggite grains also consist of 1.0 < Ag < 3.3 wt%, and 5 cooperite grains contain in average ~4.0 wt% Au. Vysotskite results also include one analysis at 6.7 wt% Au and two analyses averaging ~2 wt% Ag (Figure 9c).

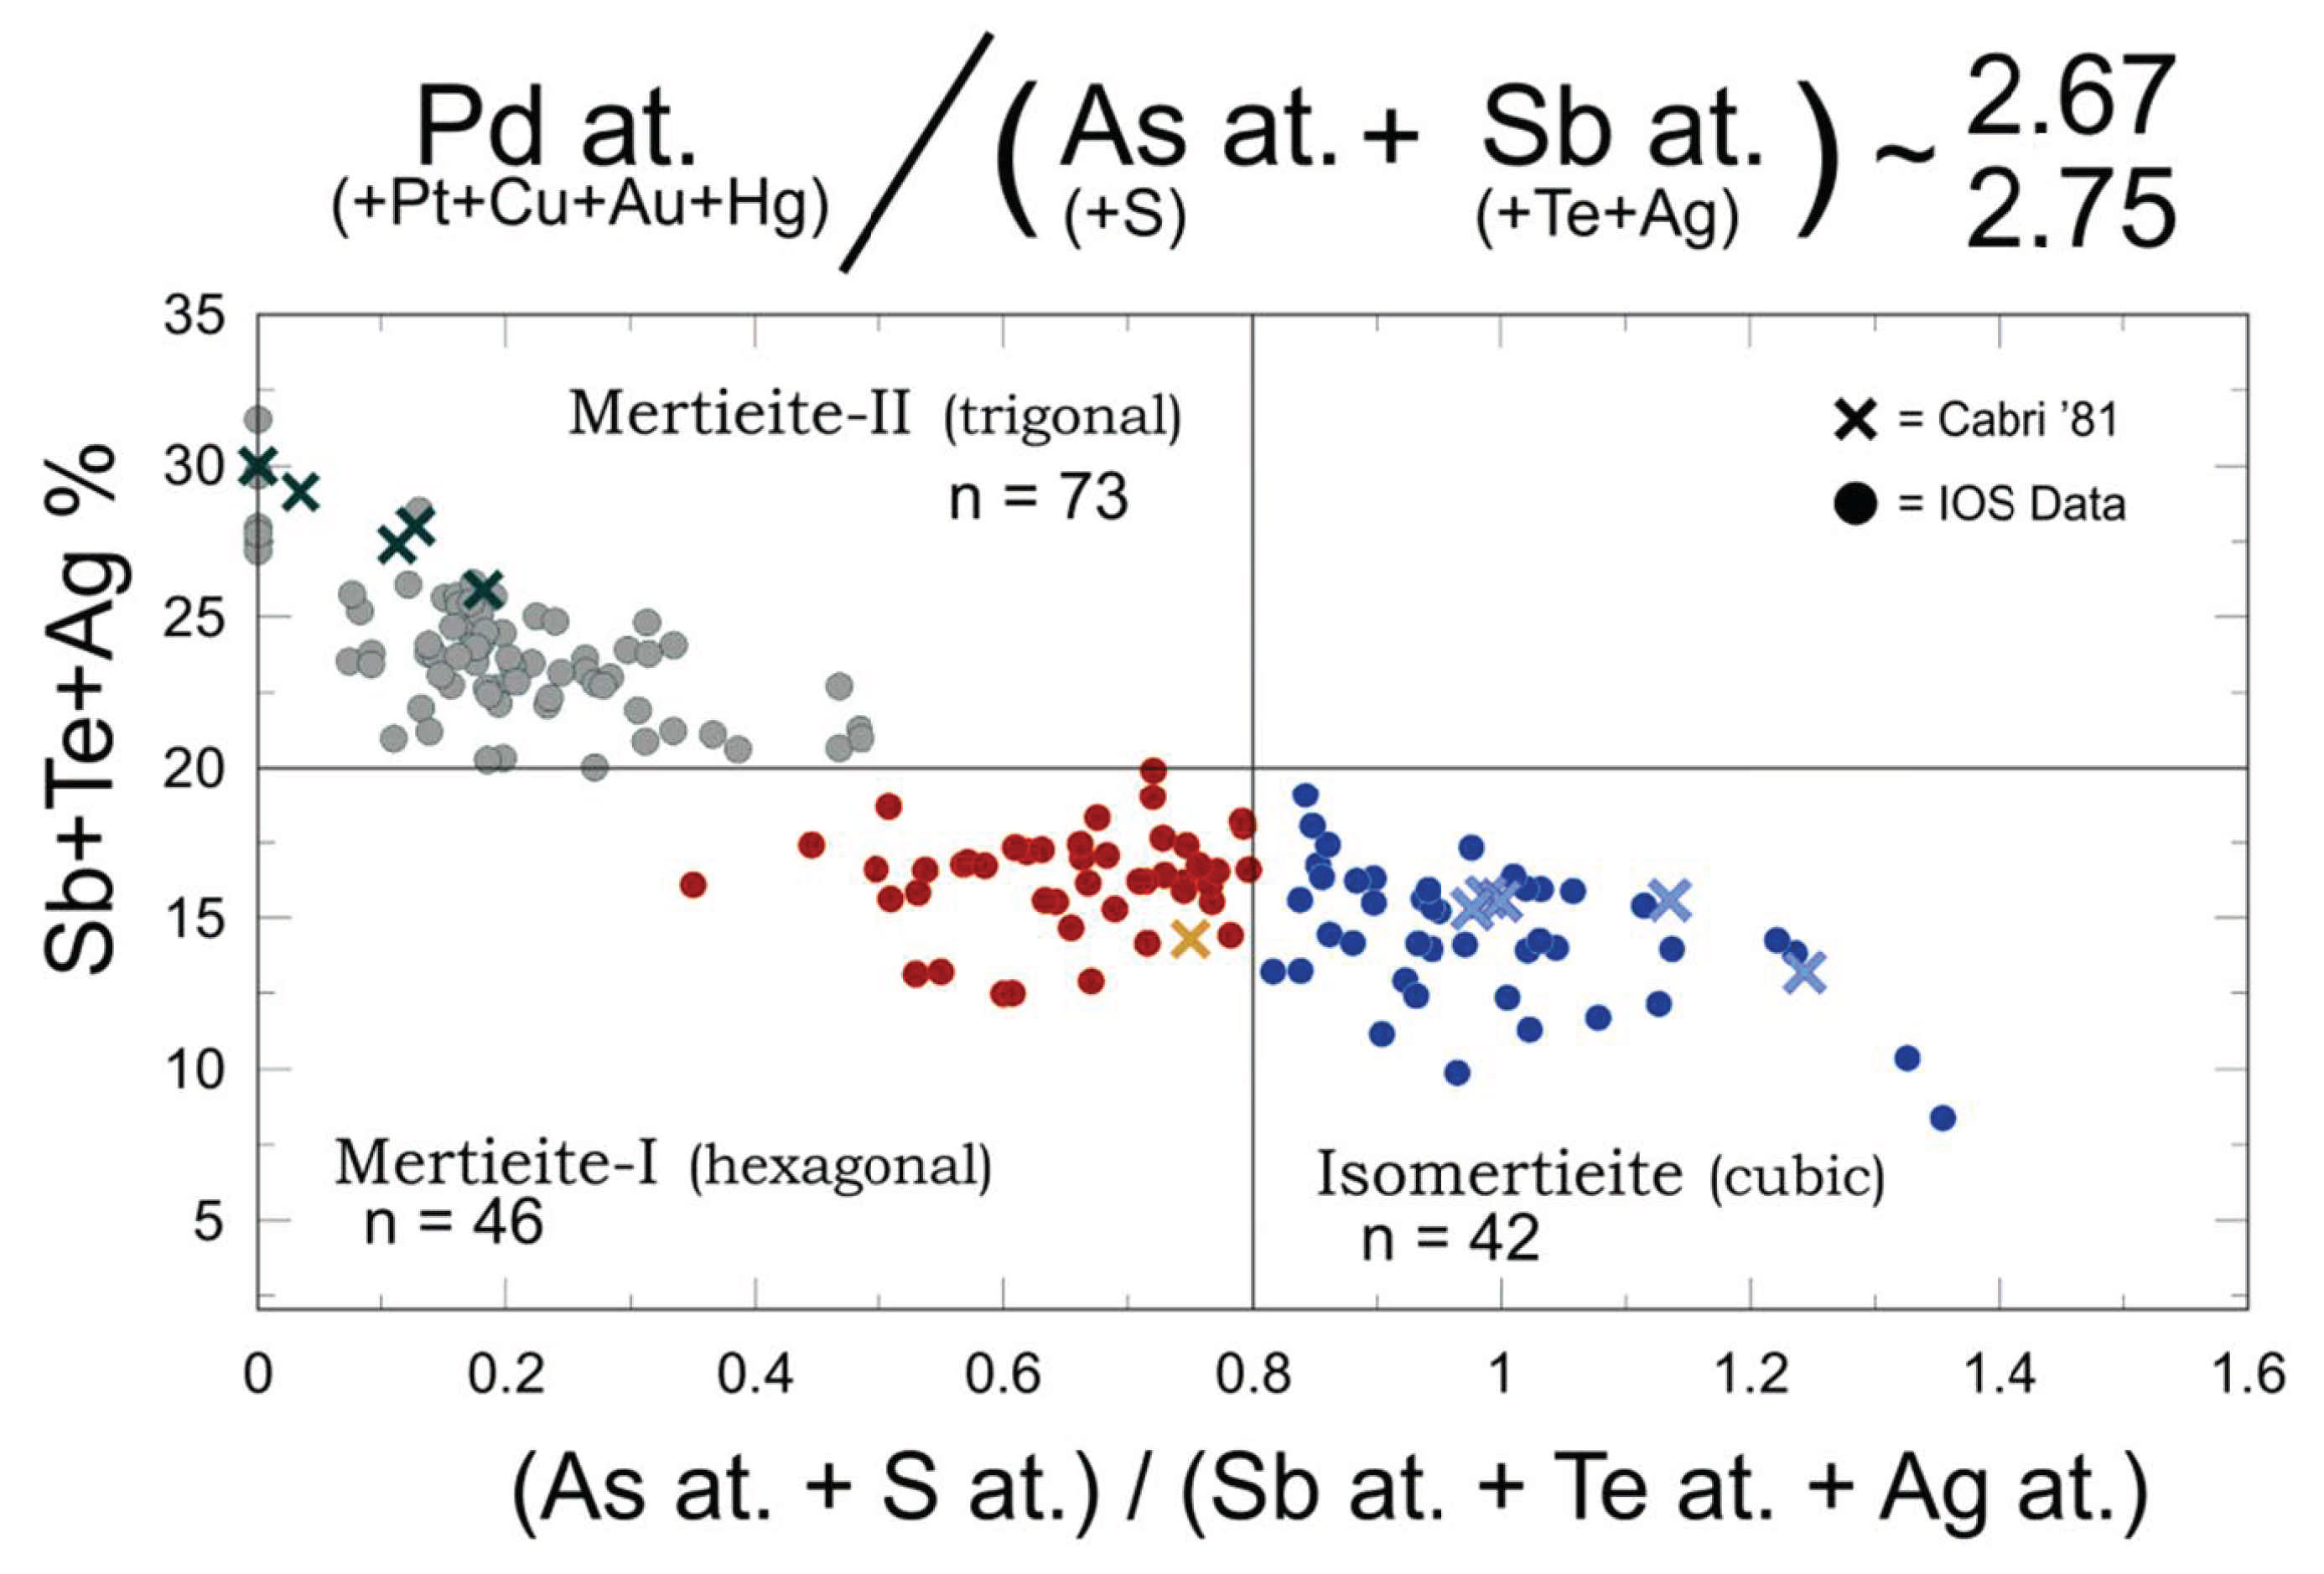
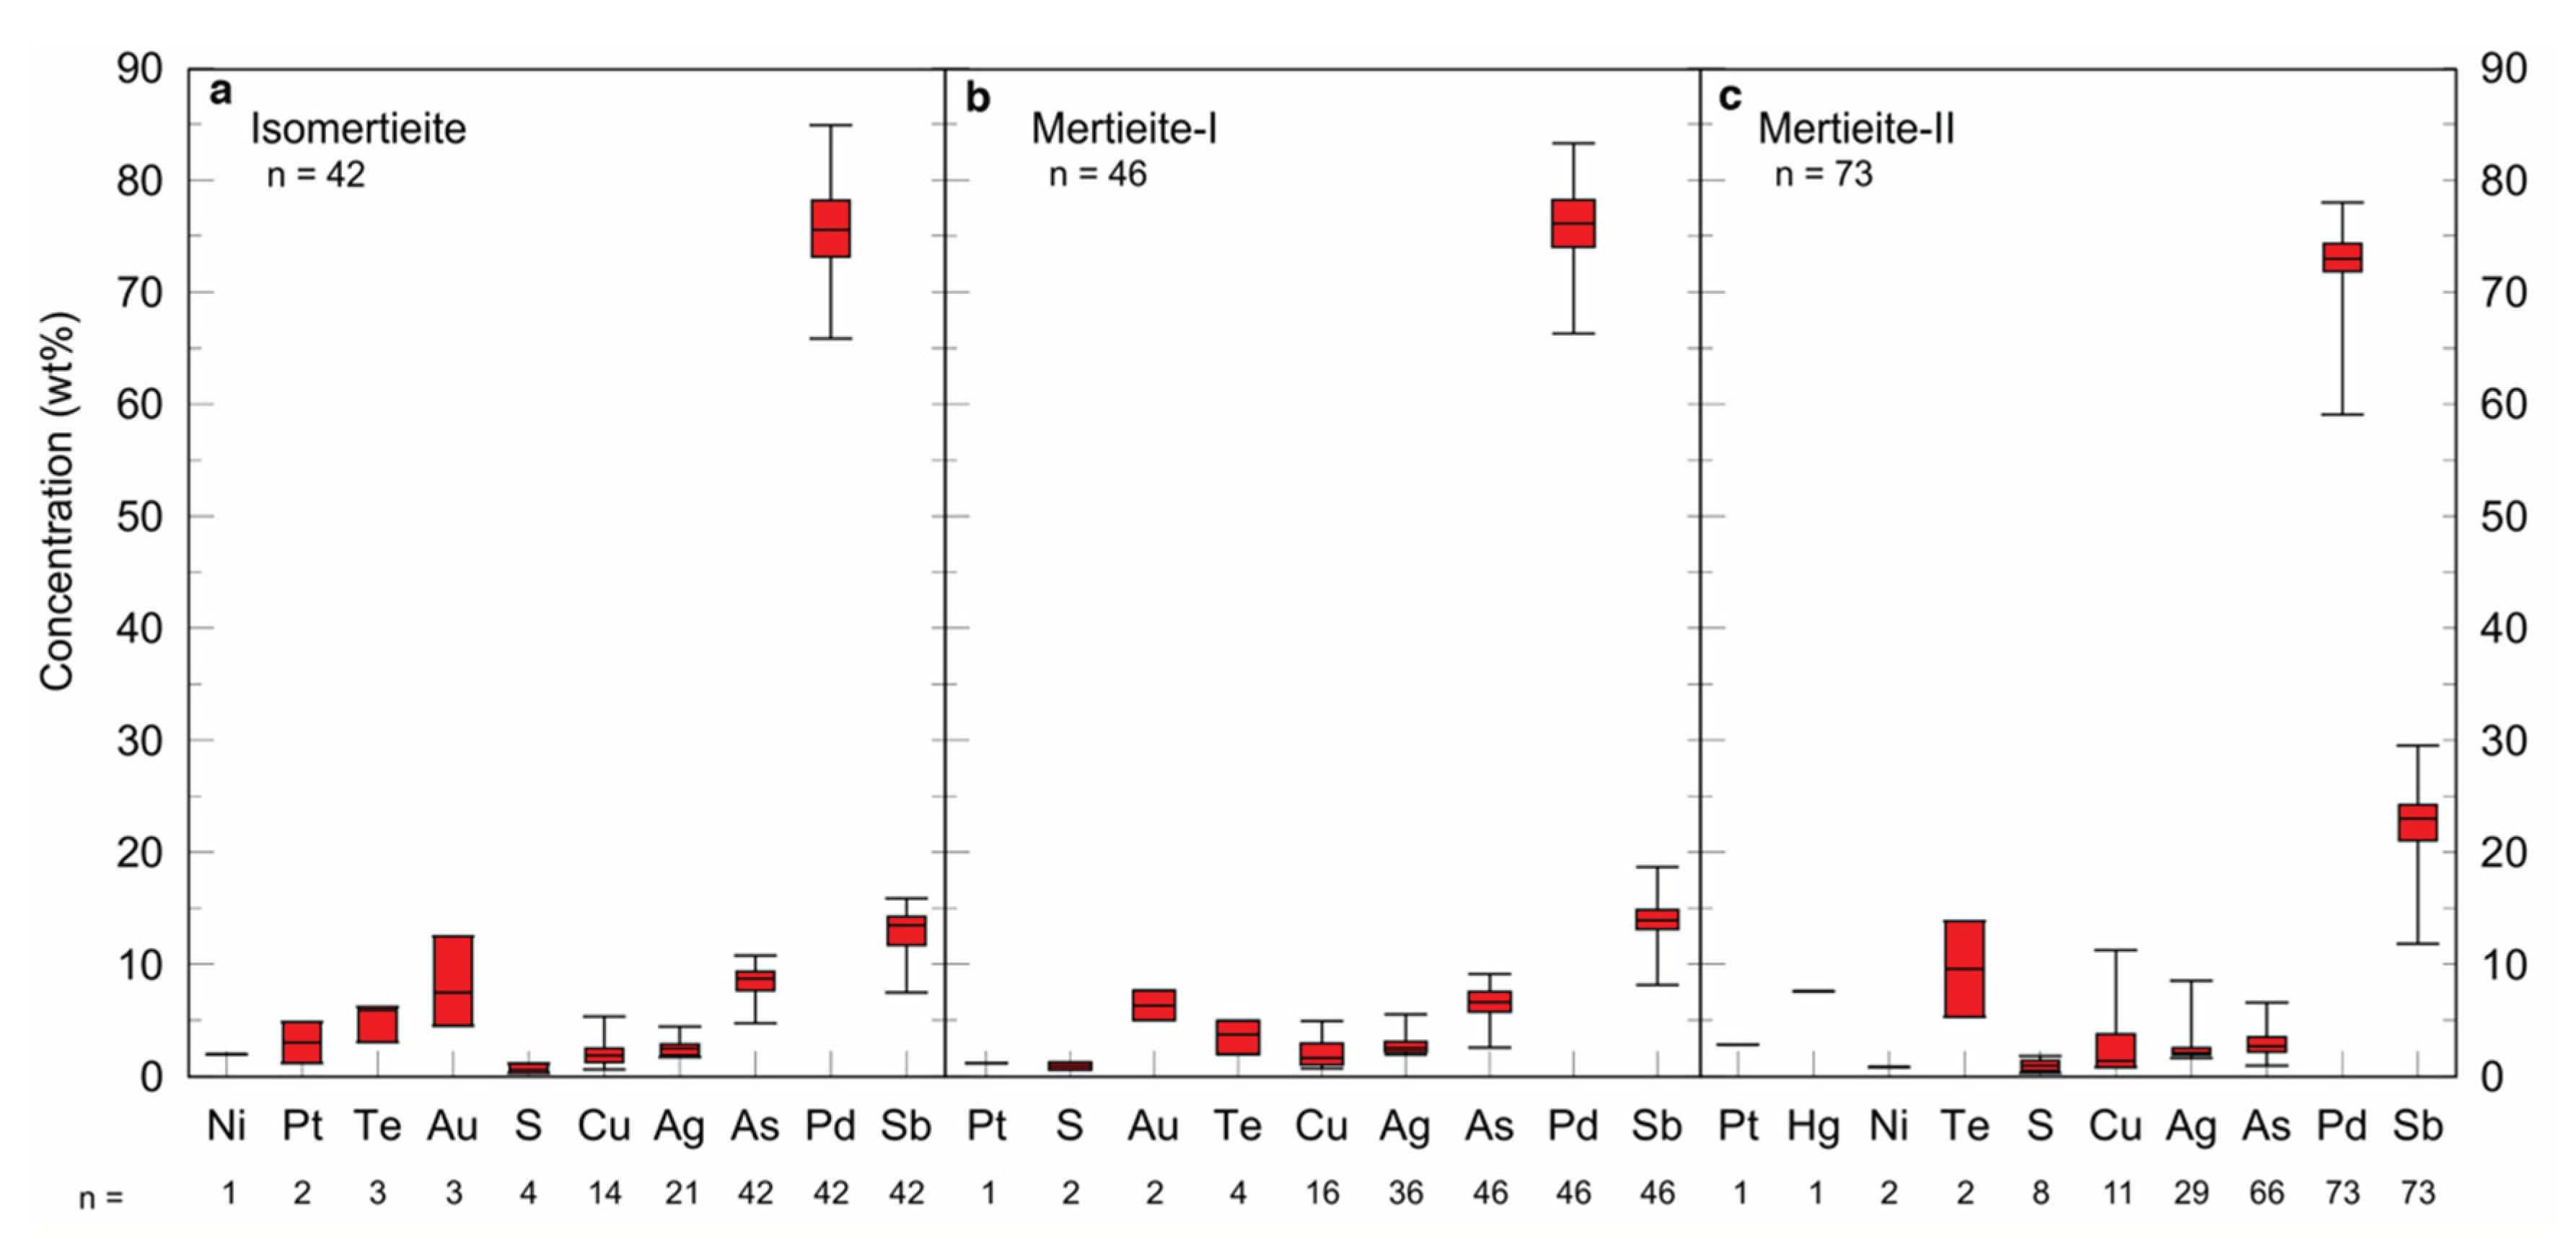
3.2.3. Isomertieite-Mertieite Series

Mertieite-II (Pd8(Sb,As)3; Figure 6e), mertieite-I (Pd11(Sb,As)4), and isomertieite (Pd11Sb2As2; Figure 6h) are respectively the fifth, eighth, and ninth most abundant PGMs identified in the studied till samples (Figure 3). They are members of palladium arseno-antimonides and crystallize in different crystallographic systems. As their stoichiometric ratios are too close to be efficiently discriminated from the semi-quantitative analysis produced by the routine, it is difficult to discriminate between these mineral species. Despite that mertieite-I and isomertieite are presented as dimorphous species, it appears from available data that mertieite-I contains slightly less As (6.6 wt% in average) and slightly more Sb (13.7 wt% in average) compared to isomertieite (average As = 8.6 wt% and Sb = 12.7 wt%; Figure 10 and Figure 11). On the other hand, the composition of mertieite-II grains is distinctly enriched in Sb and impoverished in As, placing these in a distinctive field in Figure 10. This discriminant diagram illustrates how the composition of the major elements (Pd, Sb, As) and substituting constituents forms a loose continuum among the palladium arseno-antimonides species. To establish the limits between the fields of isomertieite, mertieite-I, and mertieite-II, the data from Cabri [25] have been incorporated in the graph as reference.
Mertieite-II analyses are characterized by (Sb + Te + Ag) > 20 wt% and (As at. + S at.) / (Sb at. + Te at. + Ag at.) < 0.5 (Figure 10). In contrast, mertieite-I and isomertieite analyses are characterized by (Sb + Te + Ag) < 20 wt%. The difference between these two species lies essentially on the As / Sb ratio where mertieite-I are (As at. + S at.) / (Sb at. + Te at. + Ag at.) < 0.8 while isomertieite are (As at. + S at.) / (Sb at. + Te at. + Ag at.) > 0.8 (Figure 10). Box and whisker plots of isomertieite, mertieite-I and mertieite-II, show how these series contain variable amounts of Ag and Te that most likely substitute for Sb and variable amounts of Ni, Pt, Cu, Au, and Hg that seems to substitute for Pd (Figure 11a–c). Within the aforementioned As + Sb limits of these species, Pd contents varies from ≥ 65.8 to < 85.0 wt% in isomertieite (Figure 11a), ≥ 66.2 to < 83.2 wt% in mertieite-I (Figure 11b) and > 59.0 to < 78.0 wt% in mertieite-II (Figure 11c). Among the 161 palladium arseno-antimonides species analyzed, two mertieite-I grains also contain 5.0 and 7.7 wt% Au and three isomertieite reported 4.5 < Au < 12.5 wt%.

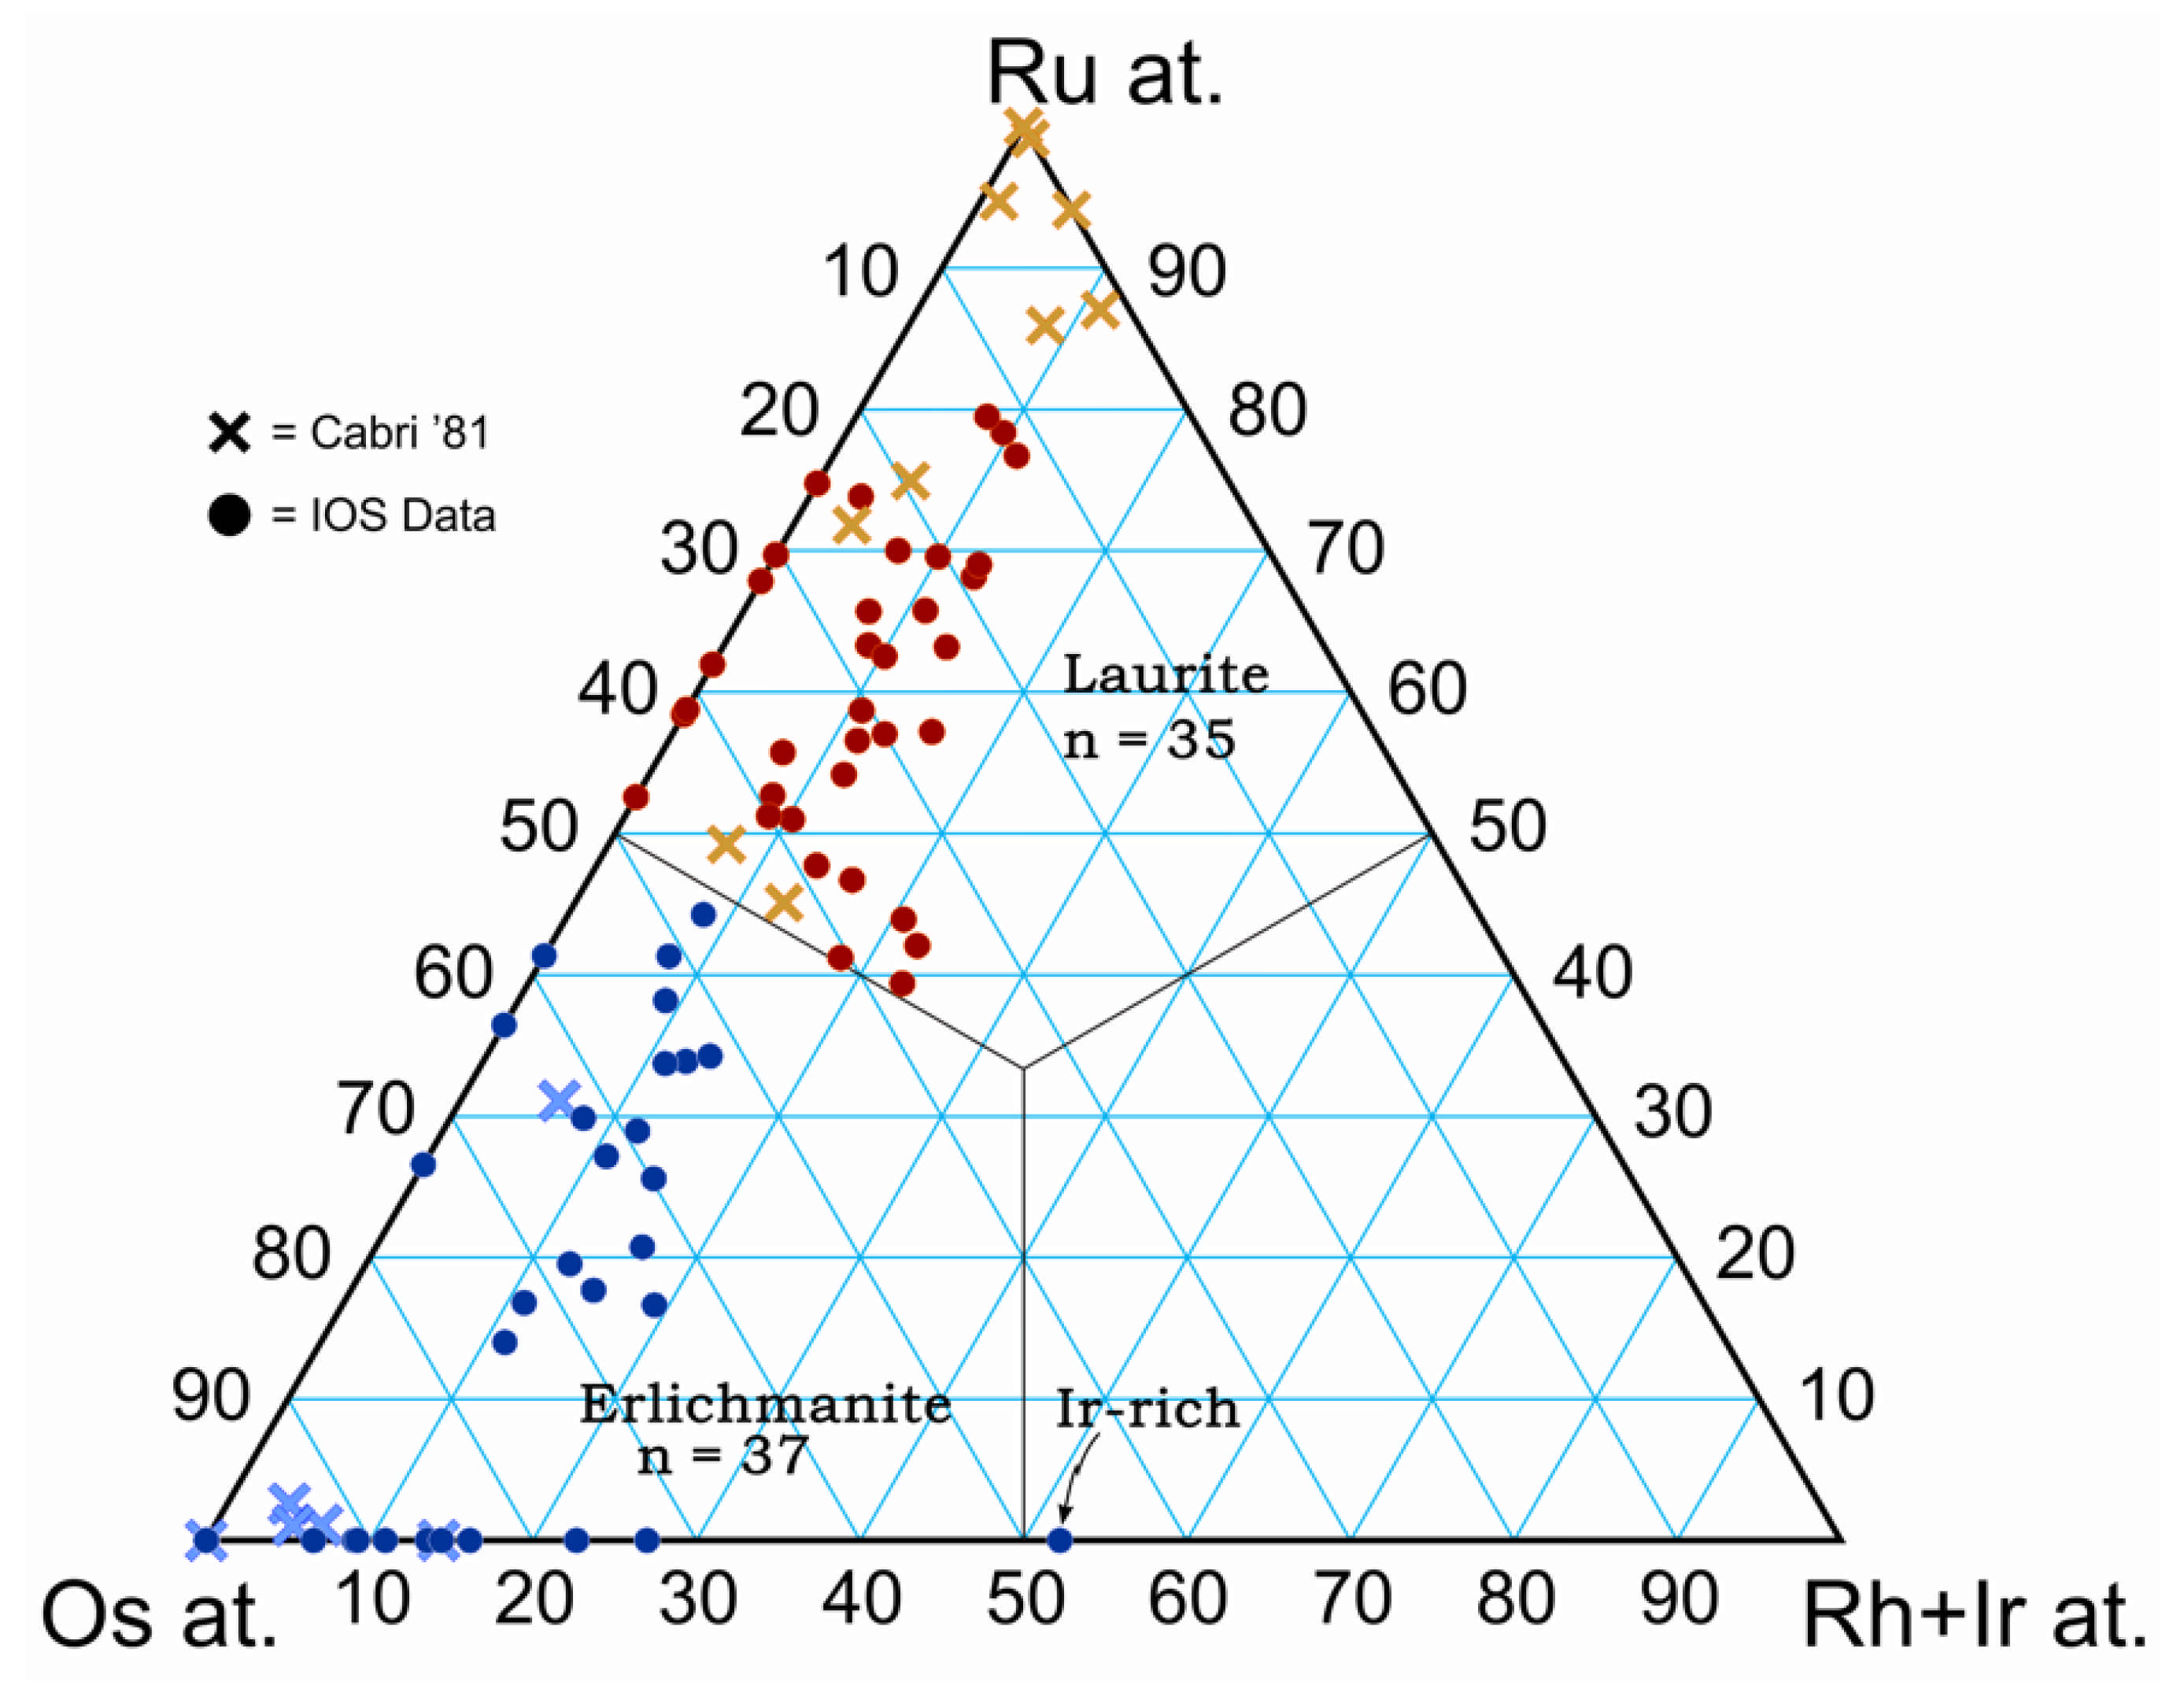
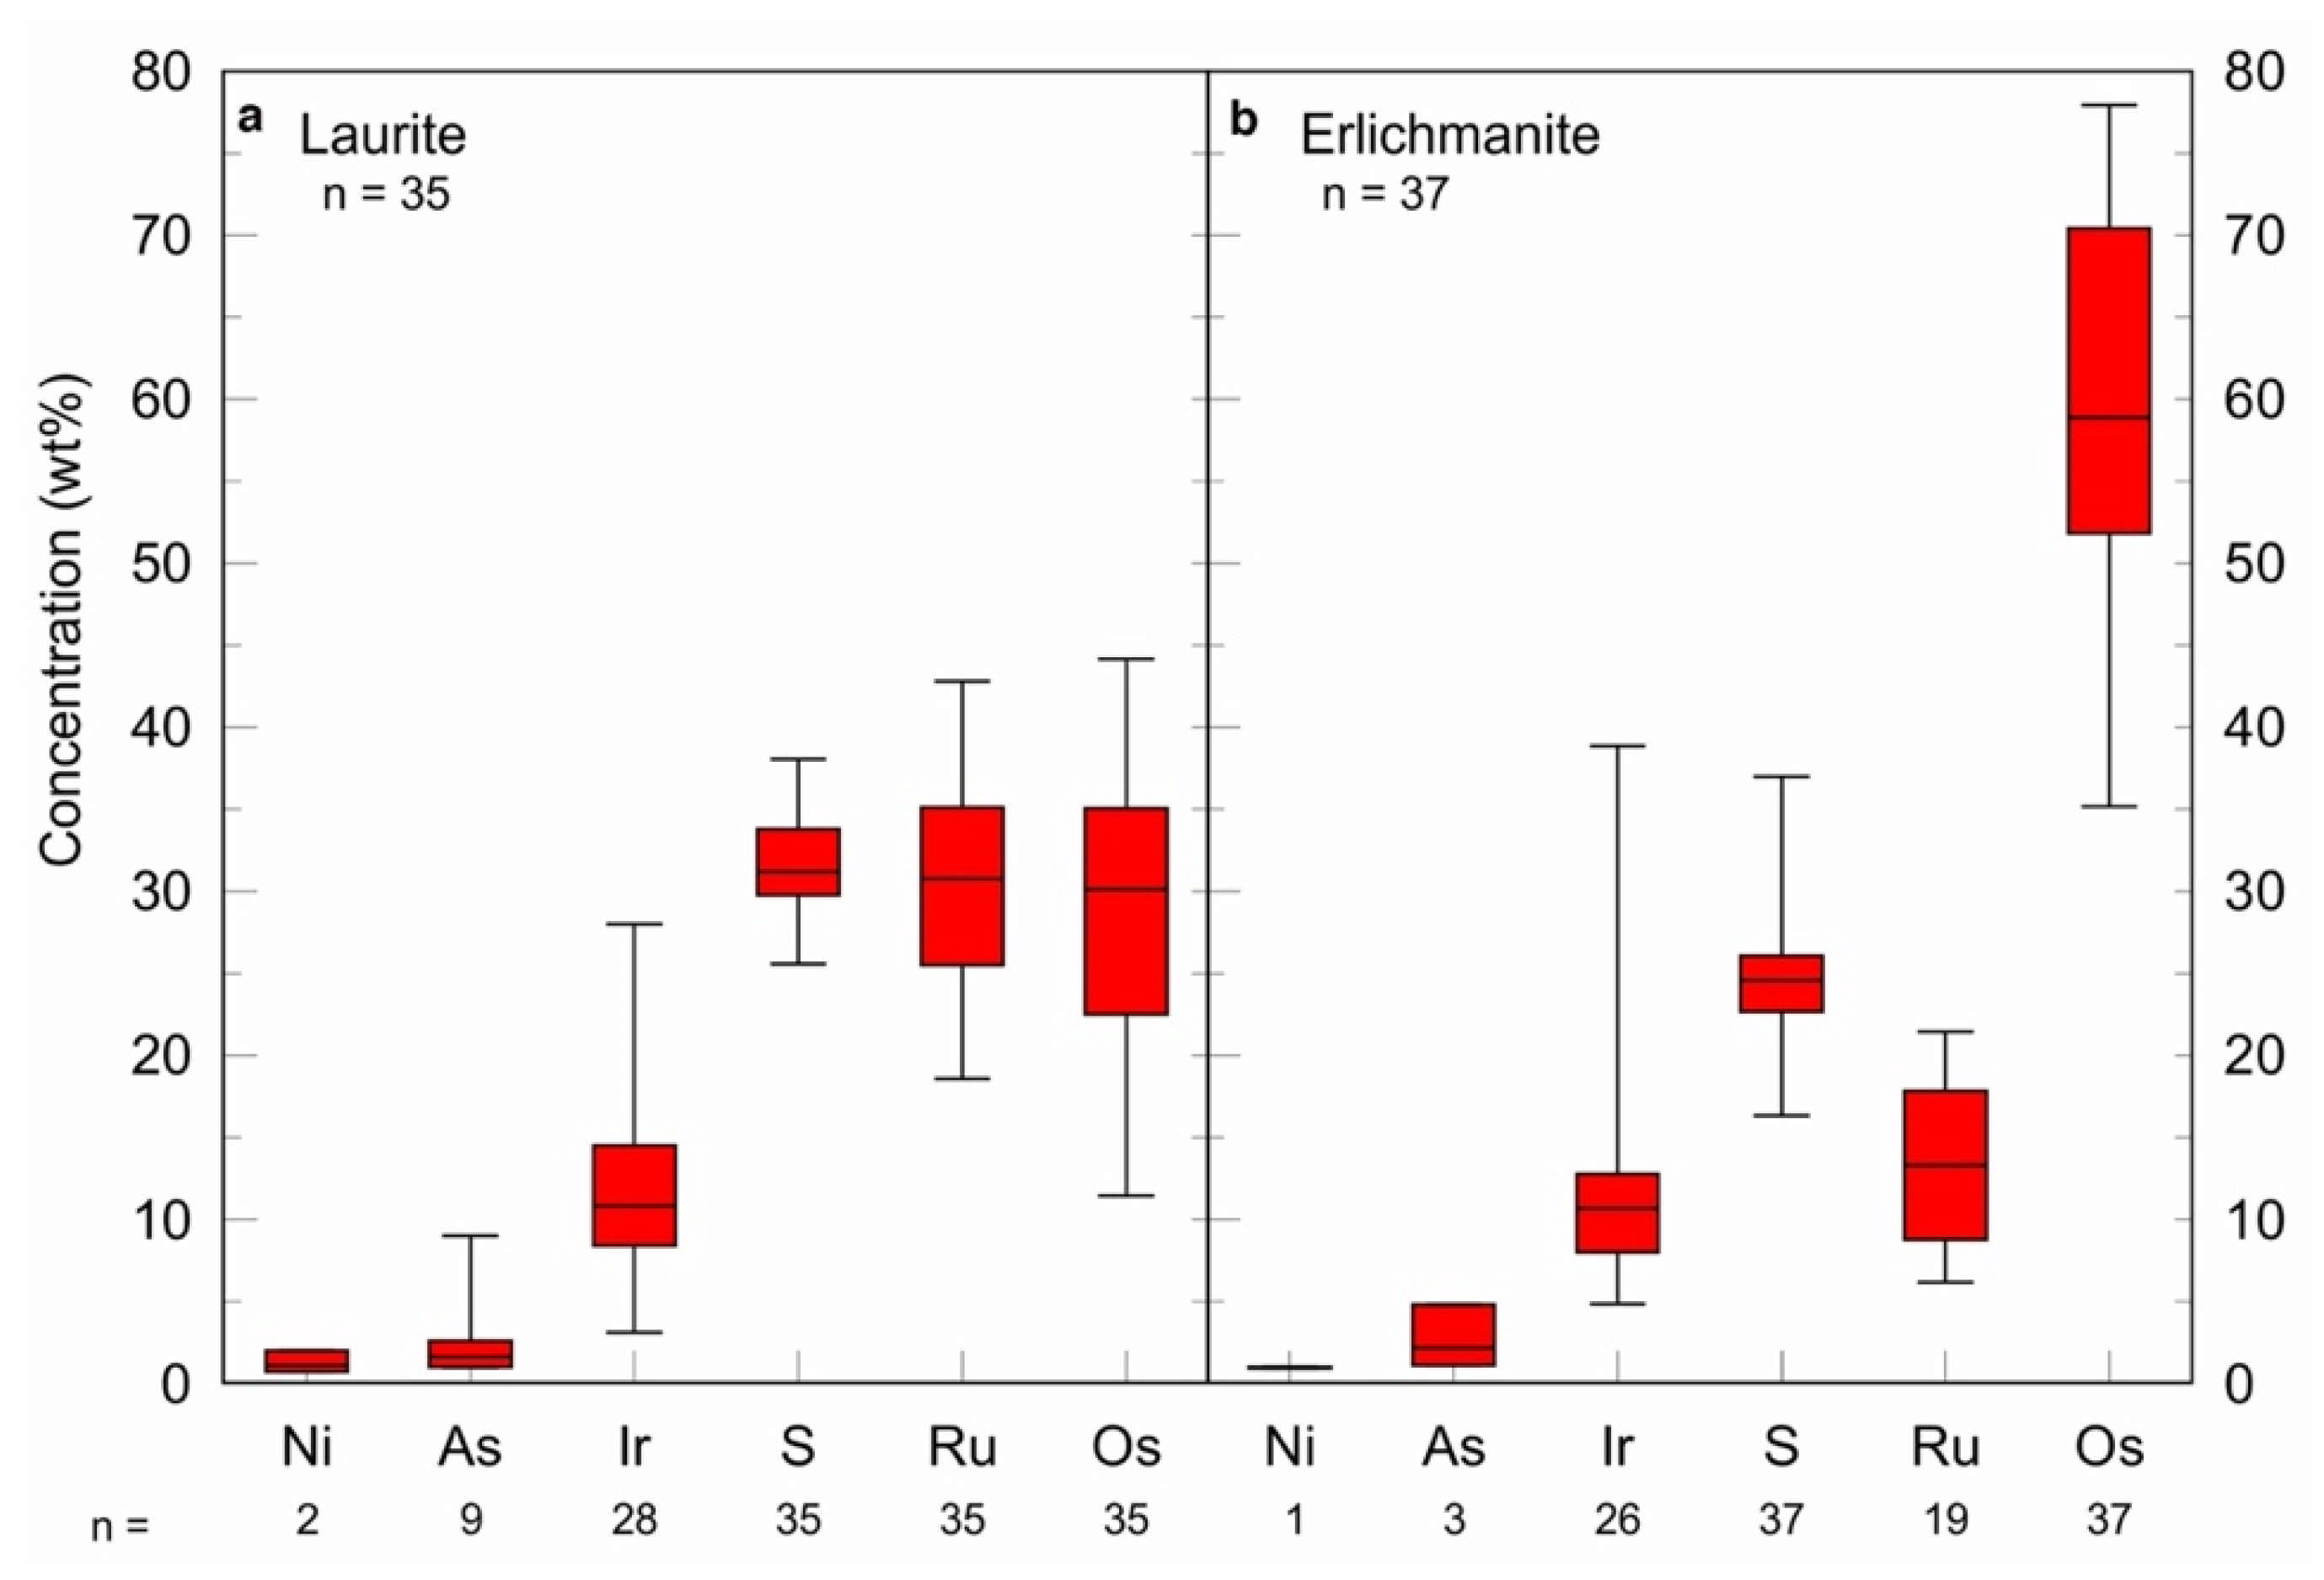
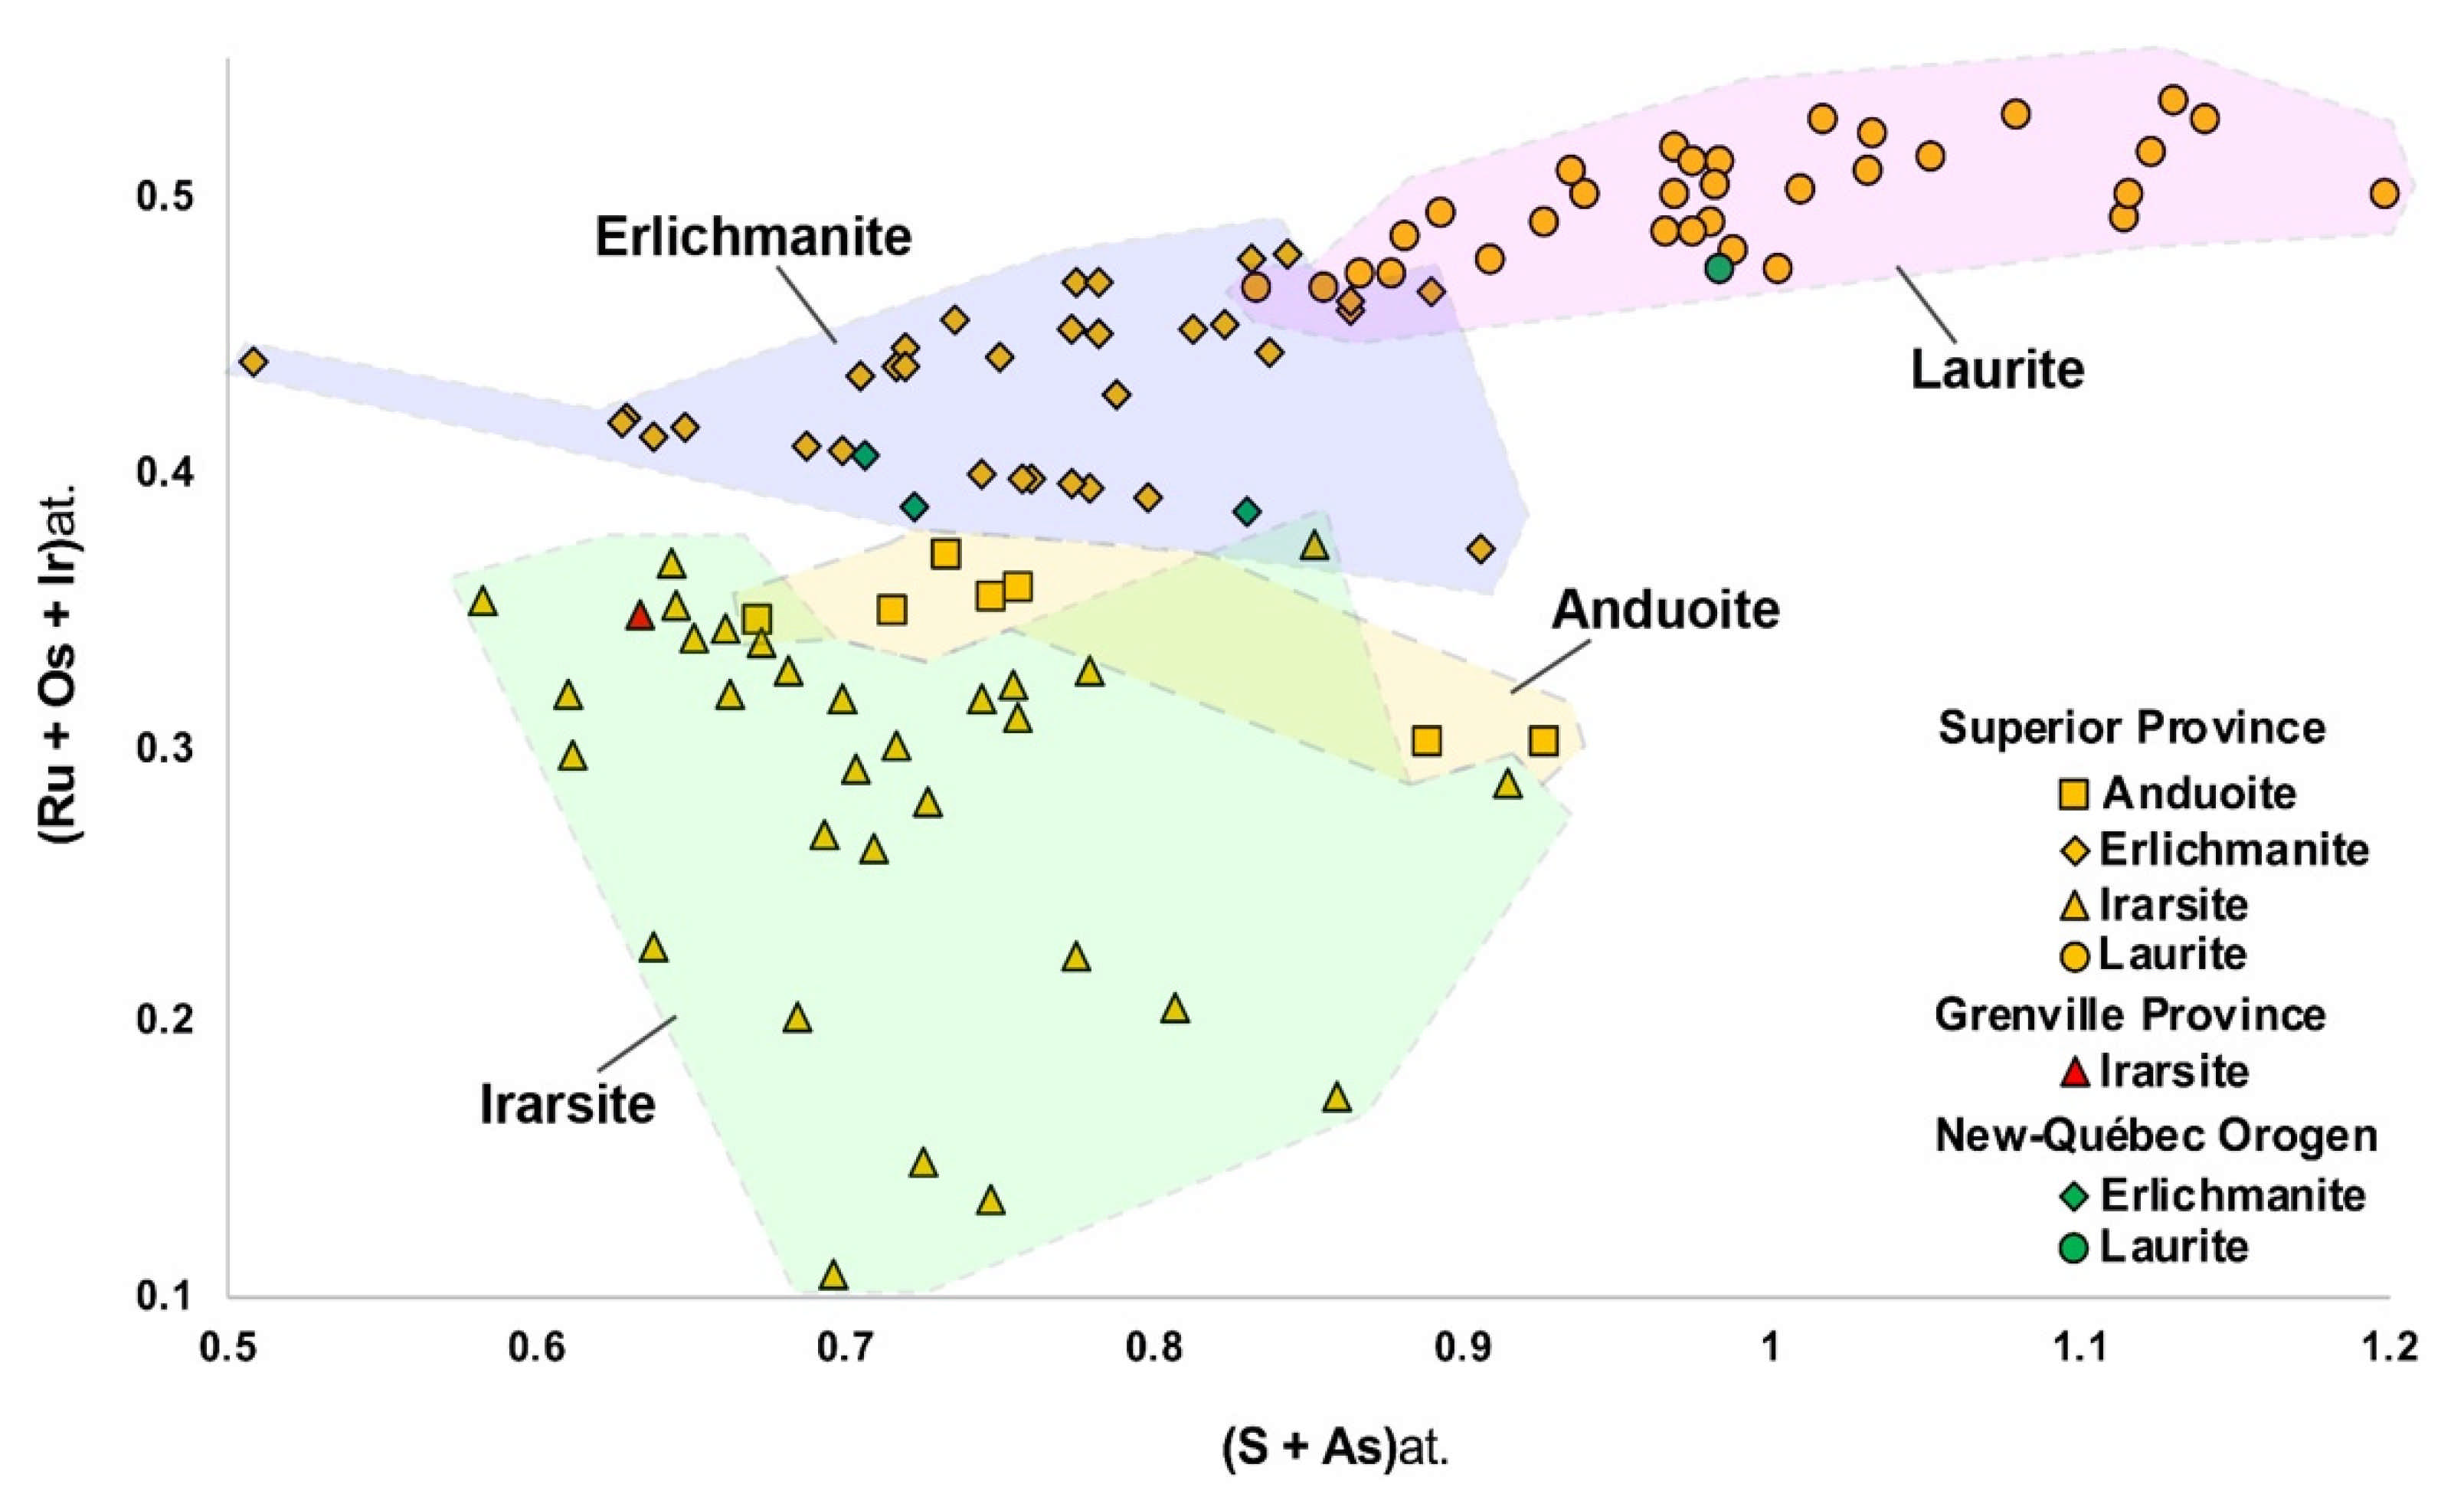
3.2.4. Laurite-Erlichmanite Series
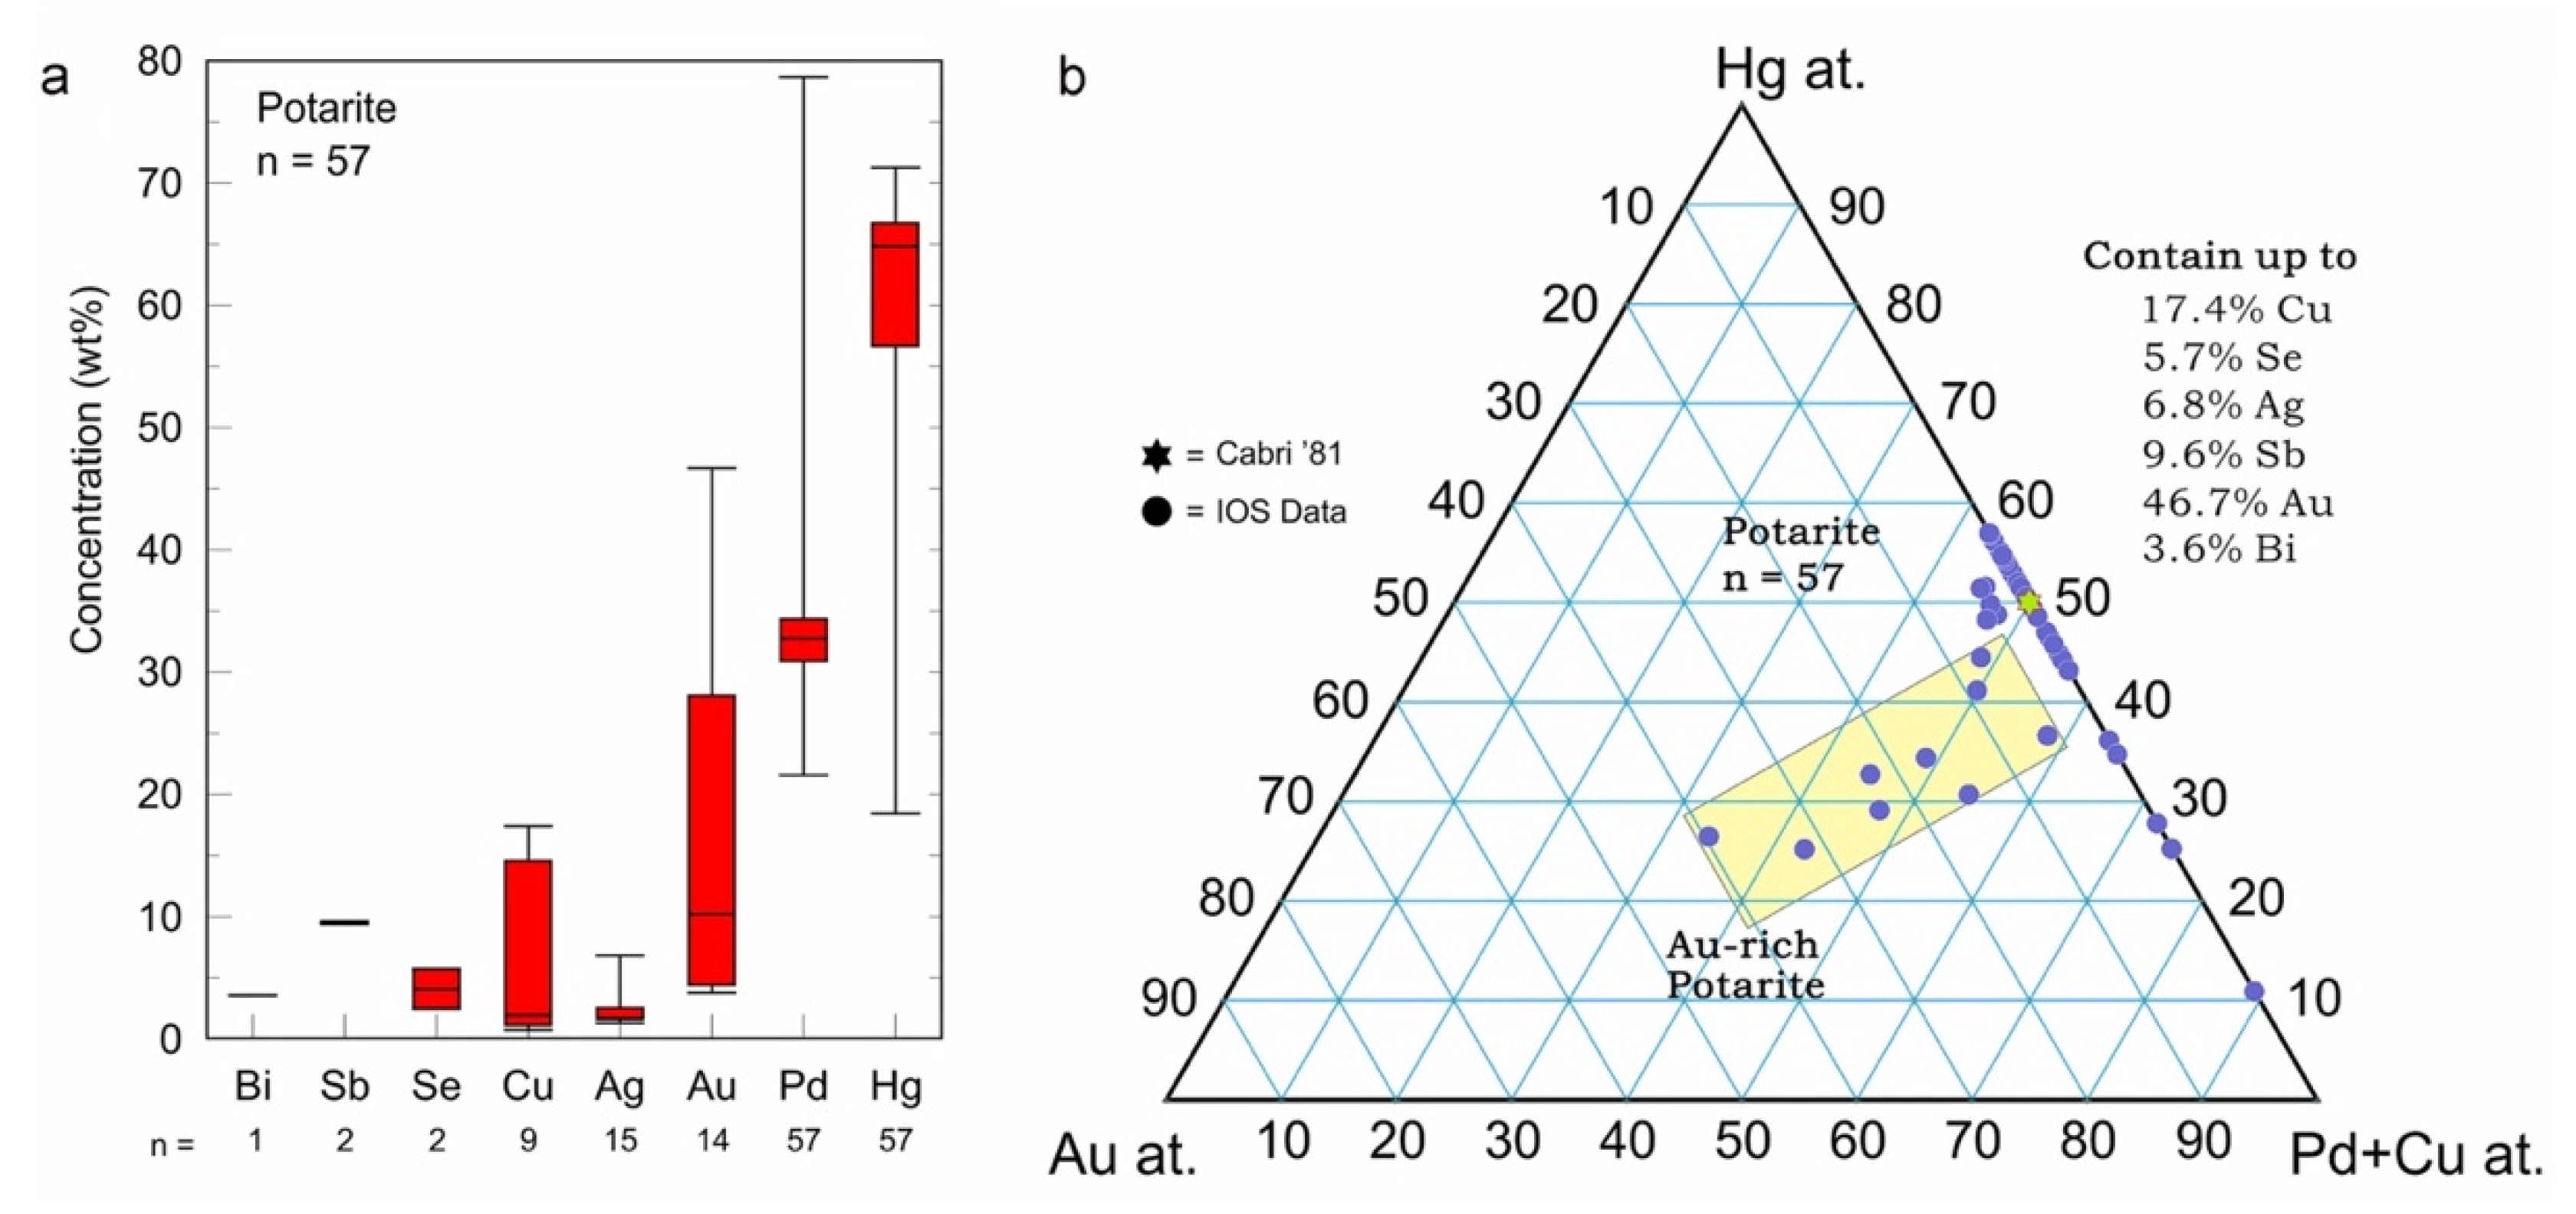
The IPGE PGM population mostly consists of Ru–Os disulfides of the laurite (RuS2; Figure 5f,g) and erlichmanite (OsS2; Figure 5h) series, which are ranked as the sixth most abundant PGM group in the database (72 grains: Figure 3). The Os-Ru-(Rh + Ir) ternary plot in Figure 12 shows that the composition of these 72 sulfide grains varies from pure erlichmanite through Ru-rich erlichmanite, Os-bearing laurite to laurite. However, pure laurite has not been found. A relatively Ir-rich erlichmanite was also detected (Figure 12). Box and whisker plots indicate that the Os content varies from ≥ 11.5 to ≤ 44.2 wt% in laurite (Figure 13a), whilst the range of Os for erlichmanite is from ≥ 35.2 to < 78.0 wt% (Figure 13b). Both minerals may contain < 10 wt% Ni and/or As. Erlichmanite is also characterized by 4.9 ≤ Ir < 39.0 wt%, 6.1 ≤ Ru ≤ 21.4 wt% and 16.3 ≤ S ≤ 29.0 wt%, whereas the ranges for laurite are as follows: 3.1 ≤ Ir < 20.5 wt%, 18.5 ≤ Ru ≤ 42.8 wt% and 25.6 ≤ S ≤ 38.0 wt% (Figure 13a,b).

3.2.5. Potarite

Potarite is a relatively abundant palladium amalgam (2.14% of the population, n = 57) recovered from till. Although it is ideally composed of Hg and Pd, various metals (e.g., Bi, Sb, Se, Cu, Ag, and Au; Figure 14a) can substitute for either of the major components. As the box and whisker plots show, Hg content varies over a wide range (≥18.4 to ≤71.2 wt%), though 50% of the grains contain ≥ 64.8 wt% Hg (Figure 14a). A large variation is also observed for Pd such that the minimum and maximum values measured are 21.6 and 78.7 wt%, respectively, whilst this variation for 50% of the grains varies from 30.8 to 34.1 wt% Pd (Figure 14a). Such kind of variation is typical of alloys that are not ruled by stoichiometric ratios. The Cu content can reach up to 17.4 wt%. Moreover, Au abundances in Au-bearing potarite range between ≥ 3.8 to ≤ 46.6 wt%, as measured in 14 grains such that in Hg-(Pd + Cu)-Au ternary plot, a field formed by Au-rich potarite is distinguishable (Figure 14b). The most Au-rich potarite (46.65 wt% Au, 21.6 wt% Pd and 31.7 wt% Hg) has been recovered from till samples collected from Nunavik area (Northern Quebec; Canada; Figure 15a) associated with abundant amalgamated gold grains and cinnabar.

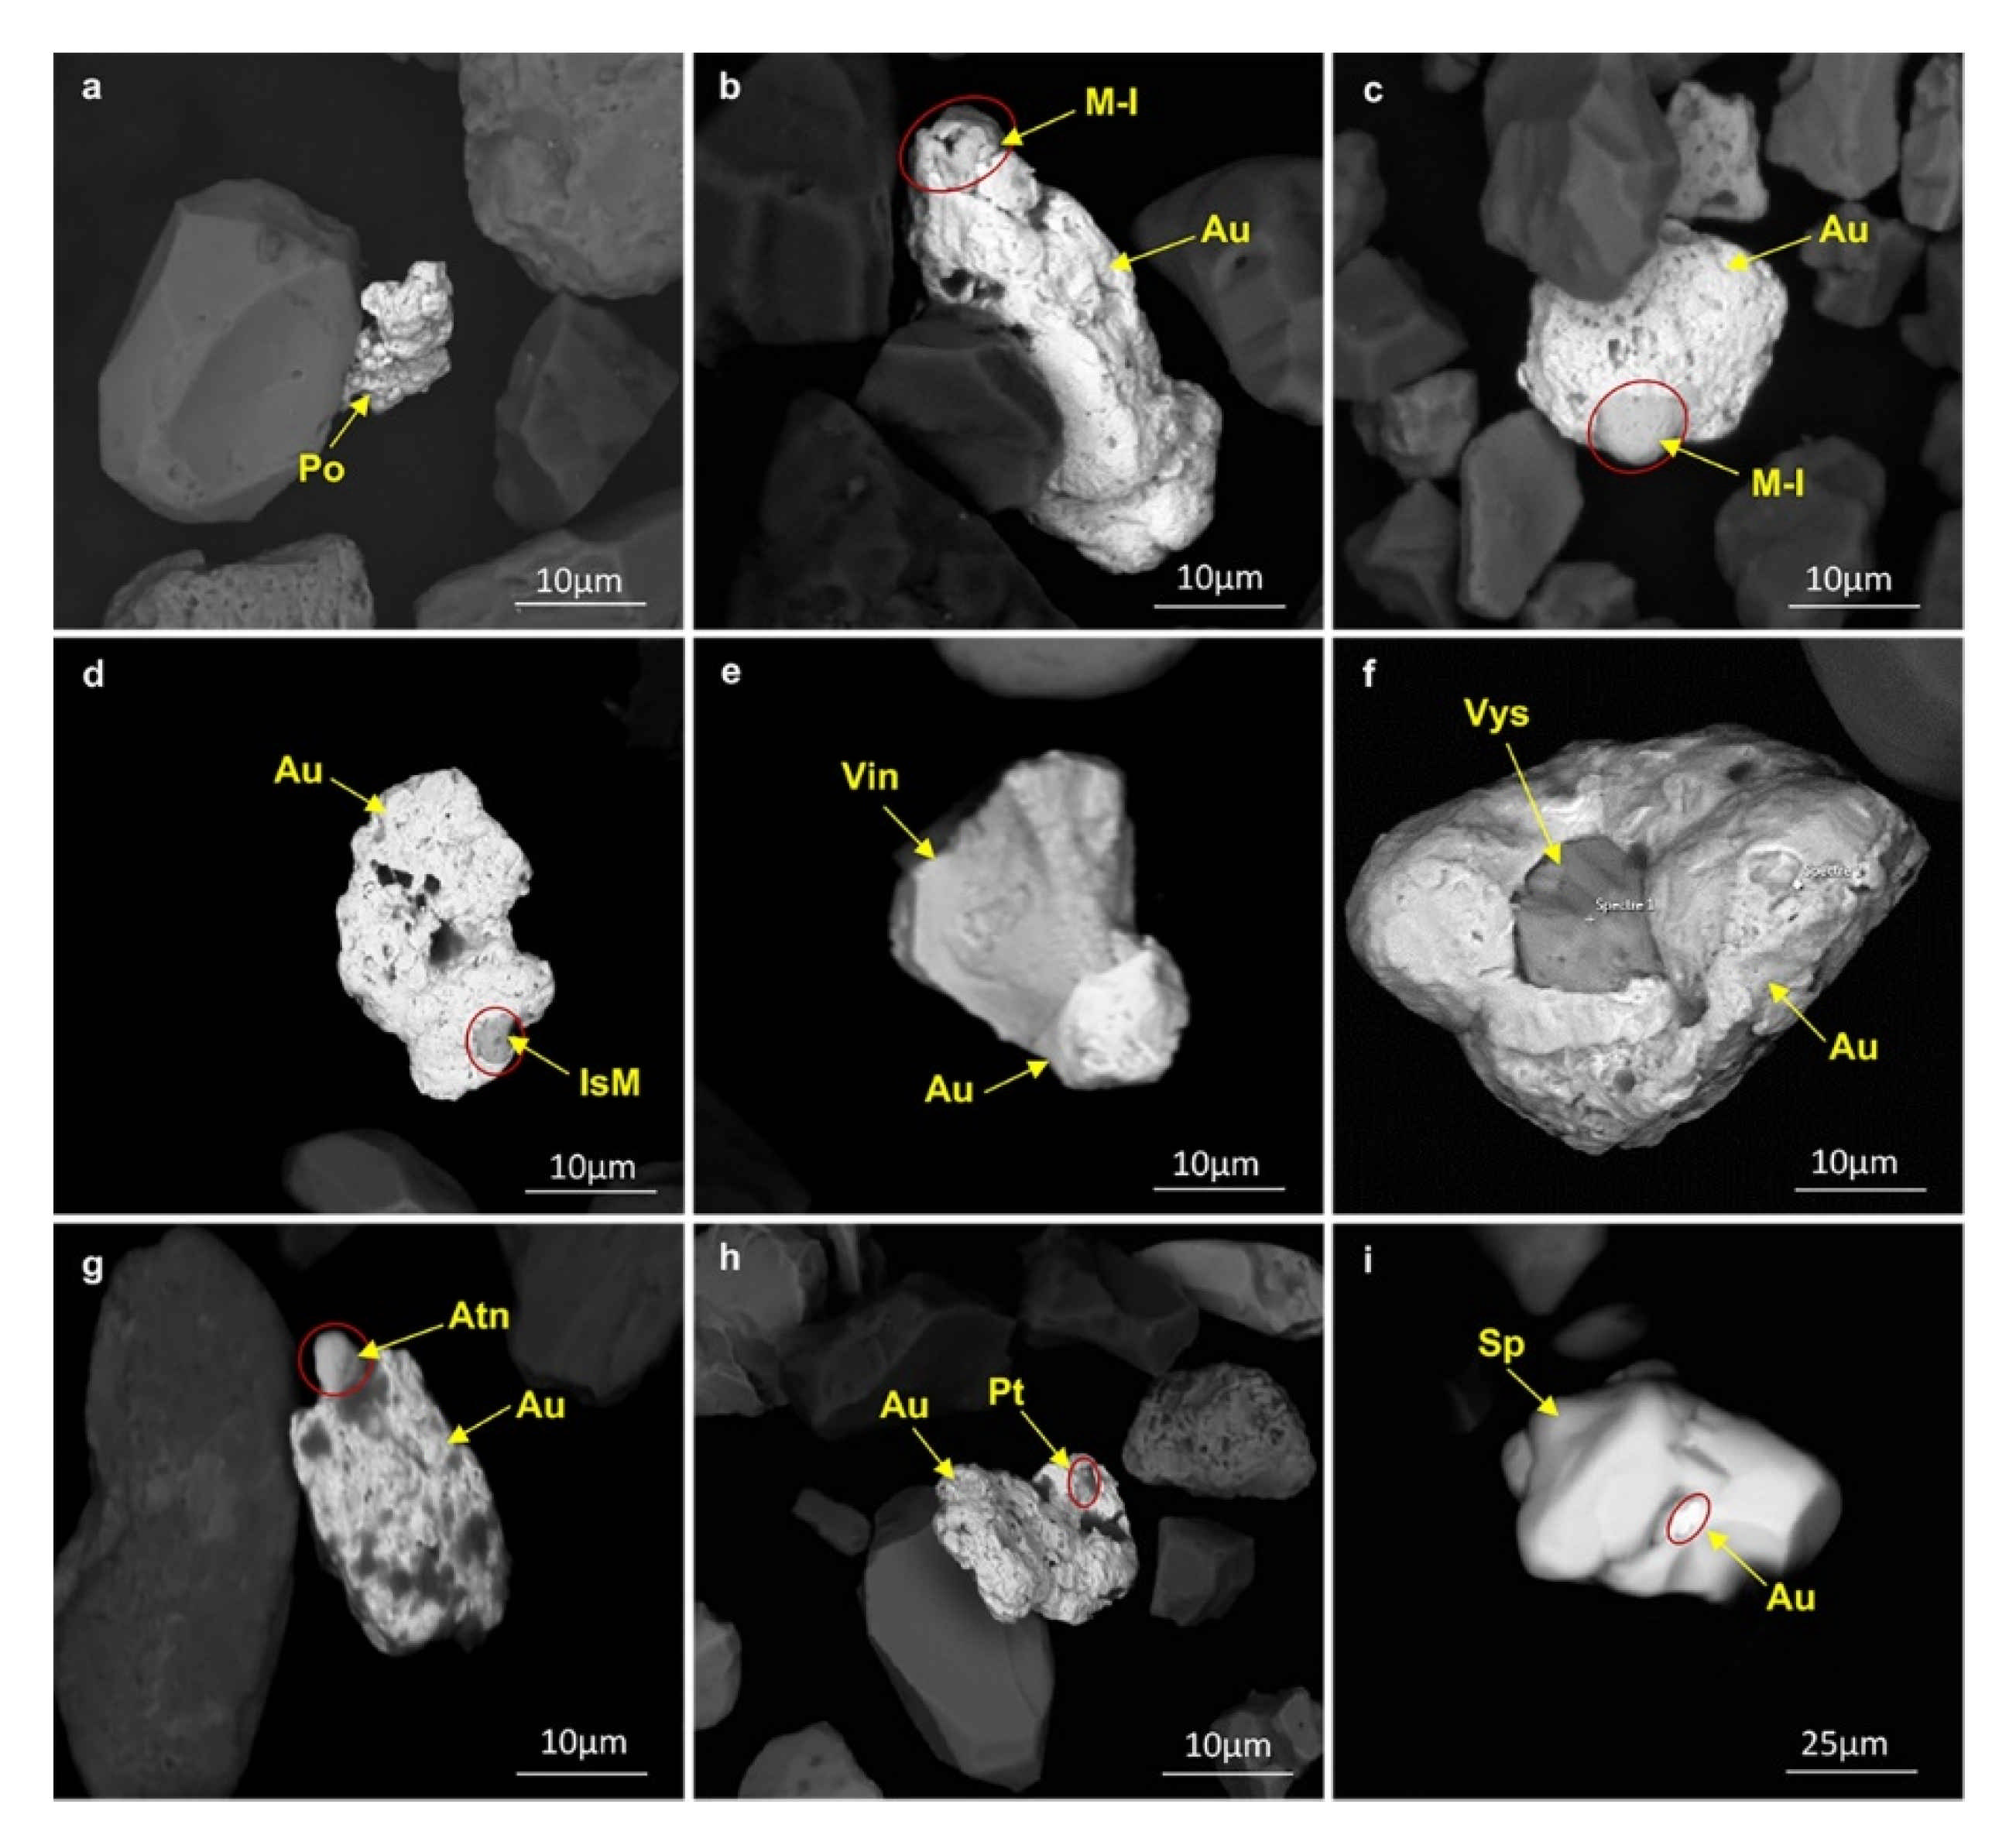
3.3. Gold Association and Polymineralic Occurrence of Platinum-Group Minerals

Platinum-group minerals are occasionally found in association with native gold (Figure 15) as well as grains made of complex PGM assemblages (Figure 16). Aside of potarite, among the other 57 PGM species identified in the till samples, seven species have been found associated, or as intergrowths with native gold grains. The majority of these belong to the isomertieite-mertieite series (Figure 15b–d). As a result, in three observations, mertieite-I grains seem partly encapsulated by Au. Other Au-PGM associations include isomertieite and platinum inclusions in gold (Figure 15d,h), fine-grained vincentite and atheneite attached to gold particles (Figure 15e–g), and a vysotskite grain partly enclosed by gold (Figure 15f). Figure 15i shows a very fine-grained gold grain that grown on the surface of a sperrylite. Furthermore, in a limited number of particles, polymineralic aggregates of PGMs are identified and characterized. Two phases aggregates include: (1) irarsite ((Ir,Ru,Rh,Pt)AsS) and sperrylite (Figure 16a); (2) Pt-rich irarsite and Ru-rich irarsite (Figure 16b); (3) rutheniridosmine (Ir,Os,Ru) with erlichmanite (Figure 16c); (4) rutheniridosmine (Ir,Os,Ru) with platarsite ((Pt,Rh,Ru)AsS) (Figure 16d); (5) platarsite and sperrylite (Figure 16e), and (6) a three-phase PGM in which sperrylite is surrounding hollingworthite ((Rh,Pt,Pd)AsS) and platarsite (Figure 16f). Sperrylite, comparing to the other PGE-bearing minerals, appears to be more often a component of polymineralic PGM aggregates (Figure 16a,e,f).

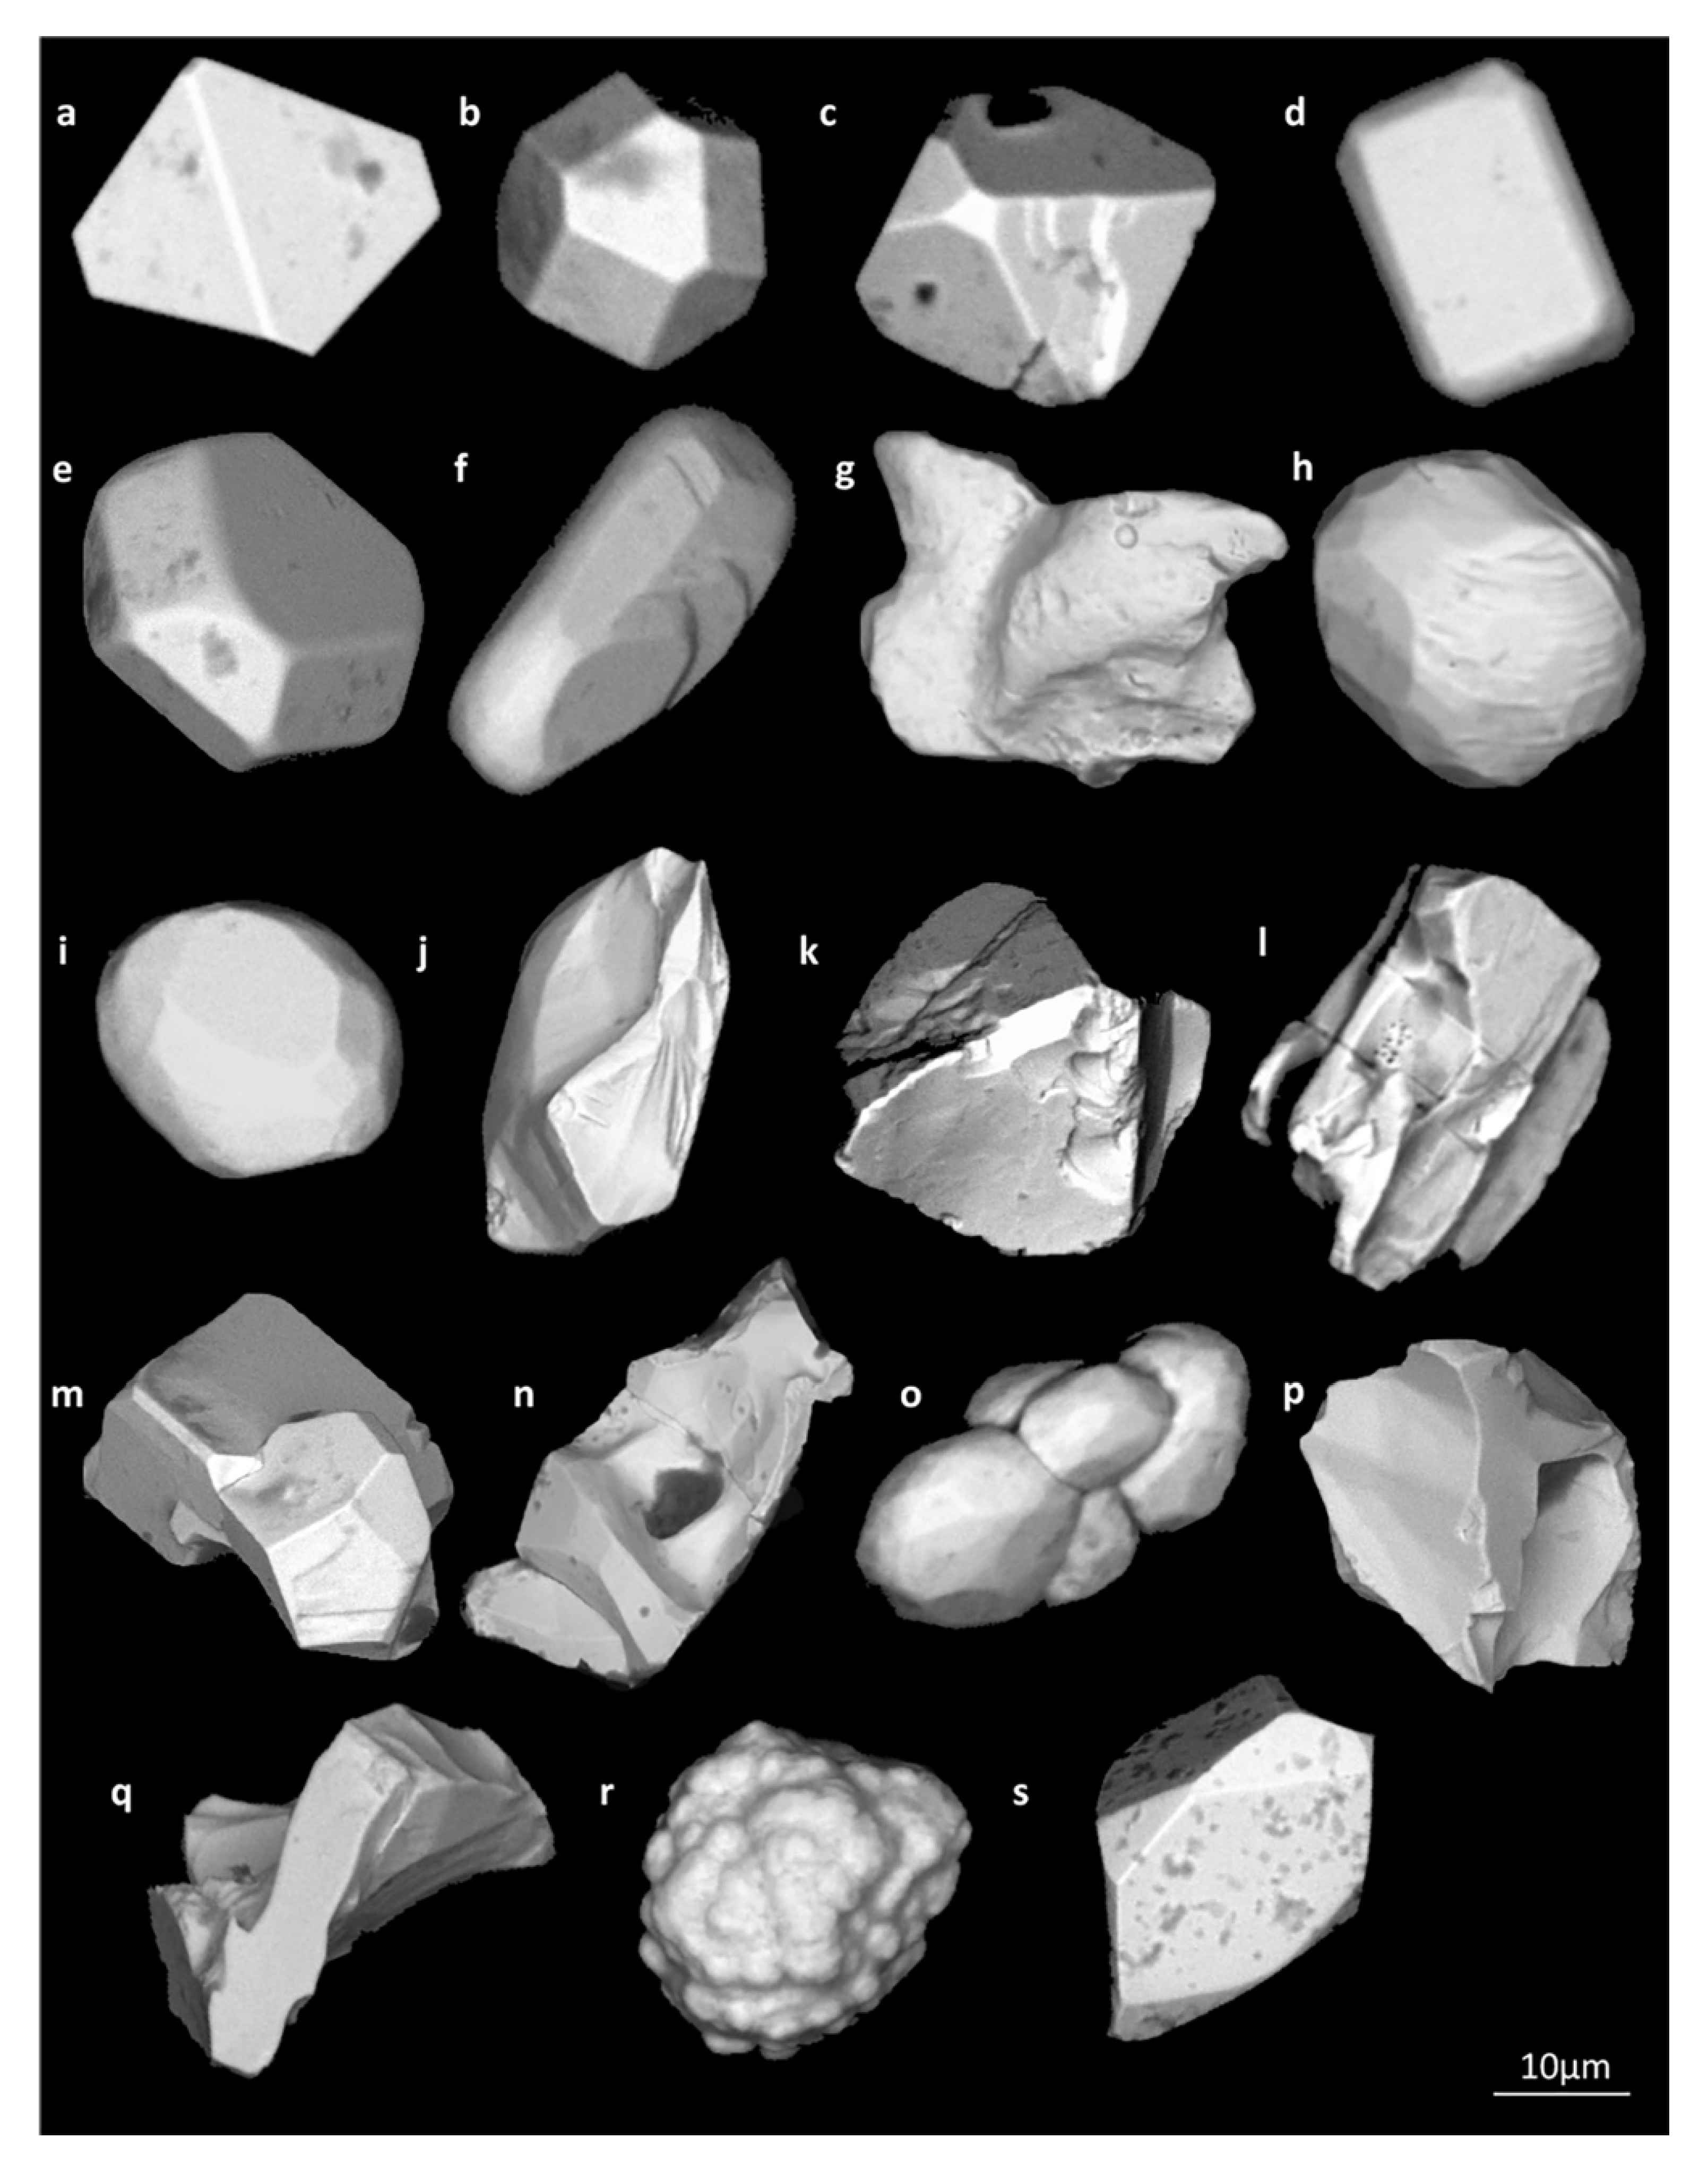
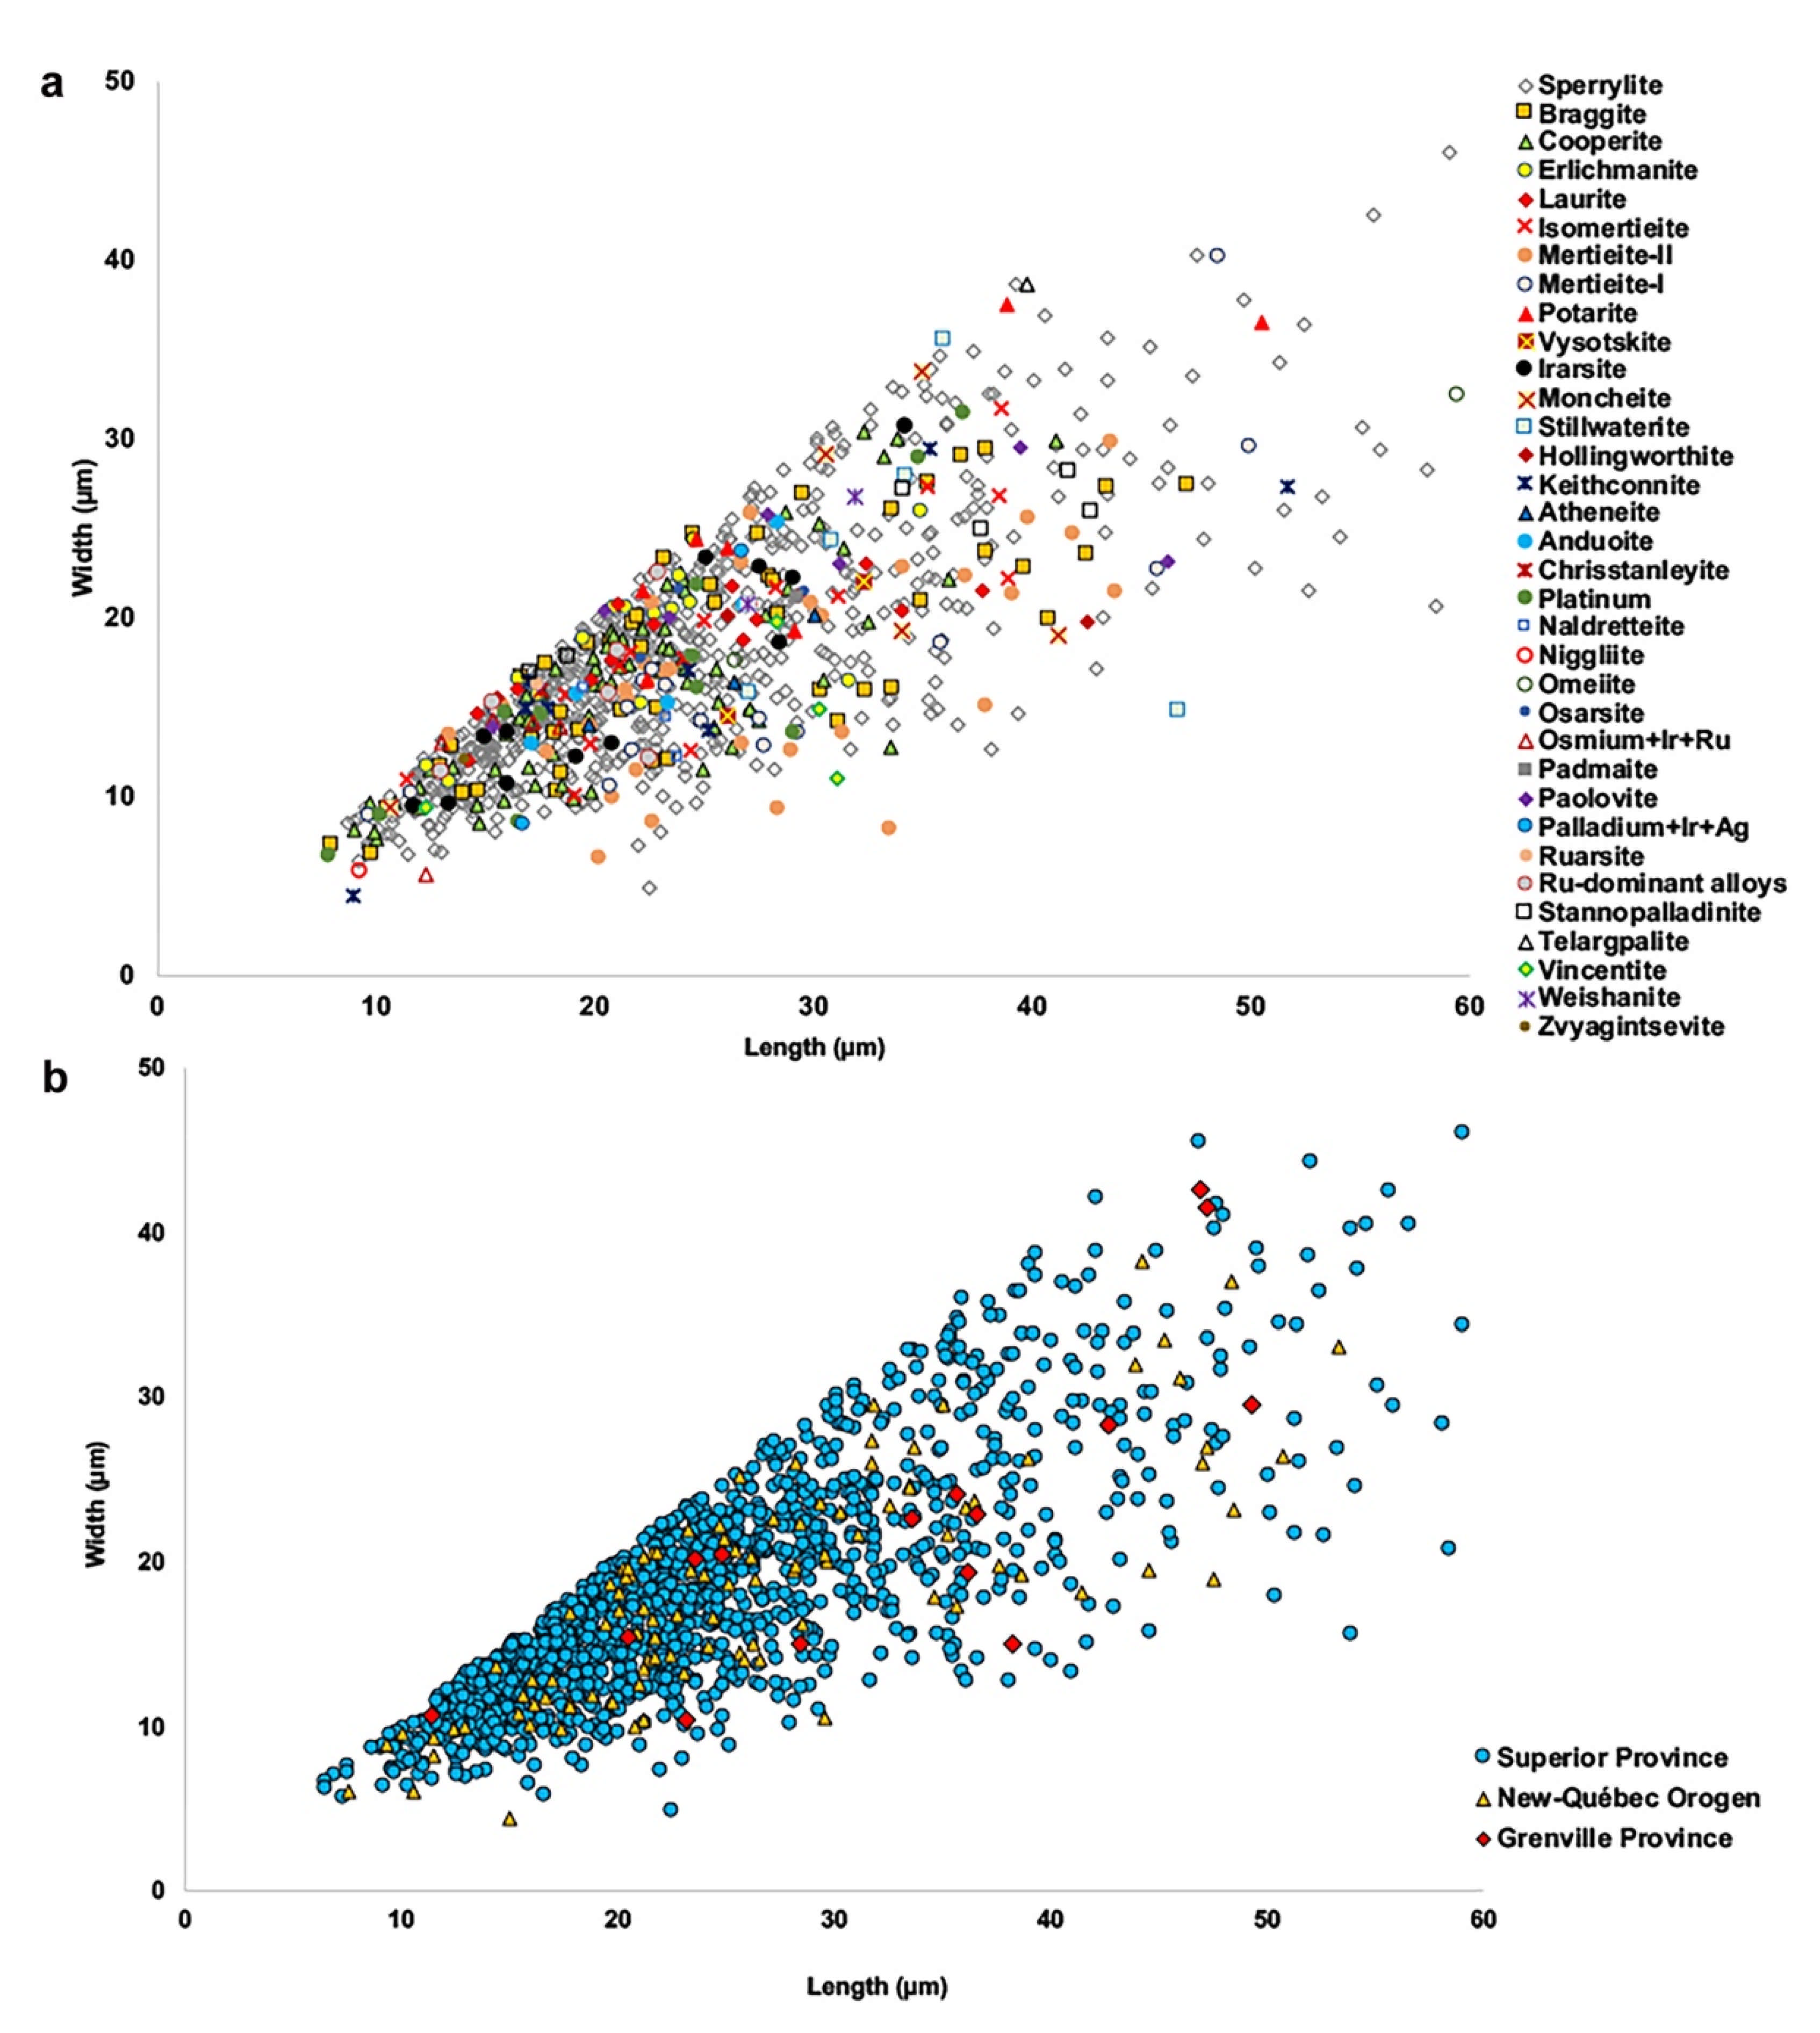
3.4. PGMs Shape, Grain Size Distribution, and Surface Texture in Till

Morphology of PGM grains is more likely influenced by their initial crystalline growth than post-erosion processes. Unlike metallic gold, which is malleable and the shape of which is expected to be modified during transport, morphologies of placer PGMs are reported to be diverse and resistant to mechanical modification [59]. While gold has a Vickers hardness number (VHN) of 30 to 60 (10 g load), platinum or palladium has a VHN of 300 to 340 (100 g load), and most PGMs have a VHN in the range of 500–3000 (25 to 100 g loads). Consequently, even PGM alloys do not abrade and preserve their original shapes. Some PGM can be brittle, and may fracture during the erosion process. At the most, edges may show some evidence of abrasion, the cause of which might but not necessarily be related to their transport. BSE images in Figure 17 shows a wide variety of morphologies and surface textures of till-hosted sperrylite, including: preserved original euhedral shape and angular edges (Figure 17a,d), semi-rounded edges (Figure 17e,f), rounded edges (Figure 17g–i), breakage surfaces (Figure 17j–l), monomineralic aggregates and/or twinned crystals (Figure 17l–o,r), intergranular textures (Figure 17p,q) that are possibly imposed by neighboring minerals during mineral growth, a botryoidal form (Figure 17r), and surfaces staining (Figure 17c,e,s). In spite of this diversity, as also illustrated in previous figures, the majority of PGMs retained their original shape, whilst mechanically induced damages on grains is limited to various types of shallow and deep fractures on their surfaces (e.g., linear and conchoidal fractures, straight and accurate grooves, crescentic gouges and troughs) [49,60]. It is uncertain if these damages were induced by erosion of the host material, or after their liberation from the host rock. Given the lack of information in the literature regarding surface textures and morphology of <50 µm PGM grains in till, it is difficult to correctly interpret the surface textures in relation to crystallization and subsequent erosional transport. Larger grains can be subject to more mechanical damage during transport (colliding with other grains) given their larger surface area.
Figure 17 shows that the edges of some sperrylite grains are variably abraded, which might develop during transport [61,62]. Detrital grains transported by glaciers, especially at the base of thick ice sheets, are expected to show high relief induced by fracturing [60]. In contrast, low and medium relief can be the result of abrasion during long-distance transport, reworking, and/or transport in mixed environments (e.g., glaciofluvial environments) [60]. No significant difference in PGM abundance is noted between the lodgment till where the material is encapsulated in impermeable compacted sediments, compared to the ablation till or other type of glacial sediments where the material has been in protracted contact with melt or groundwater. This suggest that chemical corrosion of grains induced by oxidation is limited, comparatively to sulfides for instances. Understanding the relation between abrasion texture and aqueous sedimentation requires a systematic investigation, which was not part of current project. Nevertheless, the surface textures and morphology of PGMs documented in this study are contrasting from those from intensely corroded and abraded PGM grains from beach and aeolian environments (e.g., platinum beach placers, southern New Zealand) [63].
The range of grain sizes of different PGM species (n = 963) recovered from till samples collected in a single project from the James Bay territory is illustrated in Figure 18a, the vast majority of which being in the 10 to 20 µm range. No marked difference is noted between mineral species. This range is comparable with the grain size distribution of all sperrylite grains (n = 1488) found in all studied samples from various geological settings (Figure 18b). Although there are some examples of research on placer PGMs in the literature, e.g., [56], the grain size and shape distribution of PGMs transported by glaciers have not yet been comprehensively researched, considering the difficulty to recover them in the course of routine analysis. The grain size distribution of samples prepared for automated SEM-based analyses are bound by instrumental limitations such that grains smaller than approximately 10 µm are commonly not efficiently recovered during gravimetric concentration (the fluidized bed recovery shows a collapse at about 20 µm; [4]), whereas grains larger than 50 µm are excluded at final sieving. In Figure 18a,b, the presence of grains with lengths larger than 50 µm may be explained by passing through the sieve from their smaller surface area (width). Nevertheless, most grains are relatively stubby, and complex shapes are rare (Figure 18). It can be interpreted that various mineral species show similar grain size distribution except for sperrylite being statistically larger (Figure 18a) but it could be better expressed because they are statistically more abundant. As a result, there is no significant grain size difference in sperrylite recovered from various regions, and thus potential source rocks.

4. Discussion

Detrital heavy indicator mineral grains are globally used to explore potential mineral deposits in up-stream/ice locations [8,33,64,65]. Previously, given poor efficiency of processing techniques, the PGMs could be rarely recovered from glacial sediments such that the presence of a couple of grains could indicate a nearby PGE mineralization [11,66]. Improvements in methods for recovery and recognition of precious metal minerals in unconsolidated sediments accompanied by recent advancements in analytical techniques have led to this study presenting a large mineralogical and chemical database of silt-sized PGM grains recovered from till sampled for gold exploration and not as traditionally for Ni-Cu-PGE deposits.
Although this study shows that sampling protocols developed for gold recovery from sediments and its geochemical characterization are also applicable to PGMs, as physicochemical characteristics of PGMs differ from gold, these protocols still need to be optimized for PGE exploration. For instance, PGMs hardness is higher than gold (2.5 in Mohs scale) contributing to their resistance to deformation and enhancing their fragility against mechanical forces. Consequently, the shape and morphology of PGMs will evolve differently from gold during transport, and therefore, the qualitative morphological classifications proposed for gold to estimate the distance of transport and proximity to the source [50] are not applicable in exploration for PGMs.
Oberthür [67] investigated the behavior of PGMs in the exogenic environment and showed that different PGMs react differently to the weathering process such that Pt-bearing minerals, sperrylite in particular, show much higher rates of survival compared to Pd-bearing phases. However, this study indicates rare occurrence of Pd-bearing minerals as inclusions in other mineral phases or with corroded surfaces, which can suggest limited destruction of these in the glacial environment. Based on the literature, postglacial weathering may change chemical and mineralogical composition of till in oxidation zones (e.g., decomposition of sulfides) causing depletion or enrichment of metal contents in soil in comparison to un-weathered till [68,69,70]. The given phenomenon has not been recorded in this study since sampling of oxidized material have been avoided, and C-horizon till supposedly provides an unimpeded signal of clastic glacial dispersal that is least affected by weathering. Therefore, the result of processing of 5194 till samples shows a similar frequency of occurrence of PGMs in < 50 µm HMC from different types of till samples, regardless to their contact with oxidizing ground water.

4.1. Origin of Platinum-Group Minerals in Till

Discussing the metallogenic significance of 58 different PGM species found in till is difficult, especially considering that these minerals are free grains detached from their source rocks, and the mineral composition of the sediments has not been assessed. No efforts have been made yet as to locate the source of these PGMs in the studied areas. Thus, concluding that they must originate from some ultramafic rocks is not supported by any evidence yet.
Sperrylite is by far the most common PGM recovered in this study, as well as been reported as abundant in many other studies [8,71,72]. However, sperrylite abundance will not differentiate between PGE-bearing deposit types as it is observed in a great variety of settings, from reef-type to PGE-rich base metal sulfide occurrences, to layered intrusions chromitites through ophiolitic chromitites [73]. The same limitations apply to the cooperite-braggite series regarding geological settings. As these two groups of minerals (sperrylite and cooperite-braggite) represent almost 75% of the entire dataset obtained from the till samples, it is difficult to interpret the sources of these minerals. The platinum-group minerals belonging to the arseno-antimonide series isomertieite-mertieite represent altogether 6% of the PGM population recovered in this study. Like the aforementioned minerals, the presence of mertieite in till is not also discriminant for any specific deposit type [73]. Minerals from the laurite-erlichmanite series and the IPGE alloys (4.2%) can possibly be used as diagnostic minerals. It is true that these minerals are generally associated with ultramafic source rocks in general, and to chromite-rich rocks in particular, these settings are not exclusive.
Figure 19 and Figure 20 show the distribution of the most abundant identified PPGE PGMs in the studied samples including sperrylite, braggite, cooperite, isomertieite, mertieite-I, and mertieite-II in the (Pt at. + Pd at. + Rh at.) vs. (S at. + As at.) biplot, and IPGE PGMs including anduoite, erlichmanite, laurite, and irarsite in the (Ru at. + Os at. + Ir at.) vs. (S at. + As at.) biplot. As a result, PPGE PGM species from different geological settings show almost similar range of compositions of the analyzed elements (Figure 19). In contrast, the distribution of IPGE PGMs is mainly limited to the samples collected from the Superior Province (Figure 20). As mentioned earlier, grains < 50 µm face limitations imposed by the beam size for analysis by LA-ICP-MS in order to characterize their trace element signature. Hence, given that samples from the Superior Province come from various sub-provinces including La Grande, Eastern Abitibi, Western Abitibi, Nemiscau, Opinaca, Assinica Greenstone belt, Wawa Greenstone belt, Quetico Greenstone belt, and the Otish basin, mineral-chemical characterization of PGMs in potential host rocks is required to reveal whether the similar chemistry of the grains indicates the same type of mineralization or simply demonstrates incapability of major and minor elements in provenance discrimination of detrital PGMs.
Nevertheless, the ubiquity of PGM and the paucity of ultramafic rocks in the Superior Province suggest that other source types may be involved. The dominance of PPGE PGMs over IPGE PGMs, in which the latter are demonstrated as preferentially derived from chromitites [74], further supports this hypothesis. This suggests that a proportion of PGMs occurring in the till are rather related to non-ultramafic sources, such as to hydrothermal events rather than being concentrated by early, high-temperature, magmatic processes [73]. This is supported by the occurrence of minor amount of platinum and palladium as alloying metal in gold grains and which could have been transported, as gold, by hydrothermal mineralization events ([73] and references therein).
Inversely, this study establishes a common relation between PGM and gold grains in the till, suggesting that PGMs might be used as indicator minerals for gold, and simply added to automated SEM analyses done for gold. Sites where till samples contain gold grains enriched in Hg also contain potarite (PdHg), Au-rich potarite, and palladian-weishanite (Pd ± PtAuHg). In addition, the presence of PGMs attached to, or partly included in, gold particles and the presence of Au-Ag-bearing PGMs and Au-rich PGMs in the till samples clearly indicates an association of PGE and gold. Although Au-PGE mineralization is poorly documented in the existing literature, the apparently atypical PGM population shown in this study could be commonly associated with gold mineralization [75].

4.2. Suggestions for PGM Exploration

The methodology to detect rare PGM in glacial sediments from eroded source rocks used in this study works equally well for barren/mineralized terrains with respect to PGE. Till mineralogy can thus be used as exploration tools to target PGE-enriched sources such as reef-type, PGE-rich Ni-Cu sulfide deposits or PGE-rich chromitites, without the need to rely upon proxies such as magnesian silicates, chromian spinels, or nickel sulfides. Since mineral-based methods enable far lower detection limits than chemical analysis, the method is expected to be far more sensitive than any assay-based method. The difficulty in tracking a particular type of deposit comes from the diversity of PGM species found in each deposit types, even at the sample scale [76,77,78]. Another difficulty arises from the diversity of PGM assemblages that seems to reflect the host lithologies more than the deposit type (the PGM assemblage of the silicate-rich facies differs from the PGM assemblage of the chromite-rich facies within the Merensky Reef, wherein variations occur within meters) [77]. Furthermore, the level of complexity is increased considering the morphological and chemical variations induced on these minerals in the secondary environment, variations that will differ from mineral species to species. The benefit of this method is that PGE-bearing minerals are recovered alongside with gold grains, without necessitating the use of a specific analytical method, and can thus be included in integrated surveys.
It is clear that the analytical protocol presented here allows its use for the exploration of PGE-rich mineralization. Although, to clearly benefit of its use, particular case studies should be performed: (i) to compare the PGM assemblage from the deposit source rocks with the PGM population recovered from the till samples, (ii) to compare the PGMs abundance between the source rocks and the till samples, (iii) to verify if the PGMs are texturally and chemically modified in a secondary environments, and (iv) to specify an appropriate sampling pattern and sample size for PGM density and dispersion, appropriate for PGE-rich mineralization.

5. Conclusions

This study is the first one presenting a large mineralogical and chemical database of platinum-group minerals (n = 2664) recovered from < 50 µm heavy mineral fraction of till samples. It also presents a comprehensive methodology for pre-concentration and efficient recovery of precious metal minerals (PMM) from sediment samples, and preparing suitable sub-samples for characterization by automated SEM-based analytical techniques. The BSE images demonstrating shape, morphology, and surface textures of PGMs as well as geochemical data reported in this study provide a basis for future automated mineralogy case studies of till for exploration for PGE-rich resources in glaciated terrain of Canada and elsewhere. This study’s results can also be used for comparison with geochemical characteristics of PGMs in host magmatic and/or hydrothermal ore systems in order to establish mineral-chemical exploration models. Moreover, the major findings of this study include:
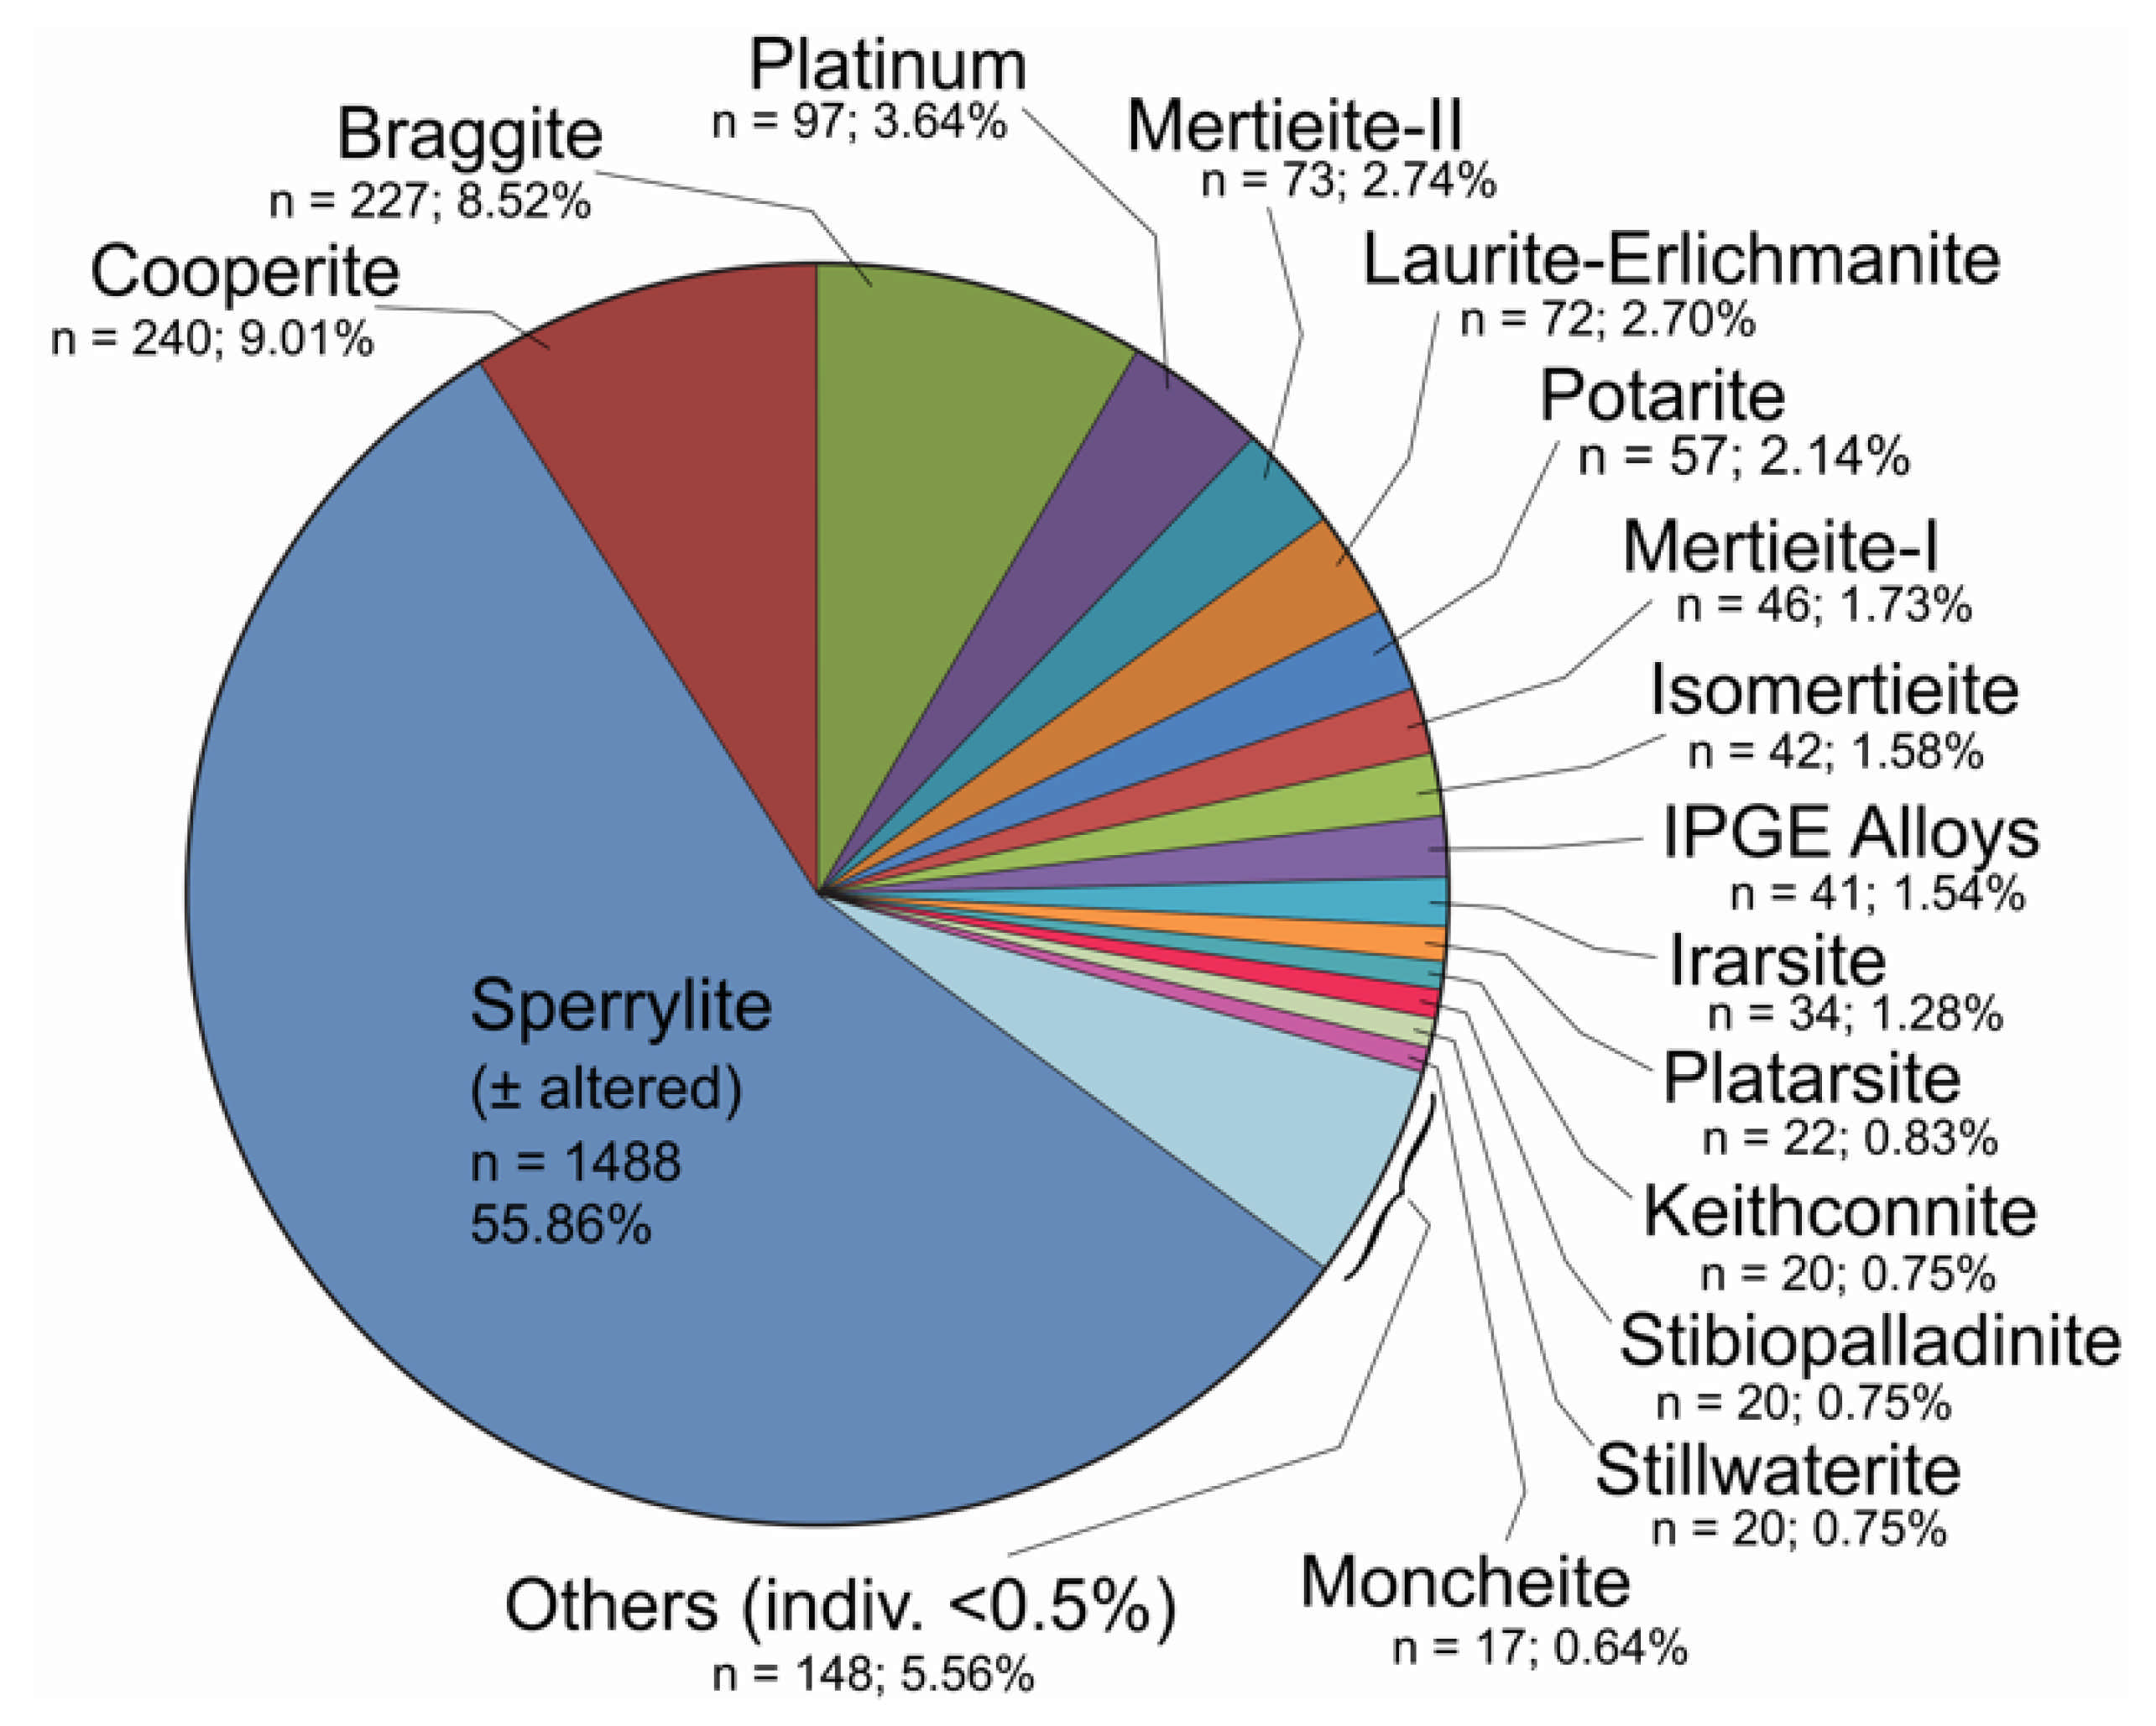
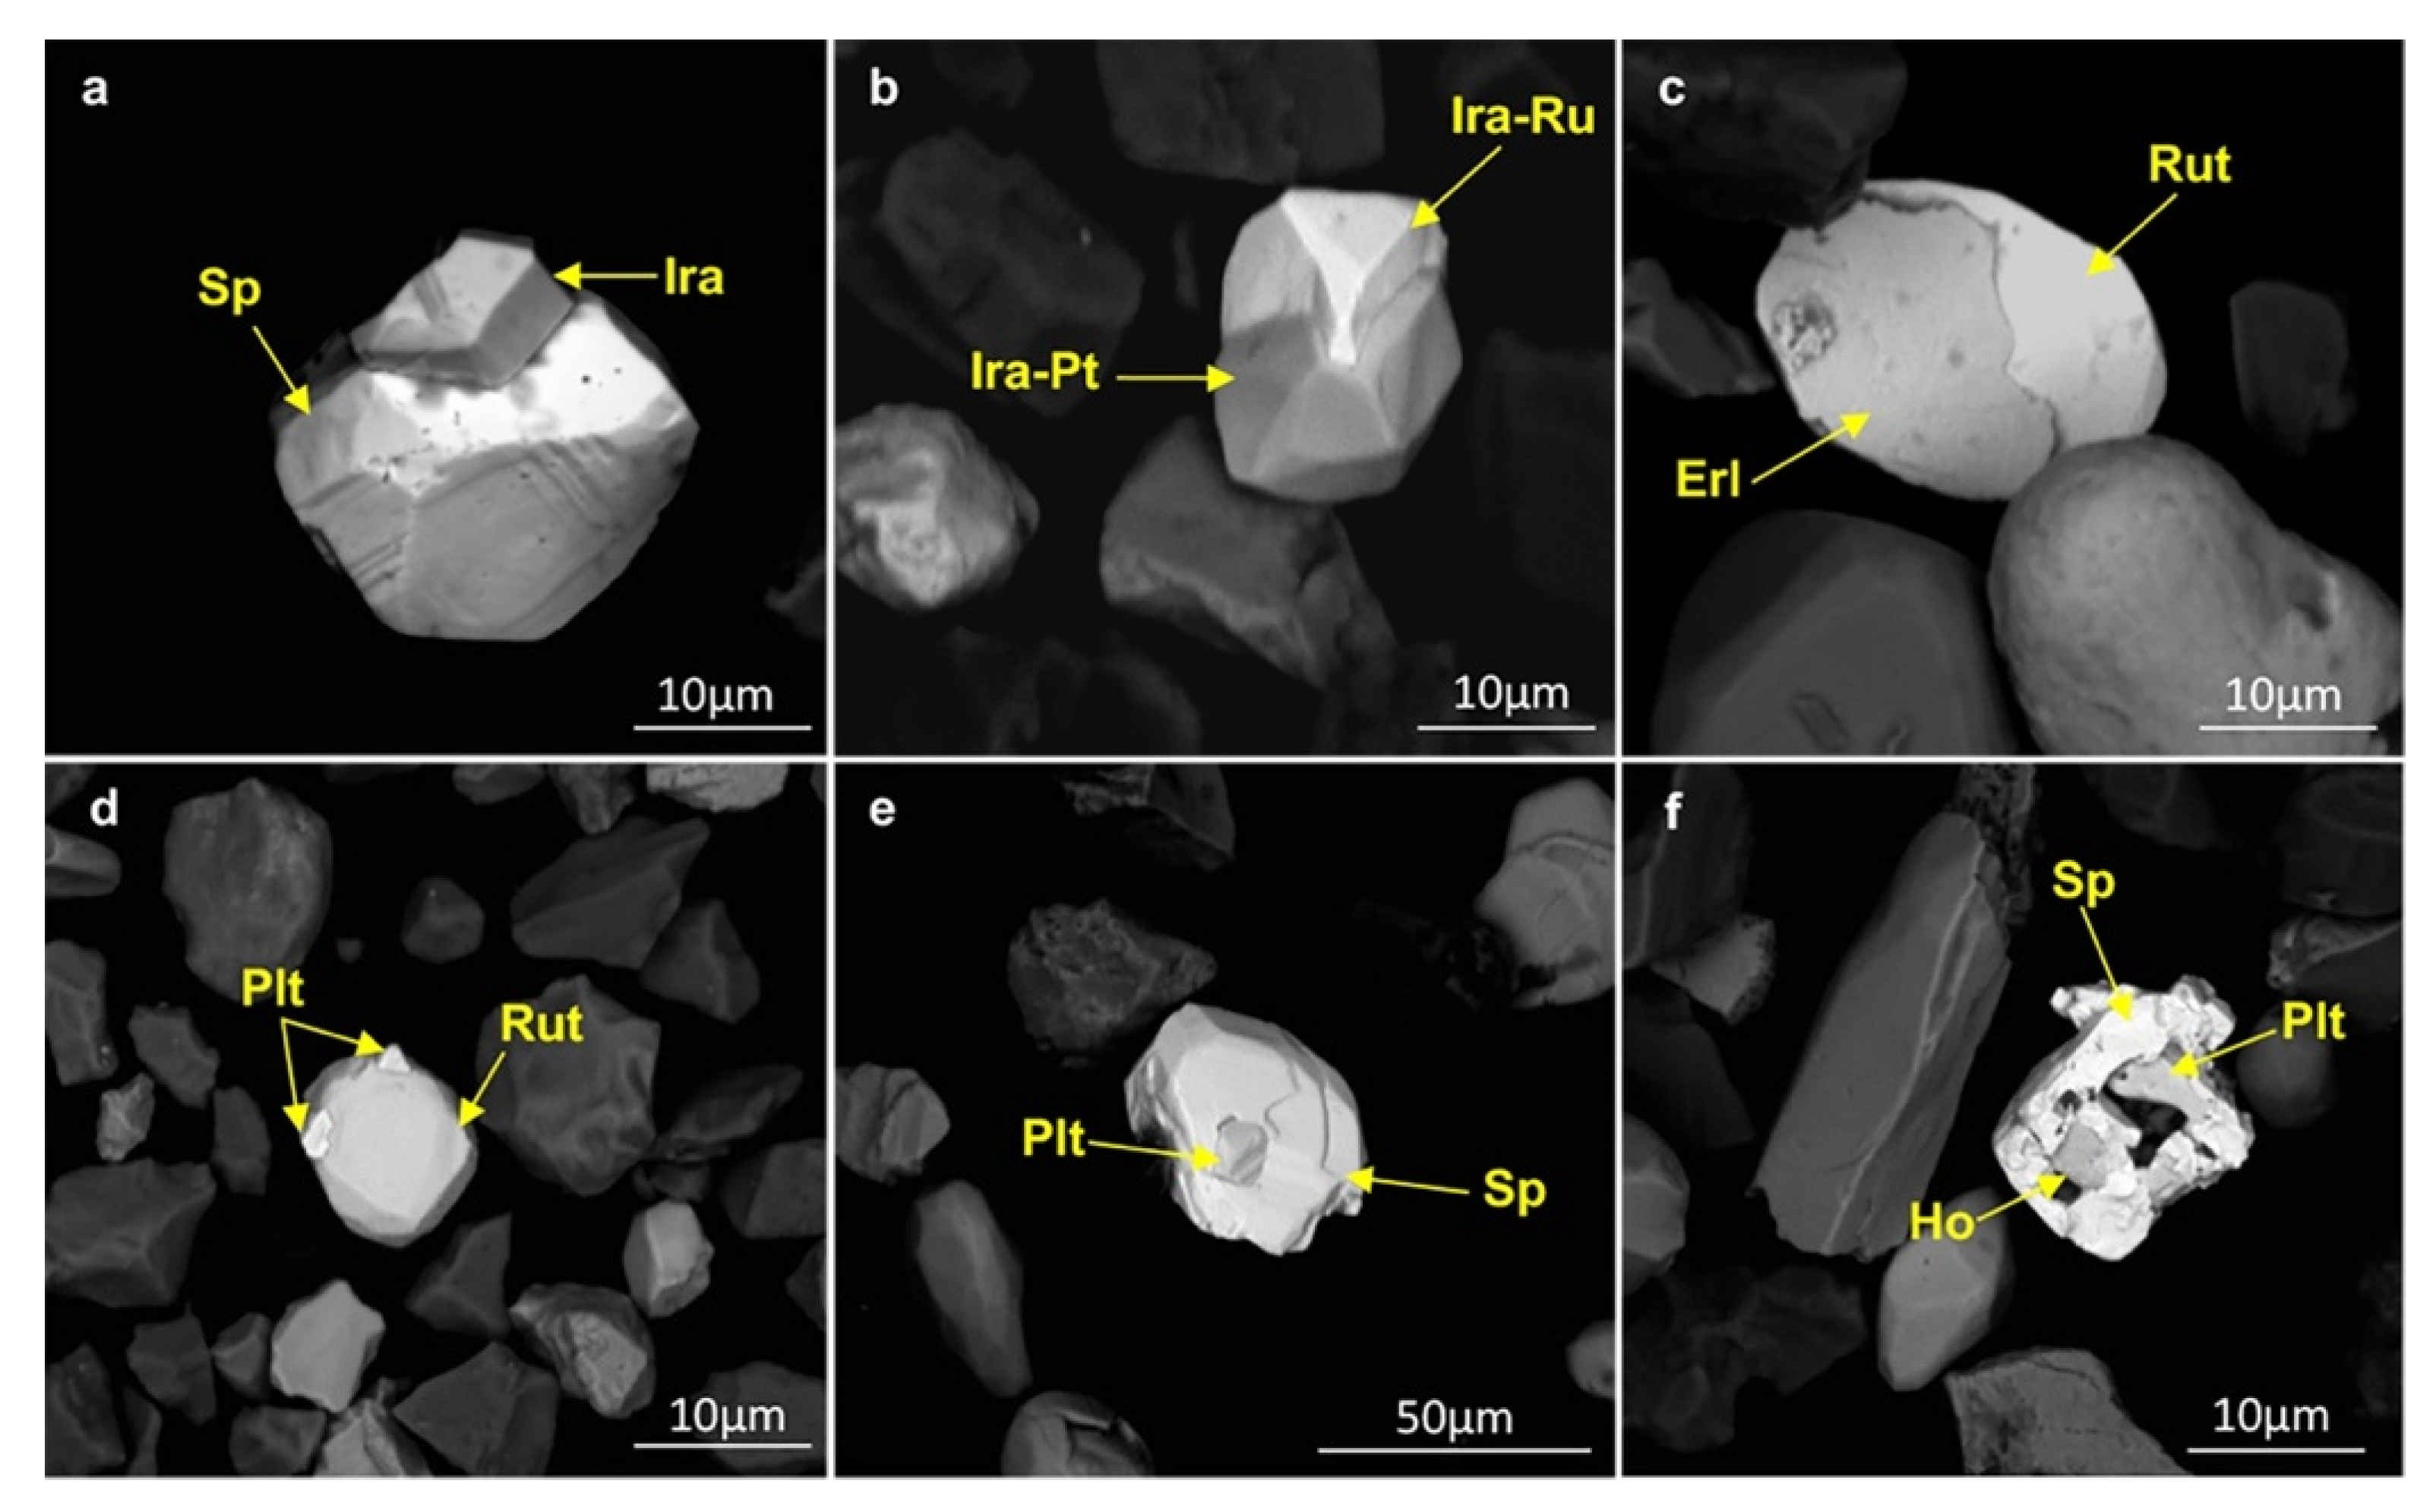
  • Fifty-eight different PGM species have been identified. Sperrylite is the most abundant PGM (55.86%; n = 1488;) followed by cooperite (9.01%; n = 240), braggite (8.52%; n = 227), Pt-dominated minerals (3.64%; n = 97), mertieite-II (2.74%; n = 73), laurite-erlichmanite (2.70%; n = 72), potarite (2.14%; n = 57), mertieite-I (1.73%; n = 46), isomertieite (1.58%; n = 42), Os ± Ir ± Ru-dominated alloys (1.54%; n = 41), and irarsite (1.28%; n = 34).
  • Our observations indicate an equal chance of PGMs occurrence in different types of till, including basal, melt-out, and reworked. This may suggest lower rates of chemical alteration in glaciated environments resulting in stability and better preservation of different PGM species. This hypothesis can be supported by mainly intact surfaces of recovered PGMs.
  • Gold-rich potarite grains and the occurrence of PGMs e.g., mertieite-I, isomertieite, vincentite, and vysotskite in gold-dominated aggregates likely suggest crystallization of at least part of recovered PGMs in Au-rich systems.

Author Contributions

Conceptualization, R.G., P.P. and S.M.; validation, S.M. and P.P.; formal analysis, S.M., P.P. and J.T.; investigation, S.M. and P.P.; writing, S.M., P.P., R.G. and J.T.; project administration, J.T. and R.G.; funding acquisition, R.G. All authors have read and agreed to the published version of the manuscript.

Funding

This research received no external funding.

Data Availability Statement

Data available on request due to restrictions. The data presented in this study are available on request from the corresponding author. The data are not publicly available because these projects are not disclosed in order to preserve the rights of the clients of IOS Services Géoscientifiques.

Acknowledgments

N. Fournier (IOS, laboratory manager), P. Villeneuve (IOS, quaternary geologist), A. Neron (IOS, research scientist), H. Longuepée (IOS-Senior scientist), K. Gagné (IOS-quality control) and M.O. Chartier (IOS, data management) for their technical support. D.H.C. Wilton (MUN) and G. Thompson (CNA) are also thanked for invitation to contribute to this special issue and for editorial handling. Anonymous reviewers are thanked for their constructive comments that improved the manuscript considerably.

Conflicts of Interest

The authors being professional scientists or general manager (Girard) with IOS Services Géoscientifiques Inc., which is a commercially operated laboratory. They participated in the development of the analytical procedure assessed in this study and were involved in the design of the study, the analysis, and interpretation of data, and in the writing of the manuscript.

References

  1. Goldfarb, R.J.; Marsh, E.E.; Monecke, T. The Challenge of Finding New Mineral Resources: Global Metallogeny, Innovative Exploration, and New Discoveries. Soc. Econ. Geol. 2010, 15. [Google Scholar] [CrossRef]
  2. Jackson, S.E. Mineral Chemistry: Modern Techniques and Applications to Exploration. In The Association of Applied Geochemists Workshop B: Indicator Mineral Methods in Mineral Exploration; Geological Survey of Canada: Fredericton, NB, Canada, 2009; p. 123. [Google Scholar]
  3. McClenaghan, M.B. Indicator mineral methods in mineral exploration. Geochem. Explor. Environ. Anal. 2005, 5, 233–245. [Google Scholar] [CrossRef] [Green Version]
  4. Girard, R.; Tremblay, J.; Néron, A.; Longuépée, H.; Makvandi, S.; Bédard, P. Automated Gold Grain Counting. Part 2: What a Gold Grain Size and Shape Can Tell! Minerals 2020, in press. [Google Scholar]
  5. McClenaghan, M.B.; Kjarsgaard, B.A. Indicator mineral and geochemical methods for diamond exploration in glaciated terrain in Canada. Geol. Soc. Lond. Spec. Publ. 2001, 185, 83–123. [Google Scholar] [CrossRef]
  6. McClenaghan, M.B.; Kjarsgaard, B.A. Indicator mineral and surficial geochemical exploration methods for kimberlite in glaciated terrain: Examples from Canada. In Mineral Deposits of Canada: A Synthesis of Major Deposit-Types, District Metallogeny, the Evolution of Geological Provinces, and Exploration Methods; Goodfellow, W.D., Ed.; Special Publication No. 5; Geological Association of Canada, Mineral Deposits Division: St. John’s, NL, Canada, 2007; pp. 983–1006. [Google Scholar]
  7. Malkovets, V.G.; Rezvukhin, D.I.; Belousova, E.A.; Griffin, W.L.; Sharygin, I.S.; Tretiakova, I.G.; Gibsher, A.A.; O’Reilly, S.Y.; Kuzmin, D.V.; Litasov, K.D.; et al. Cr-rich rutile: A powerful tool for diamond exploration. Lithos 2016, 265, 304–311. [Google Scholar] [CrossRef]
  8. McClenaghan, M.B.; Cabri, L.J. Review of gold and platinum group element (PGE) indicator minerals methods for surficial sediment sampling. Geochem. Explor. Environ. Anal. 2011, 11, 251–263. [Google Scholar] [CrossRef]
  9. McClenaghan, M.B.; Peter, J.M. Till geochemical signatures of volcanogenic massive sulphide deposits: An overview of Canadian examples. Geochem. Explor. Environ. Anal. 2016, 16, 27–47. [Google Scholar] [CrossRef]
  10. McClenaghan, M.; Parkhill, M.; Pronk, A.; Seaman, A.; McCurdy, M.; Leybourne, M. Indicator mineral and geochemical signatures associated with the Sisson W–Mo deposit, New Brunswick, Canada. Geochem. Explor. Environ. Anal. 2017, 17, 297–313. [Google Scholar] [CrossRef]
  11. Averill, S.A. Viable indicator minerals in surficial sediments for two major base metal deposit types: Ni–Cu-PGE and porphyry Cu. Geochem. Explor. Environ. Anal. 2011, 11, 279–291. [Google Scholar] [CrossRef]
  12. Lael, R.L.; Killen, K. Pressure of shortage-Platinum policy and the Wilson administration during World War I: The Business. Hist. Rev. 1982, 56, 545–558. [Google Scholar] [CrossRef]
  13. Zientek, M.L.; Loferski, P.J.; Parks, H.L.; Schulte, R.F.; Seal, R.R. Platinum-Group Elements, Chapter N. In Critical Mineral Resources of the United States—Economic and Environmental Geology and Prospects for Future Supply; Schulz, K.J., DeYoung, J.H., Seal, R.R., Bradley, D.C., Eds.; U.S. Geological Survey (USGS): Reston, VA, USA, 2017; USGS Professional Paper 1802: N1–N91. [Google Scholar]
  14. Chou, C.L. Fractionation of siderophile elements in the Earth’s upper mantle. In Proceedings of the 9th Lunar and Planetary Science Conference 1978, Houston, TX, USA, 13–17 March 1978; pp. 219–230. [Google Scholar]
  15. O’Driscoll, B.; González-Jiménez, J.M. Petrogenesis of Platinum Group Minerals. Rev. Miner. Geochem. 2016, 81, 489–578. [Google Scholar] [CrossRef] [Green Version]
  16. Daltry, V.D.C.; Wilson, A.H. Review of platinum-group mineralogy: Compositions and elemental associations of the PG-minerals and unidentified PGE-phases. Miner. Petrol. 1997, 60, 185–229. [Google Scholar] [CrossRef]
  17. Barnes, S.-J.; Prichard, H.M.; Cox, R.A.; Fisher, P.C.; Godel, B. The location of the chalcophile and siderophile elements in platinum-group element ore deposits (a textural, microbeam and whole rock geochemical study): Implications for the formation of the deposits. Chem. Geol. 2008, 248, 295–317. [Google Scholar] [CrossRef]
  18. Barnes, S.-J.; Ripley, E.M. Highly siderophile and strongly chalcophile elements in magmatic ore deposits. Rev. Miner. Geochem. 2016, 81, 725–774. [Google Scholar] [CrossRef]
  19. Song, X.; Wang, Y.; Chen, L. Magmatic Ni–Cu-(PGE) deposits in magma plumbing systems: Features, formation and exploration. Geosci. Front. 2011, 2, 375–384. [Google Scholar] [CrossRef] [Green Version]
  20. Sutcliffe, R.H.; Sweeny, J.M.; Edgar, A.D. The Lac des Iles Complex, Ontario: Petrology and platinum-group-elements mineralization in an Archean mafic intrusion. Can. J. Earth Sci. 2011, 26, 1408–1427. [Google Scholar] [CrossRef]
  21. Lightfoot, P.C.; Naldrett, A.J. Proceedings of the Sudbury-Noril’sk Symposium; Special Publication Issue 5; Ontario Geological Survey: Greater Sudbury, ON, Canada, 1994; p. 457.
  22. Bédard, J.H.; Pagé, P.; Bécu, V.; Schroetter, J.-M.; Tremblay, A. Overview of the geology and Cr-PGE potential of the Southern Québec Ophiolite Belt. In Mineral Resources of Canada: A Synthesis of Major Deposit-Types, District Metallogeny, the Evolution of Geological Provinces, and Exploration Methods; Goodfellow, W.D., Ed.; Special Publication No. 5; Geological Association of Canada, Mineral Deposits Division: St. John’s, NL, Canada, 2007; pp. 433–448. [Google Scholar]
  23. Yang, S.H.; Su, B.-X.; Huang, X.W.; Tang, D.M.; Qin, K.Z.; Bai, Y.; Sakyi, P.A.; Alemayehu, M. Platinum-Group Mineral Occurrences and Platinum-Group Elemental Geochemistry of the Xiadong Alaskan-Type Complex in the Southern Central Asian Orogenic Belt. Minerals 2018, 8, 494. [Google Scholar] [CrossRef] [Green Version]
  24. Cabri, L.J.; Harris, D.C.; Weiser, T.W. Mineralogy and distribution of platinum-group minerals (PGM) from placer deposits of the world. Explor. Min. Geol. 1996, 5, 73–167. [Google Scholar]
  25. Cabri, L.J. (Ed.) The platinum-group minerals. In Platinum-Group Elements: Mineralogy, Geology, Recovery; Canadian Institute of Mining and Metallurgy: Montreal, QC, Canada, 1981; CIM Special Volume 23, pp. 83–150. [Google Scholar]
  26. Walker, R.J. Highly siderophile elements in the Earth, Moon and Mars: Update and implications for planetary accretion and differentiation. Chem. Erde 2009, 69, 101–125. [Google Scholar] [CrossRef]
  27. Hanley, J.J. The Aqueous Geochemistry of the Platinum-Group Elements (PGE) in Surficial, Low-T Hydrothermal and High-T Magmatic Hydrothermal Environments. In Exploration for Platinum-Group Element Deposits; Mungall, J.E., Ed.; Mineral Assoc Canada: Quebec, QC, Canada, 2005; pp. 35–56. [Google Scholar]
  28. Weiser, T.W. Platinum-group minerals (PGM) in placer deposits. Geol. Geochem. Miner. Miner. Benefic. Platin.-Group Elem. 2002, 54, 721–756. [Google Scholar]
  29. Averill, S.A. The application of heavy indicator mineralogy in mineral exploration with emphasis on base metal indicators in glaciated metamorphic and plutonic terrains. In Drift Exploration in Glaciated Terrain; McClenaghan, M.B., Bobrowsky, P.T., Hall, G.E.M., Cook, S.J., Eds.; Geological Society: London, UK, 2001; Special Publication; Volume 185, pp. 69–81. [Google Scholar]
  30. Kaminsky, F.V.; Belousova, E.A. Manganoan ilmenite as kimberlite/diamond indicator mineral. Russ. Geol. Geophys. 2009, 50, 1212–1220. [Google Scholar] [CrossRef]
  31. Dare, S.A.S.; Barnes, S.-J.; Prichard, H.M. The distribution of platinum group elements (PGE) and other chalcophile elements among sulfides from the Creighton Ni–Cu–PGE sulfide deposit, Sudbury, Canada, and the origin of palladium in pentlandite. Miner. Depos. 2010, 45, 765–793. [Google Scholar] [CrossRef]
  32. Pagé, P.; Barnes, S.-J.; Méric, J.; Houlé, M.G. 2015—Geochemical composition of chromite from Alexo komatiite in the western Abitibi greenstone belt: Implications for mineral exploration. In Targeted Geoscience Initiative 4: Canadian Nickel-Copper-Platinum Group Elements-Chromium Ore Systems—Fertility, Pathfinders, New and Revised Models; Ames, D.E., Houlé, M.G., Eds.; Geological Survey of Canada: Fredericton, NB, Canada, 2015; Open File 7856; pp. 187–195. [Google Scholar]
  33. Makvandi, S.; Ghasemzadeh-Barvarz, M.; Beaudoin, G.; Grunsky, E.C.; McClenaghan, M.B.; Duchesne, C.; Boutroy, E. Partial least squares-discriminant analysis of trace element compositions of magnetite from various VMS deposit subtypes: Application to mineral exploration. Ore Geol. Rev. 2016, 78, 388–408. [Google Scholar] [CrossRef]
  34. Rukhlov, A.S.; Plouffe, A.; Ferbey, T.; Mao, M.; Spence, J. 2016. Application of trace-element compositions of detrital apatite to explore for porphyry deposits in central British Columbia. In Geological Fieldwork 2015; British Columbia Geological Survey Paper; British Columbia Ministry of Energy and Mines: Vancouver, BC, Cananda, 2016; pp. 145–179. [Google Scholar]
  35. Huang, X.-W.; Boutroy, E.; Makvandi, S.; Beaudoin, G.; Corriveau, L.; Franco De Toni, A. Trace element composition of iron oxides from IOCG and IOA deposits: Relationship to hydrothermal alteration and deposit subtypes. Miner. Depos. 2019, 54, 525–552. [Google Scholar] [CrossRef] [Green Version]
  36. Huang, X.-W.; Sappin, A.A.; Boutroy, E.; Beaudoin, G.; Makvandi, S. Trace element composition of igneous and hydrothermal magnetite from porphyry deposits: Relationship to deposit subtypes and magmatic affinity. Econ. Geol. 2019, 114, 917–952. [Google Scholar] [CrossRef]
  37. Sciuba, M.; Beaudoin, G.; Grzela, D.; Makvandi, S. Trace element composition of scheelite in orogenic gold deposits. Econ. Geol. 2020, 55, 1149–1172. [Google Scholar] [CrossRef]
  38. Sciuba, M.; Beaudoin, G.; Makvandi, S. Chemical composition of tourmaline in orogenic gold deposits. Econ. Geol. 2020. [Google Scholar] [CrossRef]
  39. Makvandi, S.; Huang, X.W.; Beaudoin, G.; Quirt, D.; Ledru, P.; Fayek, M. Trace element signatures in hematite and goethite from Kiggavik-Andrew Lake Structural Trend uranium deposits and prospects (Nunavut, Canada). Miner. Depos. 2020. [Google Scholar] [CrossRef]
  40. Benn, C. Design of indicator mineral surveys for mineral exploration. In Proceedings of the 24th International Applied Geochemistry Symposium, Workshop B. Indicator Mineral Methods in Mineral Exploration, Fredericton, NB, Canada, 1–4 June 2009; pp. 7–12. [Google Scholar]
  41. Leake, R.C.; Chapman, R.J.; Bland, D.J.; Stone, P.; Cameron, D.G.; Styles, M.T. The origin of alluvial gold in the Leadhills areas of Scotland: Evidence from interpretation of internal characteristics. J. Geochem. Explor. 1998, 63, 7–36. [Google Scholar] [CrossRef]
  42. Wierchowiec, J. Morphology and chemistry of placer gold grains–indicators of the origin of the placers: An example from the East Sudetic Foreland, Poland. Acta Geol. Pol. 2002, 52, 563–576. [Google Scholar]
  43. Miller, P.; Reid, A.; Zuiderwyk, M. QEM* SEM Image Analysis in the Determination of Modal Assays, Mineral Associations and Mineral Liberation. In Proceedings of the XIV International Mineral Processing Congress, Toronto, ON, Canada, 17–23 October 1982; pp. 1–20. [Google Scholar]
  44. Sandmann, D.; Gutzmer, J. Use of mineral liberation analysis (MLA) in the characterization of lithium-bearing micas. JMMCE 2013, 1, 285–292. [Google Scholar] [CrossRef] [Green Version]
  45. Sylvester, P. Use of the Mineral Liberation Analyzer (MLA) for Mineralogical Studies of Sediments and Sedimentary Rocks. In Quantitative Mineralogy and Microanalysis of Sediments and Sedimentary Rocks; Sylvester, P., Ed.; Short-Course 42; Mineralogical Association of Canada (MAC): St. John’s, NL, Canada, 2012; pp. 1–16. [Google Scholar]
  46. Makvandi, S.; Beaudoin, G.; McClenaghan, M.B.; Quirt, D.; Ledru, P. PCA of Fe-oxides MLA data as an advanced tool in provenance discrimination and indicator mineral exploration: Case study from bedrock and till from the Kiggavik U deposits area (Nunavut, Canada). J. Geochem. Explor. 2019, 197, 199–211. [Google Scholar] [CrossRef]
  47. Lougheed, H.D.; McClenaghan, M.B.; Layton-Matthews, D.; Leybourne, M. Exploration Potential of Fine-Fraction Heavy Mineral Concentrates from Till Using Automated Mineralogy: A Case Study from the Izok Lake Cu–Zn–Pb–Ag VMS Deposit, Nunavut, Canada. Minerals 2020, 10, 310. [Google Scholar] [CrossRef] [Green Version]
  48. McInnes, M.; Greenough, J.D.; Fryer, B.J.; Wells, R. Trace elements in native gold by solution ICP-MS and their use in mineral exploration: A British Columbia example. J. Appl. Geochem. 2008, 23, 1076–1085. [Google Scholar] [CrossRef]
  49. Makvandi, S.; Beaudoin, G.; McClenaghan, B.M.; Layton-Matthews, D. The surface texture and morphology of magnetite from the Izok Lake volcanogenic massive sulfide deposit and local glacial sediments, Nunavut, Canada: Application to mineral exploration. J. Geochem. Explor. 2015, 150, 84–103. [Google Scholar] [CrossRef]
  50. Dilabio, R.N.W. Classification and Interpretation of the Shapes and Surface Textures of Gold Grains from Till; Geological Survey of Canada Contribution N. 32391; Geological Survey of Canada: Fredericton, NB, Canada, 1991; pp. 297–313. [Google Scholar]
  51. Wheeler, J.O.; Hoffman, P.F.; Card, K.D.; Davidson, A.; Sanford, B.V.; Okulitch, A.V.; Roest, W.R. Geological Map of Canada; Geological Survey of Canada: Fredericton, NB, Canada, 1996; Map 1860A, scale 1:5000000. [Google Scholar]
  52. Cabri, L.J.; Rudashevsky, N.S.; Rudashevsky, V.N.; Lastra, R. Hydroseparation: A new development in process mineralogy of platinum-bearing ores. CIM Bull. 2006, 99, 1–7. [Google Scholar]
  53. Plouffe, A.; McClenaghan, M.B.; Paulen, R.C.; McMartin, I.; Campbell, J.E.; Spirito, W.A. Processing of glacial sediments for the recovery of indicator minerals: Protocols used at the Geological Survey of Canada. Geochem. Explor. Environ. Anal. 2013, 13, 301–316. [Google Scholar] [CrossRef]
  54. Maitre, J.; Bouchard, K.; Bédard, L.P. Mineral grains recognition using computer vision and machine learning. Comput. Geosci. 2019, 130, 84–93. [Google Scholar] [CrossRef]
  55. Barnes, S.-J.; Naldrett, A.J.; Gorton, M.P. The origin of the fractionation of platinum-group elements in terrestrial magmas. Chem. Geol. 1985, 53, 303–323. [Google Scholar] [CrossRef]
  56. Crocket, J.H. Platinum-group elements in basalts from Maui, Hawaii: Low abundances in Alkali basalts. Can. Miner. 2002, 40, 595–609. [Google Scholar] [CrossRef]
  57. Mungall, J.E.; Andrews, D.R.A.; Cabri, L.J.; Sylvester, P.; Tubrett, M. Partitioning of Cu, Ni, Au, and platinum-group elements between monosulfide solid solution and sulfide melt under controlled oxygen and sulfur fugacities. Geochim. Cosmochim. Acta 2005, 69, 4349–4360. [Google Scholar] [CrossRef] [Green Version]
  58. Cabri, L.J.; Strwant, J.M.; Turner, K.; Skinner, B.J. On cooperite, braggite, vysotskite. Amer. Miner. 1978, 63, 832–839. [Google Scholar]
  59. Craw, D.; Kerr, G.; Reith, F.; Falconer, D. Pleistocene paleodrainage and placer gold redistribution, western Southland, New Zealand. N. Zeal. J. Geol. Geophys. 2015, 58, 137–153. [Google Scholar] [CrossRef]
  60. Mahaney, W.C. Atlas of Sand Grain Surface Textures and Applications; Oxford University Press: Oxford, UK, 2002; p. 256. [Google Scholar]
  61. Van Hoesen, J.G.; Orndorff, R.L. A comparative SEM study on the micromorphology of glacial and nonglacial clasts with varying age and lithology. Can. J. Earth Sci. 2004, 41, 1123–1139. [Google Scholar] [CrossRef]
  62. Vos, K.; Vandenberghe, N.; Elsen, J. Surface textural analysis of quartz grains by scanning electron microscopy (SEM): From sample preparation to environmental interpretation. Earth-Sci. Rev. 2014, 128, 93–104. [Google Scholar] [CrossRef]
  63. Craw, D.; Mitchell, M.; McCann, R.; Reay, A. Compositional variations and morphological evolution in platinum beach placers, southern New Zealand. Miner. Depos. 2013, 48, 81–97. [Google Scholar] [CrossRef]
  64. Brundin, N.H.; Bergstrom, J. Regional prospecting for ores based on heavy minerals in glacial till. J. Geochem. Explor. 1977, 7, 1–19. [Google Scholar] [CrossRef]
  65. Chapman, R.; Leake, R.; Styles, M. Microchemical characterization of alluvial gold grains as an exploration tool. Gold Bull. 2002, 35, 53–65. [Google Scholar] [CrossRef] [Green Version]
  66. Averill, S.A. Useful Ni-Cu-PGE versus kimberlite indicator minerals in surficial sediments: Similarities and differences. In Application of Till and Stream Sediment Heavy Mineral and Geochemical Methods to Mineral Exploration in Western and Northern Canada; Paulen, R.C., McMartin, I., Eds.; Short Course Notes; Geological Association of Canada: St. John’s, NL, Canada, 2009; Volume 18, pp. 125–139. [Google Scholar]
  67. Oberthür, T. The fate of platinum-group minerals in the exogenic environment—from sulfide ores via oxidized ores into placers: Case studies Bushveld Complex, South Africa, and Great Dyke, Zimbabwe. Minerals 2018, 8, 581. [Google Scholar] [CrossRef] [Green Version]
  68. Shilts, W.W. Principles of geochemical exploration for sulphide deposits using shallow samples of glacial drift. Can. Metall. Bull. 1975, 68, 73–80. [Google Scholar]
  69. Shilts, W.W.; Kettles, I.M. Geochemical-mineralogical profiles through fresh and weathered till. Chapter 11. In Glacial Indicator Tracing; Balkema: Rotterdam, The Netherlands, 1990; p. 30. [Google Scholar]
  70. McMartin, I.; McClenaghan, M.B. Till geochemistry and sampling techniques in glaciated shield terrain: A review. Geol. Soc. Lon. Spec. Publ. 2001, 185, 19–43. [Google Scholar] [CrossRef]
  71. Suárez, S.; Prichard, H.M.; Velasco, F.; Fisher, P.C.; McDonald, I. Alteration of platinum-group minerals and dispersion of platinum-group elements during progressive weathering of the Aguablanca Ni–Cu deposit, SW Spain. Miner. Depos. 2010, 45, 331–350. [Google Scholar] [CrossRef]
  72. Tolstykh, N.D.; Podlipsky, M.Y. Heavy concentrate halos as prospecting guides for PGE mineralization. Geol. Ore Depos. 2010, 52, 196–214. [Google Scholar] [CrossRef]
  73. Cabri, L.J. The platinum-group minerals. In The Geology, Geochemistry, Mineralogy and Mineral Beneficiation of Platinum-Group Elements; Cabri, L.J., Ed.; Canadian Institute of Mining, Metallurgy and Petroleum: Montreal, QC, Canada, 2002; Special Volume 54, pp. 13–129. [Google Scholar]
  74. Zaccarini, F.; Garuti, G.; Pushkarev, E.; Thalhammer, O. Origin of Platinum Group Minerals (PGM) Inclusions in Chromite Deposits of the Urals. Minerals 2018, 8, 379. [Google Scholar] [CrossRef] [Green Version]
  75. Pagé, P.; Girard, R.; Tremblay, J. Detrital Platinum-group minerals from till samples: Mineralogy, evolution and their use as exploration tool. In Proceedings of the Resources for Future Generations 2018, Vancouver, BC, Canada, 16–21 June 2018. [Google Scholar]
  76. Prichard, H.M.; Neary, C.R.; Potts, P.J. Platinum group minerals in the Shetland ophiolite. In Proceedings of the Conference Metallogeny of Basic and Ultrabasic Rocks, Edinburgh, Scotland, UK, 9–12 April 1985; pp. 395–414. [Google Scholar]
  77. Prichard, H.M.; Barnes, S.-J.; Maier, W.D.; Fisher, P.C. Variations in the nature of the platinum-group minerals in a cross-section through the Merensky Reef at Impala Platinum: Implications for the mode of formation of the reef. Can. Miner. 2004, 42, 423–437. [Google Scholar] [CrossRef] [Green Version]
  78. Prichard, H.M.; Economou-Eliopoulos, M.; Fisher, P.C. Contrasting platinum-group mineral assemblages from two different podiform chromitite localities in the Pindos ophiolite complex, Greece. Can. Miner. 2008, 46, 329–341. [Google Scholar] [CrossRef] [Green Version]
Figure 1. (a) Map of geological provinces of Canada (modified from Wheeler et al. [51]). (b) Location map of till sampling areas.
Minerals 11 00264 g001
Figure 2. A mosaic of 166 precious metals minerals (PMM) excluding Au is automatically generated by the routine. These PMM include various species of platinum-group elements-bearing and Ag-bearing minerals found in till samples collected in the Nunavik area (Quebec, Canada).
Minerals 11 00264 g002
Figure 3. Major platinum-group mineral (PGM) species recovered from till in this study and their relative abundance. A total of 58 different PGM species have been identified.
Minerals 11 00264 g003
Figure 4. Abundance of platinum-group minerals (PGMs) recovered in heavy mineral super-concentrates obtained after processing till samples. (a) PGMs are divided into two major groups: palladium-like platinum-group elements (PPGE) PGMs, whose compositions are dominated by Pd, Pt, and/or Rh, and the iridium-like platinum-group elements (IPGE) PGMs, in which Ir, Os and/or Ru are major components. (b) PGMs in which Pt is the dominant metal represent 76.20% (n = 2030), whilst Pd is the dominant metal for 16.74% (n = 446) of the PGM population recovered from till in this study (n = 2664).
Minerals 11 00264 g004
Figure 5. A selection of backscatter electron (BSE) images of precious metal minerals (PMM) including Ag-bearing phases (ac) and minerals of the iridium-like platinum-group elements (IPGE-PGM) identified in the till samples processed and analyzed by IOS-SG. (a) Native silver (Ag); (b) Acanthite (Ag2S); (c) Hessite (Ag2Te); (d) Anduoite ((Ru,Os)As2); (e) Irarsite ((Ir,Ru,Rh,Pt)AsS); (f,g) Laurite (RuS2); (h) Erlichmanite (OsS2); (i) An Ir-Ru-rich osmium grain.
Minerals 11 00264 g005
Figure 6. A selection of backscatter electron (BSE) images of platinum-group minerals identified in the till samples. (a) Braggite ((Pt,Pd,Ni)S); (b) Cooperite (PtS); (c) Moncheite ((Pt,Pd)(Te,Bi)2); (d) Stillwaterite (Pd8As3); (e) Mertieite-II (Pd8(Sb,As)3); (f) Taimyrite ((Pd,Cu,Pt)3Sn); (g) Cabriite (Pd2SnCu); (h) Isomertieite (Pd11Sb2As2); (i) Paolovite (Pd2Sn); (j) Potarite (PdHg); (k) Stibiopalladinite (Pd5Sb2); (l) Platinum (Pt).
Minerals 11 00264 g006
Figure 7. Multi-element box and whisker plot showing elemental variation (in wt%) in the composition of 1488 sperrylite grains. Whiskers represent the range of minimum and maximum values. The short line within each box represents the median value, which separates the box into two parts (i.e., lower 25th–50th percentile group and upper 50th–75th percentile). The n below the axis: number of grains containing the element of interest.
Minerals 11 00264 g007
Figure 8. This graph classifies the Pt- and Pd-bearing sulfides whose compositions satisfy the following condition ((Pt at. + Pd at. + Ni at. + others at.)/ S at. ~1). The elemental values are presented in atomic proportions (at.). The analyses from Cabri [25] are included. This classification sets a limit for vysotskite at Pt < 12.5 wt% and a limit for the cooperite at Pt > 75.0 wt%. Braggite forms a field between the given limits (12.5 wt% > Pt < 75.0 wt%).
Minerals 11 00264 g008
Figure 9. Multi-element box and whisker plots of elemental variation (in wt%) in (a) braggite, (b) cooperite, and (c) vysotskite grains. Whiskers represent the range of minimum and maximum values. The short line within each box represents the median value, which separates the box into two parts (i.e., lower 25th–50th percentile group and upper 50th–75th percentile). The n below the axis: number of grains containing the element of interest.
Minerals 11 00264 g009
Figure 10. The graph depicts the classification of palladium arseno-antimonides species of the platinum-group minerals belonging to the isomertieite-mertieite series. The elemental values are presented in atomic proportions (at.). Data from Cabri [25] have been included to help establishing the limits between the isomertieite, mertieite-I, and mertieite-II fields.
Minerals 11 00264 g010
Figure 11. Multi-element box and whisker plots showing elemental variation (in wt%) in the composition of (a) isomertieite, (b) mertieite-I, and (c) mertieite-II grains recovered from tills. Whiskers represent the range of minimum and maximum values. The short line within each box represents the median value, which separates the box into two parts (i.e., lower 25th–50th percentile group and upper 50th–75th percentile). The n below the axis: number of grains containing the element of interest.
Minerals 11 00264 g011
Figure 12. The Os-Ru-(Rh + Ir) diagram illustrates the compositional distribution of 72 PGM grains belonging to the laurite-erlichmanite series. The elemental values are presented in atomic proportions (at.). Data from Cabri [25] have been included to help establish the limits between laurite and erlichmanite fields.
Minerals 11 00264 g012
Figure 13. Multi-element box and whisker plots showing elemental variation (in wt%) in the composition of (a) laurite and (b) erlichmanite grains. Whiskers represent the range of minimum and maximum values. The short line within each box represents the median value, which separates the box into two parts (i.e., lower 25th–50th percentile group and upper 50th–75th percentile). The n below the axis: number of grains containing the element of interest.
Minerals 11 00264 g013
Figure 14. The compositional variation of 57 potarite grains is illustrated in (a) box and whisker plot, and (b) an Au at.–Hg at.–Pd + Cu at. ternary diagram. Whiskers represent the range of minimum and maximum values. The short line within each box represents the median value, which separates the box into two parts (i.e., lower 25th–50th percentile group and upper 50th–75th percentile). The n below the axis: number of grains containing the element of interest. The colored polygon in b limits the field for Au-rich potarite. The elemental values in b are presented in atomic proportions (at.). Data from Cabri [25] have been included in b to be compared with data from this study.
Minerals 11 00264 g014
Figure 15. A selection of backscatter electron (BSE) images showing PGMs and Au association. (a) An Au-rich (46.65 wt%) potarite; (b,c) Mertieite-I (M-I; Pd11(Sb,As)4) partly encapsulated in gold; (d) Isomertieite (IsM; Pd11Sb2As2) as an inclusion in a gold particle; (e) A vincentite (Vin; (Pd,Pt)3(As,Sb,Te)) attached to a gold grain; (f) Vysotskite (Vys; (Pd,Ni)S) enclosed by a gold aggregate; (g) An atheneite (Atn; (Pd,Hg)3As) attached to a gold grain with silicate inclusions; (h) Platinum (Pt) inclusion in a gold grain; and (i) Gold precipitation/nucleation on the surface of a sperrylite (Sp; PtAs2).
Minerals 11 00264 g015
Figure 16. A selection of backscatter electron (BSE) images of platinum-group minerals (PGMs) forming polymineralic aggregates. Two-phase PGMs composed of (a) Sperrylite (Sp; PtAs2) and irarsite (Ira; (Ir,Ru,Rh,Pt)AsS); (b) Pt-rich irarsite (Ira-Pt) and Ru-rich irarsite (Ira-Ru); (c) Rutheniridosmine (Rut; (Ir,Os,Ru)) and erlichmanite (Erl; OsS2); (d) Rutheniridosmine and platarsite (Plt; (Pt,Rh,Ru)AsS); (e) Platarsite and sperrylite; and (f) A three-phase PGM composed of sperrylite, platarsite and hollingworthite (Ho; (Rh,Pt,Pd)AsS).
Minerals 11 00264 g016
Figure 17. A selection of backscatter electron (BSE) images showing various shapes and morphologies of sperrylite grains recovered from till samples. (ad) Pristine grains. (ef) Semi-rounded grains. (gi) Rounded grains. (jl) Grains with breakage surfaces. (mo) Monomineralic aggregates/twinned crystals. (p,q) Grains with intergranular textures. (r) Botryoidal form of a sperrylite. (s) Grain with corroded surface.
Minerals 11 00264 g017
Figure 18. Grain size distribution of platinum-group minerals (PGMs) occurring in the <50 µm heavy mineral super-concentrates from glacial till sediments. (a) Range of PGMs’ width vs. length measurements for the various mineral species recovered from samples collected in the James Bay territory, Archean Superior Craton (Quebec, Canada). (b) Range of width vs. length measurements of sperrylite grains from various geological settings within the Canadian Shield. Majority of the grains show similar size distributions regardless of their mineral species and/or sampling area.
Minerals 11 00264 g018
Figure 19. Covariation of (Pt at. + Pd at. + Rh at.) vs. (As at. + S at.) in the composition of relatively abundant platinum-group minerals (PGMs) including sperrylite, braggite, cooperite, isomertieite, mertieite-I, and mertieite-II recovered from till collected from different geological settings within the Canadian Shield. The elemental values are presented in atomic proportions (at.). Although regional differences are noted, most of these minerals show ubiquitous distributions.
Minerals 11 00264 g019
Figure 20. Covariation of (Ru at. + Os at. + Ir at.) vs. (As at. + S at.) in the composition of relatively abundant iridium-like platinum-group elements (IPGE)-rich platinum-group minerals (PGMs) including anduoite, erlichmanite, laurite, and irarsite recovered from till collected from different geological settings within the Canadian Shield. The elemental values are presented in atomic proportions (at.). Although regional differences are noted, most of these minerals show ubiquitous distributions.
Minerals 11 00264 g020
Table 1. List of rare PGMs identified by ARTGoldTM in the studied till samples. These PGM species are grouped as “Others” in Figure 3.
PGMFormulan. *PGMFormulan.
Vysotskite(Pd,Ni)S11ZvyagintsevitePd3Pb3
Atheneite(Pd,Hg)3As11Arsenopalladinite(Pd8(As,Sb)32
Hollingworthite(Rh,Pt,Pd)AsS10ChrisstanleyiteAg2Pd3Se42
Tatyanaite(Pt,Pd,Cu)9Cu3Sn410Iridarsenite(Ir,Ru)As22
VincentitePd3As10PalarstanidePd5(Sn,As)22
Anduoite(Ru,Os)As27PalladseitePd17Se152
MitrofanovitePt3Te47Rustenburgite(Pt,Pd)3Sn2
Pd-dominated alloysPd6Atokite[Pd,Pt)3Sn]1
WeishanitePd(±Pt)AuHg6Kingstonite[Rh,Ir,Pt)3S4]1
Osarsite(Os,Ru)AsS6Kotulskite(Pd(Te,Bi)1
HongshiitePtCu6Merenskyite(Pd,Pt)(Te,Bi)21
PaolovitePd2Sn5MinakawaiteRhSb1
CabriitePd2CuSn5PadmaitePdBiSe1
Stannopalladinite(Pd,Cu)3Sn24PalladobismutharsenidePd2(As,Bi)1
Taimyrite(Pd,Cu,Pt)3Sn4PlumbopalladinitePd3Pb21
NaldretteitePd2Sb4SudovikovitePtSe21
NiggliitePtSn3Telargpalite(Pd,Ag)3Te1
Omeiite(Os,Ru)As23UngavaitePd4Sb31
Ruarsite(Ru,Os)AsS3
* Number of grains.
Publisher’s Note: MDPI stays neutral with regard to jurisdictional claims in published maps and institutional affiliations.

