
Laser-Based Characterisation of the Copper Uranyl Sulphate, Johannite

School of Chemistry and Chemical Engineering, University of Surrey, Guildford GU2 7XH, UK
*
Author to whom correspondence should be addressed.
Minerals 2022, 12(11), 1419; https://doi.org/10.3390/min12111419
Submission received: 28 September 2022
/
Revised: 25 October 2022
/
Accepted: 2 November 2022
/
Published: 9 November 2022
(This article belongs to the Special Issue Sulphate and Carbonate Minerals)
Abstract
:Uranyl sulphate minerals are common alteration phases in uranium mines and uraniferous waste deposits where they occur in conjunction with other products of acidic drainage such as jarosite. Although not persistent in nature due to their high solubility, they may play an important role in governing uranium mobility during the operational and immediate post-closure environment of an engineered radioactive waste repository where oxidising conditions prevail. One such mineral, johannite (Cu(UO2)2(SO4)2(OH)2·8H2O), is of particular interest given the stated intention of several countries to use copper canisters in the disposal of spent nuclear fuel. A museum reference sample of johannite has been characterised by luminescence and multiple-laser Raman spectroscopy, resulting in the first reported luminescence excitation and emission spectra for this mineral. Well-defined Raman features were observed using 785, 633, and 532 nm lasers with the resolved peaks corresponding well to the published spectra. The Raman spectrum measured with the 457 nm laser was mostly masked by a series of repeating doublets attributed to the luminescence emission features, from which band spacing values of 831 and 823 cm−1 were extracted; the former corresponded to both the resolved 785 nm ν1(UO2)2+ peak position and the band spacing value obtained from the first reported luminescence emission spectrum for johannite. Four emission and nine excitation peaks were resolved from the luminescence spectra. The findings indicate that a suite of complementary laser-based techniques offer the potential for real-time characterisation of johannite formed in environments where intrusive sampling, transportation, and ‘off-site’ laboratory analysis are not feasible.
1. Introduction
Around 38 uranyl sulphate minerals are known [1], making this one of the larger groups of secondary uranyl minerals. All are highly soluble in water [1,2,3,4], leading to repeated dissolution–precipitation cycles in variably saturated media accompanied by the incorporation and exchange of metal cations [4]. They can play an important role in governing uranium mobility at sites subject to acid mine (AMD) and acid rock drainage following the oxidation of common sulphide minerals such as pyrite, [1,3,5,6,7,8,9]. Secondary uranyl sulphate minerals commonly form as efflorescent coatings on the mine walls with the best known location being in the disused Blue Lizard mine (San Juan County, Utah, USA) [10,11,12,13,14,15,16,17,18,19], resulting in a large variety of uranyl sulphates including johannite (Cu(UO2)2(SO4)2(OH)2·8H2O), zippeite (K4(UO2)6(SO4)3(OH)10·4H2O), natrozippeite (Na5(UO2)8(SO4)4O5(OH)3·12H2O), ammoniozippeite (NH4(UO2)2(SO4)4O2·H2O), magnesiozippeite (Mg(UO2)2(SO4)O2·3.5H2O), cobaltzippeite (Co(UO2)6(SO4)3(OH)10·16H2O), pseudojohannite (Cu3OH2(UO2)4O4(SO4)2·12H2O), redcanyonite ((NH4)2Mn(UO2)4(SO4)2O4·H2O), meisserite (Na5(UO2)(SO4)3(SO3OH)·H2O), wetherillite (Na2Mg(UO2)2(SO4)4·18H2O), plášilite (Na(UO2)(SO4)(OH)·2H2O), belakovskiite (Na7(UO2)(SO4)4(SO3OH)·3H2O), and bluelizardite (Na7(UO2)(SO4)4Cl4·2H2O). Copper-bearing uranyl sulphate phases are of interest given the stated intention of several countries to use copper canisters in the disposal of spent nuclear fuel (SNF) [18,20,21,22,23].
Johannite has been identified at multiple AMD sites including the Blue Lizard mine [8,15,16] and Jáchymov, Czech Republic [8]. Crystal structure analysis by X-ray diffraction (XRD) revealed that it consists of uranyl polyhedral sheets containing dimers of edge-sharing uranyl pentagonal bipyramids that are connected to sulphate tetrahedra [24], with the Cu2+ cations and water molecules situated between these uranyl sulphate sheets (Figure 1). In nature, johannite is typically associated with zippeite-group minerals including natrozippeite [16] and pseudojohannite [3,8].
Uranyl sulphates form in environments where intrusive sampling, transportation, and ‘off-site’ laboratory analysis is not always feasible, so there is a clear requirement for in situ, rapid characterisation techniques. Complementary laser-based methods such as laser-induced breakdown (LIBS) [26], time-resolved laser fluorescence (TRLFS) [27], and Raman spectroscopy [28] offer promise as they have the potential to be operated remotely using common hardware. However, a reliable spectral database of candidate phases is needed before these techniques can be applied routinely.
Only two Raman characterisation studies have been published on johannite [4,29], and differences with respect to the number and position of key features are apparent. No luminescence spectroscopy analysis has been published for johannite and it has been suggested that fluorescence is likely to be negligible (http://webmineral.com/data/Johannite.shtml, accessed on 1 September 2022).
The characterisation work presented in this paper, using traditional and laser-based techniques, aims to add to our knowledge of its structural and chemical characteristics. Comparisons with existing Raman data [4,29] were made in order to identify key distinguishing features. To the best of our knowledge, this work contains the first reported luminescence excitation and emission spectra for johannite.
2. Materials and Methods
2.1. Sample
The johannite specimen was loaned from the reference collection held by the National Museum of Wales (reference number NMW 67.154.GR.69) and originates from San Juan County, Southeast Utah, USA. Fragments of well-crystallised johannite were carefully hand-picked from the specimen to provide material for analysis that was visually monomineralic and free of obvious contaminant phases. The fragments were initially observed and photographed using a digital camera (Canon SX720, Canon Inc., Tokyo, Japan). Higher magnification optical microphotographs (up to 1000× magnification) were recorded using a USB-Wi-Fi digital optical microscope (Model No RT-107BW-EU, Rotek Electronics Technology Co. Ltd., Kowloon, Hong Kong). More detailed characterisation by XRD and scanning electron microscopy with energy dispersive X-ray microanalysis (SEM-EDXA) was undertaken to confirm the chemical composition and mineralogical purity.
2.2. Scanning Electron Microscopy with Energy Dispersive X-ray Spectroscopy (SEM-EDX)
Small (0.2–2.0 mm) fragments of fine johannite crystal aggregates were mounted onto an aluminium pin-type stub sample mount using double-sided adhesive conductive carbon tape. This was placed directly into the scanning electron microscopy (SEM) chamber and examined uncoated. SEM imaging was undertaken using a Hitachi S3200N variable-pressure SEM instrument (Hitachi Ltd., Tokyo, Japan) equipped with backscattered electron (BSE) and secondary electron (SE) detectors. Semi-quantitative energy dispersive X-ray spectroscopy analysis (EDXA) spectra were recorded simultaneously during SEM imaging using an Oxford Instruments INCA Energy 450 EDXA system (Oxford Instruments, Abingdon, Oxfordshire, UK), equipped with a PentaFET X-act silicon drift detector (SDD) (Oxford Instruments, Abingdon, Oxfordshire), and processed using the INCA Microanalysis Suite software (Oxford Instruments INCA Microanalysis Suite Issue 21b + SP3, INCA Suite version 5.05. (2014), (Oxford Instruments, Abingdon, Oxfordshire, UK). The samples were studied under high vacuum (<1 Pa). BSE images and EDXA spectra were recorded using a 15 kV electron beam voltage, and SE images were recorded using a 5–15 kV beam voltage. Fast scan speeds coupled with frame-averaging (10–15 frames) were employed to reduce image noise and limit sample charging and damage. The irregular surfaces of the fragments prevented fully-quantitative EDXA analysis.
2.3. X-ray Diffraction (XRD)
A small proportion of the specimen was powdered and temporarily secured onto a silicon wafer coated with double-sided tape. XRD analysis was undertaken on a PANalytical, X’Pert system (Malvern Panalytical Ltd., Malvern, Worcestershire, UK), using CuKα radiation with a voltage and current of 40 kV and 30 mA, respectively. The sample was scanned for 12 h with the CuKβ features removed from the pattern post-measurement using the HighScore Plus software (PANalytical HighScore Plus version 3.0, Malvern Panalytical Ltd., Malvern, Worcestershire). The resulting XRD pattern was compared to those present in the HighScore Plus database (PANalytical PDF-2, released 2004).
2.4. Luminescence Spectroscopy
Multiple fragments of johannite were mounted and temporarily sealed into a groove between two quartz slides. Luminescence excitation and emission spectra were measured using the TRLFS apparatus described in Frankland et al. [30]. Excitation and emission spectra were obtained using a xenon lamp (continuous beam) and a “steady state” photodiode detector, typically between 280–495 and 450–650 nm, respectively, with the desired excitation and/or emission wavelengths obtained using the corresponding monochromator. The excitation and emission bandwidths were both set to 1.5 nm with a spectral resolution of 0.1 nm and a dwell time of 2.0 s. The xenon lamp spot size was 1 by 5 mm. Spectral data were corrected for instrument response using the files supplied by the manufacturer (F980 version 1.4.3, Edinburgh Instruments, Livingston, UK). The excitation and emission features were manually resolved into individual peaks using multiple Lorentz peak fitting functions in Origin 2020 (OriginLab Corporation, version 9.7.0.185, Northampton, MA, USA). Attempts were made to measure the decay lifetime, but the decay signal emitted was below the detection limit of the apparatus using the pulsed light sources available.
2.5. Raman Spectroscopy
The same sample mounting method used for luminescence analysis was applied to measure the Raman spectra from a Renishaw InVia Reflex Microscope (inViaTM, Reinshaw plc, Wotton-under-Edge, Gloucestershire, UK) equipped with four lasers operating at 785, 633, 532, and 457 nm with a typical laser power of 1.5, 2.0, 2.5, and 0.1 mW, a grating size of 1200, 1800, 2400, and 2400 nm, and a laser beam spot size of 1.28, 1.03, 0.87, and 0.74 μm, respectively [31]. Each spectrum was measured using a ×50 magnification lens from four accumulations with a laser exposure time of 10 s per accumulation. The microscope was calibrated using silicon, ensuring a peak position accuracy of ±1 cm−1. Spectra were typically collected between 50 and 4000 cm−1 from at least three different locations. The Raman features were manually resolved into individual peaks using the same Lorentz peak fitting function method applied to the luminescence spectra.
3. Results and Discussion
3.1. Composition and Phase Purity
The johannite sample mainly comprised friable aggregates of translucent, apple-green to pale yellow-green crystals with a vitreous lustre (Figure 2). The crystals were fine grained, with a predominantly bladed morphology, best seen under the SEM (see below). Johannite is readily distinguishable from the minor amounts of pale yellow natrozippeite and colourless gypsum (CaSO4·2H2O), with which it is intergrown in the original parent specimen. Optically, the hand-separated johannite sample appears to be essentially monomineralic except for some very minor surface staining by traces of orange-brown iron oxyhydroxide (probably goethite, FeO·OH; Figure 2). Overall, the colour and morphology of the johannite sample are consistent with other johannite specimens described from the San Juan County region (c.f. http://webmineral.com/data/Johannite.shtml and http://www.mindat.org/min-2102.html, both accessed on 1 September 2022).
Detailed SEM-EDXA observations showed that johannite is finely crystalline (Figure 3a), comprising loosely aggregated rosettes of radiating euhedral bladed prisms, ranging in length from <10 to 200 μm and 2 to 10 μm in thickness (Figure 3b), and more tightly packed masses of euhedral thick tabular or blocky prisms, 10 to 50 μm in size (Figure 3c). Although johannite is triclinic, the thick tabular crystals display a “pseudo-monoclinic” symmetry (Figure 3c), which is consistent with some previous morphological descriptions [32,33]. The johannite crystals displayed one prominent cleavage plane, which in the more bladed crystals was parallel to their axis of elongation. During the SEM analysis, some minor “wedge-shaped” fissures were observed to form growing from the edge of the crystals and following along the mineral cleavage (Figure 3c,d). Their wedged shape and formation in situ during SEM analysis indicates partial dehydration and concomitant shrinkage of the mineral under vacuum and the electron beam. It seems unlikely that the sample was significantly dehydrated (i.e., had transformed to a meta-johannite variety) prior to placement under vacuum in the SEM, as previous studies on synthetic johannite have shown that dehydration occurs only above 60 °C [34].
SEM-EDXA indicates that the johannite sample was predominantly monomineralic, and only a very minor amount of gypsum was identified as a discrete contaminant phase in some fragments. This occurs interstitially between the johannite crystals as very fine acicular crystal aggregates (Figure 3d). Although precise quantitative compositional data could not be obtained, EDXA spectra showed that the johannite sample was a copper uranyl sulphate (Figure 3e). Approximate compositional estimates, based on EDXA from crystal surfaces with suitable orientations and free of potential contaminants, provided a mean atomic ratio of 0.99 (±0.19) Cu: 2.24 (±0.22) S: 2U. This was consistent with a johannite composition rather than pseudojohannite (Cu3OH2(UO2)4O4(SO4)2·12H2O), which had a significantly greater Cu:U ratio. The presence of carbon and aluminium observed in the EDXA spectra were attributable to the X-ray fluorescence scatter from the aluminium stub mount and adhesive carbon tape. In addition, and only rarely, magnesium was detected in some EDXA spectra, but the phase responsible could not be differentiated. This may indicate traces of a magnesium sulphate phase such as epsomite (MgSO4·7H2O) or magnesiozippeite (Mg(UO2)2(SO4)O2·3.5H2O), which are known to occur in association with johannite mineralisation [12,16,35,36]. SEM-EDXA observations found no evidence for any contamination by natrozippeite, which was present in the parent material of reference specimen NMW 67.14GR.69.
Confirmatory specimen identification was achieved by comparing the XRD pattern of the NMW specimen (Figure 4) with reference patterns in the HighScore database (PANalytical HighScore Plus version 3.0) and from Brugger et al. [3]. The NMW specimen very closely matched that of johannite, although the peak intensities differed slightly, most probably due to preferential crystal orientation. Here, fine fragments were secured by double-sided tape attached to a silicon wafer, resulting in a significant proportion of the crystals being preferentially aligned along their bladed and tabular faces, and prominent cleavage plane. No evidence of any contamination by natrozippeite, gypsum, or any Mg-bearing phase was observed in the XRD pattern, although present in the original parent specimen. Similarly, no distinctive diffraction lines that would indicate the presence of pseudojohannite (c.f. Brugger et al. [3]) were observed. The XRD pattern of NMW 67.154GR.69 also displayed two broad humps at ~16 and 23 °2θ, which were attributed to background scattering from the tape used to secure the crystal fragments in place (Figure 4). No other minerals were identified and thus the XRD data confirm the observations from the SEM-EDXA.
The most intense XRD peak for johannite was detected at 3.904 Å, which is a multiple of the prominent cleavage plane at 7.893 Å. Other multiples of this cleavage plane were observed at 2.684 and 1.941 Å due to the mounting technique used. XRD analysis performed by Mereiter [24] estimated the uranyl U-O bond lengths as 1.78 Å and 2.34 to 2.39 Å in the axial and equatorial planes, respectively. No peaks attributed to Mereiter’s [3] inter-reticular uranyl distances in the equatorial plane where observed; although the very weak intensity feature at 1.771 Å could correspond to the axial uranyl distance. The series of peaks located between 2.68 and 2.77 Å and around 3.3 Å correlated with the hydrogen bonding distances [3]. The two intense peaks at 6.222 and 4.412 Å could not be assigned to the inter-reticular distances based on Mereiter’s XRD study [3], but these peak positions agreed well with those reported by Hurlbut [33] for johannite.
Overall, characterisation by optical microscopy, SEM-EDXA, and XRD indicate that the specimen was almost pure johannite with very minor inclusions of gypsum.
3.2. Luminescence Spectroscopy
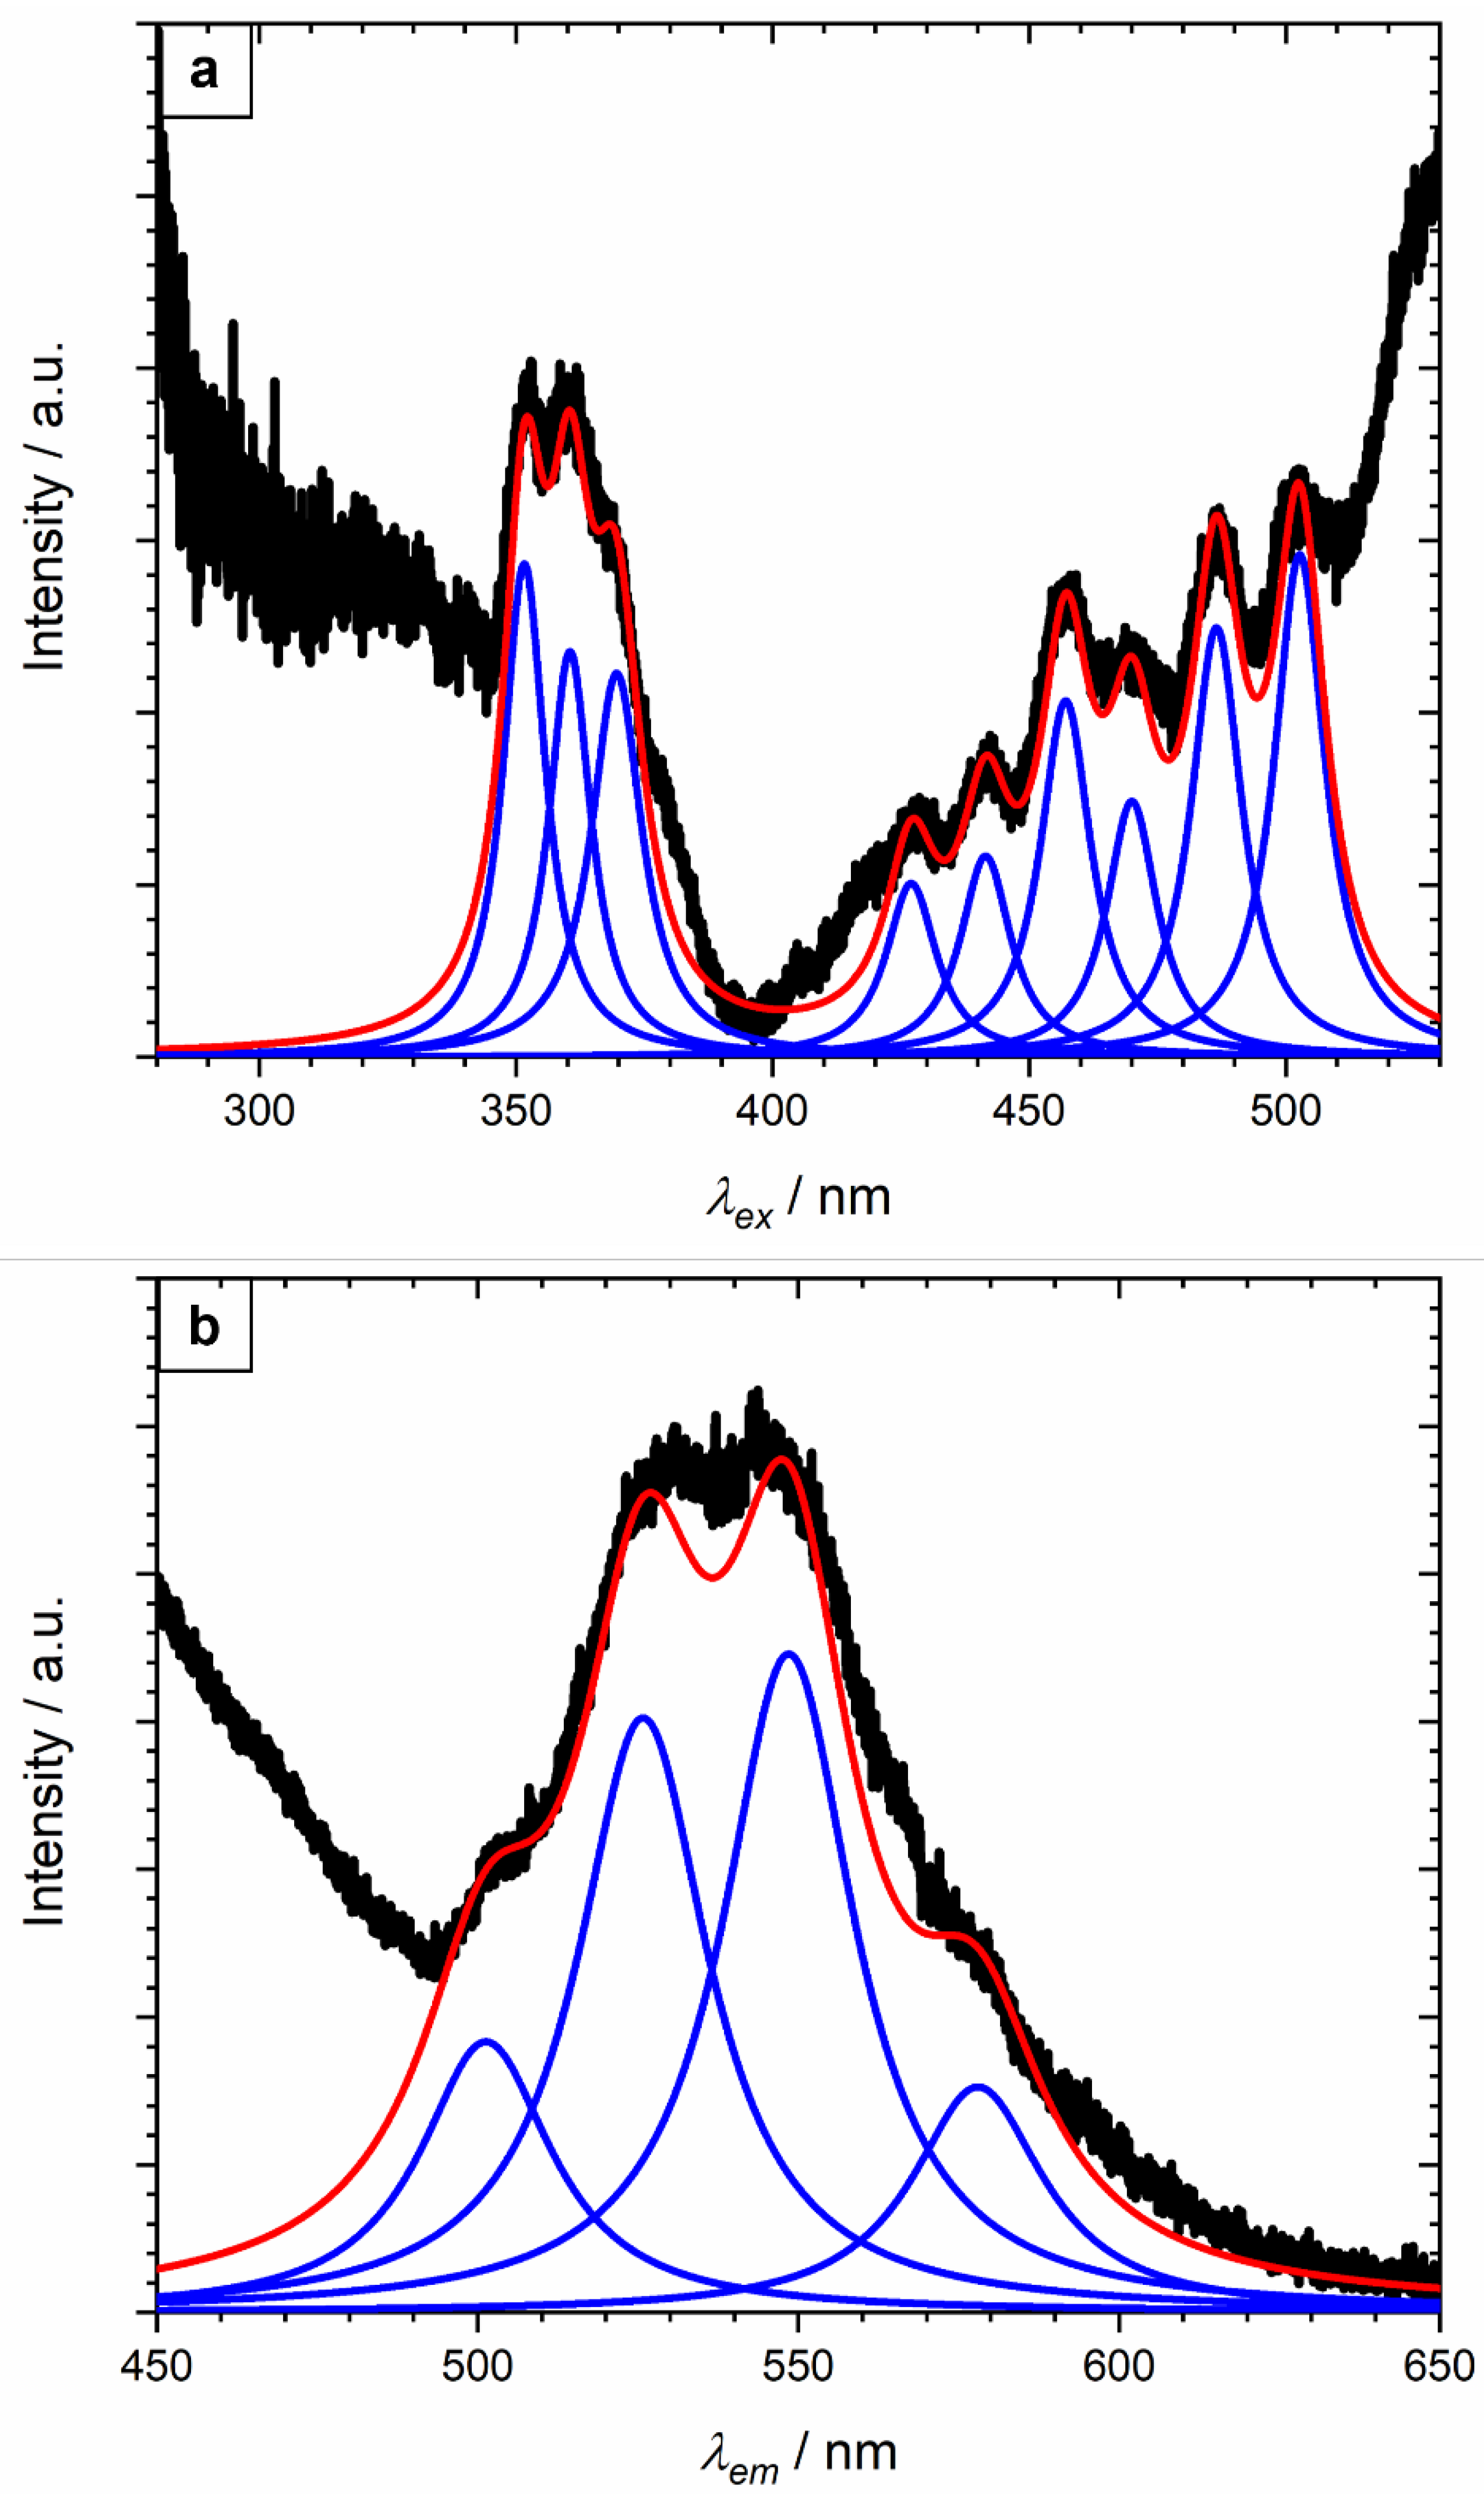
A weak luminescence signal was obtained from johannite in both emission and excitation modes (Figure 5). This was not unexpected (c.f. http://webmineral.com/data/Johannite.shtml, accessed on 1 September 2022) and probably accounts for the lack of previous studies on johannite luminescence in the literature. Greater peak definition was observed in the excitation spectrum than the emission, enabling more individual bands to be resolved.
No previous luminescence data have been published for johannite; however, four peaks could be resolved for the current specimen from the broad asymmetric emission spectrum (Figure 5b), positioned at 501.3 ± 3, 525.8 ± 3, 548.5 ± 3, and 578.0 ± 3 nm with the error taken as double the bandwidth setting (Table 1). The distance between sequent emission peaks from the lowest uranyl luminescence emitting level (at 20502 cm−1, [37]) can be used to extract the stretch vibrational frequency transition, also known as the band spacing, which is equivalent to the Raman uranyl symmetric stretch, ν1(UO2)2+, mode. It is also possible to calculate the band spacing value from just the spacing between the electronic ground (E) and first vibronic state (S1) emission peaks [38,39,40,41], as the spacing between the peaks should be consistent across the whole spectrum. Given that the band spacing here is being extracted from poorly defined features, all four resolved peak positions were used to obtain an average value with the error taken as the variation across the range. A value of 882 ± 67 cm−1 was derived, which was higher than (but just within experimental error of) the ν1(UO2)2+ values reported by Frost et al. [4] at 812 cm−1 and Driscoll et al. [29] at 836 cm−1. The variation in the band spacing value obtained in this study and the reported equivalent ν1(UO2)2+ modal position is unclear. Previous luminescence studies suggest better agreement was obtained with very well-defined emission peaks [42,43], suggesting the band spacing value can only be reliably obtained from those specimens that emit intense luminescence, unlike johannite.
Nine peaks were resolved from the excitation spectrum for johannite (Figure 5a) at 351.6, 360.5, 369.6, 427.0, 441.5, 457.1, 470.0, 486.5, and 502.7 nm. The leading edge of a tenth peak was clearly visible but situated close to the upper limit of the spectral range, preventing the peak position from being determined with any confidence; however, it appears to coincide with the emission peak at 525.8 nm (Table 1), suggesting these two transitions are the converse of each other. Similarly, the excitation peak at 502.7 nm was coincident (within experimental error), with the emission peak at 501.3 nm. No luminescence excitation spectra have been published previously for johannite, but similar peak positions have been reported for Sr-rich meta-autunite ((Ca,Sr)(UO2)2(PO4)2·2-8H2O [30]), boltwoodite (K,Na(UO2)SiO3OH·1.5H2O [42]), uranophane (Ca(UO2)2(SiO3OH)2·5H2O [43]), and vandendriesscheite (Pb1.5(UO2)10O6(OH)11·11H2O [42]), suggesting that the uranyl ion exhibits common multiple excitation features.
Negligible to weak luminescence intensity has been found with other Cu-bearing uranyl species including vandenbrandeite (CuUO2(OH)4 [44]) and metatorbernite (Cu(UO2)2(PO4)2·8H2O [45,46], whereas other studies have reported a dramatic reduction in luminescence intensity upon the addition of free Cu2+ ions [47,48]. It is unclear from the luminescence spectra alone whether the crystal structure or the incorporated Cu2+ are responsible. Model simulations on the relatively simple vandenbrandeite crystal system revealed very little spatial overlap between the U f- to Cu d-orbitals or O states, which is required for luminescence [44]. It is hypothesised that a similar process might be responsible in the case of johannite, but to a lesser extent than in vandenbrandeite, based on the intense luminescence observed in, for example, uranyl sulphate powder (UO2SO4·3.5H2O; Figure 6) and solutions [49,50]. Unfortunately, the johannite crystal system was too large to accurately simulate the projected density of states (PDOS) and band structure with the computational facilities available.
3.3. Raman Spectroscopy
It is well-known that chemical structure information can be extracted from Raman spectra; however, this technique is prone to luminescence effects masking, either wholly or partly, the Raman transitions [29,30,42,44,51,52,53]. Whilst it is essential to choose a laser wavelength that minimizes luminescence masking, the ability to obtain Raman spectra using multiple lasers enables different regions of a specimen to be probed as the laser wavelength and energy will govern the penetration depth into the specimen; a potential benefit when distinguishing between thin films and bulk substrates.
3.3.1. Multiple-Laser Raman Spectra and Non-Raman Feature Assignment
Raman spectra were collected using lasers operating at 785, 633, 532, and 457 nm (Figure 7). The 785, 633, and 532 nm lasers produced similar spectra, both in terms of the peak position and relative intensity, with the most well-defined features obtained using the 785 nm diode laser. In contrast, the 457 nm spectrum was dominated by a series of intense, repetitive double features, which, given their scarcity in the other spectra shown, are more likely to correspond to luminescence emission rather than Raman transitions. To clarify the origin of these intense doublet features, the Raman wavenumber scale, ν, was first converted into wavelength (nm) units using Equation (1), where λi is the laser wavelength (in this case, 457 nm), and λs is the shift in wavelength from the Raman laser wavelength, and then the doublet features resolved into individual bands.
Figure 7.
Raw johannite Raman spectra, obtained at four laser wavelengths (from top: 785, 633, 532, and 457 nm). For each plot, the Raman shift (in wavenumbers, ν) is shown on the bottom axis and the corresponding wavelength shift from the Raman laser wavelength, λs (in nm; as derived using Equation (1)), on the top axis of each spectrum. The intensity is given in arbitrary units (a.u.).

Six resolved λs peak positions were extracted from the 457 nm Raman spectrum at 495.9, 502.1, 523.9, 540.0, and 547.8 nm (Table 1). Three of these (at 502.1, 523.9, and 547.8 nm) were coincident, within the experimental error, with three of the resolved luminescence emission peaks in Figure 5 with a potential fourth emission peak (at around 578 nm) expected to be situated above the upper detection limit of the Raman 457 nm spectrum. It is also likely that the other three resolved peaks in the 457 nm spectrum (at 495.9, 517.0, and 540.0 nm) correspond to the luminescence emission features, but these originate from a different uranyl phase or polymorph to the former set. The greater resolution of the luminescence features by Raman spectroscopy (Figure 7) compared to those from the TRLFS instrument (Figure 5) correlated to the Raman transitions being relatively weaker and, therefore, requiring a more sensitive detector.
Extraction of the band spacing value from the Raman 457 nm spectrum was performed using the same method as for the luminescence emission data discussed above. When all the resolved peak positions were included, the band spacing values, in order of increasing emission wavelength, were 249, 574, 255, 569, and 264 cm−1. Excluding the additional peaks not observed in the luminescence emission spectrum (Figure 5), a mean band spacing value of 831 cm−1 was obtained, correlating well with the Raman ν1(UO2)2+ position reported by Driscoll et al. [29], whereas the value derived using the remaining three peaks (at 495.9, 517.0, and 540.0 nm) was 823 cm−1 and closer to that quoted by Frost et al. [4]. Only one of these band spacing values can be attributed to johannite, whereas the other could correspond to meta-johannite present as a thin film on the johannite fragments. Unfortunately, there is no published Raman spectrum for the dehydrated phase to confirm this hypothesis. Alternatively, the second luminescing phase might originate from an inclusion present in the NMW specimen. Of these, gypsum, a known luminescent mineral, emits a very broad peak rather than a series of discrete luminescence features in the visible region [54]. The other copper uranyl sulphate, pseudojohannite, can be excluded as its ν1(UO2)2+ peak positions were at lower wavenumbers (805 and 810 nm [55]). Thus, the origin of the 485.9, 517.0, and 540.0 nm luminescence features in the 457 nm Raman spectrum remains unclear. As noted previously, natrozippeite is not present in the separated johannite sample and, in any case, the known ν1(UO2)2+ peak position for this phase is at higher wavenumbers (~840 cm−1 [29,56]).
Below 1100 cm−1, the 457 nm Raman spectrum contains three sharp, but weak intensity peaks situated at 1095, 1041, and 833 cm−1 (Figure 7, insert), which appear to correlate with the three most intense features observed in the 532, 633, and (below 1200 cm−1) 785 nm spectra, suggesting that these three peaks (at 1095, 1041, and 833 cm−1) are Raman transitions. However, another Raman laser operating at a higher wavelength is required to obtain the necessary high-quality spectral data for phase confirmation.
3.3.2. Resolved 785 nm Raman Spectrum
The most well-defined Raman feature in Figure 7 was obtained using the 785 nm laser. This was resolved into individual peaks (Figure 8) with the peak positions reported in Table 2 alongside the published values [4,29]. The most intense feature across the spectrum was a sharp peak at 834 ± 3 cm−1 (with the error taken as the variation between repeats) and was assigned to the ν1(UO2)2+ mode; suggesting the 502.1, 523.9, and 547.8 nm luminescence emission peaks resolved in the 457 nm Raman spectrum (Figure 7) originate from johannite. No ν1(UO2)2+ peak corresponding to the band spacing value of 823 cm−1 or that reported by Frost et al. [4] (at 812 cm−1) were observed above the background noise (Figure 8).
The ν1(UO2)2+ peak position was used to extract the U-O bond length, dU-O (in Å), using a relationship derived by Bartlett and Cooney [57] (Equation (2)), which appears to hold well for all minerals [57]. Here, a dU-O value of 1.78 ± 0.01 Å was obtained, with the error taken as the full range variation in the ν1(UO2)2+ peak position, which is consistent, within the experimental error, with the value of 1.78 Å reported by Mereiter [24], based on XRD analysis.
Bartlett and Cooney [57] also derived another equation linking the peak position of the uranyl antisymmetric stretch vibration, ν3(UO2)2+, mode to dU-O (Equation (3)); this is more commonly used with IR characterisation as the ν3(UO2)2+ mode is IR strong and Raman weak. The predicted ν3(UO2)2+ mode position for johannite was 911 ± 4 cm−1, but no peaks in this region were detected above the background in this study (Figure 8a). This observation is consistent with the findings of Driscoll et al. [29], whereas Frost et al. [4] assigned a Raman peak at 948 cm−1 to the ν3(UO2)2+ mode based on their IR spectral interpretation for the same specimen (at 936 and 898 cm−1 [4]). Confirmation of the modal assignment for the peaks in this region was attempted by simulating the Raman spectrum; however, the johannite crystal system was too large to compute accurately using the modelling facilities available.
The resolved ν1(UO2)2+ Raman feature can also be used to estimate the U-O bond force constant, kU-O, using Badger’s rule (Equation (4) [58,59]) where kU-O is in units of millidynes Å−1 (1 millidyne Å−1 equals 100 N m−1). A kU-O value of 5.63 ± 0.08 millidynes Å−1 was obtained with the error calculated from the variation in the ν1(UO2)2+ mode peak position. To the best of our knowledge, kU-O has not been calculated for johannite previously; however, similar values have been reported for uranyl oxyhydroxides [42,44], carbonates [60], phosphates [30,45,53], and silicates [43].
At higher wavenumbers, the johannite Raman spectrum displayed a broad multiple peak feature (Figure 8a) covering the region of the sulphate ligand antisymmetric stretch, ν3(SO4)2−, and symmetric stretch, ν1(SO4)2−, modes. Five peaks were resolved for the ν3(SO4)2− mode (at 1224, 1184, 1147, 1100, and 1090 cm−1), more than in either of the two previous studies. Frost et al. [4] resolved three peaks at 1147, 1100, and 1090 cm−1 whereas Driscoll et al. [29] reported a single peak at 1095 cm−1. Differences in spectral resolution among the various studies need to be considered; the 0.2 cm−1 resolution used by Driscoll et al. [29] was considerably lower than that used in this (~1.5 cm−1) or Frost et al.’s work (~2 cm−1 [4]), suggesting that another process is responsible for the observed degree of splitting of the ν3(SO4)2− mode. Previous Raman studies on uranyl phosphates have hypothesised that the degree of splitting in the phosphate ligand antisymmetric stretch, ν3(PO4)3−, mode corresponds to sample dehydration, enabling autunite (Ca(UO2)2(PO4)2·11H2O) and meta-autunite (Ca(UO2)2(PO4)2·2-8H2O) to be distinguished [29,30]. It is plausible that a similar relationship exists between the ν3(SO4)2− mode splitting and degree of dehydration for johannite, although further studies on variably hydrated uranyl sulphate specimens are required for confirmation.
A single peak was resolved for the ν1(SO4)2− mode at 1043 cm−1 and is consistent, within the experimental error, with the two previous johannite Raman studies (Table 2; [4,29]). At even higher wavenumbers, three very broad Raman features were resolved at 1590, 1505, and 1345 cm−1 (Figure 8b); the highest position peak was assigned to the water bending mode, whereas the latter two resolved peaks could correspond to OH vibrations within the johannite structure, although simulated Raman studies are required to confirm this. Confirmation of the modal assignment for the resolved 1505 and 1345 cm−1 peaks was attempted, but the johannite crystal system was too large to accurately simulate the Raman spectrum using the modelling facilities available.
Several weak intensity peaks were observed below 700 cm−1 (Figure 8c). The peak resolved at 625 cm−1 was attributed to the sulphate ligand antisymmetric bending, ν4(SO4)2−, mode whereas the two peaks at 448 and 351 cm−1 were assigned to the sulphate ligand symmetric bending, ν2(SO4)2−, mode. Both published studies report the position of the ν4(SO4)2− and ν2(SO4)2− modes to be outside the experimental error range found in this work (Table 2; [4,29]). This is likely to be due to the weak Raman signal detected for the ν4(SO4)2- and ν2(SO4)2− modes rather than any differences in the chemical composition and/or phase purity of the specimens used.
The two peaks resolved at 244 and 202 cm−1 (Figure 8c) were assigned to the uranyl symmetric stretch, ν2(UO2)2+, mode and were in good agreement with those reported by Driscoll et al. [29]. The remaining resolved features were attributed to general lattice vibrations. It should be noted that Frost et al. [4] observed an additional peak at 302 cm−1, which they assigned to a Cu–O stretching vibration. However, neither this study nor that of Driscoll et al. [29] observed a similar feature in this region.
3.3.3. Summary of Spectral Findings
Reproducible Raman spectra were obtained using 785, 633, and 532 nm lasers with the most well-defined features obtained at 785 nm. Observations of the two dominant modes, ν1(UO2)2+ and ν1(SO4)2−, alone can confirm the identification of the NMW specimen as a uranyl sulphate, highlighting the potential benefit of using Raman spectroscopy as a remotely deployed technique in the field. In contrast, the 457 nm Raman spectrum was dominated by luminescence features from uranyl ions situated in two distinct environments, with one of these corresponding specifically to johannite.
4. Conclusions
Detailed characterisation of uranyl sulphate phases is feasible using a suite of in situ laser-based analytical techniques; however, reliable reference spectra for potential mineral phases are required before these techniques can be applied routinely. The uranyl sulphate mineral, johannite, was characterised by luminescence and multiple-laser Raman spectroscopy; the first study to report both luminescence emission and excitation spectra for this phase. Chemical composition and phase purity were confirmed through the well-established, but laboratory-confined, methods of SEM-EDXA and XRD.
Similarly shaped Raman spectra were obtained using the 785, 633, and 532 nm lasers with the most well-defined features observed at 785 nm. Fourteen peaks were resolved with peak positions corresponding to the published johannite Raman spectra. Some variation in the number of peaks was observed amongst studies, likely due to some transitions emitting low Raman signals; however, provided that the two dominant modes (ν1(UO2)2+ and ν1(SO4)2−) are detectable, the specimen can be identified as a uranyl sulphate by this technique alone. In contrast, the 457 nm Raman spectrum was mostly masked by doublet luminescence emission features, from which band spacing values of 831 and 823 cm−1 were extracted; the former is coincident with both the ν1(UO2)2+ peak position and the band spacing obtained from the luminescence emission spectrum. Four emission and nine excitation peaks were resolved from the luminescence spectra.
Overall, this study has shown that luminescence and Raman spectroscopy are suitable, complementary analytical techniques for characterising johannite specimens. Both offer promise for remotely operated, in situ characterisation in environments where intrusive sampling, transportation, and laboratory-bound analysis is not feasible. The recommended application order would be Raman for rapid identification and to obtain information on chemical structure, and then luminescence spectroscopy for precise phase determination.
Author Contributions
Conceptualisation, D.R.; Validation, V.L.F., A.E.M. and D.R.; Formal analysis, V.L.F. and A.E.M.; Investigation, V.L.F.; Resources; data curation, V.L.F. and A.E.M.; Writing—original draft preparation, V.L.F. and A.E.M.; Writing—review and editing, D.R.; Visualisation, V.L.F. and A.E.M.; Supervision, D.R.; Project administration, D.R.; Funding acquisition, D.R. All authors have read and agreed to the published version of the manuscript.
Funding
This research was funded by two Engineering and Physical Science Research Council projects (EP/L014041/1–DISTINCTIVE and EP/S01019X/1–TRANSCEND). The Raman and TRLFS apparatus are supported by capital grants from the Engineering and Physical Science Research Council (EP/M022749/1) and the Natural Environment Research Council (NERC/CC041), respectively.
Data Availability Statement
Not applicable.
Acknowledgments
The authors wish to thank Tom Cotterell from the National Museum of Wales for the loan of the reference mineral sample. Acknowledgements are also given to John-William Brown, Sarah Heisig, Michele Willows, Dave Jones, Dan Driscoll, and Carol Crean (all University of Surrey) for their advice and support.
Conflicts of Interest
The authors declare no conflict of interest.
References
- Gurzhiy, V.V.; Plášil, J. Structural complexity of natural uranyl sulfates. Acta Crystallogr. B 2019, 75, 39–48. [Google Scholar] [CrossRef] [PubMed] [Green Version]
- Finch, R.J.; Murakami, T. Systematics and paragenesis of uranium minerals. In Uranium: Mineralogy, Geochemistry and the Environment; Reviews in Mineralogy and Geochemistry; Burns, P.C., Finch, R.J., Eds.; Mineralogical Society of America: Chantilly, VA, USA, 1999; Volume 38, pp. 91–180. [Google Scholar]
- Brugger, J.; Wallwork, K.S.; Meisser, N.; Pring, A.; Onduš, P.; Čejka, J. Pseudojohannite from Jáchymov, Musonoï and La Creusaz: A new member of the zippeite group. Am. Miner. 2006, 91, 929–936. [Google Scholar] [CrossRef]
- Frost, R.J.; Erickson, K.L.; Čejka, J.; Reddy, B.J. A Raman spectroscopic study of the uranyl sulphate mineral johannite. Spectrochim. Acta A 2005, 61, 2702–2707. [Google Scholar] [CrossRef] [PubMed] [Green Version]
- Brugger, J.; Burns, P.C.; Meisser, N. Contribution to the mineralogy of acid drainage of uranium minerals: Marecottite and the zippeite-group. Am. Miner. 2003, 88, 676–685. [Google Scholar] [CrossRef]
- Johnson, D.B.; Hallberg, K.B. Acid mine drainage remediation options: A review. Sci. Total Environ. 2005, 338, 3–14. [Google Scholar] [CrossRef]
- Arnold, T.; Baumann, N.; Krawczyk-Bärsch, E.; Brockmann, S.; Zimmermann, U.; Jenk, U.; Weiβ, S. Identification of the uranium speciation in an underground acid mine drainage environment. Geochim. Cosmochim. Acta 2011, 75, 2200–2212. [Google Scholar] [CrossRef]
- Plášil, J.; Sejkora, J.; Škoda, R.; Škácha, P. The recent weathering of uraninite from the Červená vein, Jáchymov (Czech Republic): A fingerprint of the primary mineralization geochemistry onto the alteration association. J. Geosci. 2014, 59, 223–253. [Google Scholar] [CrossRef] [Green Version]
- Plášil, J.; Dušek, M.; Čejka, J.; Sejkora, J. The crystal stricture of rabejacite, the Ca2+-dominant member of the zippeite group. Miner. Mag. 2014, 78, 1249–1264. [Google Scholar] [CrossRef]
- Plášil, J.; Fejfarová, K.; Wallwork, K.S.; Dušek, M.; Škoda, R.Š.; Sejkora, J.; Čejka, J.Č.; Veselovský, F.; Hloušek, J.; Meisser, N.; et al. Crystal structure of pseudojohannite, with a revised formula, Cu3(OH)2[(UO2)4O4(SO4)2](H2O)12. Am. Miner. 2012, 97, 1796–1803. [Google Scholar] [CrossRef]
- Plášil, J.; Kampf, A.R.; Kasatkin, A.V.; Škoda, R.Š.; Silva, S.; Čejka, J. Meisserite, Na5(UO2)(SO4)3(SO3OH)(H2O), a new uranyl sulphate mineral from the Blue Lizard mine, San Juan County, Utah, USA. Miner. Mag. 2013, 77, 2975–2988. [Google Scholar] [CrossRef]
- Plášil, J.; Fejfarová, K.; Škoda, R.Š.; Dušek, M.; Marty, J.; Čejka, J. The crystal structure of magnesiozippeite, Mg[(UO2)2O2(SO4)](H2O)3.5, from East Saddle mine, San Juan County, Utah (U.S.A.). Miner. Petrol. 2013, 107, 211–219. [Google Scholar] [CrossRef]
- Plášil, J.; Kampf, A.R.; Kasatkin, A.V.; Marty, J. Bluelizardite, Na7(UO2)(SO4)4Cl(H2O)2, a new uranyl sulphate mineral from the Blue Lizard mine, San Juan County, Utah, USA. J. Geosci. 2014, 59, 145–158. [Google Scholar] [CrossRef]
- Kampf, A.R.; Plášil, J.; Kasatkin, A.V.; Marty, J. Belakovskiite, Na7(UO2)(SO4)4(SO3OH)(H2O)3, a new uranyl sulphate mineral from the Blue Lizard mine, San Juan County, Utah, USA. Miner. Mag. 2014, 78, 639–649. [Google Scholar] [CrossRef]
- Kampf, A.R.; Plášil, J.; Kasatkin, A.V.; Marty, J. Bobcookite, NaAl(UO2)2(SO4)4·18H2O, and wetherillite, Na2Mg(UO2)2(SO4)4·18H2O, two new uranyl sulphate minerals from the Blue Lizard mine, San Juan County, Utah, USA. Miner. Mag. 2015, 79, 695–714. [Google Scholar] [CrossRef]
- Kampf, A.R.; Kasatkin, A.V.; Čejka, J.; Marty, J. Plášilite, Na(UO2)(SO4)(OH)·2H2O, a new uranyl sulphate minerals from the Blue Lizard mine, San Juan County, Utah, USA. J. Geosci. 2015, 60, 1–10. [Google Scholar] [CrossRef] [Green Version]
- Kampf, A.R.; Plášil, J.; Olds, T.; Nash, B.; Marty, J. Ammoniozippeite, a new uranyl sulphate mineral from the Blue Lizard mine, San Juan County, and the Burro mine, San Miguel County, Colorado, USA. Can. Miner. 2018, 56, 235–245. [Google Scholar] [CrossRef]
- Rosborg, B.; Werme, L. The Swedish nuclear waste program and the long-term corrosion behaviour of copper. J. Nucl. Mater. 2008, 379, 142–153. [Google Scholar] [CrossRef]
- Olds, T.; Plášil, J.; Kampf, A.; Burns, P.; Nash, B.; Marty, J.; Carlson, S. Redcanyonite, (NH4)2Mn[(UO2)4O4(SO4)2](H2O)4, a new zippeite-group mineral from the Blue Lizard mine, San Juan County, Utah, USA. Miner. Mag. 2018, 82, 1261–1275. [Google Scholar] [CrossRef]
- King, F.; Lilja, C.; Pederson, K.; Pitkänen, P.; Vähänen, M. An update of the state-of-the-art report on the corrosion of copper under expected conditions in a deep geologic repository. In Technical Report SKB-TR-10-67; Swedish Nuclear Fuel and Waste Management Company: Stockholm, Sweden, 2010. [Google Scholar]
- Hall, D.S.; Keech, P.G. An overview of the Canadian corrosion program for the long-term management of nuclear waste. Corros. Engin. Sci. Technol. 2017, 52, 2–5. [Google Scholar] [CrossRef] [Green Version]
- Marcos, N. Native copper as a natural analogue for copper canisters. In Nuclear Waste Commission of Finnish Power Companies; Technical Report YJT-89-18; Nuclear Waste Commission of Finnish Power Companies: Helsinki, Finland, 1989. [Google Scholar]
- King, F.; Lilja, C.; Vähänen, M. Progress in the understanding of the long-term corrosion behaviour of copper canisters. J. Nucl. Mater. 2013, 438, 228–237. [Google Scholar] [CrossRef]
- Mereiter, K. The crystal structure of johannite, Cu(UO2)2(OH)2(SO4)2·8H2O [Die kristallstruktur des johannits, Cu(UO2)2(OH)2(SO4)2·8H2O]. Tschermaks Mineral. Und Petrograposche Mitt. 1982, 30, 47–57. [Google Scholar] [CrossRef]
- Momma, K.; Izumi, F. VESTA3 for three-dimensional visualization of crystal, volumetric and morphology data. J. Appl. Crystal. 2011, 44, 1272–1276. [Google Scholar] [CrossRef]
- Harmon, R.S.; Senesi, G.S. Laser-induced breakdown spectroscopy—A geochemical tool for the 21st century. Appl. Geochem. 2021, 118, 100766. [Google Scholar] [CrossRef]
- Kato, Y.; Meinrath, G.; Kimera, T.; Yoshida, Z. A study of U(VI) hydrolysis and carbonate complexation by time-resolved laser-induced fluorescence spectroscopy (TRLFS). Radiochim. Acta 1994, 64, 107–111. [Google Scholar] [CrossRef]
- Izake, E.L. Forensic and homeland security applications of modern portable Raman spectroscopy. Forensic. Sci. Int. 2010, 202, 1–8. [Google Scholar] [CrossRef]
- Driscoll, R.J.P.; Wolverson, D.; Mitchels, J.M.; Skelton, J.M.; Parker, S.C.; Molinari, M.; Khan, I.; Geeson, D.; Allen, G.C. A Raman spectroscopic study of uranyl minerals from Cornwall, UK. RSC Adv. 2014, 4, 59137–59149. [Google Scholar] [CrossRef] [Green Version]
- Frankland, V.L.; Milodowski, A.E.; Read, D. Characterisation of meta-autunite: Towards identifying potential alteration products of spent nuclear fuel. Appl. Geochem. 2020, 123, 104792. [Google Scholar] [CrossRef]
- Lee, W.H.; Crean, C.; Varcoe, J.R.; Bance-Soualhi, R. A Raman spectromicroscopic investigation of ETFE-based radiation-grafted anion-exchanged membranes. RSC Adv. 2017, 7, 47726–47737. [Google Scholar] [CrossRef] [Green Version]
- Larsen, E.S.; Berman, H. The identity of gilpinite and johannite. Am. Miner. 1926, 11, 1–5. [Google Scholar]
- Hurlbut, C.S. Studies of uranium minerals (IV): Johannite. Am. Miner. 1950, 35, 531–535. [Google Scholar]
- Sokol, F.; Čejka, J. A thermal and mass spectroscopic study of synthetic johannite [Cu(UO2)2(SO4)2(OH)2·8H2O]. Thermochim. Acta 1992, 206, 235–242. [Google Scholar] [CrossRef]
- Ondruš, P.; Veselovský, F.; Hloušek, J.; Skála, R.; Vavřín, I.; Frýda, J.; Čejka, J.; Gabašová, A. Secondary minerals of the Jáchymov (Joachimsthal) ore district. J. Geosci. 1997, 42, 3–76. [Google Scholar]
- Anthony, J.W.; Bideaux, R.A.; Bladh, K.W.; Nichols, M.C. Handbook of Mineralogy; Mineralogical Society of America: Chantilly, VA, USA, 2001. [Google Scholar]
- Bell, J.T.; Biggers, R.E. Absorption spectrum of the uranyl ion in perchlorate media: III. Resolution of the ultraviolet band structure; some conclusions concerning the excited state of UO22+. J. Mol. Struct. 1968, 25, 312–329. [Google Scholar] [CrossRef]
- Wang, Z.; Zachara, J.M.; Yantassee, W.; Gassman, P.L.; Liu, C.; Joly, A.G. Cryogenic laser induced fluorescence characterisation of U(VI) in Hanford vadose zone pore waters. Environ. Sci. Technol. 2004, 38, 5591–5597. [Google Scholar] [CrossRef] [Green Version]
- Tits, J.; Walther, C.; Stumpf, T.; Mace, N.; Wieland, E. A luminescence line-narrowing spectroscopic study of the uranium(VI) interaction with cementitious materials and titanium dioxide. Dalton Trans. 2015, 44, 966–976. [Google Scholar] [CrossRef] [Green Version]
- Philipp, T.; Azzam, S.S.A.; Rossberg, A.; Huittinen, N.; Schmeide, K.; Stumpf, T. U(VI) sorption on Ca-bentonite at (hyper)alkaline conditions—Spectroscopic investigations of retention mechanisms. Sci. Total Environ. 2019, 676, 469–481. [Google Scholar] [CrossRef] [Green Version]
- Demnitz, M.; Hilpmann, S.; Lösch, H.; Bok, F.; Steudtner, R.; Patzschke, M.; Stumpf, T.; Huittinen, N. Temperature-dependent luminescence spectroscopic investigations of uranyl(VI) complexation with the halides F− and Cl−. Dalton Trans. 2020, 49, 7109–7122. [Google Scholar] [CrossRef]
- Frankland, V.L.; Milodowski, A.E.; Bright, J.W.G.; Read, D. The use of Raman and TRLF spectroscopy for differentiating early stage alteration products of spent nuclear fuel. Appl. Geochem. 2021, 130, 104934. [Google Scholar] [CrossRef]
- Frankland, V.L.; Rickman, S.P.; Milodowski, A.E.; Read, D. Characterisation of uranophane and boltwoodite by Raman, luminescence and laser-induced breakdown spectroscopy. Appl. Geochem. 2022, 138, 105183. [Google Scholar] [CrossRef]
- Frankland, V.L.; Milodowski, A.E.; Lawrence, R.A.; Sacchi, M.; Read, D. Characterisation of the potential spent nuclear fuel alteration product vandenbrandeite. Am. Miner. 2022, in press. [Google Scholar] [CrossRef]
- Faulques, E.; Kalashnyk, N.; Massuyeau, F.; Perry, D.L. Spectroscopic markers for uranium(VI) phosphates: A vibronic study. RSC Adv. 2015, 5, 71219–71227. [Google Scholar] [CrossRef]
- Massuyeau, F.; Perry, D.L.; Kalashynyk, N.; Faulques, E. Spectroscopic markers for uranium(VI) phosphates. Part II: The use of time-resolved photoluminescence. RSC Adv. 2017, 7, 919–926. [Google Scholar] [CrossRef] [Green Version]
- Therien, M.J. Physical chemistry: How to improve your image. Nature 2009, 458, 716–717. [Google Scholar] [CrossRef] [PubMed]
- Warrier, S.B.; Kharkar, P.S. A coumarin based chemosensor for selective determination of Cu(II) ions based on fluorescence quenching. J. Lumines 2018, 199, 407–415. [Google Scholar] [CrossRef]
- John, J.; Filipská, H.; Černichivá, K.; Beneš, P.; Semelová, M.; Bočan, J.; Geipel, G.; Kubeček, V. New TRLFS laboratory at the CTU in Prague. Czech. J. Phys. 2006, 56, D565–D568. [Google Scholar] [CrossRef]
- Vercouter, T.; Vitorge, P.; Amekraz, B.; Moulin, C. Stoichiometries and thermodynamics stabilities for aqueous sulphate complexes of U(VI). Inorg. Chem. 2008, 47, 2180–2189. [Google Scholar] [CrossRef]
- Lin, D.H.M.; Manara, D.; Lindqvist-Reis, P.; Fanghänel, T.; Mayer, K. The use of different dispersive Raman spectrometers for the analysis of uranium compounds. Vib. Spectrosc. 2014, 73, 102–110. [Google Scholar] [CrossRef]
- Ho, D.M.L.; Jones, A.E.; Goulermas, J.Y.; Tuner, P.; Varga, Z.; Fongaro, L.; Fanghänel, T.; Mayer, K. Raman spectroscopy of uranium compounds and the use of multivariate analysis for visualization and classification. Forensic. Sci. Int. 2015, 251, 61–68. [Google Scholar] [CrossRef]
- Frankland, V.L.; Bance-Soualhi, R.; Read, D. Raman analysis of meta-autunite. In Environmental Radiochemical Analysis; Evans, N., Ed.; RSC: Croydon, UK, 2019; Volume VI, pp. 79–88. [Google Scholar]
- Taga, M.; Kono, T.; Yamashita, N. Photoluminescence of the properties of gypsum. J. Miner. Petrol. Sci. 2011, 106, 169–174. [Google Scholar] [CrossRef] [Green Version]
- Frost, R.L.; Plášil, J.; Čejka, J.; Sejkora, J.; Keefe, E.C.; Bahfenne, S. Raman spectroscopic study of the uranyl mineral pseudojohannite Cu6.5[(UO2)4O4(SO4)2]2(OH)5·2.5H2O. J. Raman Spectrosc. 2009, 40, 1816–1821. [Google Scholar] [CrossRef] [Green Version]
- Frost, R.L.; Čejka, J.; Ayoko, G.A.; Weier, M.L. Raman spectroscopic and SEM analysis of sodium-zippeite. J. Raman Spectrosc. 2007, 38, 1311–1319. [Google Scholar] [CrossRef] [Green Version]
- Bartlett, J.R.; Cooney, R.P. On the determination of uranium oxygen bond lengths in dioxouranium(VI) compounds by Raman spectroscopy. J. Mol. Struct. 1989, 193, 295–300. [Google Scholar] [CrossRef]
- Badger, R.M. Between the internuclear distances and force constants of molecules and its application to polyatomic molecules. J. Chem. Phys. 1935, 3, 710–714. [Google Scholar] [CrossRef]
- Jones, L.H. Determination of U-O bond distance in uranyl complexes from their infrared spectra. Spectrochim. Acta 1959, 15, 409–411. [Google Scholar] [CrossRef]
- Frankland, V.L.; Milodowski, A.E.; Read, D. Characterisation of andersonite by Raman, luminescence and laser-induced breakdown spectroscopy. Appl. Geochem. 2022, 142, 105353. [Google Scholar] [CrossRef]
Figure 1.
Johannite crystal structure images of: (a) the uranyl sulphate sheet; and (b) sheet-interlayer stacking. Atoms of U, O, S, and Cu are coloured green, red, yellow, and grey, respectively, with water molecules shown in light blue. The images were created using VESTA-3 software [25] based on the X-ray diffraction analysis by Mereiter [24].

Figure 2.
Optical photomicrographs of johannite fragments from sample NMW 67.154GR.69: (a) typical fragments of loosely aggregated and finely crystalline green to pale yellow-green johannite, with localised races of staining by orange-brown iron oxyhydroxide; and (b) detail of a johannite fragment showing a mass of fine, lath-like crystals with a vitreous lustre.

Figure 3.
(a–d) BSE images of johannite sample NMW 67.154GR.69: (a) typical fragment showing a loose aggregate of microcrystalline johannite crystals; (b) detailed image showing rosette-like aggregates of radiating bladed prisms of euhedral johannite crystals; (c) detailed image showing thick tabular or blocky prismatic morphology of johannite crystals. Some crystals displayed small wedge-shaped cracks, possible due to minor dehydration and shrinkage under the electron beam. Traces of microcrystalline gypsum were present between the johannite crystals; (d) aggregates of fine acicular gypsum occurring between crystals of johannite, again displaying small shrinkage cracks; (e) EDXA spectrum of johannite with the peaks labelled with their elemental assignment.

Figure 4.
The XRD pattern of johannite sample NMW 67.154GR.69 with the peaks labelled with the lattice spacings (in Å). Reference XRD patterns for johannite, pseudojohannite, and gypsum (minor species) from the HighScore database (PANalytical HighScore Plus version 3.0) and Brugger et al. [3] are shown underneath for comparison (top panel) and a “background” XRD pattern of the double-sided tape used to secure the crystal fragments in place (bottom panel). Intensity is given in arbitrary units (a.u.).

Figure 5.
Resolved luminescence excitation (a) and emission spectrum (b) for the NMW johannite specimen; the thick black line represents the experimental data, the blue line the individual peaks, and the red line the overall resolved fit. λem and λex were held at 543.0 and 357.6 nm, respectively. Intensity is given in arbitrary units (a.u.).

Figure 6.
Raw luminescence emission spectrum for uranyl sulphate powder (UO2SO4·3.5H2O) with λex held at 266.0 nm. Intensity is given in arbitrary units (a.u.).
Figure 6.
Raw luminescence emission spectrum for uranyl sulphate powder (UO2SO4·3.5H2O) with λex held at 266.0 nm. Intensity is given in arbitrary units (a.u.).

Figure 8.
Resolved (a–c) 785 nm Raman spectra for johannite (NMW 67.154GR.69). The thick black line represents the experimental data, the blue lines are the individual peaks, and the red line is the overall resolved fit. Intensity is given in arbitrary units (a.u.).
Figure 8.
Resolved (a–c) 785 nm Raman spectra for johannite (NMW 67.154GR.69). The thick black line represents the experimental data, the blue lines are the individual peaks, and the red line is the overall resolved fit. Intensity is given in arbitrary units (a.u.).


Table 1.
Summary of the resolved peak positions for johannite (NMW 67.154GR.9) from the luminescence emission (λem) and excitation (λex) spectra (Figure 5) and non-Raman features in the 457 nm Raman spectrum (Figure 7). Intensity described as strong (s), medium (m), weak (w), and very weak (vw). The error in the peak position was taken as twice the bandwidth setting (±3.0 nm) for the luminescence data and the variation between Raman measurements (±0.2 nm).
| λex/nm | λem/nm | Non-Raman Features from the 457 nm Spectrum/nm |
|---|---|---|
| 351.6 (vw) | - | 495.9 (m) |
| 360.5 (vw) | 501.3 (vw) | 502.1 (m) |
| 369.6 (vw) | - | 517.0 (s) |
| 427.0 (vw) | 525.8 (vw) | 523.9 (m) |
| 441.5 (vw) | - | 540.0 (m) |
| 457.1 (vw) | 548.5 (vw) | 547.8 (w) |
| 470.0 (vw) | 578.0 (vw) | - |
| 486.5 (vw) | ||
| 502.7 (vw) |
Table 2.
Summary of Raman data for johannite with comparisons to the published spectra. Signal intensity is described as strong (s), medium (m), weak (w), and very weak (vw) with shoulder and broad peaks represented as sh and b, respectively. The error in the peak position for this study was ±3 cm−1 based on the variation between repeats.
| Assignment | ν (This Study, NMW 67.154GR.69)/cm−1 | ν (Johannite [4])/cm−1 | ν (Johannite [29])/cm−1 |
|---|---|---|---|
| ν3(SO4)2− | 1224 (m,b) | - | - |
| 1184 (m,b,sh) | - | - | |
| 1147 (w,b,sh) | 1147 | - | |
| 1100 (w,sh) | 1100 | - | |
| 1090 (w) | 1090 | 1095 | |
| ν1(SO4)2− | 1043 (w) | 1042 | 1045 |
| ν3(UO2)2+ | - | 948 | - |
| ν1(UO2)2+ | 834 (s) | - | 836 |
| - | 812 | - | |
| - | 788 | - | |
| - | 756 | - | |
| ν4(SO4)2− | 625 (vw) | - | - |
| - | 539 | - | |
| - | - | 488 | |
| ν2(SO4)2− | - | 481 | - |
| 447 (w,b) | - | - | |
| - | 384 | - | |
| 351 (w,b) | - | 352 | |
| ν2(UO2)2+ | - | 277 | - |
| 244 (vw) | - | 244 | |
| 202 (vw) | 205 | 203 | |
| Lattice vibrations | 128 (vw) | - | - |
| 84 (vw) | - | - |
Publisher’s Note: MDPI stays neutral with regard to jurisdictional claims in published maps and institutional affiliations. |
© 2022 by the authors. Licensee MDPI, Basel, Switzerland. This article is an open access article distributed under the terms and conditions of the Creative Commons Attribution (CC BY) license (https://creativecommons.org/licenses/by/4.0/).
Share and Cite
MDPI and ACS Style
Frankland, V.L.; Milodowski, A.E.; Read, D. Laser-Based Characterisation of the Copper Uranyl Sulphate, Johannite. Minerals 2022, 12, 1419. https://doi.org/10.3390/min12111419
AMA Style
Frankland VL, Milodowski AE, Read D. Laser-Based Characterisation of the Copper Uranyl Sulphate, Johannite. Minerals. 2022; 12(11):1419. https://doi.org/10.3390/min12111419
Chicago/Turabian StyleFrankland, Victoria L., Antoni E. Milodowski, and David Read. 2022. "Laser-Based Characterisation of the Copper Uranyl Sulphate, Johannite" Minerals 12, no. 11: 1419. https://doi.org/10.3390/min12111419
Note that from the first issue of 2016, this journal uses article numbers instead of page numbers. See further details here.