
Multiparametric Ultrasound of Cervical Lymph Node Metastases in Head and Neck Cancer for Planning Non-Surgical Therapy

 , and
, and
Abstract
:1. Introduction
2. Materials and Methods
3. Results
4. Discussion
Supplementary Materials
Author Contributions
Funding
Institutional Review Board Statement
Informed Consent Statement
Data Availability Statement
Conflicts of Interest
References
- Wendl, C.M.; Müller, S.; Meier, J.; Fellner, C.; Eiglsperger, J.; Gosau, M.; Prantl, L.; Stroszczynski, C.; Jung, E.M. High resolution contrast-enhanced ultrasound and 3-tesla dynamic contrast-enhanced magnetic resonance imaging for the preoperative characterization of cervical lymph nodes: First results. Clin. Hemorheol. Microcirc. 2012, 52, 153–166. [Google Scholar] [CrossRef]
- Künzel, J.; Strieth, S.; Wirth, G.; Bozzato, A. Ultrasound in the Re-Staging of Cervical Metastases after Chemoradiotherapy for Head and Neck Cancer. Ultraschall Med. 2018, 39, 659–666. [Google Scholar] [CrossRef] [PubMed]
- Chami, L.; Giron, A.; Ezziane, M.; Leblond, V.; Charlotte, F.; Pellot-Barakat, C.; Lucidarme, O. Quantitative and Qualitative Approach for Shear Wave Elastography in Superficial Lymph Nodes. Ultrasound Med. Biol. 2021, 47, 2117–2127. [Google Scholar] [CrossRef] [PubMed]
- Săftoiu, A.; Gilja, O.H.; Sidhu, P.S.; Dietrich, C.F.; Cantisani, V.; Amy, D.; Bachmann-Nielsen, M.; Bob, F.; Bojunga, J.; Brock, M.; et al. The EFSUMB Guidelines and Recommendations for the Clinical Practice of Elastography in Non-Hepatic Applications: Update 2018. Ultraschall Med. 2019, 40, 425–453. [Google Scholar] [CrossRef] [PubMed] [Green Version]
- Ferraioli, G.; Wong, V.W.-S.; Castera, L.; Berzigotti, A.; Sporea, I.; Dietrich, C.F.; Choi, B.I.; Wilson, S.R.; Kudo, M.; Barr, R.G. Liver Ultrasound Elastography: An Update to the World Federation for Ultrasound in Medicine and Biology Guidelines and Recommendations. Ultrasound Med. Biol. 2018, 44, 2419–2440. [Google Scholar] [CrossRef] [PubMed] [Green Version]
- Desmots, F.; Fakhry, N.; Mancini, J.; Reyre, A.; Vidal, V.; Jacquier, A.; Santini, L.; Moulin, G.; Varoquaux, A. Shear Wave Elastography in Head and Neck Lymph Node Assessment: Image Quality and Diagnostic Impact Compared with B-Mode and Doppler Ultrasonography. Ultrasound Med. Biol. 2016, 42, 387–398. [Google Scholar] [CrossRef] [PubMed]
- Rüger, H.; Psychogios, G.; Jering, M.; Zenk, J. Multimodal Ultrasound Including Virtual Touch Imaging Quantification for Differentiating Cervical Lymph Nodes. Ultrasound Med. Biol. 2020, 46, 2677–2682. [Google Scholar] [CrossRef] [PubMed]
- Cosgrove, D.; Piscaglia, F.; Bamber, J.; Bojunga, J.; Correas, J.-M.; Gilja, O.H.; Klauser, A.S.; Sporea, I.; Calliada, F.; Cantisani, V.; et al. EFSUMB guidelines and recommendations on the clinical use of ultrasound elastography. Part 2: Clinical applications. Ultraschall Med. 2013, 34, 238–253. [Google Scholar] [CrossRef] [PubMed] [Green Version]
- Shiina, T.; Nightingale, K.R.; Palmeri, M.L.; Hall, T.J.; Bamber, J.C.; Barr, R.G.; Castera, L.; Choi, B.I.; Chou, Y.-H.; Cosgrove, D.; et al. WFUMB guidelines and recommendations for clinical use of ultrasound elastography: Part 1: Basic principles and terminology. Ultrasound Med. Biol. 2015, 41, 1126–1147. [Google Scholar] [CrossRef] [PubMed] [Green Version]
- Chamming’s, F.; Le-Frère-Belda, M.-A.; Latorre-Ossa, H.; Fitoussi, V.; Redheuil, A.; Assayag, F.; Pidial, L.; Gennisson, J.-L.; Tanter, M.; Cuénod, C.-A.; et al. Supersonic Shear Wave Elastography of Response to Anti-cancer Therapy in a Xenograft Tumor Model. Ultrasound Med. Biol. 2016, 42, 924–930. [Google Scholar] [CrossRef]
- Ma, Y.; Zhang, S.; Li, J.; Li, J.; Kang, Y.; Ren, W. Comparison of strain and shear-wave ultrasounic elastography in predicting the pathological response to neoadjuvant chemotherapy in breast cancers. Eur. Radiol. 2017, 27, 2282–2291. [Google Scholar] [CrossRef]
- Bhatia, K.S.S.; Cho, C.C.M.; Tong, C.S.L.; Yuen, E.H.Y.; Ahuja, A.T. Shear wave elasticity imaging of cervical lymph nodes. Ultrasound Med. Biol. 2012, 38, 195–201. [Google Scholar] [CrossRef]
- Choi, Y.J.; Lee, J.H.; Lim, H.K.; Kim, S.Y.; Han, M.W.; Cho, K.-J.; Baek, J.H. Quantitative shear wave elastography in the evaluation of metastatic cervical lymph nodes. Ultrasound Med. Biol. 2013, 39, 935–940. [Google Scholar] [CrossRef] [PubMed]
- Ying, M.; Bhatia, K.S.S.; Lee, Y.P.; Yuen, H.Y.; Ahuja, A.T. Review of ultrasonography of malignant neck nodes: Greyscale, Doppler, contrast enhancement and elastography. Cancer Imaging 2014, 13, 658–669. [Google Scholar] [CrossRef] [Green Version]
- Zhao, Y.; Xi, J.; Zhao, B.; Xiong, W.; Jiang, D.; Yang, L.; Cai, Z.; Liu, T.; Jiang, H.; Rong, S.; et al. Preliminary Evaluation of Virtual Touch Tissue Imaging Quantification for Differential Diagnosis of Metastatic and Nonmetastatic Cervical Lymph Nodes. J. Ultrasound Med. 2017, 36, 557–563. [Google Scholar] [CrossRef] [Green Version]
- Cheng, K.L.; Choi, Y.J.; Shim, W.H.; Lee, J.H.; Baek, J.H. Virtual Touch Tissue Imaging Quantification Shear Wave Elastography: Prospective Assessment of Cervical Lymph Nodes. Ultrasound Med. Biol. 2016, 42, 378–386. [Google Scholar] [CrossRef] [PubMed]
- Suh, C.H.; Choi, Y.J.; Baek, J.H.; Lee, J.H. The diagnostic performance of shear wave elastography for malignant cervical lymph nodes: A systematic review and meta-analysis. Eur. Radiol. 2017, 27, 222–230. [Google Scholar] [CrossRef]
- Tschammler, A.; Ott, G.; Schang, T.; Seelbach-Goebel, B.; Schwager, K.; Hahn, D. Lymphadenopathy: Differentiation of benign from malignant disease--color Doppler US assessment of intranodal angioarchitecture. Radiology 1998, 208, 117–123. [Google Scholar] [CrossRef] [PubMed]
- Furukawa, M.K.; Furukawa, M. Diagnosis of lymph node metastases of head and neck cancer and evaluation of effects of chemoradiotherapy using ultrasonography. Int. J. Clin. Oncol. 2010, 15, 23–32. [Google Scholar] [CrossRef] [PubMed]
- Steppan, I.; Reimer, D.; Müller-Holzner, E.; Marth, C.; Aigner, F.; Frauscher, F.; Frede, T.; Zeimet, A.G. Breast cancer in women: Evaluation of benign and malignant axillary lymph nodes with contrast-enhanced ultrasound. Ultraschall Med. 2010, 31, 63–67. [Google Scholar] [CrossRef] [PubMed]
- Sidhu, P.S.; Cantisani, V.; Dietrich, C.F.; Gilja, O.H.; Saftoiu, A.; Bartels, E.; Bertolotto, M.; Calliada, F.; Clevert, D.-A.; Cosgrove, D.; et al. The EFSUMB Guidelines and Recommendations for the Clinical Practice of Contrast-Enhanced Ultrasound (CEUS) in Non-Hepatic Applications: Update 2017 (Long Version). Ultraschall Med. 2018, 39, 154–180. [Google Scholar] [CrossRef] [Green Version]
- Weskott, H.-P. [Contrast-enhanced ultrasound in the diagnostic workup of lymph nodes]. Radiologe 2018, 58, 563–571. [Google Scholar] [CrossRef] [PubMed]
- Chen, L.; Chen, L.; Liu, J.; Wang, B.; Zhang, H. Value of Qualitative and Quantitative Contrast-Enhanced Ultrasound Analysis in Preoperative Diagnosis of Cervical Lymph Node Metastasis From Papillary Thyroid Carcinoma. J. Ultrasound Med. 2020, 39, 73–81. [Google Scholar] [CrossRef] [PubMed]
- Claudon, M.; Dietrich, C.F.; Choi, B.I.; Cosgrove, D.O.; Kudo, M.; Nolsøe, C.P.; Piscaglia, F.; Wilson, S.R.; Barr, R.G.; Chammas, M.C.; et al. Guidelines and good clinical practice recommendations for Contrast Enhanced Ultrasound (CEUS) in the liver-update 2012: A WFUMB-EFSUMB initiative in cooperation with representatives of AFSUMB, AIUM, ASUM, FLAUS and ICUS. Ultrasound Med. Biol. 2013, 39, 187–210. [Google Scholar] [CrossRef] [PubMed]
- Jung, E.-M.; Weber, M.-A.; Wiesinger, I. Contrast-enhanced ultrasound perfusion imaging of organs. Radiologe 2021, 61, 19–28. [Google Scholar] [CrossRef] [PubMed]
- Dietrich, C.F.; Nolsøe, C.P.; Barr, R.G.; Berzigotti, A.; Burns, P.N.; Cantisani, V.; Chammas, M.C.; Chaubal, N.; Choi, B.I.; Clevert, D.-A.; et al. Guidelines and Good Clinical Practice Recommendations for Contrast-Enhanced Ultrasound (CEUS) in the Liver-Update 2020 WFUMB in Cooperation with EFSUMB, AFSUMB, AIUM, and FLAUS. Ultrasound Med. Biol. 2020, 46, 2579–2604. [Google Scholar] [CrossRef] [PubMed]
- Lung, P.F.C.; Fang, C.; Jaffer, O.S.; Deganello, A.; Shah, A.; Hedayati, V.; Obaro, A.; Yusuf, G.T.; Huang, D.Y.; Sellars, M.E.; et al. Vascularity of Intra-testicular Lesions: Inter-observer Variation in the Assessment of Non-neoplastic Versus Neoplastic Abnormalities After Vascular Enhancement With Contrast-Enhanced Ultrasound. Ultrasound Med. Biol. 2020, 46, 2956–2964. [Google Scholar] [CrossRef] [PubMed]
- Mei, M.; Ye, L.; Quan, J.; Huang, P. Contrast-enhanced ultrasound for the differential diagnosis between benign and metastatic superficial lymph nodes: A meta-analysis. Cancer Manag. Res. 2018, 10, 4987–4997. [Google Scholar] [CrossRef] [PubMed] [Green Version]
- Jung, E.M.; Engel, M.; Wiggermann, P.; Schicho, A.; Lerchbaumer, M.; Stroszczynski, C.; Fischer, T.; Wiesinger, I. Contrast enhanced ultrasound (CEUS) with parametric imaging after irreversible electroporation (IRE) of the prostate to assess the success of prostate cancer treatment. Clin. Hemorheol. Microcirc. 2020, 76, 143–153. [Google Scholar] [CrossRef] [PubMed]
- Rennert, J.; Wiesinger, I.; Schicho, A.; Wiggermann, P.; Stroszczynski, C.; Beyer, L.P.; Jung, E.M. Color Coded Perfusion Imaging with Contrast Enhanced Ultrasound (CEUS) for Post-Interventional Success Control Following Irreversible Electroporation (IRE) of Primary and Secondary Malignant Liver Lesions. J. Gastrointestin. Liver Dis. 2019, 28, 311–318. [Google Scholar] [CrossRef]
- Teusch, V.I.; Wohlgemuth, W.A.; Piehler, A.P.; Jung, E.M. Color-coded perfusion analysis of CEUS for pre-interventional diagnosis of microvascularisation in cases of vascular malformations. Clin. Hemorheol. Microcirc. 2014, 58, 183–193. [Google Scholar] [CrossRef]
- Mehanna, H.; Wong, W.-L.; McConkey, C.C.; Rahman, J.K.; Robinson, M.; Hartley, A.G.J.; Nutting, C.; Powell, N.; Al-Booz, H.; Robinson, M.; et al. PET-CT Surveillance versus Neck Dissection in Advanced Head and Neck Cancer. N. Engl. J. Med. 2016, 374, 1444–1454. [Google Scholar] [CrossRef]
- Semrau, S.; Schmidt, D.; Hecht, M.; Haderlein, M.; Kitzsteiner, C.; Müller, S.; Traxdorf, M.; Agaimy, A.; Iro, H.; Kuwert, T.; et al. Classification of three prognostically different groups of head and neck cancer patients based on their metabolic response to induction chemotherapy (IC-1). Oral Oncol. 2020, 100, 104479. [Google Scholar] [CrossRef] [PubMed]
- Risør, L.M.; Loft, A.; Berthelsen, A.K.; Loft, F.C.; Madsen, A.R.; Vogelius, I.R.; Kjær, A.; Friborg, J. FDG-PET/CT in the surveillance of head and neck cancer following radiotherapy. Eur. Arch. Otorhinolaryngol. 2020, 277, 539–547. [Google Scholar] [CrossRef] [PubMed]
- Ye, Z.; Huang, P.; Zhou, X.; Huang, Q.; Hu, Q.; Shui, Y.; Shen, L.; Lai, E.; Wei, Q. Parametric contrast-enhanced ultrasound as an early predictor of radiation-based therapeutic response for lymph node metastases of nasopharyngeal carcinoma. Mol. Clin. Oncol. 2014, 2, 666–672. [Google Scholar] [CrossRef] [PubMed] [Green Version]
- Lerchbaumer, M.H.; Auer, T.A.; Marticorena, G.S.; Stephan, C.; Hamm, B.; Jung, E.-M.; Fischer, T. Diagnostic performance of contrast-enhanced ultrasound (CEUS) in testicular pathologies: Single-center results. Clin. Hemorheol. Microcirc. 2019, 73, 347–357. [Google Scholar] [CrossRef] [PubMed]
- Wiesinger, I.; Wiggermann, P.; Zausig, N.; Beyer, L.P.; Salzberger, B.; Stroszczynski, C.; Jung, E.M. Percutaneous Treatment of Malignant Liver Lesions: Evaluation of Success Using Contrast- Enhanced Ultrasound (CEUS) and Perfusion Software. Ultraschall Med. 2018, 39, 440–447. [Google Scholar] [CrossRef] [PubMed]
- Poanta, L.; Serban, O.; Pascu, I.; Pop, S.; Cosgarea, M.; Fodor, D. The place of CEUS in distinguishing benign from malignant cervical lymph nodes: A prospective study. Med. Ultrason. 2014, 16, 7–14. [Google Scholar] [CrossRef] [PubMed] [Green Version]
- Mori, N.; Mugikura, S.; Miyashita, M.; Kudo, Y.; Suzuki, M.; Li, L.; Mori, Y.; Takahashi, S.; Takase, K. Perfusion contrast-enhanced ultrasound to predict early lymph-node metastasis in breast cancer. Jpn. J. Radiol. 2019, 37, 145–153. [Google Scholar] [CrossRef] [PubMed]
- Yin, S.-S.; Cui, Q.-L.; Fan, Z.-H.; Yang, W.; Yan, K. Diagnostic Value of Arrival Time Parametric Imaging Using Contrast-Enhanced Ultrasonography in Superficial Enlarged Lymph Nodes. J. Ultrasound Med. 2019, 38, 1287–1298. [Google Scholar] [CrossRef] [PubMed]


| Method | Routine Protocol | Study Protocol |
|---|---|---|
| B-Scan | Identification of clinically suspected LN metastases | - |
| CCDI incl. B-Flow | Vascularization pattern | - |
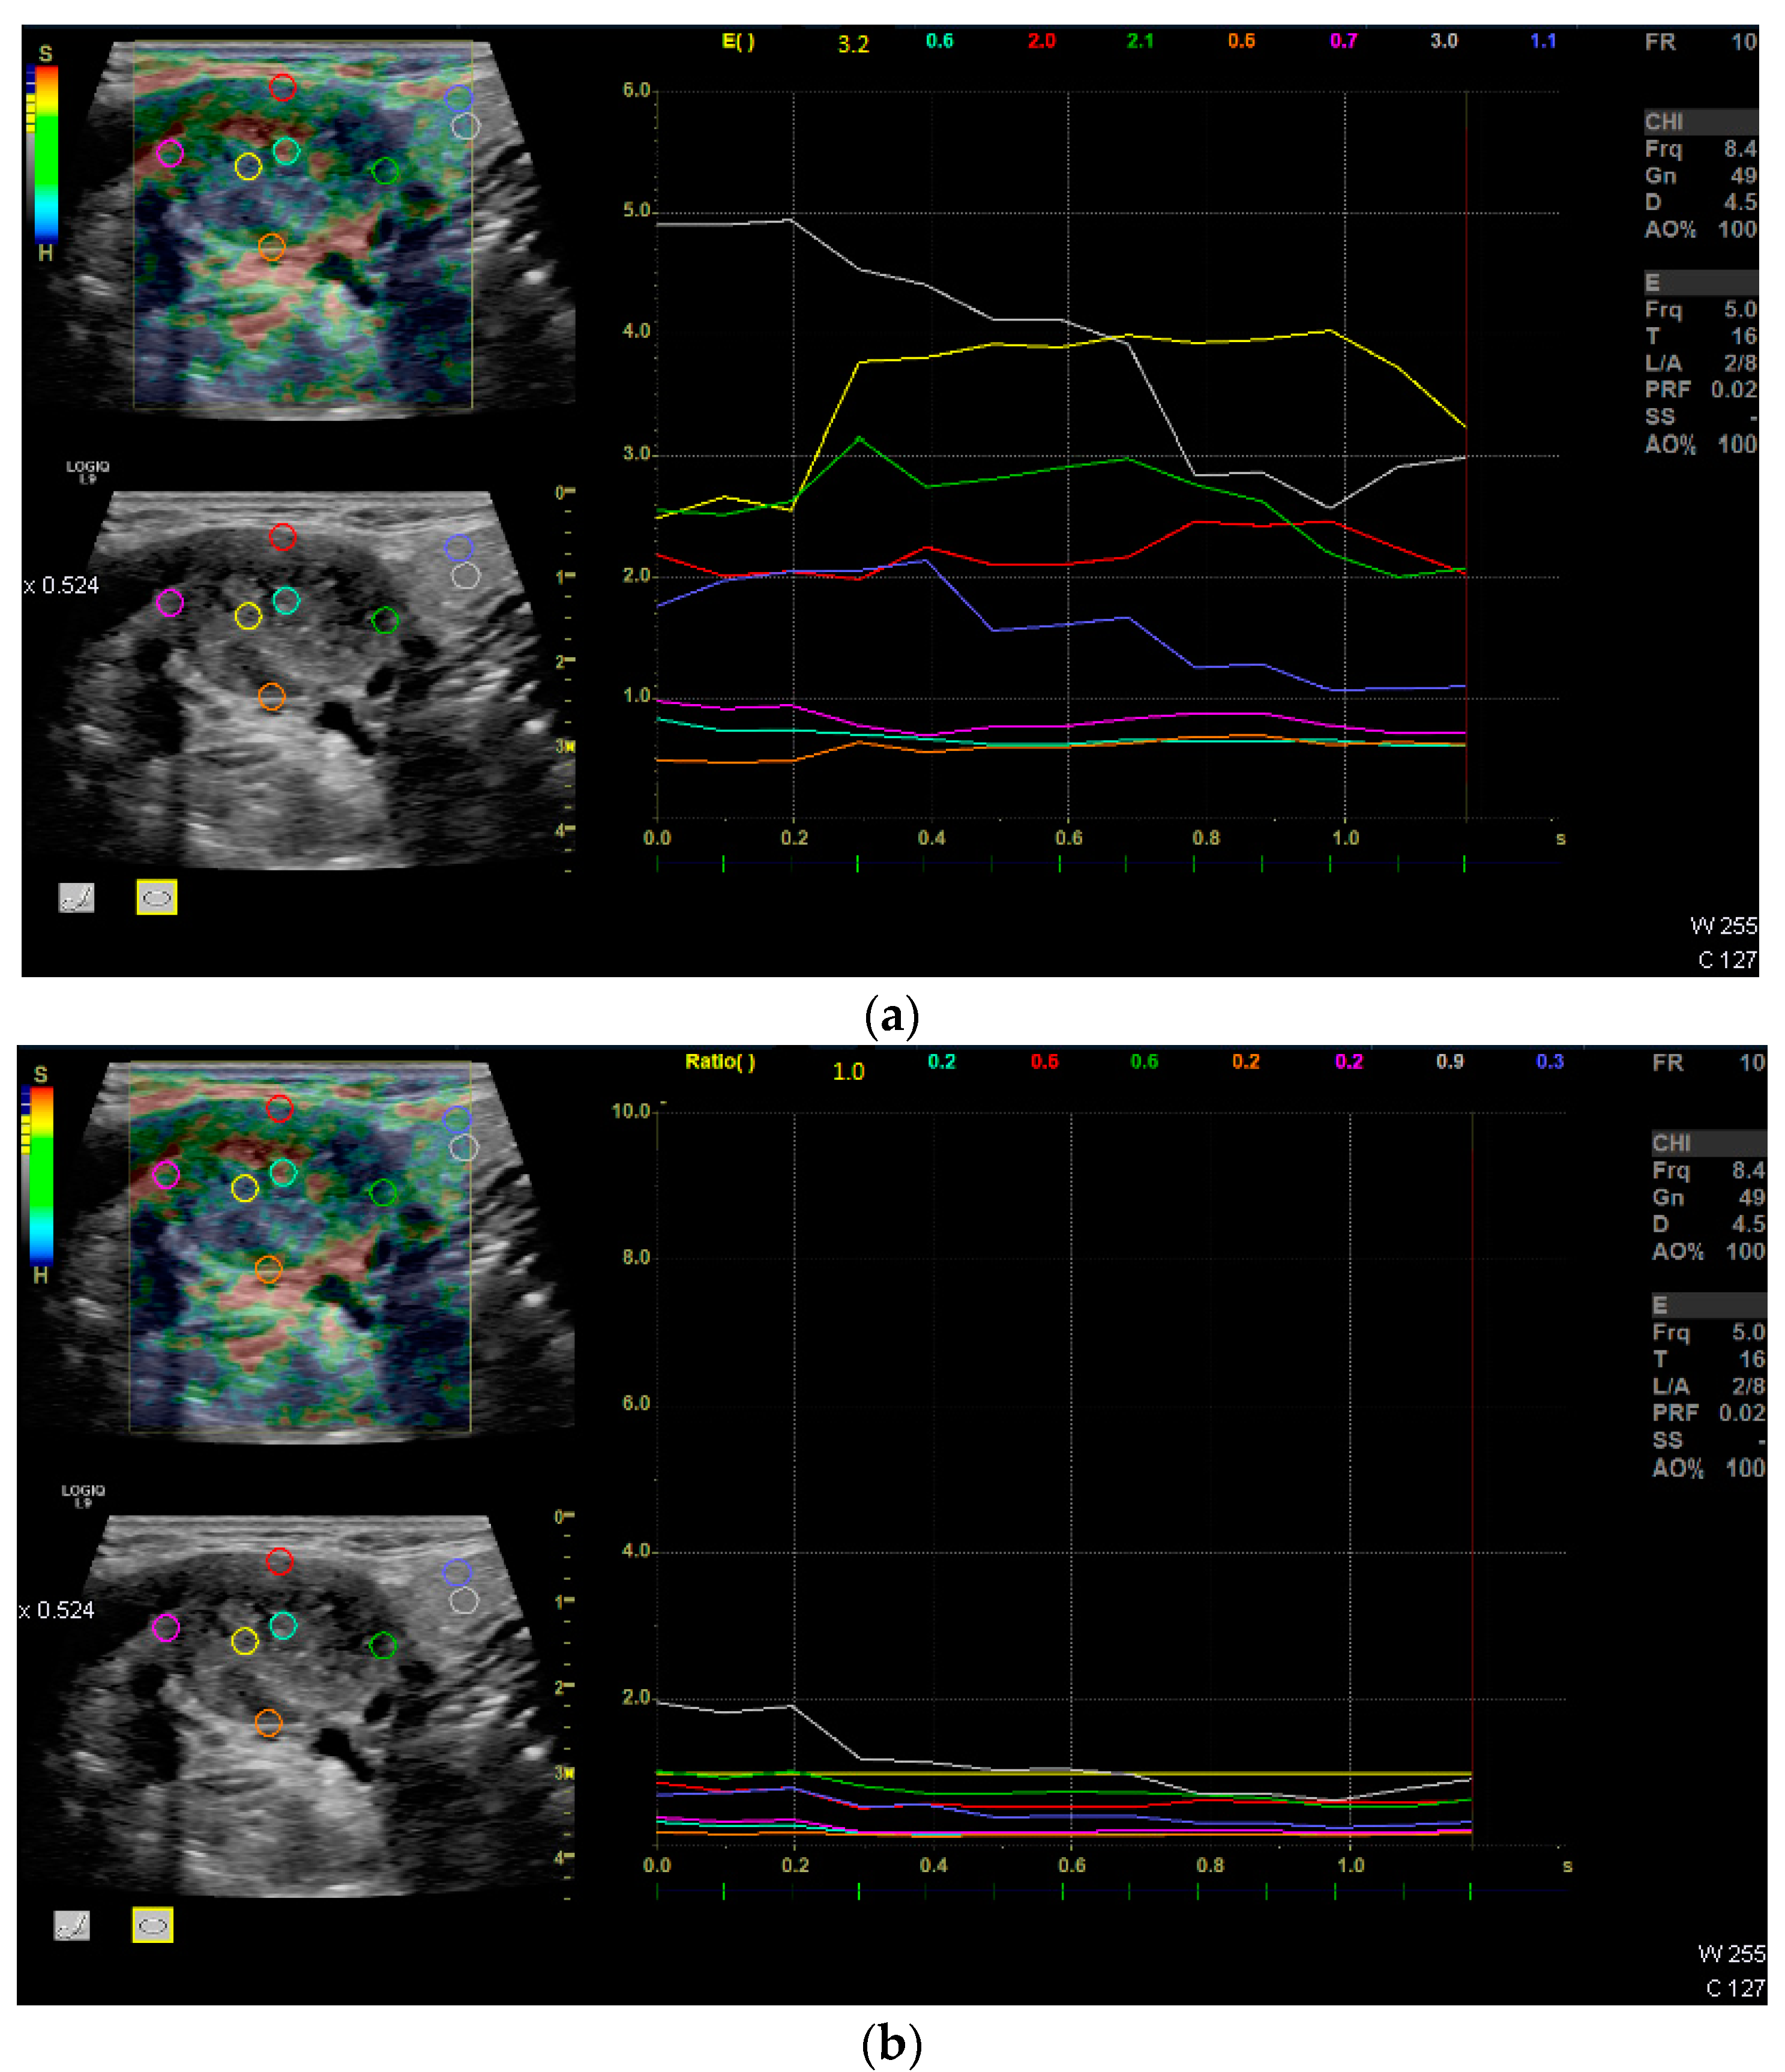
| Strain Elastography | Qualitative report of stiffness (soft or hard) | Q-analysis of strain elastography with Q-ratio; two ROI in the center, four at the margin of the LN and two in the surrounding soft tissue. The ROIs within the LN included areas with the lowest and the highest stiffness. The diameter of each ROI was 2–3 mm. |
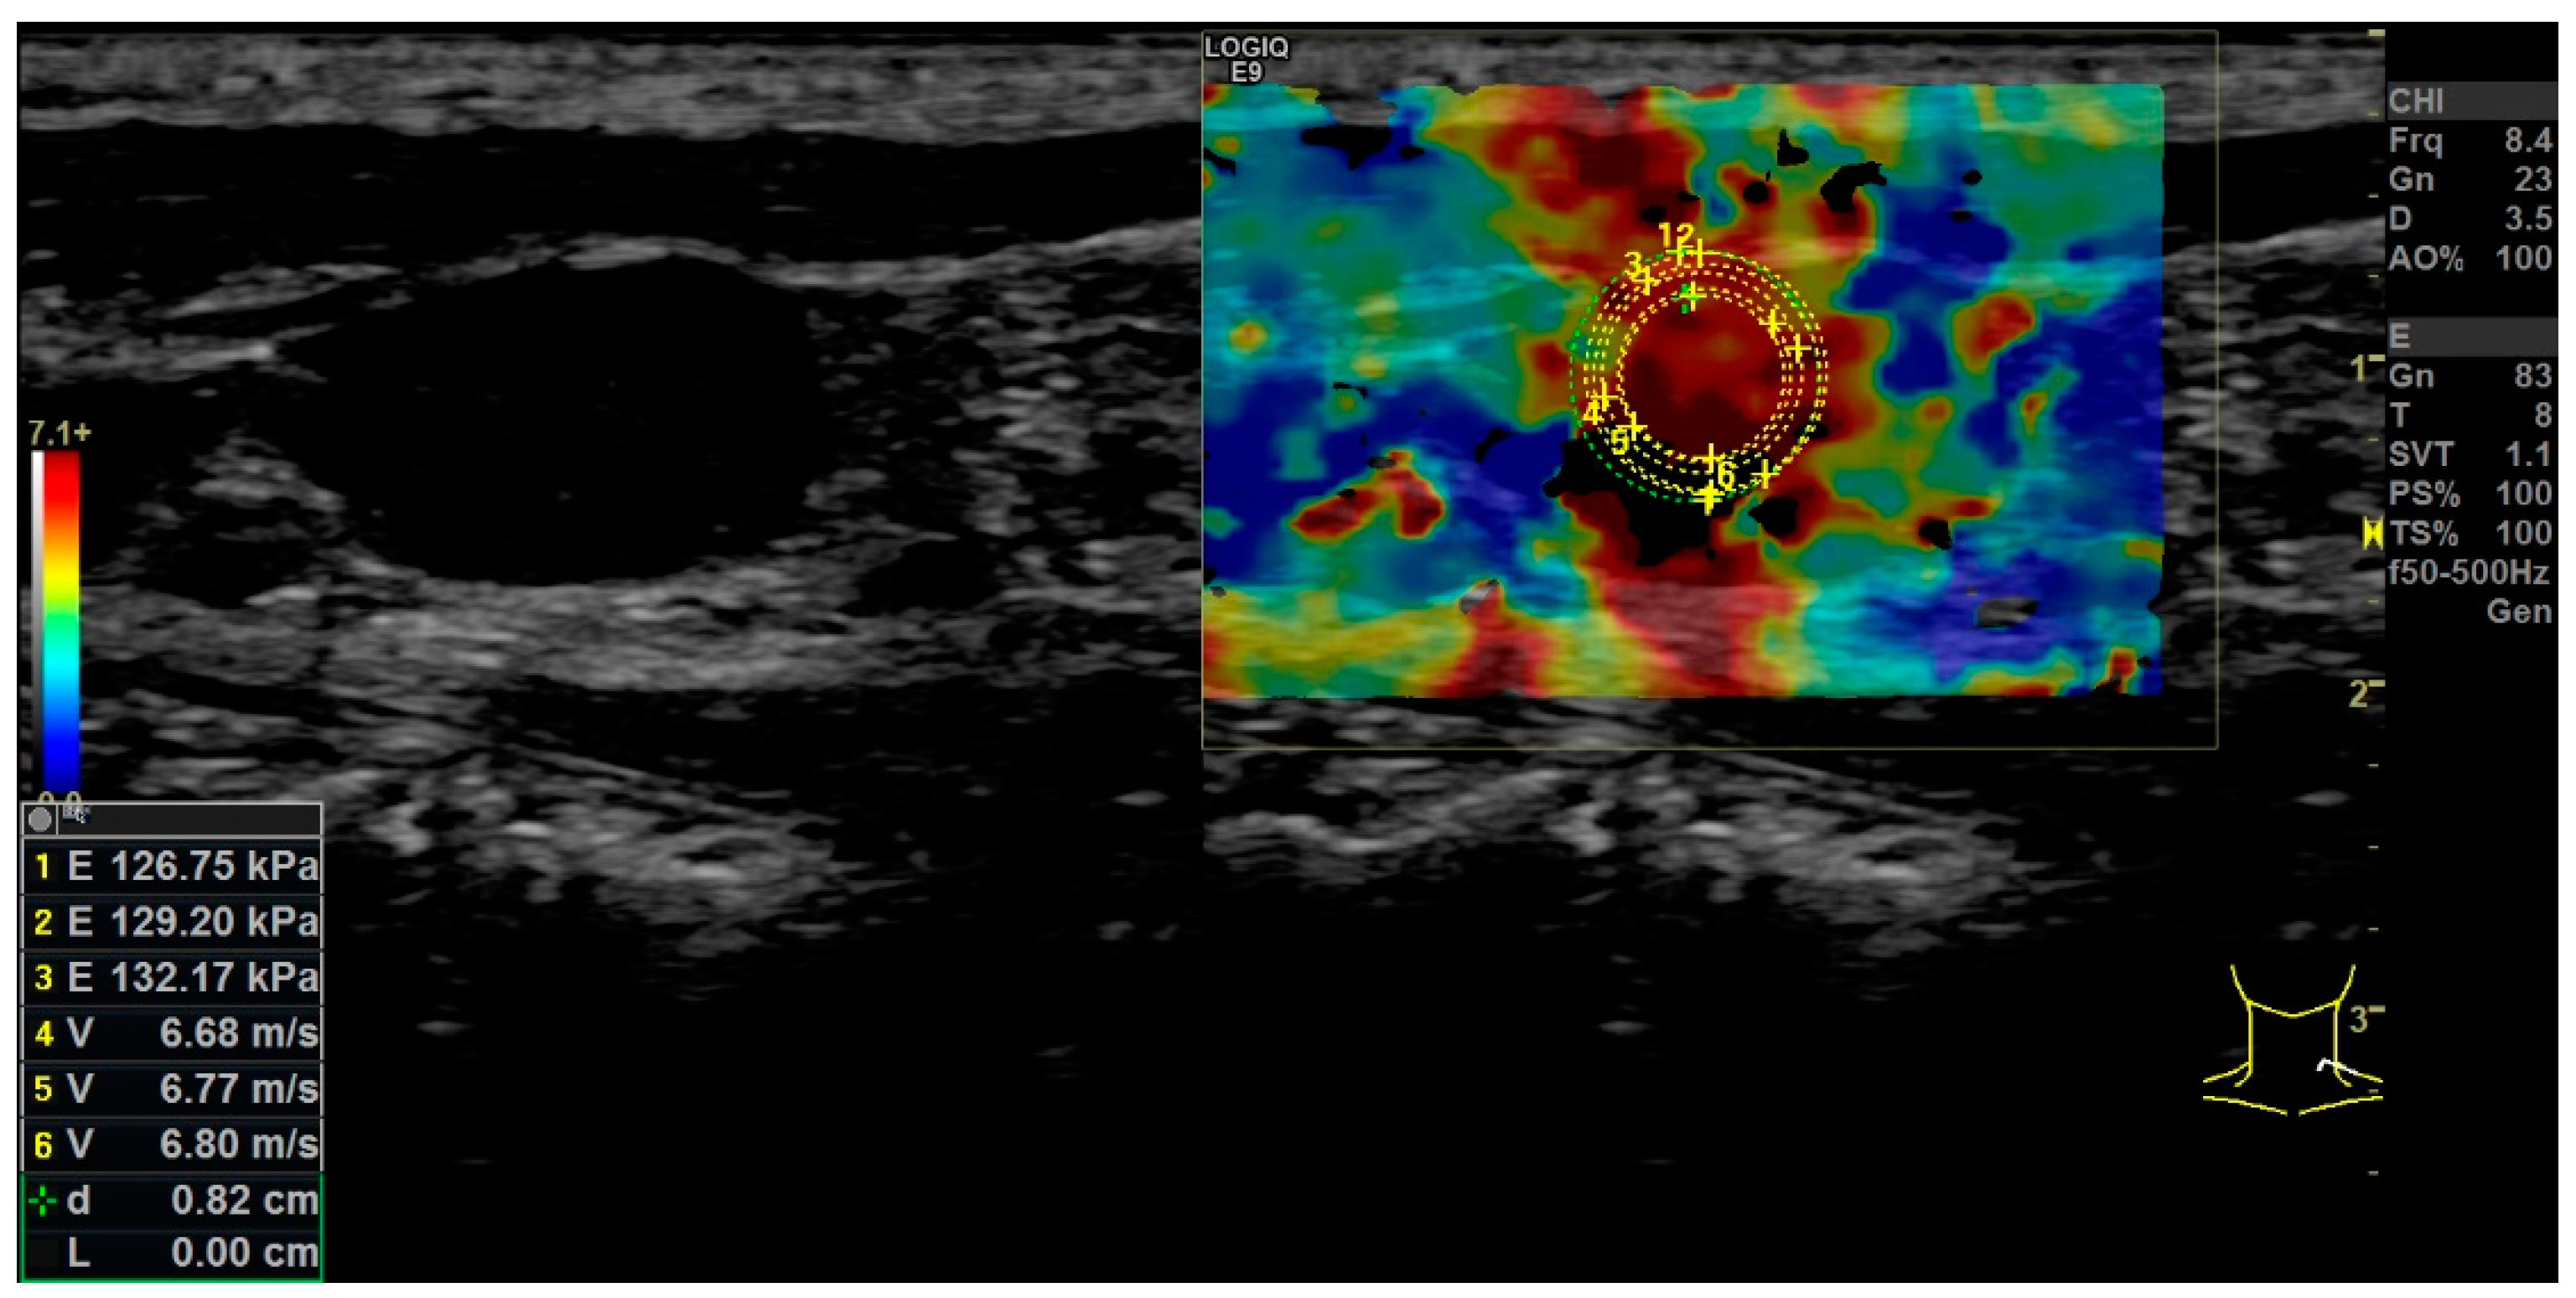
| Shear Wave Elastography | Single ROI drawn with the largest possible diameter not extending beyond the LN margins (kPa). | Repeated (3x) measurement by kPa and m/s using ROI drawn with the largest possible diameter not extending beyond the LN margins. The values of the repeated measures were used to build a mean value for overall LN stiffness in kPa and m/s. |
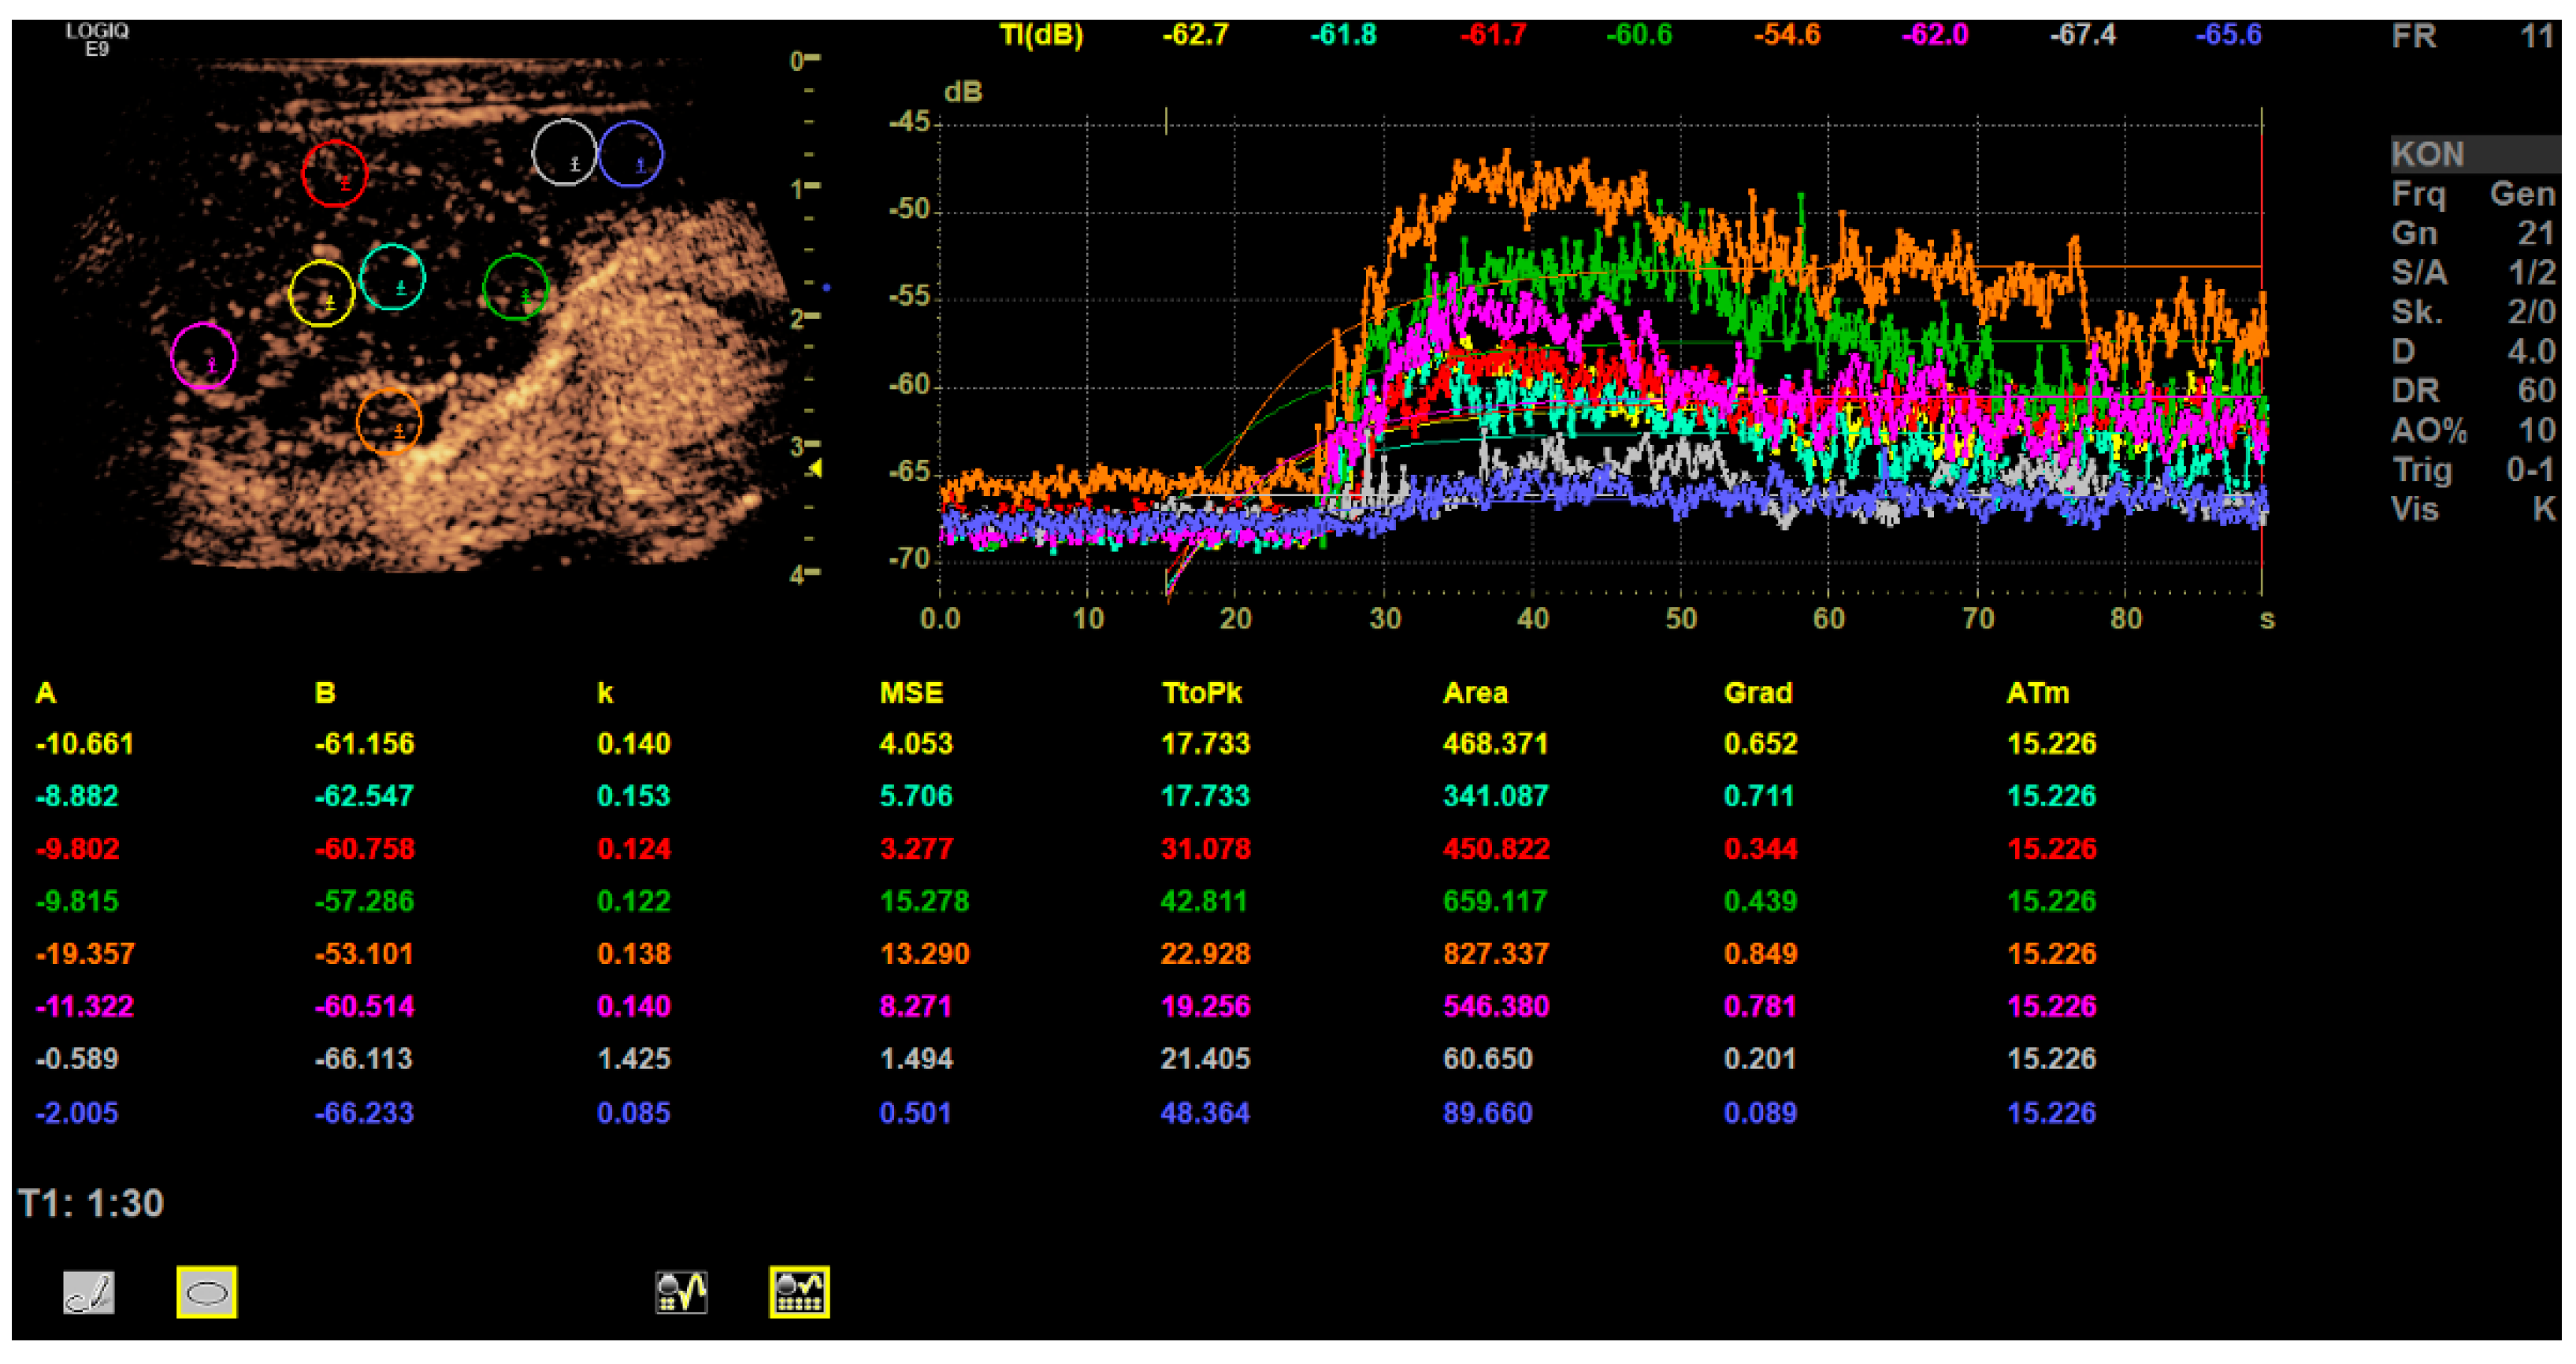
| CEUS | Perfusion and enhancement dynamics (Wash-in/Wash-out) | Time–Intensity Curve analysis with Time-to-Peak and Area-under-the-Curve; two ROI in the center, four at the margin of the LN and two in the surrounding soft tissue (outside of vessels). For the correct placement of ROI, only positive values were accepted (adjustment for artefacts). The diameter of each ROI was 2–3 mm. Additionally parametric evaluation of the perfusion kinetics. |
| Center (1) | Cortex (2) | Surrounding Tissue (3) | Global p-Value 1 | Post-Hoc Pairwise Comparisons | |||
|---|---|---|---|---|---|---|---|
| (1) vs. (2) | (1) vs. (3) | (2) vs. (3) | |||||
| absolute Q-analysis in rU | 2.73 (1.86, 4.18); 1.72–5.13 | 1.57 (1.25, 2.80); 0.94–3.83 | 3.70 (2.01, 4.22); 0.48–5.50 | 0.009 | 0.011 | 0.845 | 0.006 |
| relative Q-analysis in rU | 1.03 (0.80, 1.24); 0.17–1.37 | 0.60 (0.56, 0.85); 0.31–1.23 | 1.25 (0.60, 1.90); 0.10–2.75 | 0.023 | 0.031 | 0.695 | 0.011 |
| mean values of TTP in s | 21.85 (18.08, 34.47); 12.06–72.46 | 28.88 (20.55, 36.52); 18.14–56.02 | 39.19 (25.72, 50.10); 17.35–59.37 | 0.023 | 0.170 | 0.006 | 0.170 |
| mean values of AUC in rU | 499.6 (307.1, 677.2); 35.83–1059 | 538.7 (415.4, 776.5); 292.0–1212 | 164.01 (119.6, 199.5); 50.2–394.0 | 0.001 | 0.556 | 0.003 | <0.001 |
Publisher’s Note: MDPI stays neutral with regard to jurisdictional claims in published maps and institutional affiliations. |
© 2022 by the authors. Licensee MDPI, Basel, Switzerland. This article is an open access article distributed under the terms and conditions of the Creative Commons Attribution (CC BY) license (https://creativecommons.org/licenses/by/4.0/).
Share and Cite
Künzel, J.; Brandenstein, M.; Zeman, F.; Symeou, L.; Platz Batista da Silva, N.; Jung, E.M. Multiparametric Ultrasound of Cervical Lymph Node Metastases in Head and Neck Cancer for Planning Non-Surgical Therapy. Diagnostics 2022, 12, 1842. https://doi.org/10.3390/diagnostics12081842
Künzel J, Brandenstein M, Zeman F, Symeou L, Platz Batista da Silva N, Jung EM. Multiparametric Ultrasound of Cervical Lymph Node Metastases in Head and Neck Cancer for Planning Non-Surgical Therapy. Diagnostics. 2022; 12(8):1842. https://doi.org/10.3390/diagnostics12081842
Chicago/Turabian StyleKünzel, Julian, Moritz Brandenstein, Florian Zeman, Luisa Symeou, Natascha Platz Batista da Silva, and Ernst Michael Jung. 2022. "Multiparametric Ultrasound of Cervical Lymph Node Metastases in Head and Neck Cancer for Planning Non-Surgical Therapy" Diagnostics 12, no. 8: 1842. https://doi.org/10.3390/diagnostics12081842