
Joint Diagnosis of Pneumonia, COVID-19, and Tuberculosis from Chest X-ray Images: A Deep Learning Approach

 ,
,  ,
,  , and
, and
Abstract
:1. Introduction
2. Review of the Literature
2.1. Pneumonia
2.2. COVID-19
2.3. Tuberculosis (TB)
2.4. Joint Diseases Detection Studies
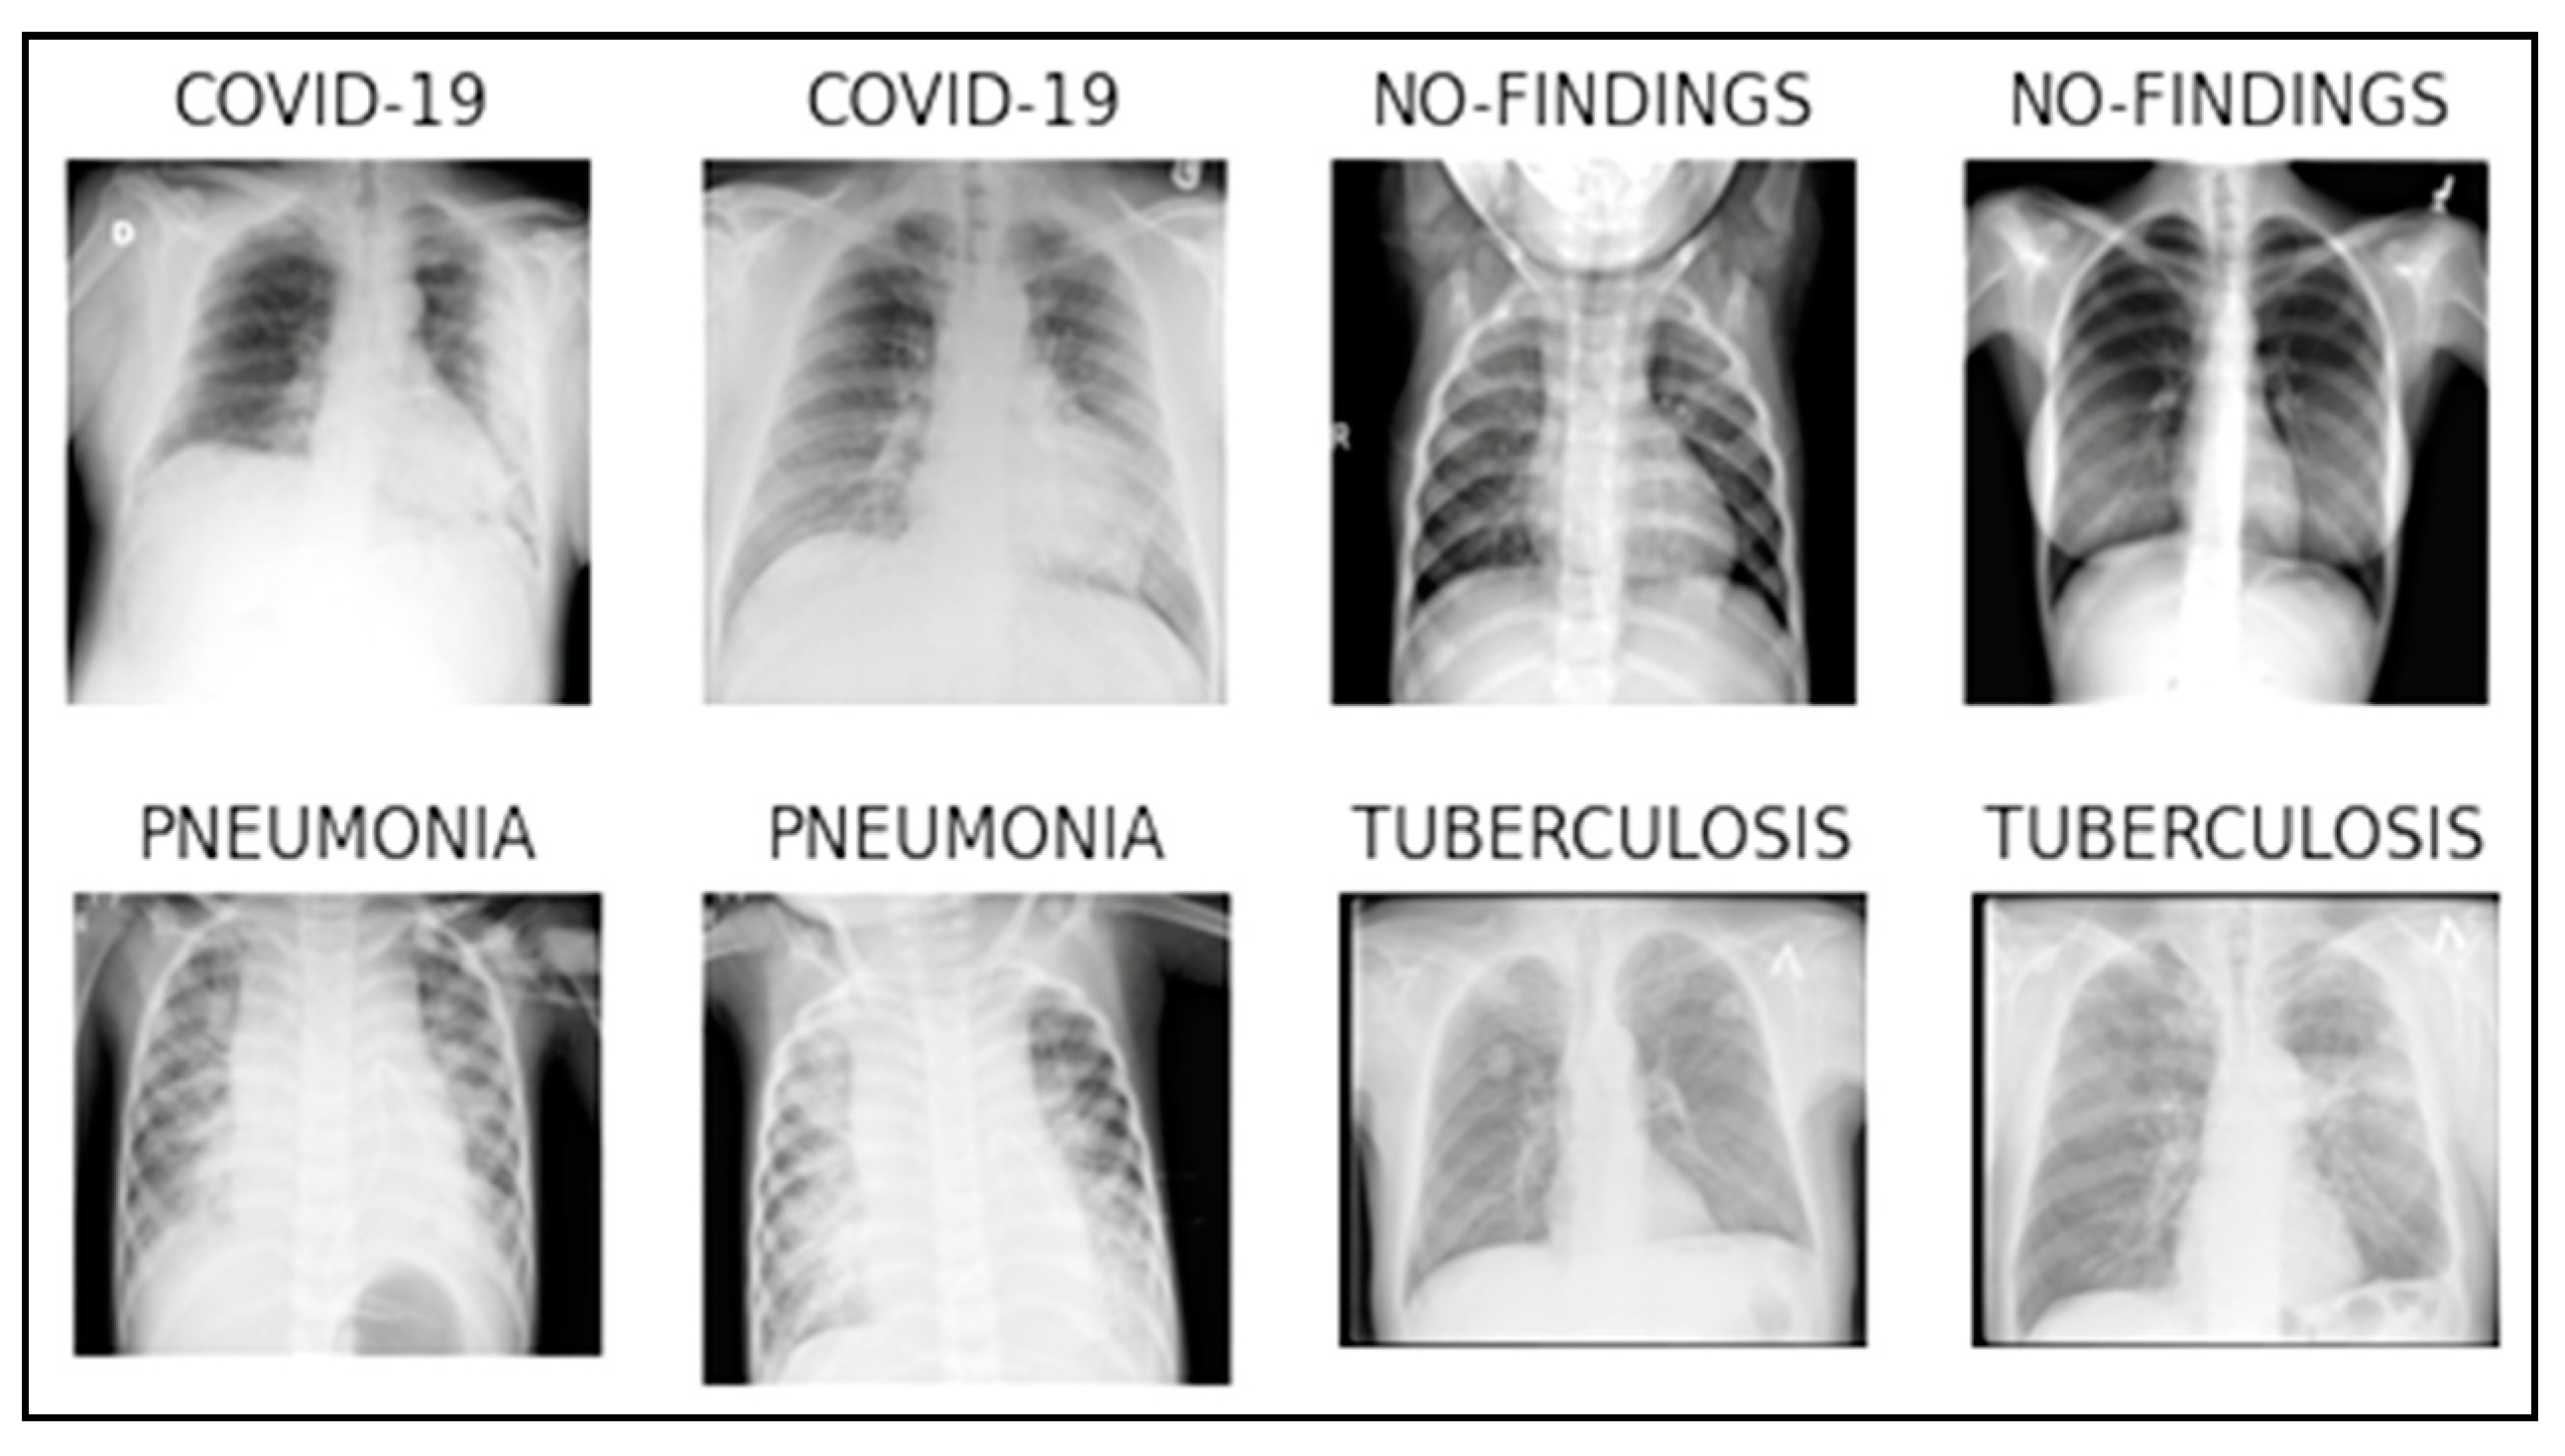
3. Dataset
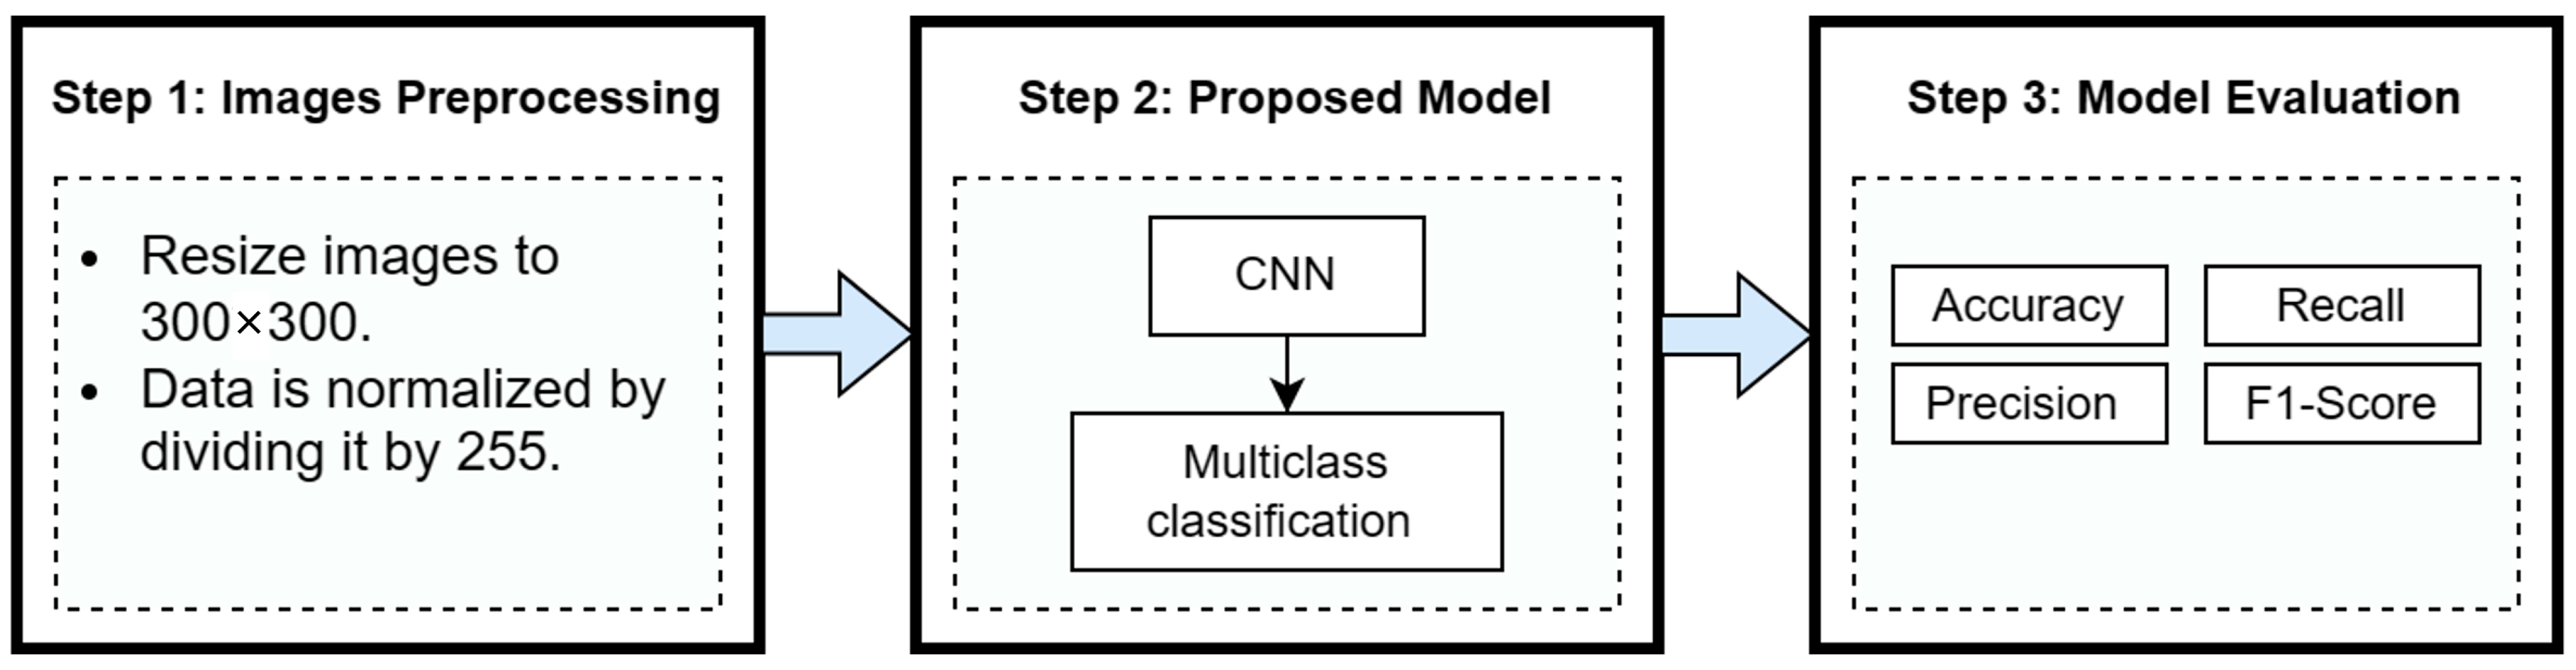
4. Methodology
4.1. Image Preprocessing
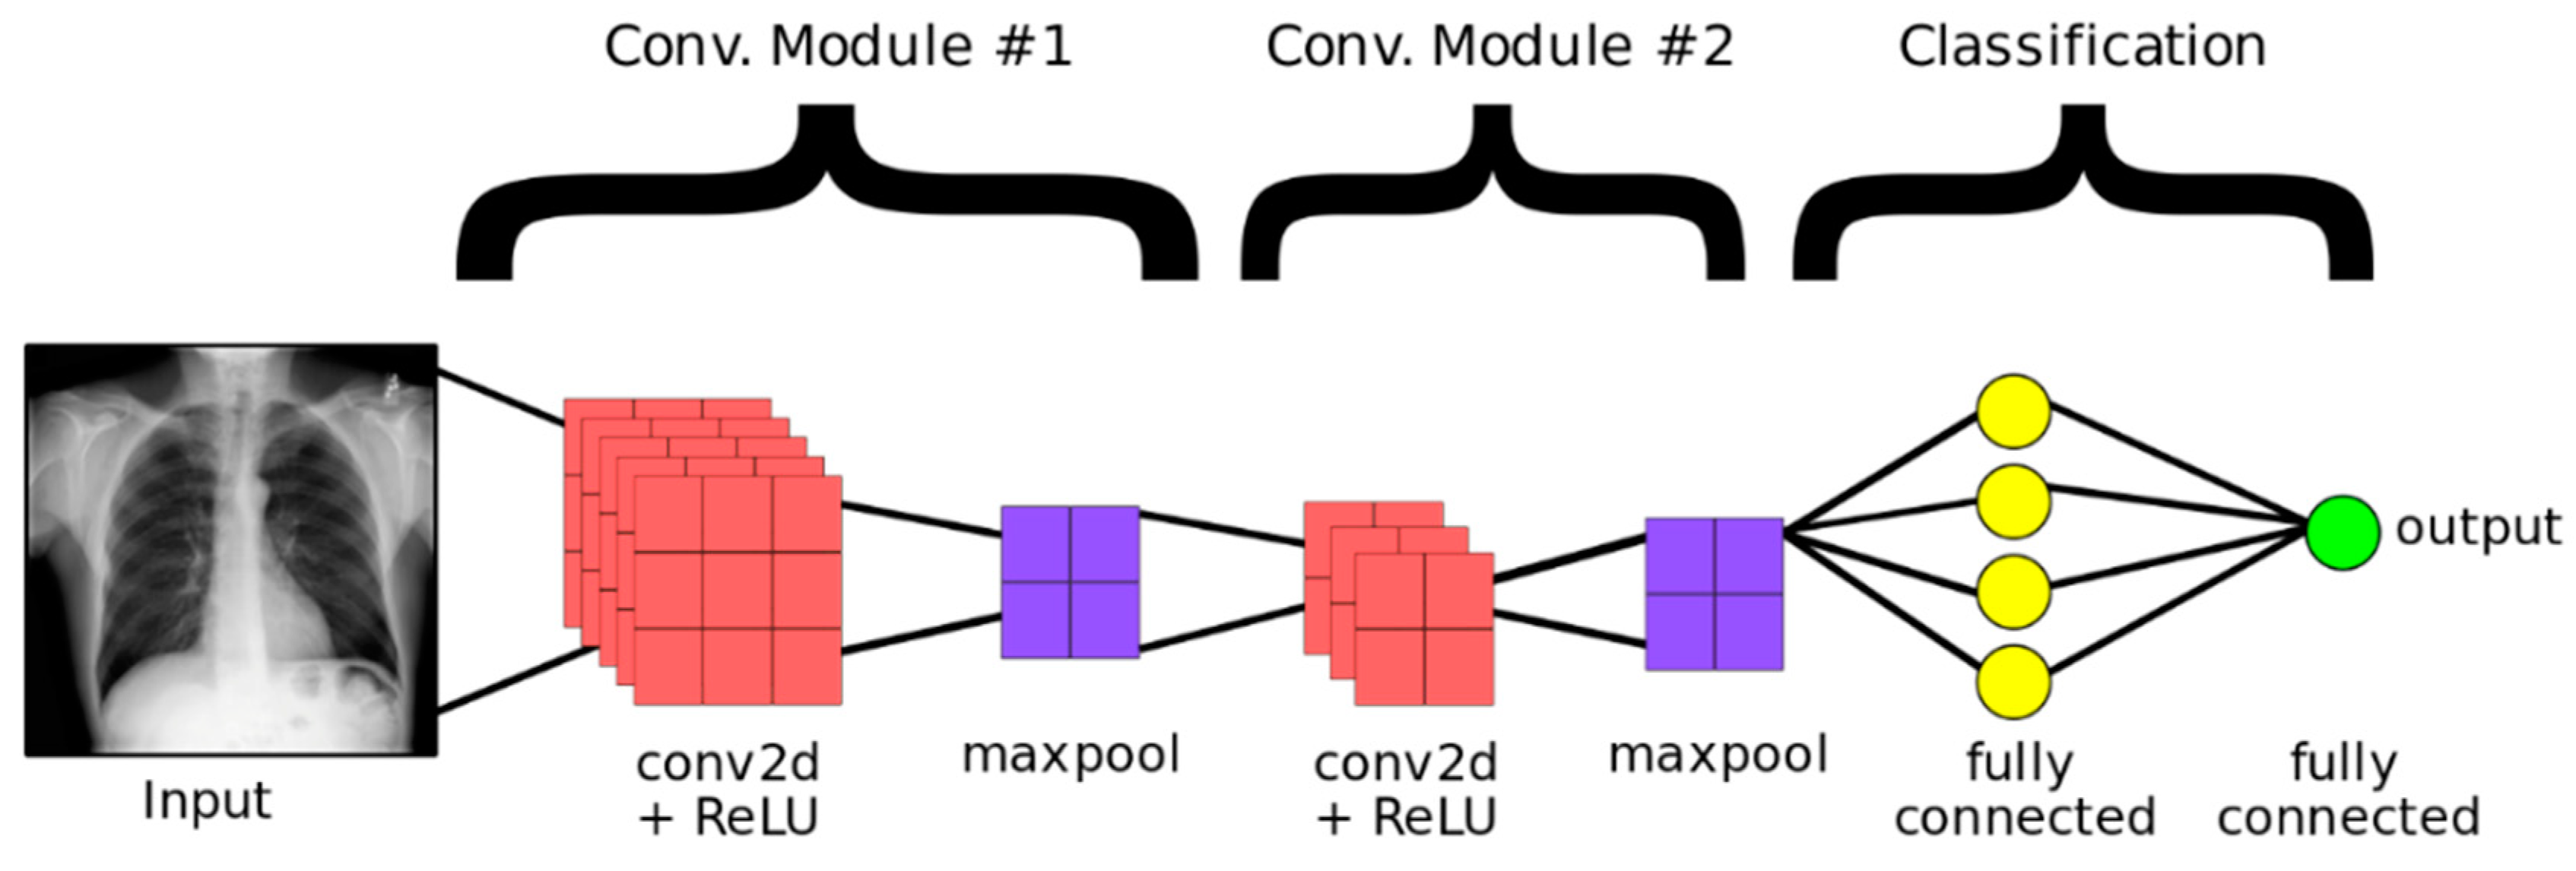
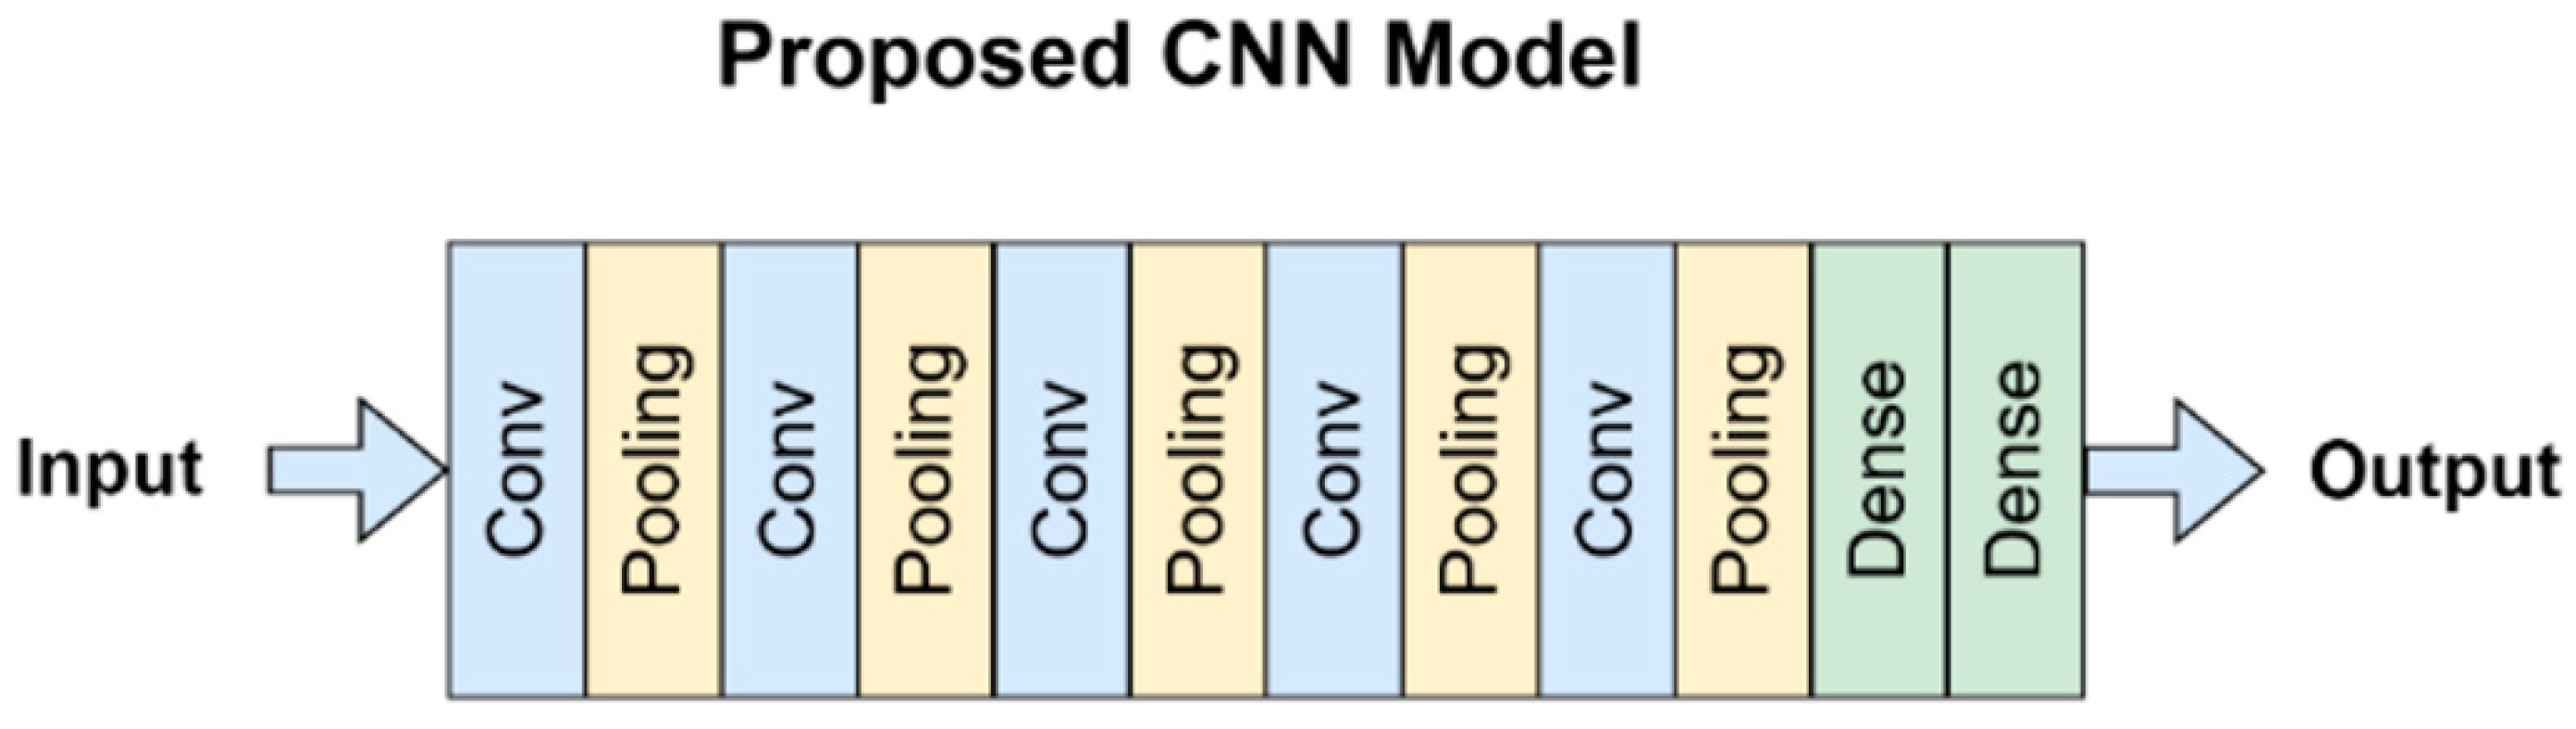
4.2. Proposed Model
4.3. Model Evaluation
4.3.1. Welch’s t-Test
4.3.2. Limitations of the Study
5. Results
Comparison with State-of-the-Art
6. Conclusions
Author Contributions
Funding
Data Availability Statement
Conflicts of Interest
References
- Health and Economy. Available online: https://eurohealthobservatory.who.int/themes/observatory-programmes/health-and-economy (accessed on 3 October 2022).
- Types of Lung Diseases & Their Causes. Available online: https://www.webmd.com/lung/lung-diseases-overview (accessed on 3 October 2022).
- Pneumonia. Available online: https://www.who.int/news-room/fact-sheets/detail/pneumonia (accessed on 19 September 2022).
- WHO Coronavirus (COVID-19) Dashboard|WHO Coronavirus (COVID-19) Dashboard with Vaccination Data. Available online: https://covid19.who.int/ (accessed on 3 October 2022).
- COVID-19 Dashboard: Saudi Arabia. Available online: https://covid19.moh.gov.sa/ (accessed on 3 October 2022).
- Tuberculosis. Available online: https://www.who.int/health-topics/tuberculosis#tab=tab_1 (accessed on 19 September 2022).
- Hashmi, M.F.; Katiyar, S.; Keskar, A.G.; Bokde, N.D.; Geem, Z.W. Efficient Pneumonia Detection in Chest Xray Images Using Deep Transfer Learning. Diagnostics 2020, 10, 417. [Google Scholar] [CrossRef]
- Stephen, O.; Sain, M.; Maduh, U.J.; Jeong, D.U. An Efficient Deep Learning Approach to Pneumonia Classification in Healthcare. J. Healthc. Eng. 2019, 201, 4180949. [Google Scholar] [CrossRef] [Green Version]
- Elshennawy, N.M.; Ibrahim, D.M. Deep-Pneumonia Framework Using Deep Learning Models Based on Chest X-Ray Images. Diagnostics 2020, 10, 649. [Google Scholar] [CrossRef] [PubMed]
- Szepesi, P.; Szilágyi, L. Detection of pneumonia using convolutional neural networks and deep learning. Biocybern. Biomed. Eng. 2022, 42, 1012–1022. [Google Scholar] [CrossRef]
- Qaimkhani, F.M.; Hussain, M.; Shiren, Y.; Xing, J.F. Pneumonia Detection Using Deep Learning Methods. Int. J. Sci. Adv. 2022, 3, 7474304. [Google Scholar] [CrossRef]
- Abubeker, K.M.; Baskar, S. B2-Net: An artificial intelligence powered machine learning framework for the classification of pneumonia in chest X-ray images. Mach. Learn. Sci. Technol. 2023, 4, 015036. [Google Scholar] [CrossRef]
- Ramadhan, A.A.; Baykara, M. A Novel Approach to Detect COVID-19: Enhanced Deep Learning Models with Convolutional Neural Networks. Appl. Sci. 2022, 12, 9325. [Google Scholar] [CrossRef]
- Jain, R.; Gupta, M.; Taneja, S.; Hemanth, D.J. Deep learning based detection and analysis of COVID-19 on chest X-ray images. Appl. Intell. 2021, 51, 1690–1700. [Google Scholar] [CrossRef]
- Hussain, E.; Hasan, M.; Rahman, M.A.; Lee, I.; Tamanna, T.; Parvez, M.Z. CoroDet: A deep learning based classification for COVID-19 detection using chest X-ray images. Chaos Solitons Fractals 2021, 142, 110495. [Google Scholar] [CrossRef]
- Nayak, S.R.; Nayak, D.R.; Sinha, U.; Arora, V.; Pachori, R.B. Application of deep learning techniques for detection of COVID-19 cases using chest X-ray images: A comprehensive study. Biomed. Signal Process. Control 2021, 64, 102365. [Google Scholar] [CrossRef] [PubMed]
- Zagrouba, R.; Khan, M.A.; Rahman, A.; Saleem, M.A.; Mushtaq, M.F.; Rehman, A.; Khan, M.F. Modelling and simulation of COVID-19 outbreak prediction using supervised machine learning. Comput. Mater. Contin. 2021, 66, 2397–2407. [Google Scholar] [CrossRef]
- Atta-ur-Rahman; Sultan, K.; Naseer, I.; Majeed, R.; Musleh, D.; Gollapalli, M.A.S.; Chabani, S.; Ibrahim, N.; Siddiqui, S.Y.; Khan, M.A. Supervised machine learning-based prediction of COVID-19. Comput. Mater. Contin. 2021, 69, 21–34. [Google Scholar] [CrossRef]
- Ahmed, M.I.B.; Rahman, A.U.; Farooqui, M.; Alamoudi, F.; Baageel, R.; Alqarni, A. Early identification of COVID-19 using dynamic fuzzy rule based system. Math. Model. Eng. Probl. 2021, 8, 805–812. [Google Scholar] [CrossRef]
- Naqvi, R.A.; Mushtaq, M.F.; Mian, N.A.; Khan, M.A.; Atta-ur-Rahman; Yousaf, M.A.; Umair, M.; Majeed, R. Coronavirus: A mild virus turned deadly infection. Computers. Mater. Contin. 2021, 67, 2631–2646. [Google Scholar] [CrossRef]
- Nasiri, H.; Hasani, N. Automated detection of COVID-19 cases from chest X-ray images using deep neural network and XGBoost. Radiography 2022, 28, 732–738. [Google Scholar] [CrossRef] [PubMed]
- Khan, S.H.; Sohail, A.; Khan, A.; Lee, Y.-S. COVID-19 Detection in Chest X-ray Images Using a New Channel Boosted CNN. Diagnostics 2022, 12, 267. [Google Scholar] [CrossRef]
- Heo, S.-J.; Kim, Y.; Yun, S.; Lim, S.-S.; Kim, J.; Nam, C.-M.; Park, E.-C.; Jung, I.; Yoon, J.-H. Deep Learning Algorithms with Demographic Information Help to Detect Tuberculosis in Chest Radiographs in Annual Workers’ Health Examination Data. Int. J. Environ. Res. Public Health 2019, 16, 250. [Google Scholar] [CrossRef] [Green Version]
- Hwa, S.K.T.; Hijazi, M.H.A.; Bade, A.; Yaakob, R.; Jeffree, M.S. Ensemble deep learning for tuberculosis detection using chest X-ray and canny edge detected images. IAES Int. J. Artif. Intell. 2019, 8, 429–435. [Google Scholar] [CrossRef]
- Rahman, T.; Khandakar, A.; Kadir, M.A.; Islam, K.R.; Islam, K.F.; Mazhar, R.; Hamid, T.; Islam, M.; Mahbub, Z.; Ayari, M.; et al. Reliable tuberculosis detection using chest X-ray with deep learning, segmentation and visualization. IEEE Access 2020, 8, 191586–191601. [Google Scholar] [CrossRef]
- Iqbal, A.; Usman, M.; Ahmed, Z. An efficient deep learning-based framework for tuberculosis detection using chest X-ray images. Tuberculosis 2022, 136, 102234. [Google Scholar] [CrossRef]
- Norval, M.; Wang, Z.; Sun, Y. Pulmonary Tuberculosis Detection Using Deep Learning Convolutional Neural Networks. In Proceedings of the 3rd International Conference on Video and Image Processing (ICVIP’19), Shanghai, China, 20–23 December 2019; Association for Computing Machinery: New York, NY, USA, 2020; pp. 47–51. [Google Scholar]
- Bhandari, M.; Shahi, T.; Siku, B.; Neupane, A. Explanatory classification of CXR images into COVID-19, Pneumonia and Tuberculosis using deep learning and XAI. Comput. Biol. Med. 2022, 150, 106156. [Google Scholar] [CrossRef]
- Venkataramana, L.; Prasad, D.V.V.; Saraswathi, S.; Mithumary, C.M.; Karthikeyan, R.; Monika, N. Classification of COVID-19 from tuberculosis and pneumonia using deep learning techniques. Med. Biol. Eng. Comput. 2022, 60, 2681–2691. [Google Scholar] [CrossRef]
- Hasan, M.D.K.; Ahmed, S.; Abdullah, Z.M.E.; Khan, M.M.; Anand, D.; Singh, A.; AlZain, M.; Masud, M. Deep Learning Approaches for Detecting Pneumonia in COVID-19 Patients by Analyzing Chest X-Ray Images. Math. Probl. Eng. 2021, 2021, 9929274. [Google Scholar] [CrossRef]
- Ibrokhimov, B.; Kang, J.-Y. Deep Learning Model for COVID-19-Infected Pneumonia Diagnosis Using Chest Radiography Images. BioMedInformatics 2022, 2, 654–670. [Google Scholar] [CrossRef]
- Bashar, A.; Latif, G.; Brahim, G.; Mohammad, N.; Alghazo, J. COVID-19 pneumonia detection using optimized deep learning techniques. Diagnostics 2021, 11, 1972. [Google Scholar] [CrossRef]
- Baltazar, L.R.; Manzanillo, M.G.; Gaudillo, J.; Viray, E.D.; Domingo, M.; Tiangco, B.; Albia, J. Artificial intelligence on COVID-19 pneumonia detection using chest xray images. PLoS ONE 2021, 16, e0257884. [Google Scholar] [CrossRef]
- Nasiri, H.; Kheyroddin, G.; Dorrigiv, M.; Esmaeili, M.; Nafchi, A.R.; Ghorbani, M.H.; Zarkesh-Ha, P. Classification of COVID-19 in Chest X-ray Images Using Fusion of Deep Features and LightGBM. In Proceedings of the IEEE World AI IoT Congress (AIIoT), Seattle, WA, USA, 6–9 June 2022; pp. 201–206. [Google Scholar] [CrossRef]
- Liu, X.; Wu, W.; Chun-Wei Lin, J.; Liu, S. A Deep Learning Model for Diagnosing COVID-19 and Pneumonia through X-ray. Curr. Med. Imaging 2022, 19, 333–346. [Google Scholar] [CrossRef]
- Zhang, D.; Li, Q.; Yang, G.; Li, L.; Sun, X. Detection of image seam carving by using weber local descriptor and local binary patterns. J. Inf. Secur. Appl. 2017, 36, 135–144. [Google Scholar] [CrossRef]
- Xu, Y.; Li, Y.; Shin, B.S. Medical image processing with contextual style transfer. Hum.-Cent. Comput. Inf. Sci. 2020, 10, 46. [Google Scholar] [CrossRef]
- Lee, D.H.; Li, Y.; Shin, B.S. Generalization of intensity distribution of medical images using GANs. Hum.-Cent. Comput. Inf. Sci. 2020, 10, 17. [Google Scholar] [CrossRef]
- COVID-19 Radiography Database|Kaggle. Available online: https://www.kaggle.com/datasets/tawsifurrahman/covid19-radiography-database (accessed on 21 January 2023).
- Chest X-ray Images (Pneumonia)|Kaggle. Available online: https://www.kaggle.com/datasets/paultimothymooney/chest-xray-pneumonia (accessed on 21 January 2023).
- Tuberculosis (TB) Chest X-ray Database|IEEE DataPort. Available online: https://ieee-dataport.org/documents/tuberculosis-tb-chest-x-ray-database (accessed on 21 January 2023).
- Basheer Ahmed, M.I.; Zaghdoud, R.; Ahmed, M.S.; Sendi, R.; Alsharif, S.; Alabdulkarim, J.; Albin Saad, B.A.; Alsabt, R.; Rahman, A.; Krishnasamy, G. A Real-Time Computer Vision Based Approach to Detection and Classification of Traffic Incidents. Big Data Cogn. Comput. 2023, 7, 22. [Google Scholar] [CrossRef]
- Alghamdi, A.S.; Rahman, A. Data Mining Approach to Predict Success of Secondary School Students: A Saudi Arabian Case Study. Educ. Sci. 2023, 13, 293. [Google Scholar] [CrossRef]
- Sajid, N.A.; Ahmad, M.; Rahman, A.; Zaman, G.; Ahmed, M.S.; Ibrahim, N.; Ahmed, M.I.B.; Krishnasamy, G.; Alzaher, R.; Alkharraa, M.; et al. A novel metadata based multi-label document classification technique. Comput. Syst. Sci. Eng. 2023, 46, 2195–2214. [Google Scholar] [CrossRef]
- Atta-Ur-Rahman; Umar, N.M.; Mohammed, G.; Muhammad, Z.; Aamer, S.M.; Shahid, M.; Adnan, K.M.; Amir, M. Advance Genome Disorder Prediction Model Empowered with Deep Learning. IEEE Access 2022, 10, 70317–70328. [Google Scholar] [CrossRef]
- Ahmed, M.I.B.; Alotaibi, R.B.; Al-Qahtani, R.A.; Al-Qahtani, R.S.; Al-Hetela, S.S.; Al-Matar, K.A.; Al-Saqer, N.K.; Rahman, A.; Saraireh, L.; Youldash, M.; et al. Deep Learning Approach to Recyclable Products Classification: Towards Sustainable Waste Management. Sustainability 2023, 15, 11138. [Google Scholar] [CrossRef]
- Nasiri, H.; Ebadzadeh, M. MFRFNN: Multi-Functional Recurrent Fuzzy Neural Network for Chaotic Time Series Prediction. Neurocomputing 2022, 507, 292–310. [Google Scholar] [CrossRef]
- Available online: https://www.statology.org/welchs-t-test-calculator/ (accessed on 30 June 2023).
- Ibrahim, N.M.; Gabr, D.G.; Rahman, A.; Musleh, D.; AlKhulaifi, D.; AlKharraa, M. Transfer Learning Approach to Seed Taxonomy: A Wild Plant Case Study. Big Data Cogn. Comput. 2023, 7, 128. [Google Scholar] [CrossRef]
- Abbas, S.; Raza, S.A.; Khan, M.A.; Khan, M.A.; Sultan, K.; Mosavi, A. Automated file labeling for heterogeneous files organization using machine learning. Comput. Mater. Contin. 2023, 74, 3263–3278. [Google Scholar] [CrossRef]


| Study | Dataset Size | Diseases/ Classes | Techniques Used | Advantages | Limitation |
|---|---|---|---|---|---|
| [21] | Cohen dataset and ChestX-ray8 1125 X-ray images | Binary (COVID-19/Healthy) Ternary (COVID-19, Healthy/Pneumonia) | Deep Learning and XGBoost | Good accuracy for binary classification 98.23% for binary 89.70% for ternary | Ternary classification needs improvement. Only binary and ternary cases |
| [28] | Public dataset with 7132 chest X-ray images | COVID-19 Pneumonia Tuberculosis No-Finding | Deep Learning and XAI | Good validation accuracy Testing: 94.31 ± 1.01% Validation: 94.54 ± 1.33% | Results are based on a smaller subset of dataset |
| [29] | Public dataset with 14,693 chest X-ray images | COVID-19 Pneumonia Tuberculosis No-Finding | SMOTE and Deep Learning | Considerable accuracy with balancing the dataset. 95.7% without Balancing 96.6% with Balancing | Annotated dataset with already two diseases and COVID-19 was predicted |
| [32] | Public dataset with 21,165 chest X-ray images | Normal, COVID-19, Pneumonia Lung Opacity | Deep/Transfer learning models | Decent ternary classification accuracy Validation: 95.63% | Ternary classification, imbalanced data |
| [34] | ChestX-ray8 dataset with 1125 X-ray images | Binary (COVID-19/Healthy) Ternary (COVID-19, Healthy/Pneumonia) | Deep learning models DenseNet169 MobileNet | Best binary classification accuracy 98.54% for binary and 91.11% for ternary | Only binary and ternary classification (not four classes) |
| [35] | Public dataset with chest X-ray images | Binary (no finding/pneumonia) Multivariate (COVID-19/No findings/Pneumonia) | Deep Learning, Transfer Learning models | Comprehensive study with several experiments and decent accuracy Binary (91.5%) Multivariate (91.11%) | Only binary and ternary classification (not four classes), little difference in accuracy metric |
| Class | Number of Images |
|---|---|
| COVID-19 | 3616 |
| No-Findings (Normal) | 10,192 |
| Pneumonia | 4273 |
| Tuberculosis | 3500 |
| Layer (Type) | Output Shape | Parameters |
|---|---|---|
| Rescaling | (None, 300, 300, 3) | 0 |
| Conv2d | (None, 300, 300, 16) | 448 |
| Max_pooling2d | (None, 150, 150, 16) | 0 |
| Conv2d | (None, 150, 150, 32) | 4640 |
| Max_pooling2d | (None, 75, 75, 32) | 0 |
| Conv2d | (None, 75, 75, 64) | 18,496 |
| Max_pooling2d | (None, 37, 37, 64) | 0 |
| Conv2d | (None, 37, 37, 128) | 73,856 |
| Max_pooling2d | (None, 18, 18, 128) | 0 |
| Conv2d | (None, 18, 18, 256) | 295,168 |
| Max_pooling2d | (None, 9, 9, 256) | 0 |
| Dropout | (None, 9, 9, 256) | 0 |
| Flatten | (None, 20736) | 0 |
| Dense | (None, 128) | 2,654,336 |
| Dense | (None, 4) | 516 |
| Class | Precision | Recall | F1-Score |
|---|---|---|---|
| COVID-19 | 97.00% | 96.27% | 96.63% |
| NO-FINDINGS | 98.72% | 99.35% | 99.04% |
| PNEUMONIA | 99.89% | 99.66% | 99.77% |
| TUBERCULOSIS | 98.90% | 98.10% | 98.50% |
| Predicted | |||||
|---|---|---|---|---|---|
| Actual | COVID-19 | No-Findings | Pneumonia | Tuberculosis | Correctly Classified |
| COVID-19 | 22 | 3 | 0 | 0 | 22/25 |
| NO-FINDINGS | 0 | 25 | 0 | 0 | 25/25 |
| PNEUMONIA | 0 | 0 | 25 | 0 | 25/25 |
| TUBERCULOSIS | 0 | 0 | 0 | 25 | 25/25 |
| Study | Dataset Size | Diseases/ Classes | Techniques Used | Average Accuracy |
|---|---|---|---|---|
| Bhandari et al. [28] | Public dataset with 7132 chest X-ray images | COVID-19 Pneumonia Tuberculosis No-Finding | Deep Learning and XAI | Testing: 94.31 ± 1.01% Validation: 94.54 ± 1.33% |
| Venkataramana et al. [29] | Public dataset with 14,693 chest X-ray images | COVID-19 Pneumonia Tuberculosis No-Finding | SMOTE and Deep Learning | 95.7% without Balancing 96.6% with Balancing |
| Bashar et al. [32] | Public dataset with 21,165 chest X-ray images | Normal, COVID-19, Pneumonia Lung Opacity | Deep learning models | Validation: 95.63% |
| Nasiri et al. [34] | ChestX-ray dataset with 1125 X-ray images | Binary (COVID-19/Healthy) Ternary (COVID-19, Healthy/Pneumonia) | Deep learning models DenseNet169 MobileNet | 98.54% for binary and 91.11% for ternary |
| Liu et al. [35] | Public dataset with chest X-ray images | Binary (no finding/pneumonia) Multivariate (COVID-19/No findings/Pneumonia) | Deep Learning, Transfer Learning models | Binary (91.5%) Multivariate (91.11%) |
| Proposed Technique | Public dataset with 21,581 chest X-ray images | COVID-19 Pneumonia Tuberculosis No-Finding | Deep learning models (CNN) | Validation: 98.72% |
Disclaimer/Publisher’s Note: The statements, opinions and data contained in all publications are solely those of the individual author(s) and contributor(s) and not of MDPI and/or the editor(s). MDPI and/or the editor(s) disclaim responsibility for any injury to people or property resulting from any ideas, methods, instructions or products referred to in the content. |
© 2023 by the authors. Licensee MDPI, Basel, Switzerland. This article is an open access article distributed under the terms and conditions of the Creative Commons Attribution (CC BY) license (https://creativecommons.org/licenses/by/4.0/).
Share and Cite
Ahmed, M.S.; Rahman, A.; AlGhamdi, F.; AlDakheel, S.; Hakami, H.; AlJumah, A.; AlIbrahim, Z.; Youldash, M.; Alam Khan, M.A.; Basheer Ahmed, M.I. Joint Diagnosis of Pneumonia, COVID-19, and Tuberculosis from Chest X-ray Images: A Deep Learning Approach. Diagnostics 2023, 13, 2562. https://doi.org/10.3390/diagnostics13152562
Ahmed MS, Rahman A, AlGhamdi F, AlDakheel S, Hakami H, AlJumah A, AlIbrahim Z, Youldash M, Alam Khan MA, Basheer Ahmed MI. Joint Diagnosis of Pneumonia, COVID-19, and Tuberculosis from Chest X-ray Images: A Deep Learning Approach. Diagnostics. 2023; 13(15):2562. https://doi.org/10.3390/diagnostics13152562
Chicago/Turabian StyleAhmed, Mohammed Salih, Atta Rahman, Faris AlGhamdi, Saleh AlDakheel, Hammam Hakami, Ali AlJumah, Zuhair AlIbrahim, Mustafa Youldash, Mohammad Aftab Alam Khan, and Mohammed Imran Basheer Ahmed. 2023. "Joint Diagnosis of Pneumonia, COVID-19, and Tuberculosis from Chest X-ray Images: A Deep Learning Approach" Diagnostics 13, no. 15: 2562. https://doi.org/10.3390/diagnostics13152562