Article

Prioritizing Subway Station Entrance Attributes to Optimize Passenger Satisfaction in Cold Climate Zones: Integrating Gradient Boosting Decision Trees with Asymmetric Impact-Performance Analysis

1
Jangho Architecture College, Northeastern University, Shenyang 110169, China
2
School of Architecture, Harbin Institute of Technology, Shenzhen 518055, China
*
Authors to whom correspondence should be addressed.
Buildings 2024, 14(1), 101; https://doi.org/10.3390/buildings14010101
Submission received: 2 December 2023 / Revised: 23 December 2023 / Accepted: 29 December 2023 / Published: 30 December 2023

Abstract

:
Subway station entrances serve as crucial links between urban environments and underground transit systems and are particularly vital in cities with cold climates. Specialized design strategies are essential to address user needs and promote safety and comfort, thereby encouraging sustainable travel in harsh winter conditions. This research utilizes data from Harbin and Shenyang, two winter cities in China, to explore the nonlinear influences of subway entrance attributes on passenger satisfaction through the combined use of gradient-boosting decision trees and asymmetric impact-performance analysis. The findings indicate that most key attributes of subway entrances impact passenger satisfaction asymmetrically, highlighting the significance of their hierarchical importance in generating satisfaction. These attributes are categorized into frustrators, dissatisfiers, hybrids, satisfiers, and delighters, based on their asymmetry levels. Considering the current performance of these attributes, the study identifies priority for improvement at Harbin and Shenyang’s subway entrances. This aids urban designers and city managers in making informed decisions for urban development and enhancing the overall commuter experience in winter cities.

1. Introduction

The rapid process of urbanization has led to the continuous expansion of city boundaries, further compounded by an ever-increasing population. This expansion exacerbates numerous environmental issues such as pollution, congestion, and a decline in urban living standards, posing challenges for both city administrators and residents [1]. Concurrently, the growing population necessitates more space to meet basic living needs, leading to aggressive methods of urban expansion such as land reclamation and mountain flattening, which significantly harm the natural environment. To address these challenges, cities are increasingly adopting a vertical development approach [2], effectively leveraging both above-ground and underground spaces within constrained urban landscapes. Notably, the development of underground spaces plays a crucial role in this strategy [3]. By expanding beneath the surface, cities can significantly alleviate the pressure on ground-level and aerial spaces. This approach emerges as a highly effective solution to a multitude of urban challenges, offering an innovative way to optimize limited urban land use while promoting sustainable and efficient urban growth. In this context, subways, functioning as dynamic networks of underground space, play a crucial role in the development and utilization of urban underground space [4]. With advantages like high capacity, low pollution, low noise, energy efficiency, high speed, minimal land use, comfort, and all-weather operation, subways effectively mitigate the environmental impact of large-scale urban development.
Subway entrances, serving as critical junctions between subway stations and the city [5,6], embody a multifaceted role that extends far beyond providing mere access. These entry points are pivotal in shaping both the commuter experience and the urban landscape. They enhance accessibility and connectivity, acting as key nodes that link diverse urban areas, thereby facilitating ease of movement across the city and fostering inclusive and connected urban environments. This increased accessibility is instrumental in promoting the widespread use of public transportation. Furthermore, subway entrances play a significant role in managing crowds, especially during peak travel times or in the event of emergencies. The strategic design and placement of these entrances are crucial in improving safety and preventing bottlenecks [7], ensuring efficient evacuation, and facilitating access for emergency services. They also serve as essential transitional spaces, providing a smooth passage for commuters moving from the bustling city life above ground to the underground transit network. This transition is not just a physical shift but also a psychological one, as commuters navigate between these distinct environments. Architecturally, these entrances often represent the only visible part of the subway system at street level. Their design and structural elements reflect the engineering and architectural standards of the entire system and act as a public showcase of its character and functionality. The aesthetic and structural design of these entrances can become iconic elements in urban design, contributing significantly to the city’s identity and enhancing the public’s perception of the transit network.
In the context of urban development in cold climate zones, particularly in winter cities, subways offer an indispensable solution. These regions, marked by harsh winter conditions, pose significant challenges for outdoor activities and daily commutes [8]. Winter cities, specifically, are urban areas that have adapted their infrastructure and public spaces to thrive during prolonged, cold winter seasons. In these areas, subways serve as more than just a means of efficient transportation—they provide a sheltered, climate-controlled environment that shields commuters from severe winter elements. By offering this comfortable alternative to surface travel, subways alleviate the pressure on surface spaces, as residents have a reliable option to avoid adverse weather conditions. This not only improves the daily commute but also enhances the overall livability of winter cities during the challenging winter months. Moreover, the development of subway systems in these regions serves as a driving force for additional underground space utilization. The establishment of a subway enhances accessibility and increases pedestrian flow, thereby boosting the appeal of these areas for further development. This dynamic often gives rise to underground commercial zones, interconnected walkways, and other amenities, all conveniently accessible to subway users. The interaction between subway infrastructure and ensuing underground projects fosters a lively subterranean urban environment, which is instrumental in promoting sustainable growth and improving the overall quality of life.
However, subway entrances in winter cities face distinctive challenges. Integrating climate-related considerations into urban planning and design is crucial [9]. Prioritizing winter travel safety and comfort is essential, requiring tailored design elements such as anti-slip surfaces, cold weather protection, wind shelters, enhanced solar access, and effective snow management in outdoor areas [10,11]. The role of subway entrances in facilitating transitions—from outside to inside, top to bottom, light to dark, open to enclosed—gains additional significance in these regions. As the first and last points of contact in a subway journey, these entrances are critical in ensuring a safe, efficient, and comfortable travel experience. Catering to the diverse needs of users at these entrances, and thereby enhancing their satisfaction, can further encourage sustainable travel behaviors in winter cities [12]. Research supports that consistent performance and innovation in service delivery, including factors like security, safety, and comfort, are crucial for achieving customer satisfaction in public transport systems [13,14]. Additionally, attributes like infrastructure quality have been identified as significant in influencing passenger satisfaction, emphasizing the need for a comprehensive approach to designing these entrances [13]. Despite their pivotal role, research on subway entrances in these challenging climates is limited. A deeper understanding of how various attributes of subway entrances impact passenger satisfaction is needed, which is a gap that hampers informed design and decision making in these unique urban environments. This gap becomes more evident considering the critical influence of perceived value, quality, trust, and passenger loyalty on overall service quality in public transport, as identified in recent studies [13,14]. Understanding and addressing these factors at subway entrances can significantly contribute to the overall quality of urban transit experience, especially in cold climates.
Utilizing data from two winter cities in China, Harbin and Shenyang, this study employs gradient-boosting decision trees (GBDT) in conjunction with asymmetric impact-performance analysis (AIPA) to identify and prioritize attributes of subway station entrances that enhance passenger satisfaction in cold climate zones. It seeks to answer several key research questions: (1) What are the most significant attributes of subway entrances for passenger satisfaction? (2) To what extent are the associations between these attributes and passenger satisfaction asymmetric? (3) Which attributes should be given priority in the improvement of subway entrances? (4) How do these findings vary between the two representative winter cities of Harbin and Shenyang?
This research contributes significantly to the existing literature in three distinct ways. First, it delves into the nonlinear relationships between subway entrance attributes and passenger satisfaction, revealing a common presence of asymmetric associations. This observation challenges the prevailing linear assumptions frequently adopted in built environment satisfaction studies, paving the way for future research in this area. Second, the integration of AIPA with GBDT in this study represents an innovative approach to analyzing passenger satisfaction. This method effectively addresses the multicollinearity challenges often found in multiple regression analyses, signifying a notable advancement over traditional regression techniques that depend on dummy variables [15,16,17]. Third, the study not only identifies the crucial attributes of subway entrances for passenger satisfaction but also highlights the improvement areas for these entrances in typical winter cities, taking into account different levels of enclosure. These findings offer significant implications for urban planning and design, especially in enhancing the user experience in the context of winter cities.
The subsequent section of the paper outlines the attributes of subway entrances that impact passenger satisfaction, which is followed by an in-depth discussion of the survey locations, methodology, data collection processes, and the integrated approach to modeling and analysis. The results section then details the GBDT model results and AIPA results. The discussion portion of the paper addresses the study’s limitations and explores the policy implications of the findings. The paper concludes by summarizing the research and emphasizing the key insights gained from this study.

2. Materials and Methods

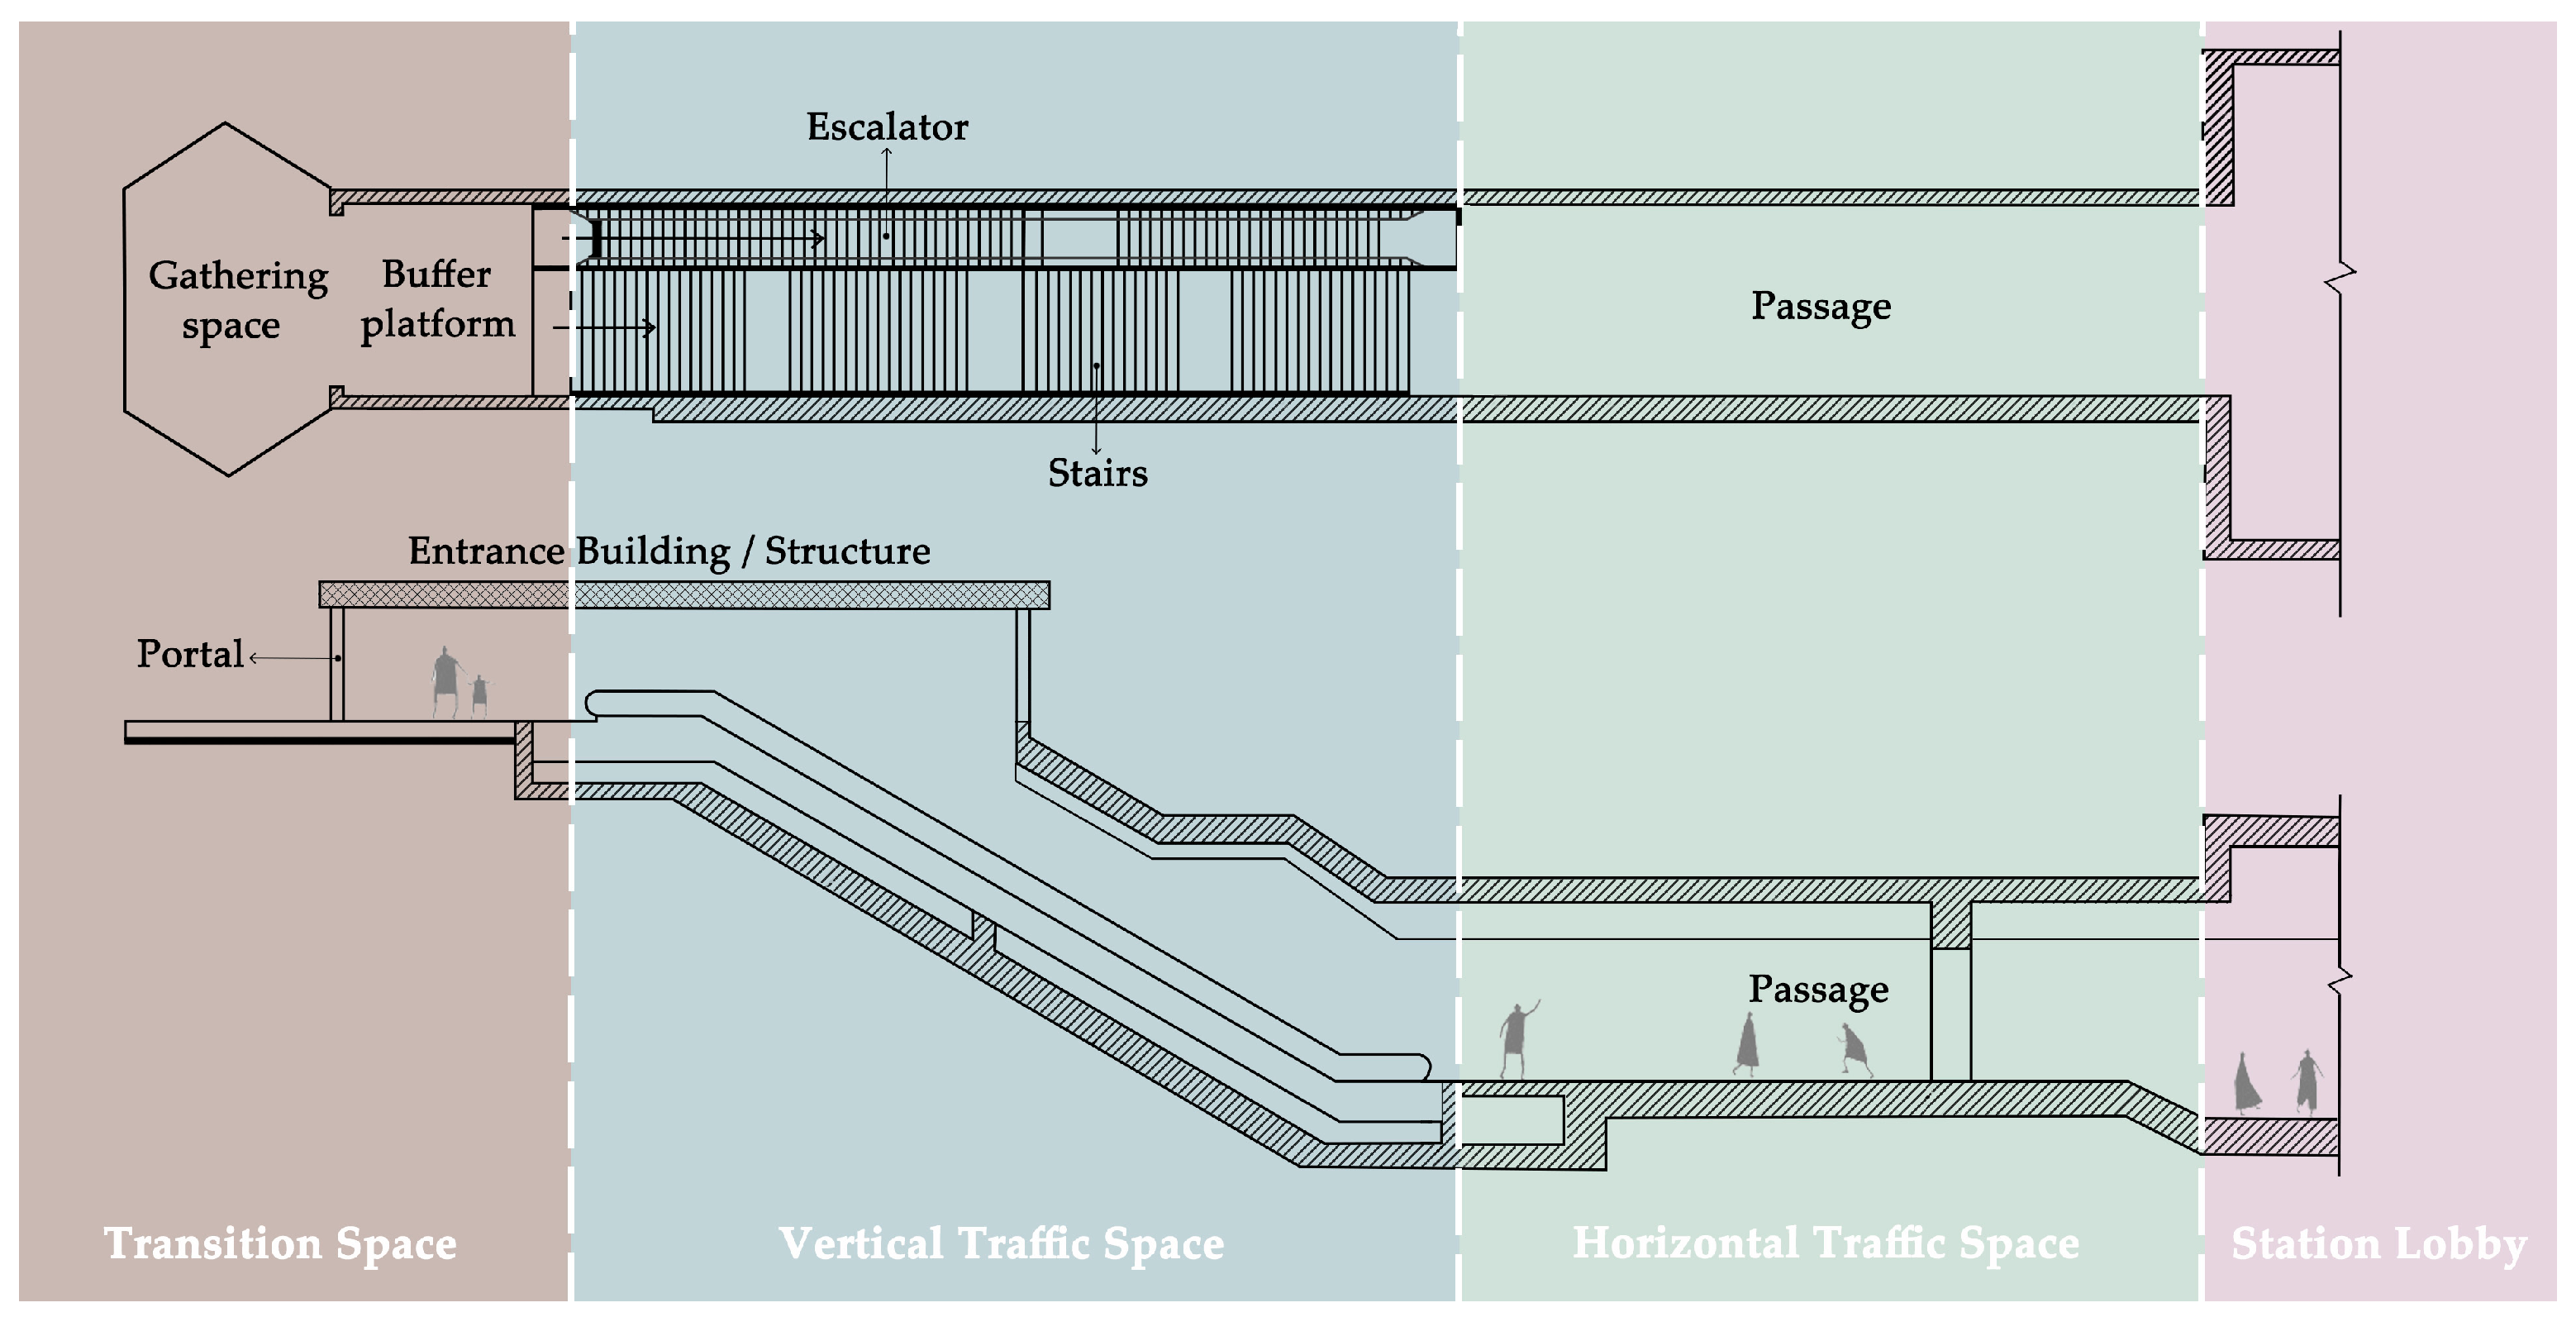
2.1. Investigating Potential Influencers on Passenger Satisfaction in Cold Climate Subway Entrances

The architecture of a typical subway entrance is divided into three main areas: the transition space, vertical traffic space, and horizontal traffic space, as depicted in Figure 1. The entrance sequence initiates at the portal, delineating the boundary between the cityscape and the subway environment. Contiguous to the portal lies the entrance edifice, encompassing stairways and escalators that transport passengers across different planes. The buffer platform operates as a transient zone that modulates passenger flow and mitigates bottlenecks. Leading from this is the gathering space, a capacious area designed to accommodate commuters during ingress or while congregating with others. The vertical traffic space is dedicated to the vertical transit of passengers, utilizing stairs and escalators, whereas the horizontal traffic space is aligned with the ground level, providing thoroughfares to the station lobby. The station lobby serves as a central nexus, connecting various passages and facilitating entry to train platforms.
In the field of architectural and urban design, various elements of subway entrance design are crucial in determining passenger satisfaction. The quantity of entrances at a subway station significantly influences ingress and egress, thereby enhancing subway accessibility [18]. This aspect is closely linked with the distribution of these entrances, which determines how effectively they are integrated into the urban landscape. The design of the entrances, including their aesthetic and architectural characteristics, is key to creating a welcoming atmosphere for passengers [5]. The orientation of the entrances affects passenger flow and station accessibility, as well as lighting and ventilation [19]. The size of the portal, or entrance and exit dimensions, directly impacts congestion levels and passenger throughput [20]. Navigational clarity is crucial in subway environments [21]. The effectiveness of signage in guiding passengers to the correct entry points and ensuring clear exit routes can greatly reduce confusion and improve the travel experience.
Transit facilities within the station also significantly affect passenger satisfaction. The number and functionality of escalators play a major role in influencing passenger flow [22], especially in terms of their direction (ascending, descending, or both). The traffic pattern inside the subway entrance, covering both vertical and horizontal movement, is essential for efficient pedestrian navigation across different levels and for preventing congestion, thus facilitating smooth transit within the station [23,24], particularly in choosing between stairs and escalators. Research indicates that variations in stair geometry, including riser heights, substantially influence dynamic balance control during stair descent, especially across different age groups [25]. Particular stair dimensions notably heighten the risk of trips and falls, offering vital insights for safety considerations in both community-based studies and building codes [26]. Safety and comfort are essential in the design of subway station entrances. Safety measures like handrails [27], lighting, and emergency signage [28] significantly affect passenger confidence and security. The buffer platform plays a key role in managing flow and reducing congestion [29,30]. The size of the entrance gathering space can help alleviate bottlenecks and enhance the overall station environment [31].
In cold climate zones, subway entrance design requires a tailored approach to withstand harsh weather conditions [32,33]. This includes using durable, weather-resistant materials and architectural designs that offer adequate protection from cold winds and snow, ensuring the structures endure low temperatures and minimize wind chill effects [34]. Accessibility is a major concern in such climates, where snow and ice can impede movement; therefore, features like heated walkways, efficient snow removal, and non-slip surfaces are essential [35,36]. These elements are critical in maintaining clear and safe paths to and from subway entrances. Additionally, integrating these entrances into the urban fabric is important, facilitating protected pathways and communal spaces [37]. This can be achieved by designing entrances that connect seamlessly with the surrounding landscape, possibly integrating with adjacent buildings or transit systems for covered or indoor access. Moreover, in regions with shorter daylight hours, effective lighting is crucial [38]. Subway entrances need to be well lit for safety and to create an inviting atmosphere, with careful consideration for the transition from bright outdoor to dimmer indoor lighting, ensuring a smooth change [39].
Given the absence of a precise measurement scale for evaluating the effect of subway entrance characteristics on passenger satisfaction, this study formulated its own dimensions and attributes, guided by insights from the previously mentioned literature. A focus group of four experts in architectural design and urban planning was assembled to create and confirm the validity of this measurement scale. As a result, 21 attributes spanning four dimensions were identified for detailed investigation, as depicted in Table 1.

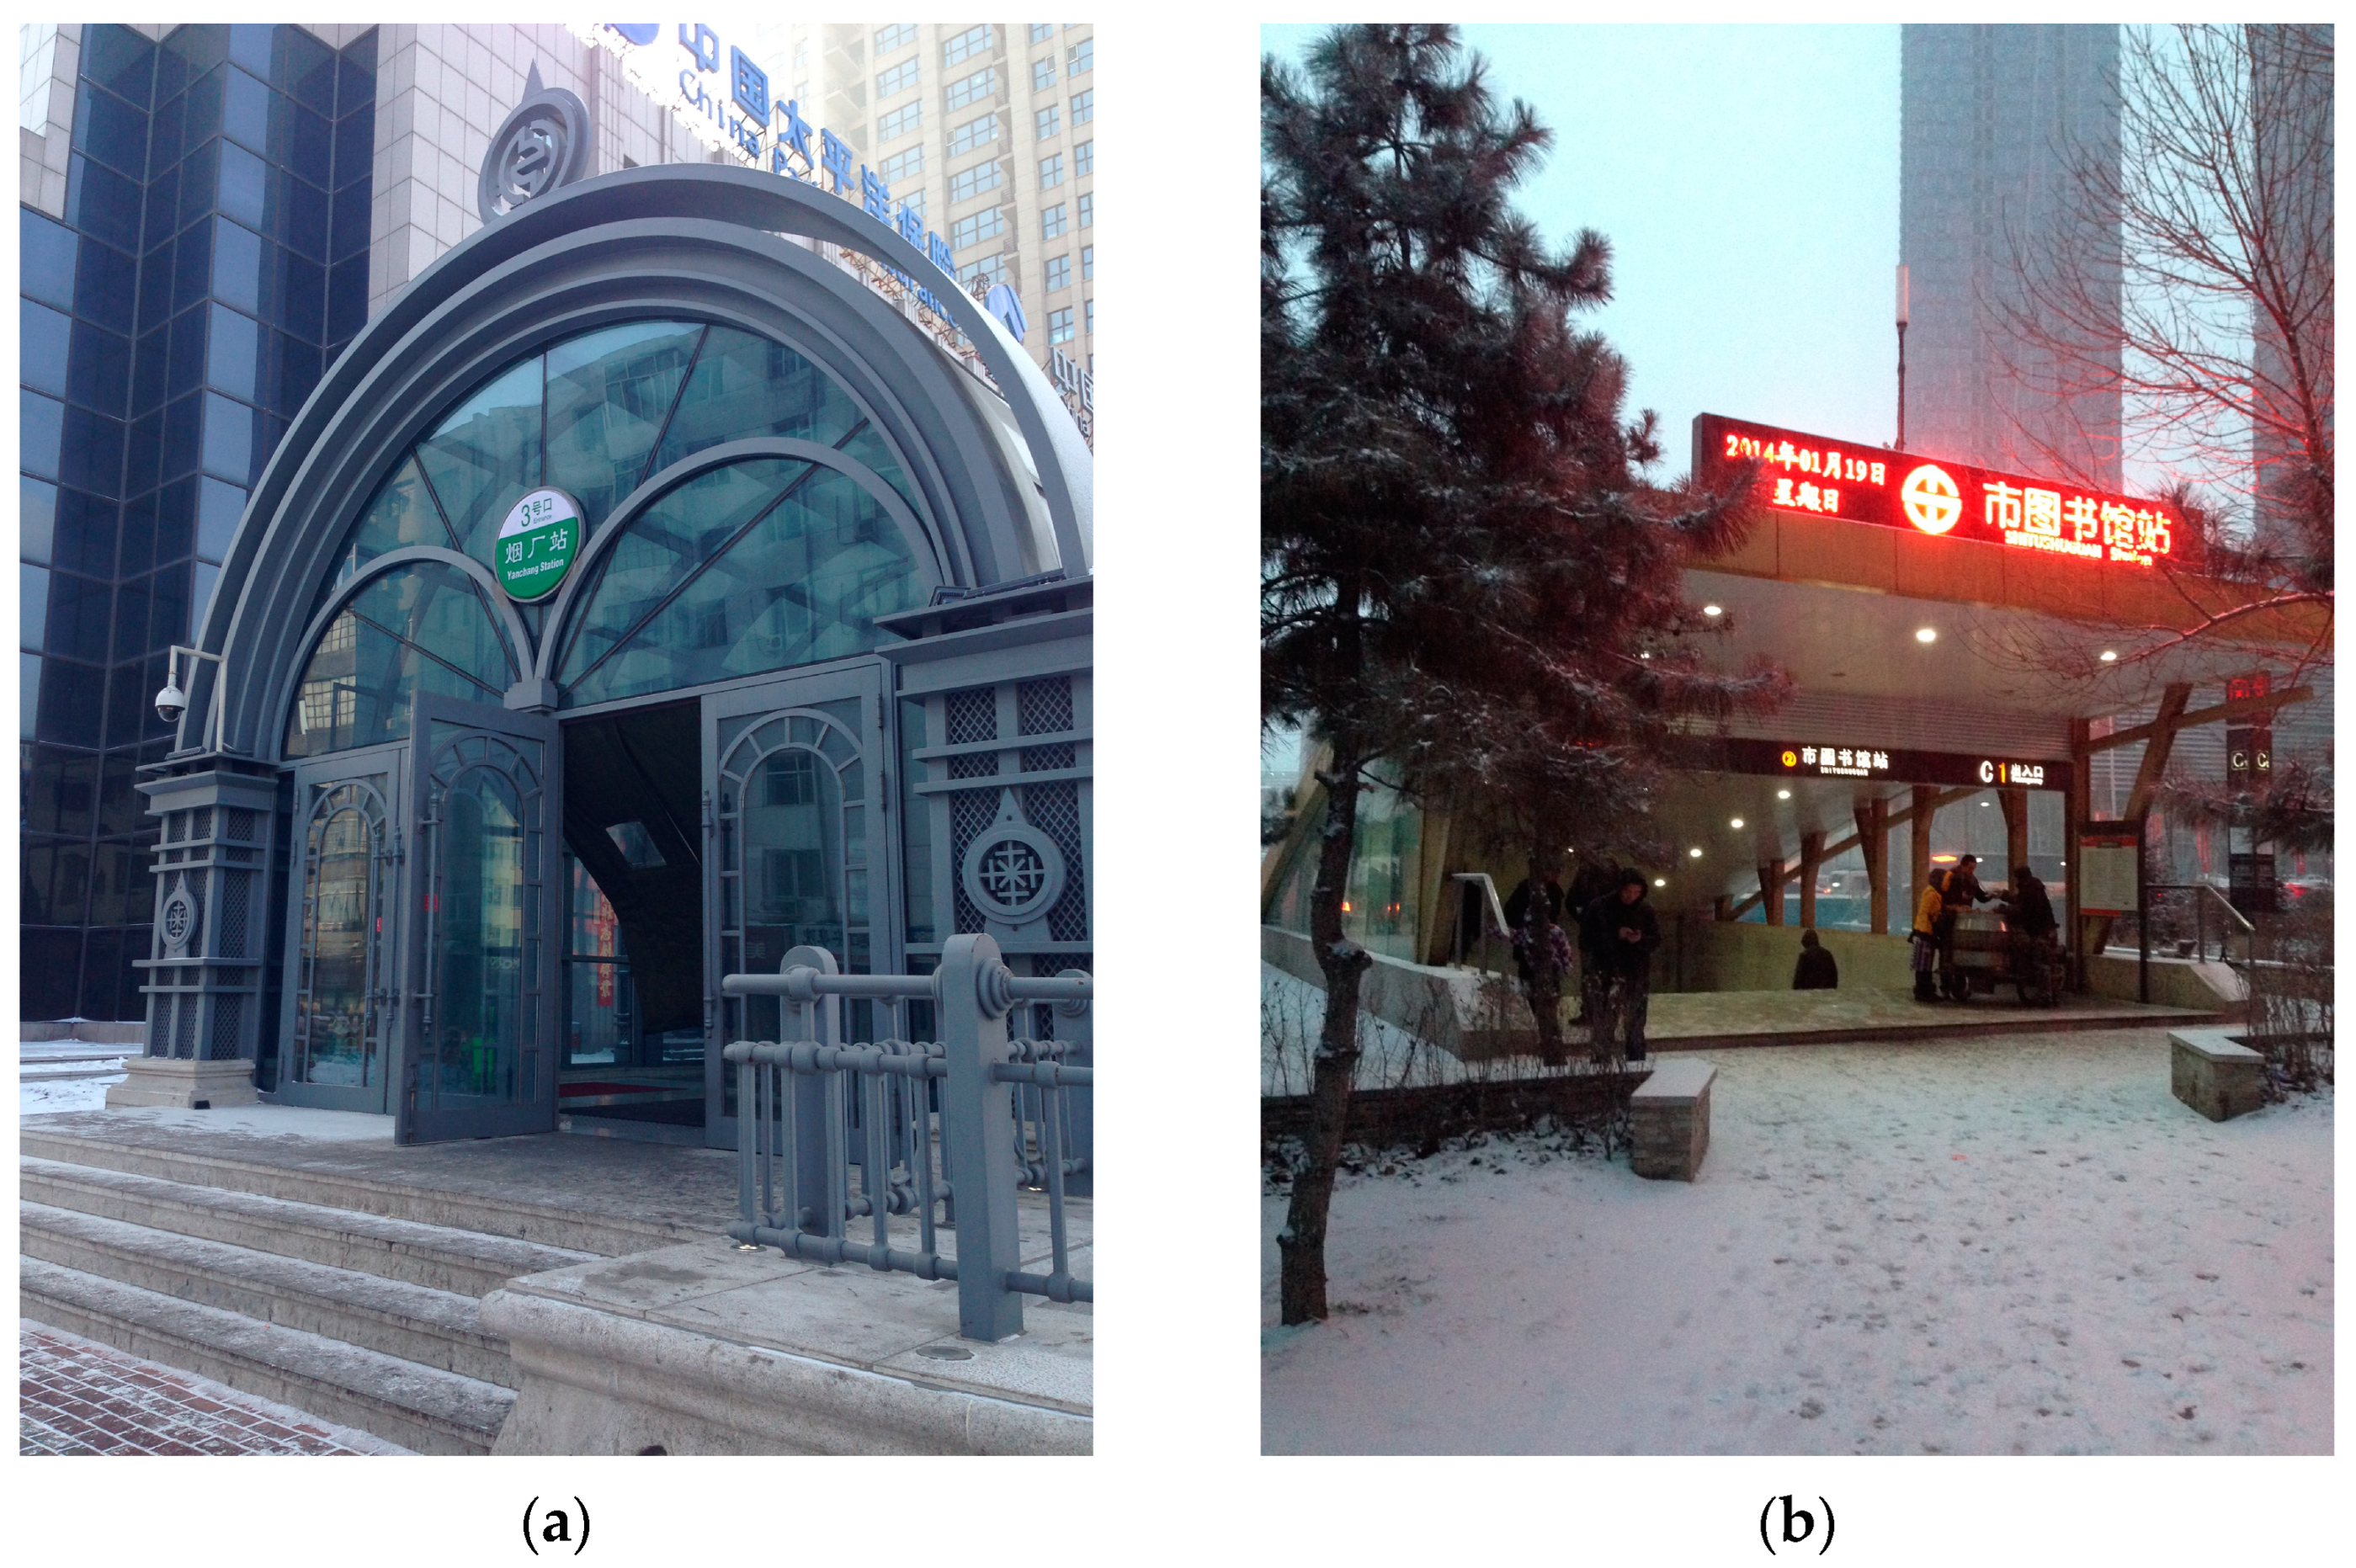
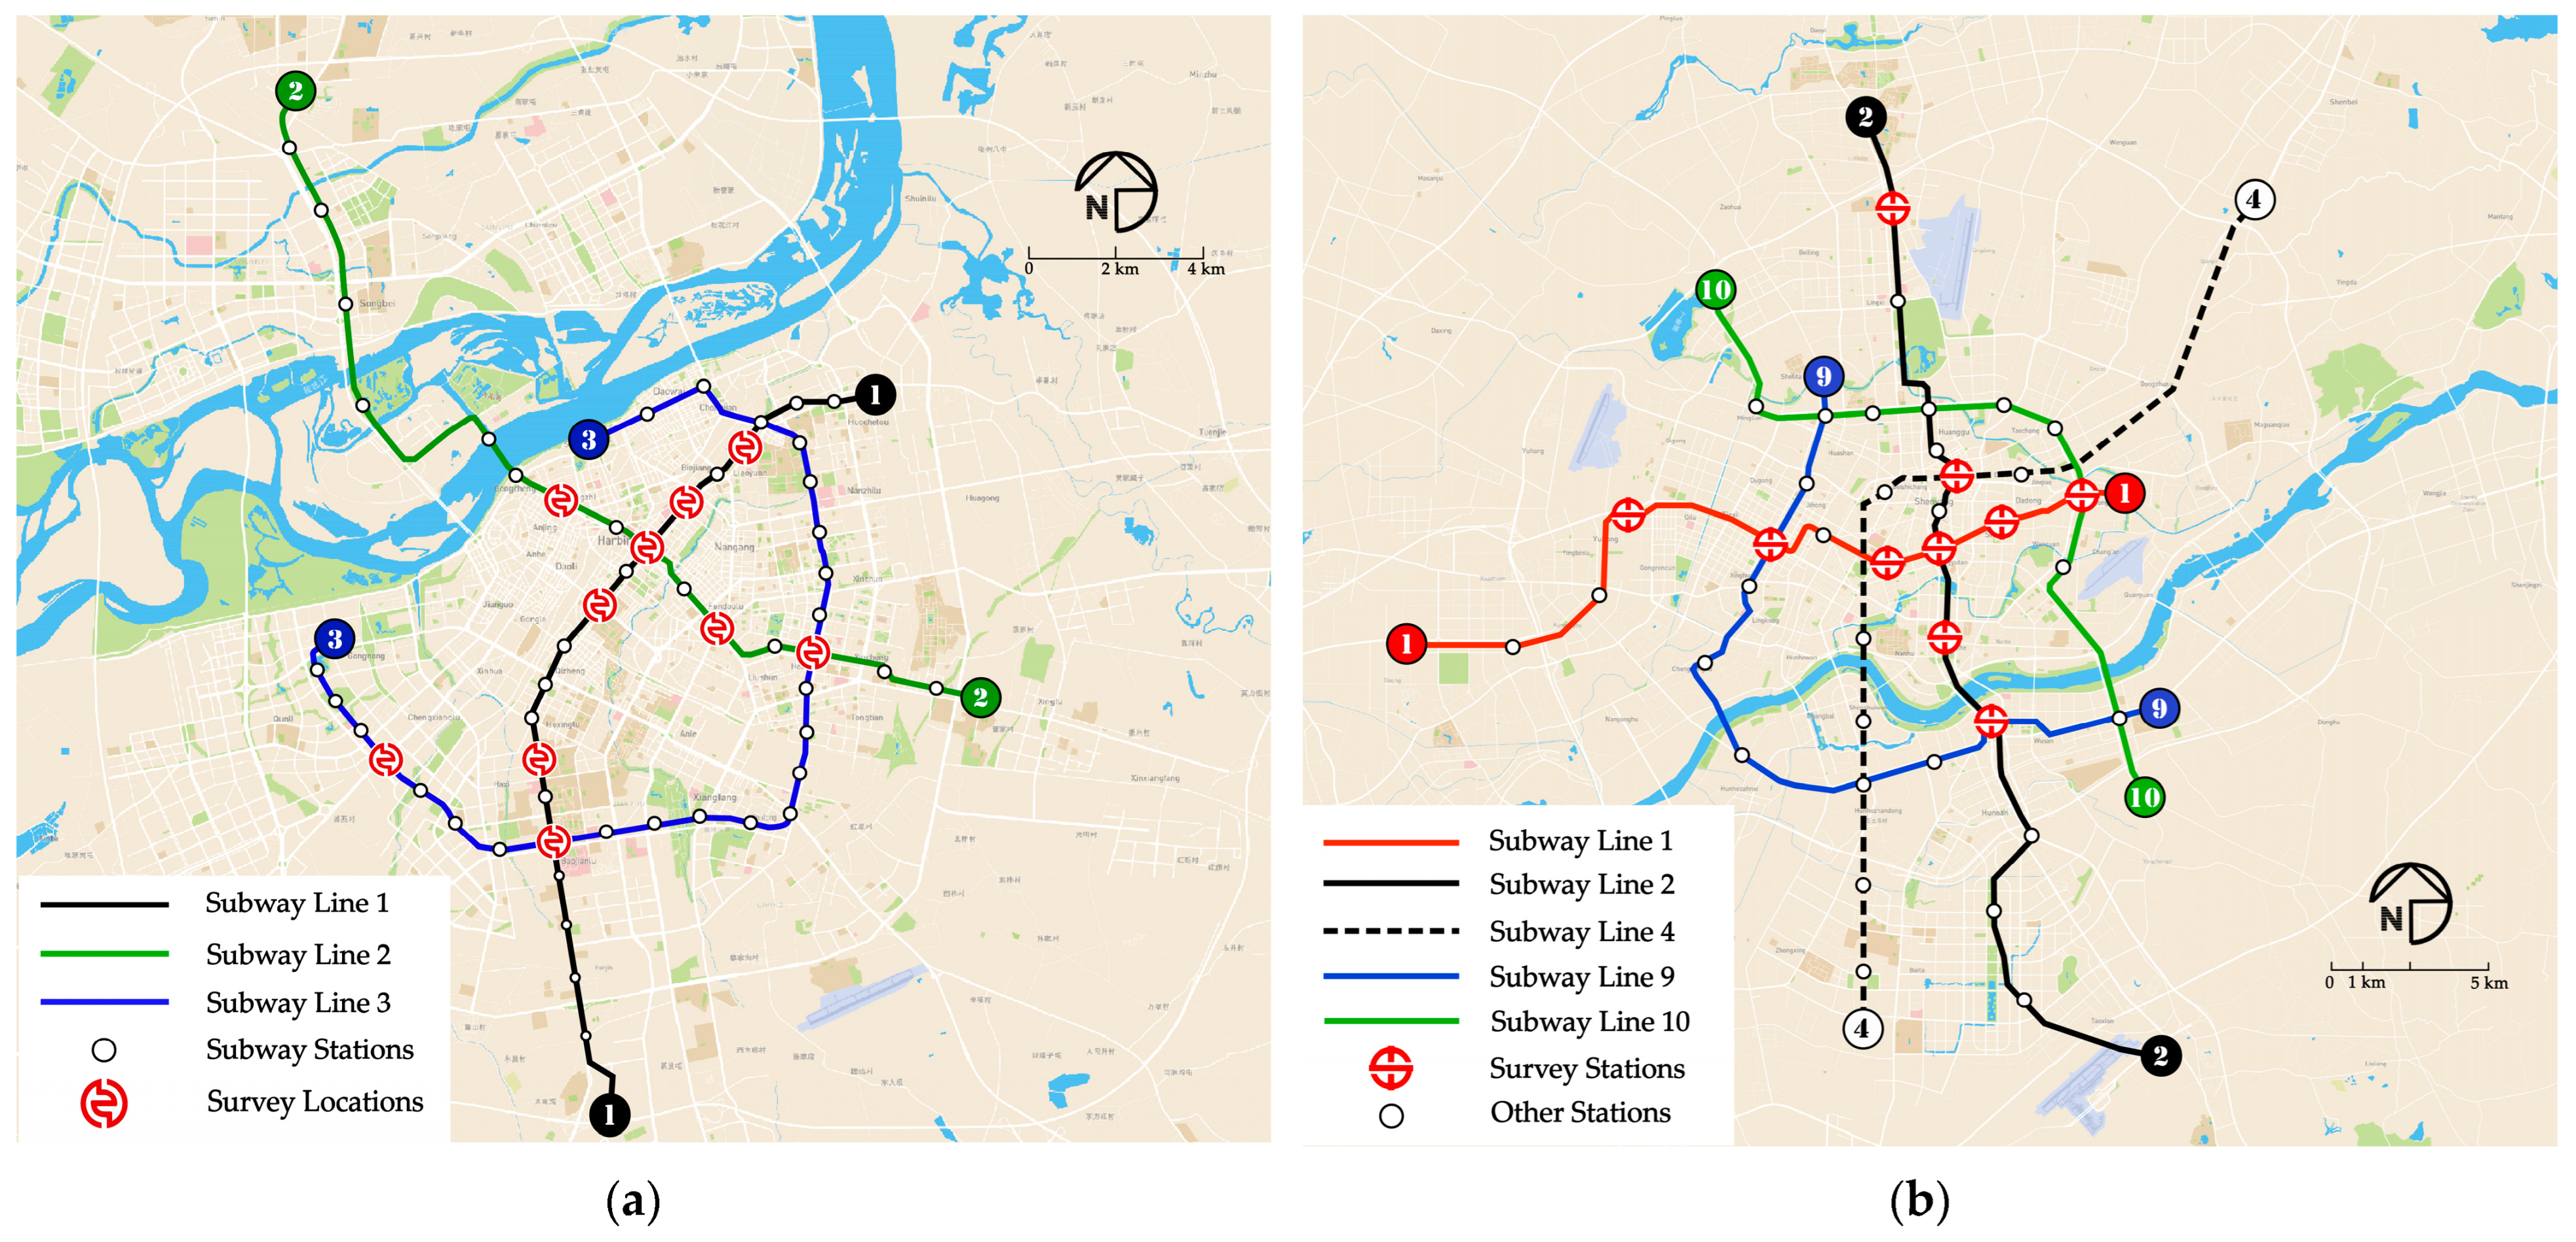
2.2. Data Collection

Data for the research were gathered via self-administered surveys carried out in Harbin and Shenyang between December 2022 and January 2023. Harbin and Shenyang, major cities in Northeast China and the respective capitals of Heilongjiang and Liaoning provinces, both are situated above the 41-degree-north latitude mark. These cities are characterized by their distinct seasons, with long winters and short summers, defining them as typical cities in a cold climate zone. Harbin, often referred to as the Ice City, experiences a more severe cold climate compared to Shenyang. This difference in the extremity of the cold climate is reflected in the design of subway entrances and exits in Harbin and Shenyang. As evidenced in Figure 2, subway access points in Harbin are fully enclosed, in contrast to Shenyang’s predominantly semi-enclosed subway entrances and exits. This variance in enclosure levels between the two winter cities suggests potential differences in planning and architectural design strategies for subway entrances. Therefore, Harbin and Shenyang have been chosen as the study areas for this research.
This study was designed to explore the impact of subway entrance attributes on passenger satisfaction. The survey instrument, developed using an advanced online questionnaire design platform hosted by wjx.cn, underwent rigorous testing. A preliminary survey was conducted with 15 passengers each in Harbin and Shenyang to identify and mitigate potential biases. The questionnaire’s form and content were refined based on feedback from these initial participants. Recruitment of survey respondents was facilitated through the distribution of informational leaflets at various subway stations. Each leaflet included a cover letter detailing the study’s objectives and a QR code that directed respondents to the online questionnaire, accessible via standard smartphone technology.
To ensure a randomized sample, six trained postgraduate students from our research team were deployed across different types of subway stations, as detailed in Figure 3. The legends denote surveyed stations with red subway icons in each city. Out of 500 leaflets distributed, 407 subway riders participated, yielding 388 valid responses, including 202 from Harbin and 186 from Shenyang.
Passenger satisfaction, the study’s dependent variable, was assessed using a single-item measure. Respondents rated their satisfaction with the subway entrance on a seven-point Likert scale ranging from “strongly dissatisfied” (1) to “strongly satisfied” (7).
The independent variables were categorized into three groups: preferred subway entrance attributes, perceived subway entrance attributes, and demographic characteristics. Participants rated the importance of 21 subway entrance attributes on a seven-point scale from “not at all important” (1) to “extremely important” (7), reflecting their preferences. To gauge perceptions, respondents assessed the presence of these attributes at specific subway entrances using a similar seven-point scale from “extremely not true” (1) to “entirely true” (7). The instruments for measuring preference and perception were adapted from existing studies on neighborhood satisfaction [40,41]. The discrepancy between perceived and preferred attributes serves as a representation of satisfaction with the attributes [16,41]. This measure quantifies the alignment between user expectations and their actual experience of the subway entrance attributes, with satisfaction levels indicated on a scale ranging from −6 to 6. Lastly, the questionnaire collected demographic data, including age, gender, income, and subway travel behavior. Aspects such as daily subway usage time, weekly frequency, and peak usage season were also examined to understand the respondents’ subway travel patterns. For a comprehensive overview of the survey questionnaire, please refer to Appendix B.
The demographic breakdown of the survey sample, as depicted in Table 2, offers a comprehensive overview of the subway user population in Harbin and Shenyang. Females make up the majority of the sample at 60.57%, with a notably higher percentage in Harbin (64.85%) as compared to Shenyang (55.91%). Males represent 39.43% overall, with Shenyang having a larger proportion (44.09%) relative to Harbin (35.15%). The most populous age group within the sample is the 26–30 bracket, accounting for 42.27% of respondents, with a predominant presence in Shenyang (51.61%) over Harbin (33.66%). In terms of income, the bracket from CNY 2000 to 5000 is the most common, representing 46.13% of the total sample and being particularly significant in Harbin (51.49%). Regarding subway usage time, a majority (65.46%) of participants did not stick to a specific time of day, indicating a flexible pattern of subway use in both cities. The sporadic usage category, denoting respondents who use the subway occasionally without a regular pattern, is the most substantial, encompassing 62.37% of the sample. When examining seasonal subway use, a significant portion of respondents (70.88%) indicated no particular seasonal preference, suggesting consistent usage throughout the year, including winter. Together with the 15.46% who specifically stated winter as their peak subway usage season, this culminates in more than 86% of the sample having experience with subway use during winter months. This prevalence of winter usage experience among respondents is particularly relevant to this study.

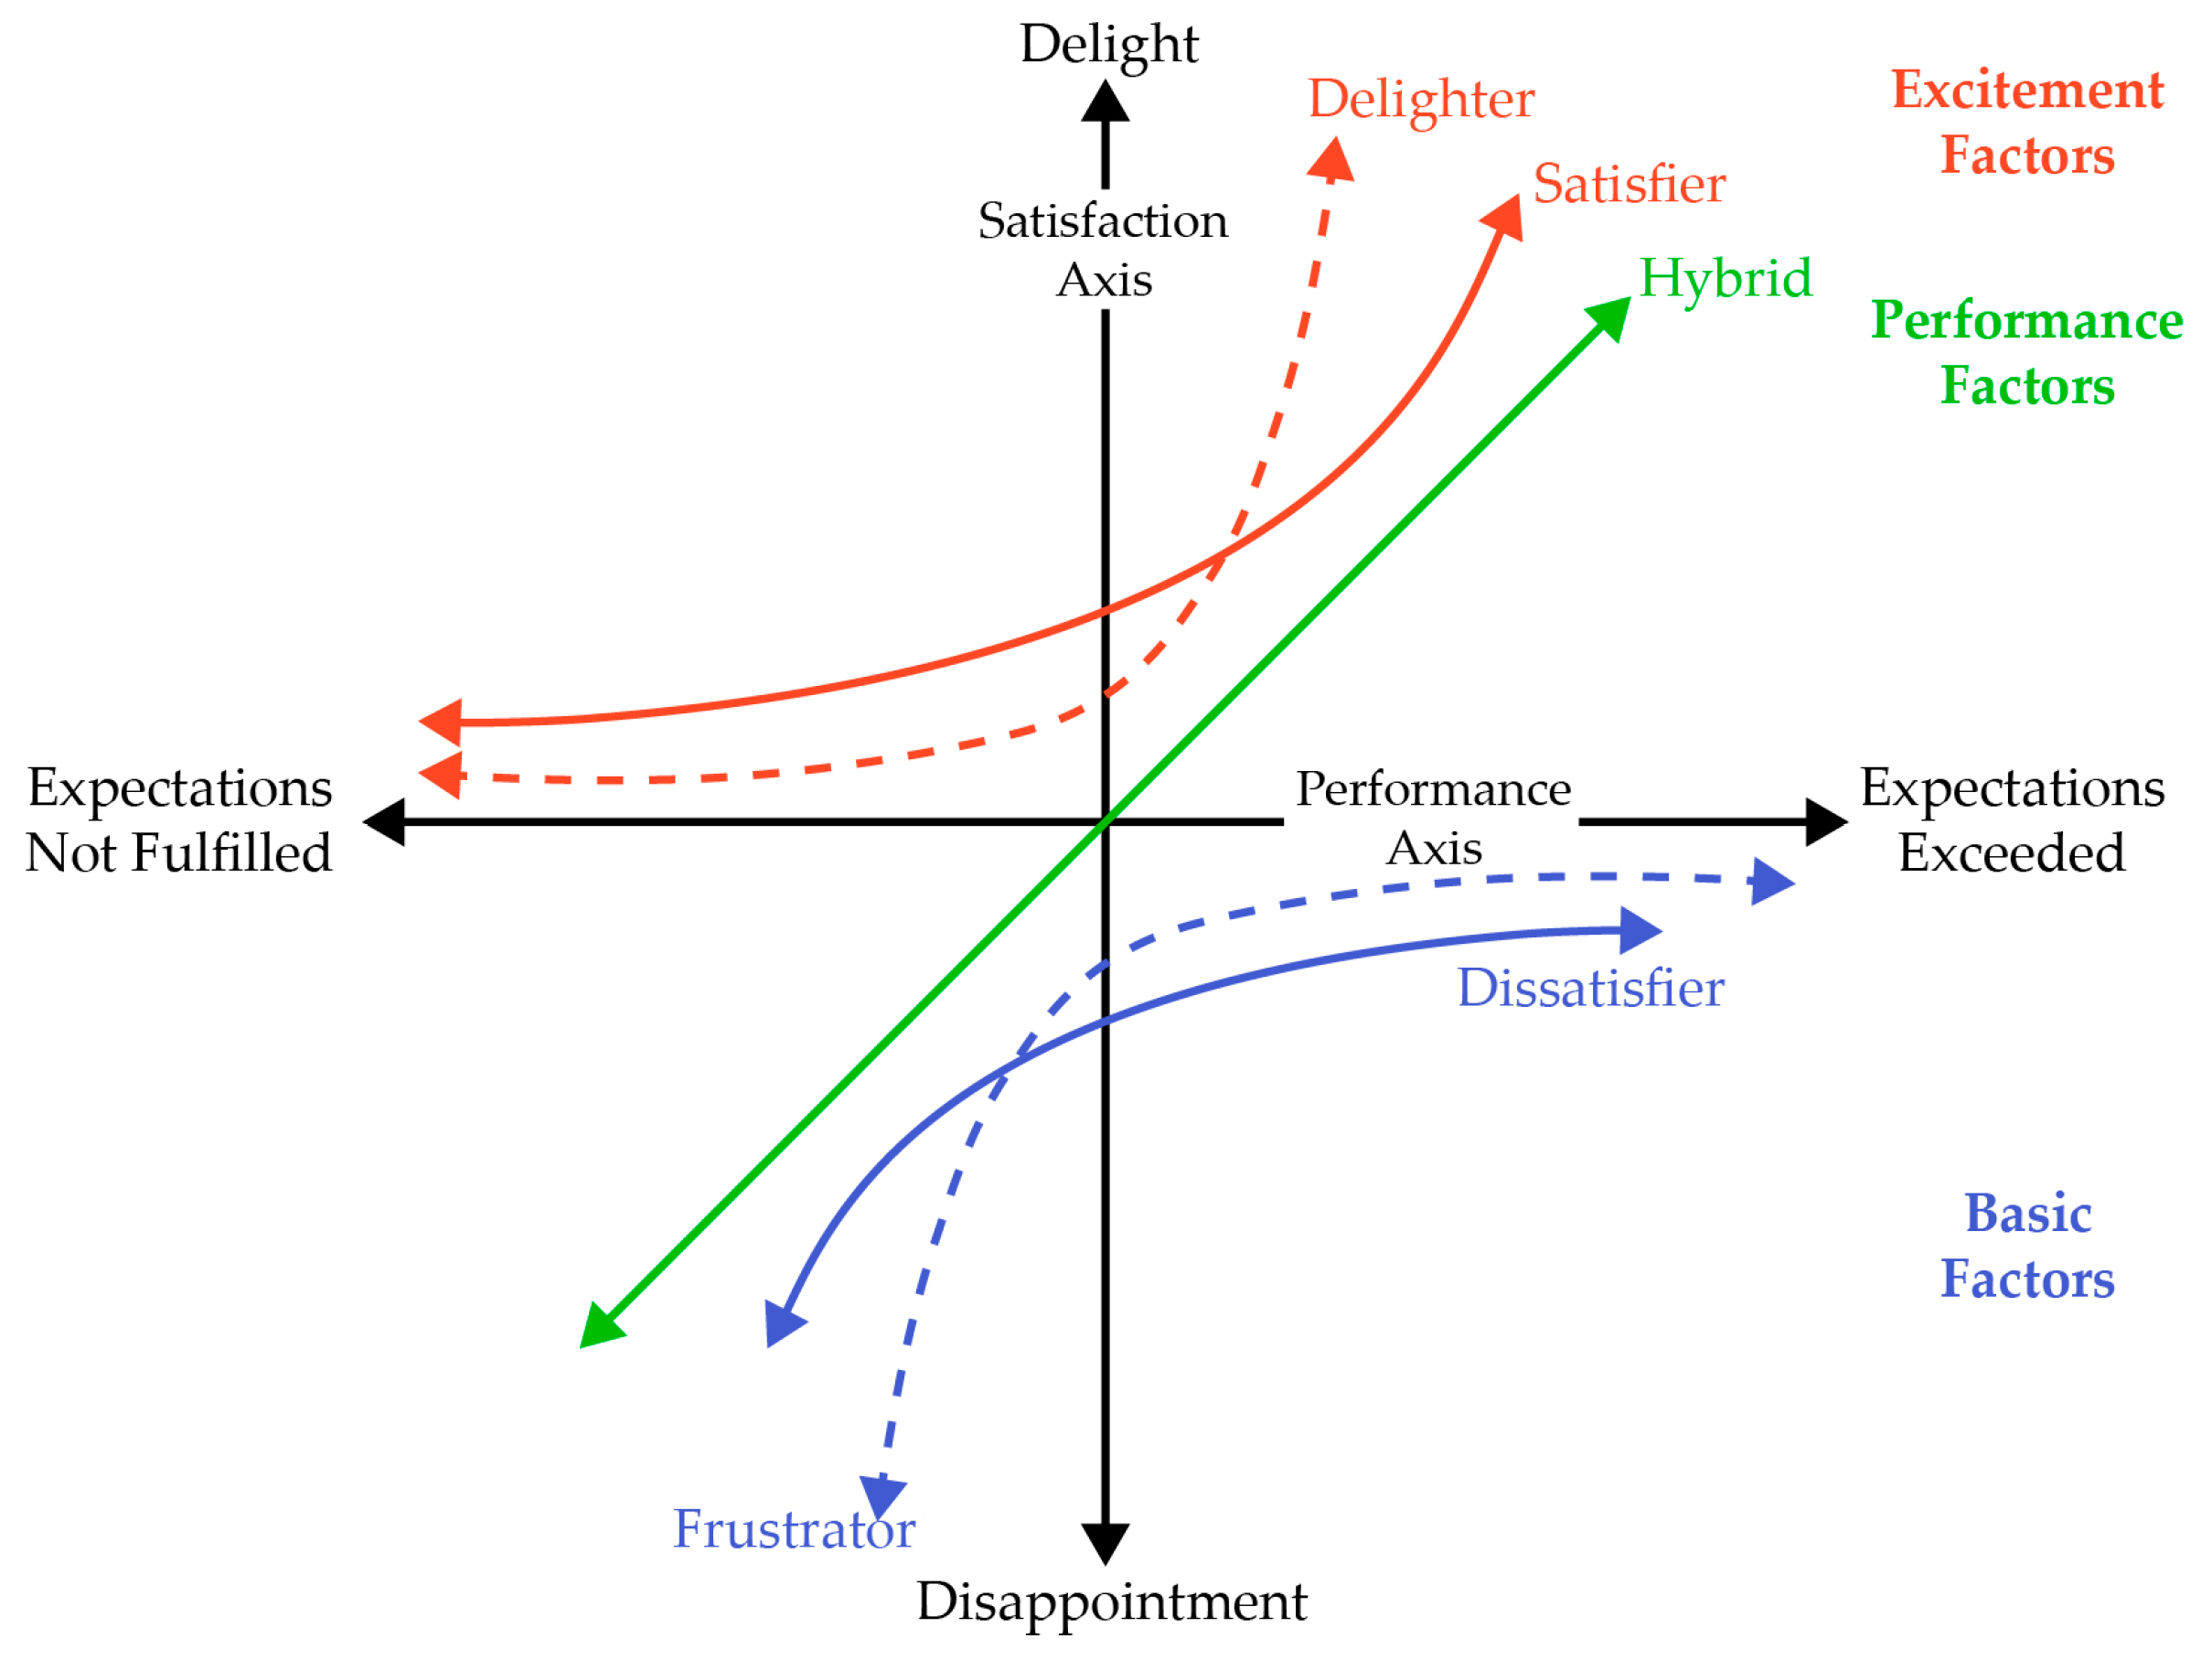
2.3. Analysis Method for the Priority Assessment of Attributes

In improving the quality of attributes, given resource constraints, it is advocated that allocation decisions are prioritized based on attribute assessment [42]. The action grid analysis, commonly known as importance-performance analysis (IPA), is a widely accepted, straightforward, and visual method [43]. IPA operates on the premise that an attribute’s performance impacts satisfaction both positively and negatively in a linear, symmetrical manner [44]. However, numerous studies have demonstrated an asymmetric effect [45,46], suggesting that an attribute’s positive performance might significantly influence overall satisfaction more than its negative counterpart, or vice versa.
The three-factor theory of customer satisfaction, initially introduced by Kano [47] and later refined by various researchers [45,48], posits that satisfaction is not a unidimensional concept and the reverse side of dissatisfaction is not necessarily satisfaction [42]. This theory classifies attributes into three categories based on their asymmetric effects: basic, performance, and excitement factors [49,50]. Basic factors cause dissatisfaction when unmet, but their fulfillment only subtly affects satisfaction. Excitement factors, conversely, directly enhance satisfaction and lead to delight but do not typically cause dissatisfaction when lacking. Performance factors, uniquely, affect both satisfaction and dissatisfaction, as their relationship with overall satisfaction is symmetric.
Various methodologies have been suggested to identify these three categories, including the critical incident technique [51], the importance grid method [52], and penalty–reward contrast analysis [53]. The latter, particularly prevalent, involves creating two sets of dummy variables by recoding each attribute’s performance values [54]. Through regression analysis using these dummy variables, the structure of factors can be discerned, aided by two coefficients indicating each attribute’s penalty index (PI) and reward index (RI). Mikulić and Prebežac extended this approach [55], introducing the concept of impact-asymmetry analysis (IAA), which is a further development of the three-factor theory. As shown in Figure 4, IAA distinguishes five factors: frustrators, dissatisfiers, hybrid, satisfiers, and delighters. This finer categorization is based on the degree of asymmetry, with frustrators and delighters being more asymmetric compared to dissatisfiers and satisfiers [17].
Caber, Albayrak, and Loiacono [54] developed a variation of IAA, termed asymmetric impact-performance analysis (AIPA), offering enhanced visual simplicity and interpretability. This method, proven reliable and effective, has been utilized in business-to-business, tourism, and urban researches to identify priorities for improvement [56,57]. AIPA falls under penalty–reward contrast (PRC) analysis, based on the idea that poor attribute performance incurs a penalty and dissatisfaction, whereas excellent performance brings rewards and delight. Regression with dummy variables is a standard method in PRC analysis. By conducting regression analysis with dummy variables, one can determine the factor structure with the help of the penalty index (PI) and reward index (RI). PRC highlights the importance of categorizing attributes by their satisfaction- and dissatisfaction-generating potential, represented by ratios involving RI and PI. The impact-asymmetry index (IA index) and the range of impact on overall satisfaction (RIOS) are plotted on a two-dimensional matrix, aiding in attribute prioritization.
However, a notable limitation of AIPA is the potential multicollinearity in regression with dummy variables, a common issue in built environment attributes [15,16,49]. To mitigate this, our study employs gradient-boosting decision trees (GBDT). This approach effectively combines decision trees with gradient boosting to model complex nonlinear relationships without the need for predefined correlations between variables. The GBDT method iteratively refines the model with a focus on minimizing prediction errors. A comprehensive description of the methodology and operational mechanics of GBDT is provided in Appendix A. Furthermore, for an in-depth understanding, please refer to the videos provided in the Supplementary Materials section. This model represents a significant advancement over traditional regression methods, especially due to its proficiency in handling complex intervariable relationships, and it is particularly adept at resolving issues of multicollinearity [15].
In this research, we employed the scikit-learn package (version 1.3.2) within the Python 3.10 environment to train our GBDT model, specifically for estimating the impacts of penalties and rewards. The Jupyter Notebook interface (version 6.4.12), provided by Anaconda, was used to facilitate an interactive and iterative methodology for both model development and evaluation.

3. Results

3.1. Model Performance

The dataset was partitioned into dependent and independent variables, followed by one-hot encoding for categorical variables, leading to the development of an initial model. Subsequently, the GridSearchCV algorithm was employed, integrating an grid search with a five-fold cross-validation, to optimize the hyperparameters. In the GradientBoostingRegressor class of scikit-learn, the “n_estimators” parameter, indicative of the forest’s tree count, was adjusted from 100 to 400 in 100-unit increments. The “max_depth” parameter, defining each tree’s maximum depth, was evaluated with values incrementally doubling from 2 to 10. The “min_samples_split” parameter, which determines the minimum sample count for internal node splitting, was explored within a range of 2 to 5. The “learning_rate” was assessed over a spectrum of values: 0.001, 0.005, 0.01, 0.05, 0.1, 0.5, and 1. Furthermore, the “min_samples_leaf” parameter, setting the leaf node’s minimum sample count, was examined with values of 1, 2, 4, 8, 16, and 20.
The final GBDT models were developed using the optimal hyperparameter configurations identified through GridSearchCV, as detailed in Table 3. Despite data complexities and potential noise, the Harbin and Shenyang models demonstrated significant explanatory power with R2 values of 0.6944 and 0.8133, respectively. The corresponding root mean squared errors (RMSEs) on the test set were 0.6284 and 0.5581.
An R2 value closer to 1 indicates that the model explains a large portion of the variance in the dependent variable. In many fields, including urban and architectural research, an R2 value greater than 0.5 is generally considered acceptable, suggesting a substantial explanatory power of the model. Our results, therefore, indicate a strong capability of the models to explain variations in passenger satisfaction. Additionally, considering the range of the dependent variable in our study, which is from 1 to 7, an RMSE of approximately 0.6 implies that the average prediction error is less than 10% of the total range. This level of RMSE suggests that our model’s predictions are generally close to the actual values, making it a reasonably accurate model for this scale. The acceptability of an RMSE value is context-dependent and in our study’s context, where complex human–environment interactions are being modeled, these RMSE values indicate a commendable level of precision.

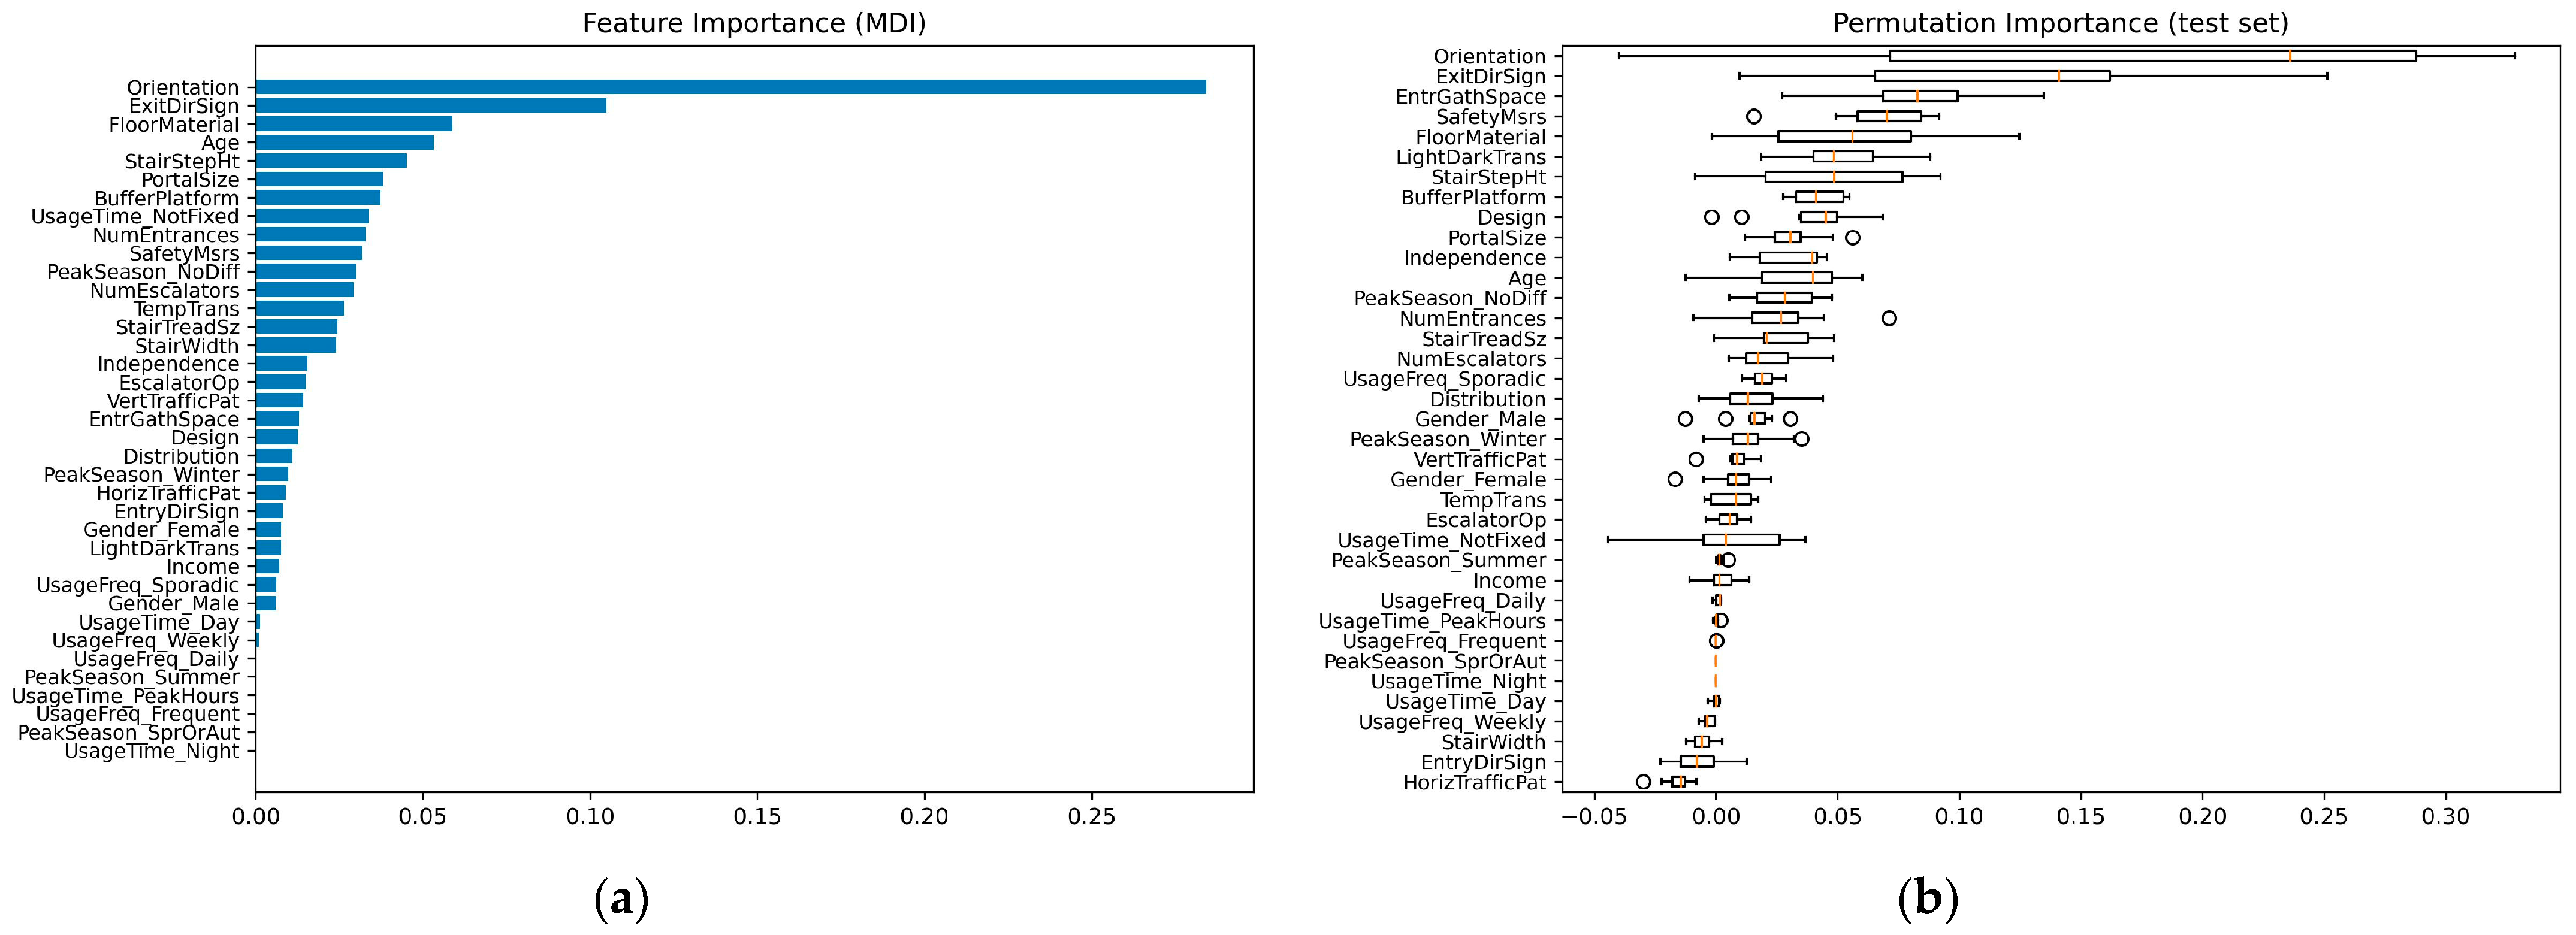
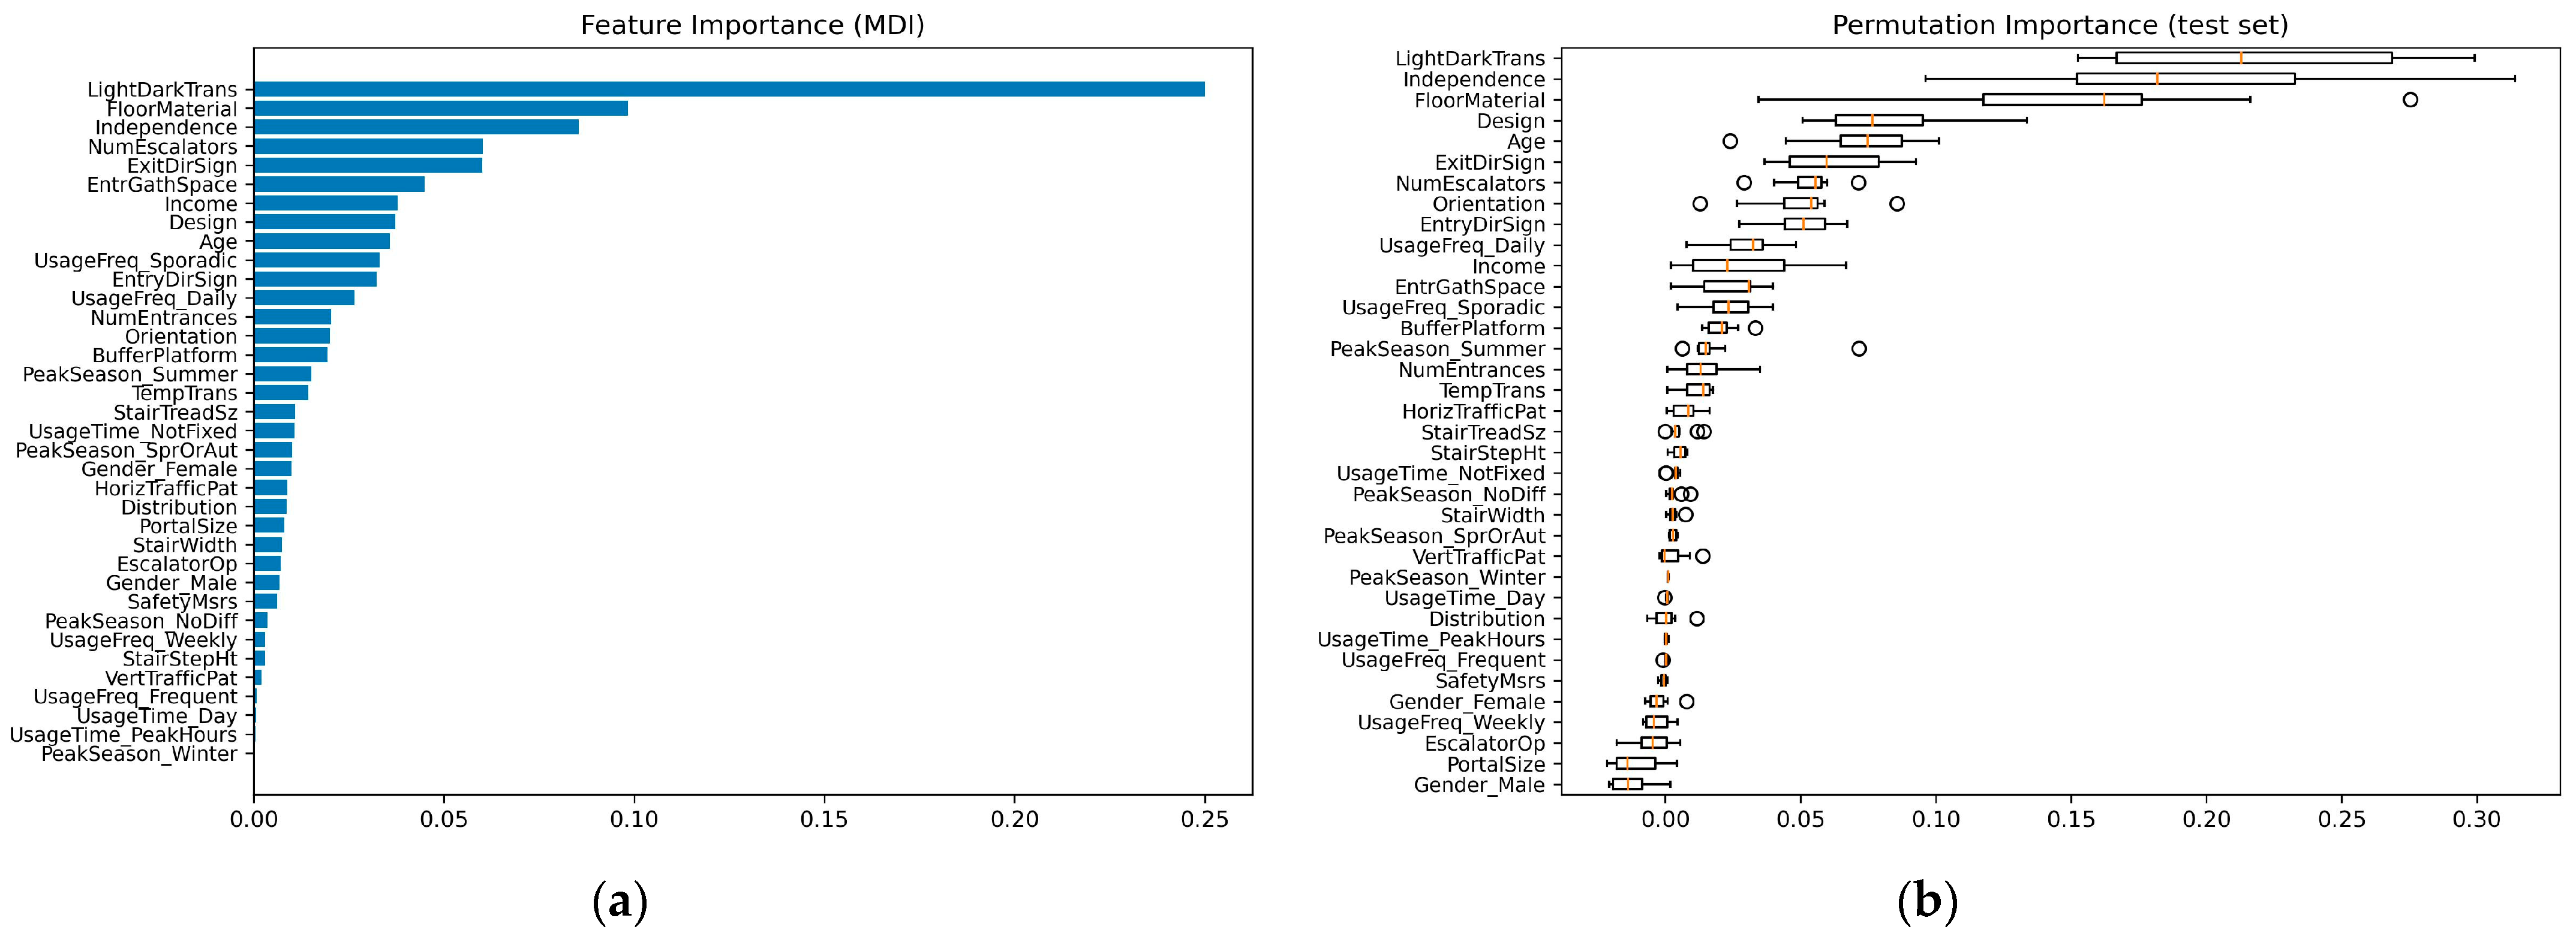
3.2. Relative Contributions of Independent Variables

In the evaluation of the relative contributions of the independent variables, two distinct feature importance methods were applied: mean decrease in impurity (MDI) and permutation importance. MDI measures one independent’s improvement in reducing the prediction error, relative to other independent variables. The MDI-based relative importance of all the independent variables adds up to 100%. Permutation importance, on the other hand, gauges the decrease in model performance when a feature’s values are randomly shuffled, thus reflecting its impact on prediction accuracy more directly and accounting for interactions between features.
Figure 5 compares the MDI-based feature importance and the permutation importance of all the independent variables in Harbin. Certain features like orientation, exit direction signage, floor material, stair step height, portal size, and buffer platform ranked high in both MDI and permutation importance. This consistency across both metrics underscores their significant influence on passenger satisfaction, highlighting their roles as structural components of the model and their substantial impact on model accuracy. Safety measures, light–dark transitions, and design emerge as influential but in different ways across the two plots. Safety measures command high permutation importance, indicating a significant impact on model prediction when its values are altered, suggesting that passenger satisfaction is sensitive to changes in perceived safety. However, its lower MDI ranking may imply that safety, as a singular feature, does not heavily influence the model’s structure but interacts with other features to affect satisfaction. Design is more prominent in the MDI plot, suggesting it has significant contribution to the prediction power of the model. Its relatively lower but still notable permutation importance signifies that while it contributes to predictive accuracy, its impact is not as pronounced when isolated. Light–dark transitions, with a higher ranking in the permutation importance plot, points to the feature’s impact on the model’s accuracy, potentially reflecting passengers’ sensitivity to lighting transitions within the transit environment. Demographic variables present a varied picture. While age and the “no difference” subcategory of peak subway usage season demonstrate high relative importance, suggesting certain demographic factors can significantly influence satisfaction, most demographic variables like gender, usage time, and usage frequency exhibit low relative importance.
Figure 6 presents the MDI and permutation importance plots for Shenyang. Features like light–dark transition, floor material, independence, and design are prominent in both plots, indicating their pivotal role in the model’s structure as well as their tangible impact on the model’s prediction accuracy. The analysis also reveals a divergence in feature rankings between the two plots. Exit direction signage, for instance, is given significant weight in the MDI plot, suggesting it is a key structural component within the decision trees. However, its lower ranking in the permutation importance plot could imply that changes in this variable may not lead to substantial fluctuations in the prediction accuracy of the Shenyang model. Conversely, the number of escalators is more critical in the permutation importance plot, which may reflect its direct influence on satisfaction. Demographic variables in Shenyang exhibit a moderate impact on passenger satisfaction, with a greater number influencing the predictive model compared to Harbin. Income and age feature as mid-ranking variables in both MDI and permutation importance plots, suggesting that while they are not the most critical factors, they hold a considerable influence on satisfaction levels. Additionally, aspects of passenger travel behavior, such as subway usage frequency, daily usage time, and peak usage season, are reflected to a certain extent in the model’s predictions, underscoring their relevance in assessing passenger satisfaction.
Further, this study employed a dual-criteria approach to identify the pivotal independent variables that influence passenger satisfaction. We focused on features demonstrating an MDI value of 0.01 or higher, indicating their contribution exceeded 1% of the model’s predictive power. To enhance the robustness of our selection, we included only those variables with a mean permutation importance above 0.01. This stringent dual-criteria method ensured that the selected variables were integral to reducing predictive uncertainty and had a pronounced, empirically verified effect on the model’s prediction accuracy. Consequently, 16 independent variables were identified as key influencers in Harbin—with 14 related to subway entrance attributes. In contrast, 17 variables were selected for Shenyang, with 12 pertaining to subway entrance characteristics. Table 4 delineates the relative importance of these key independent variables, providing a comprehensive overview of their impact on passenger satisfaction.

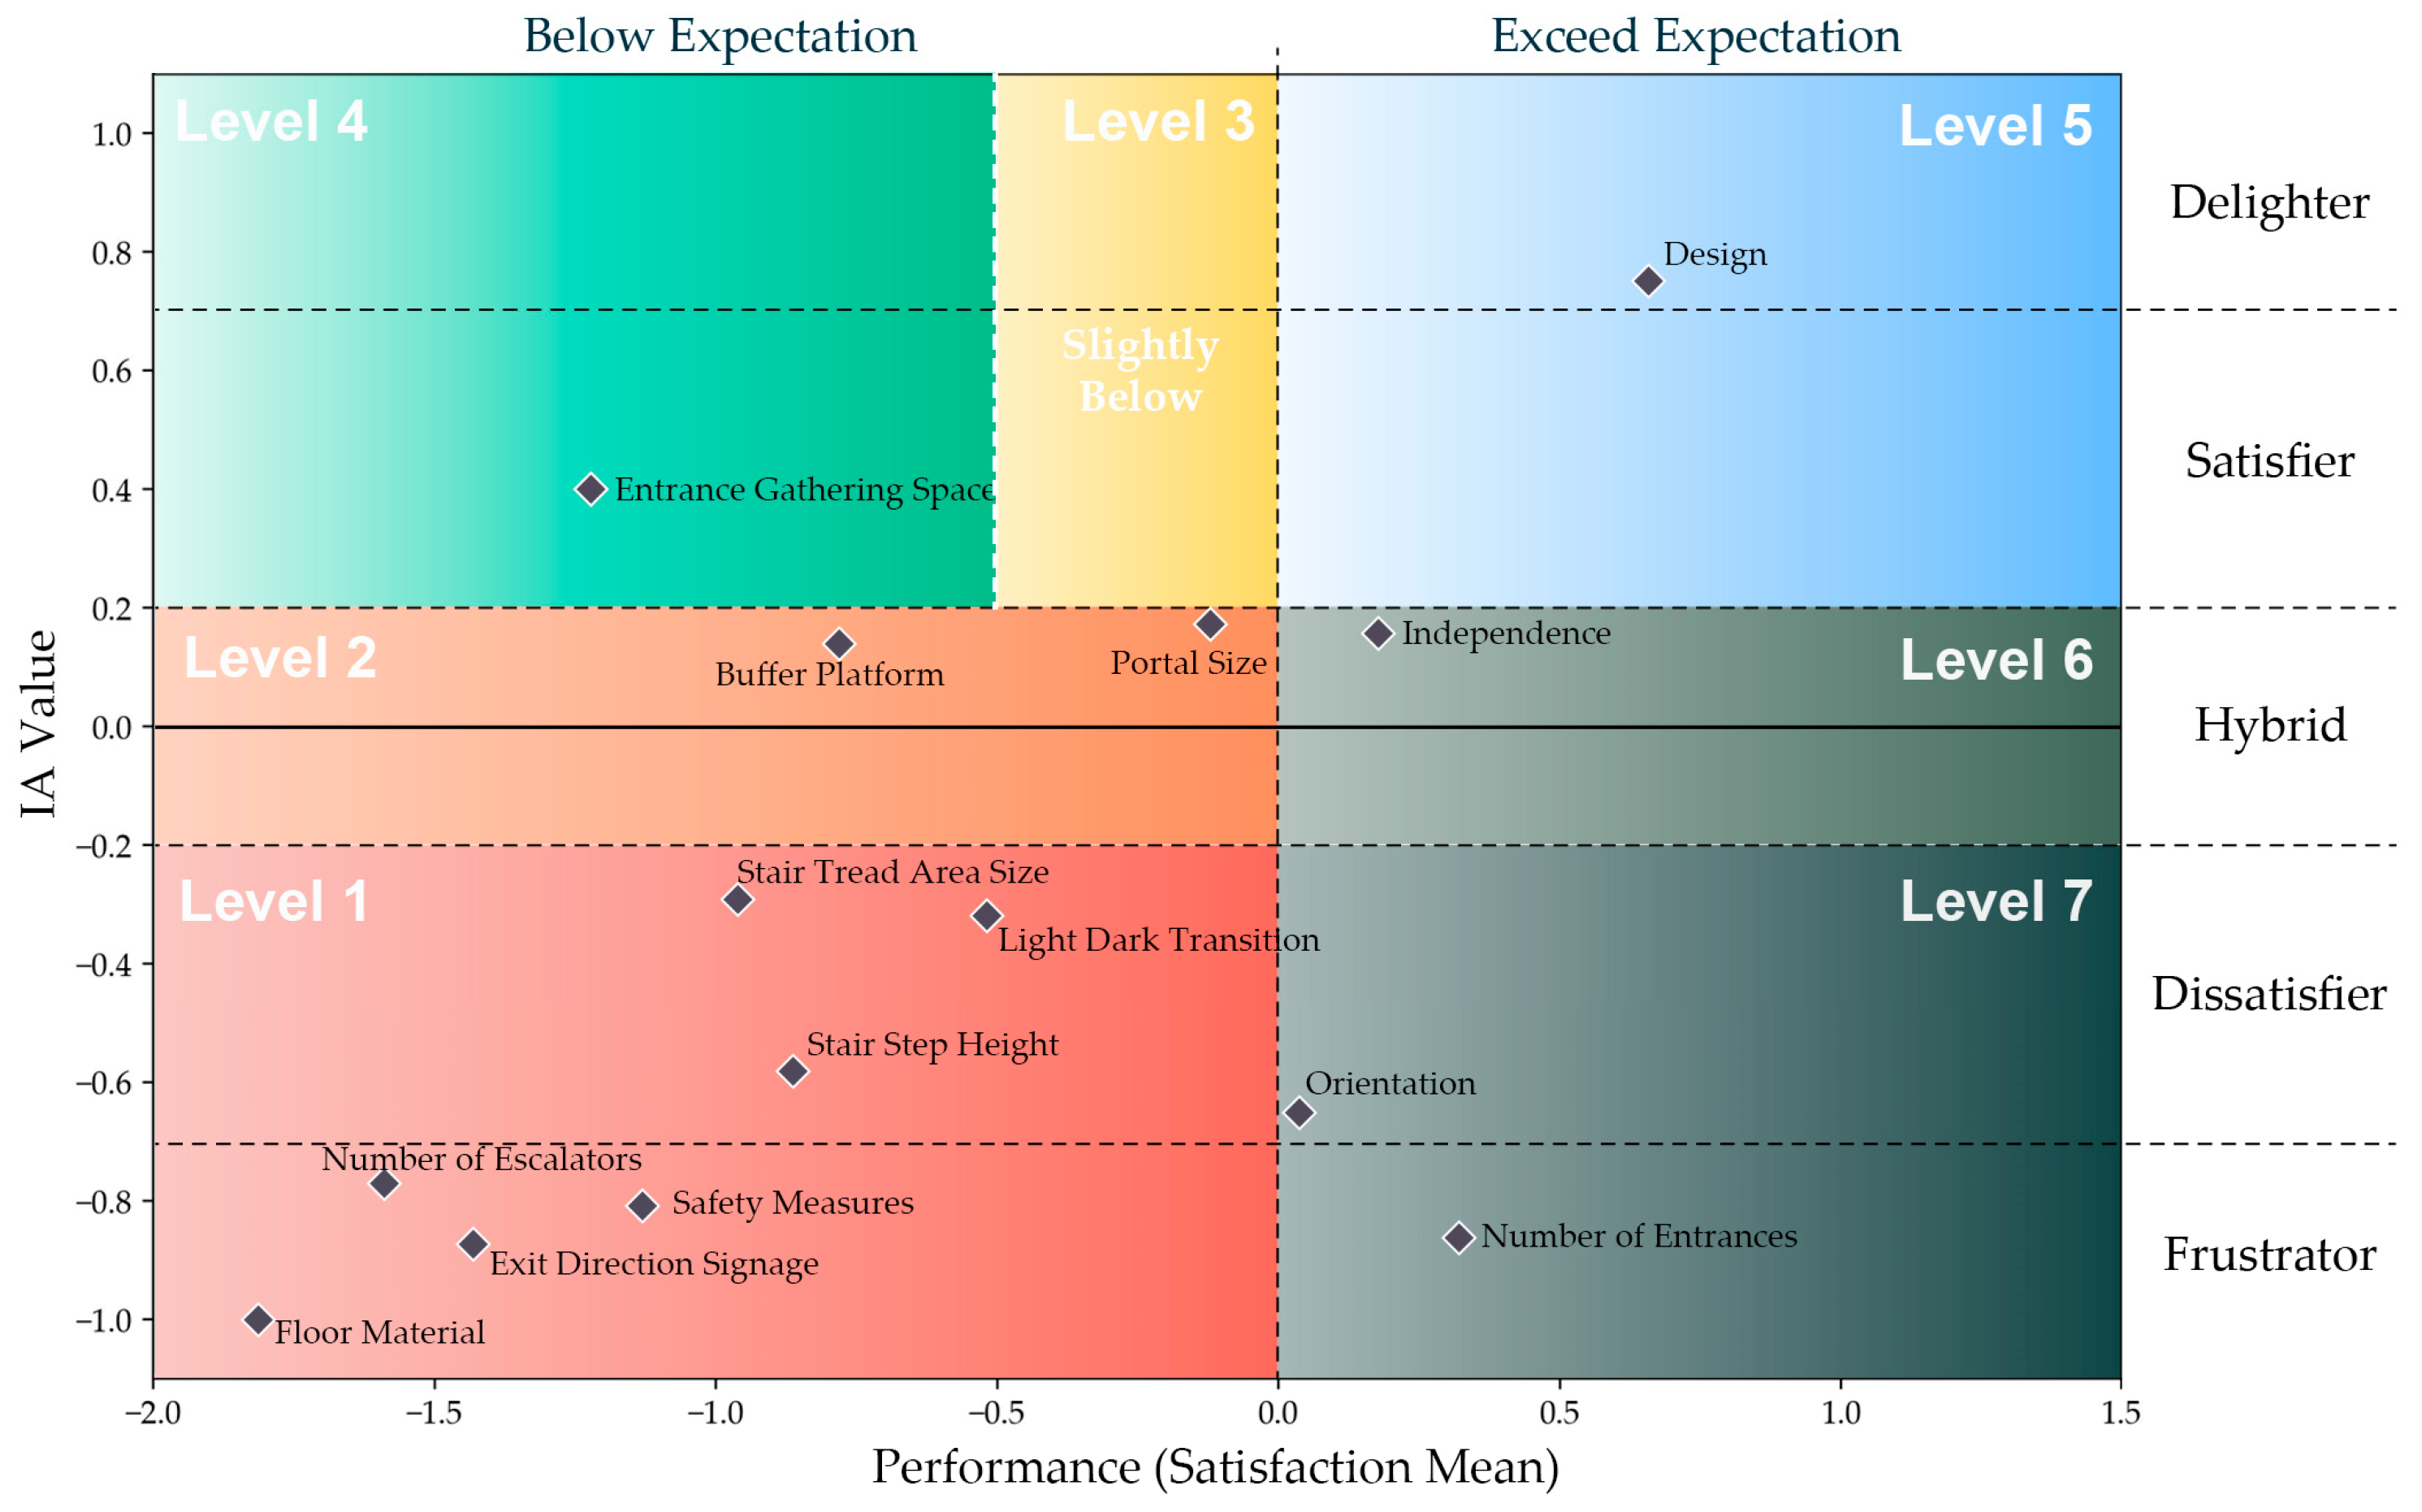
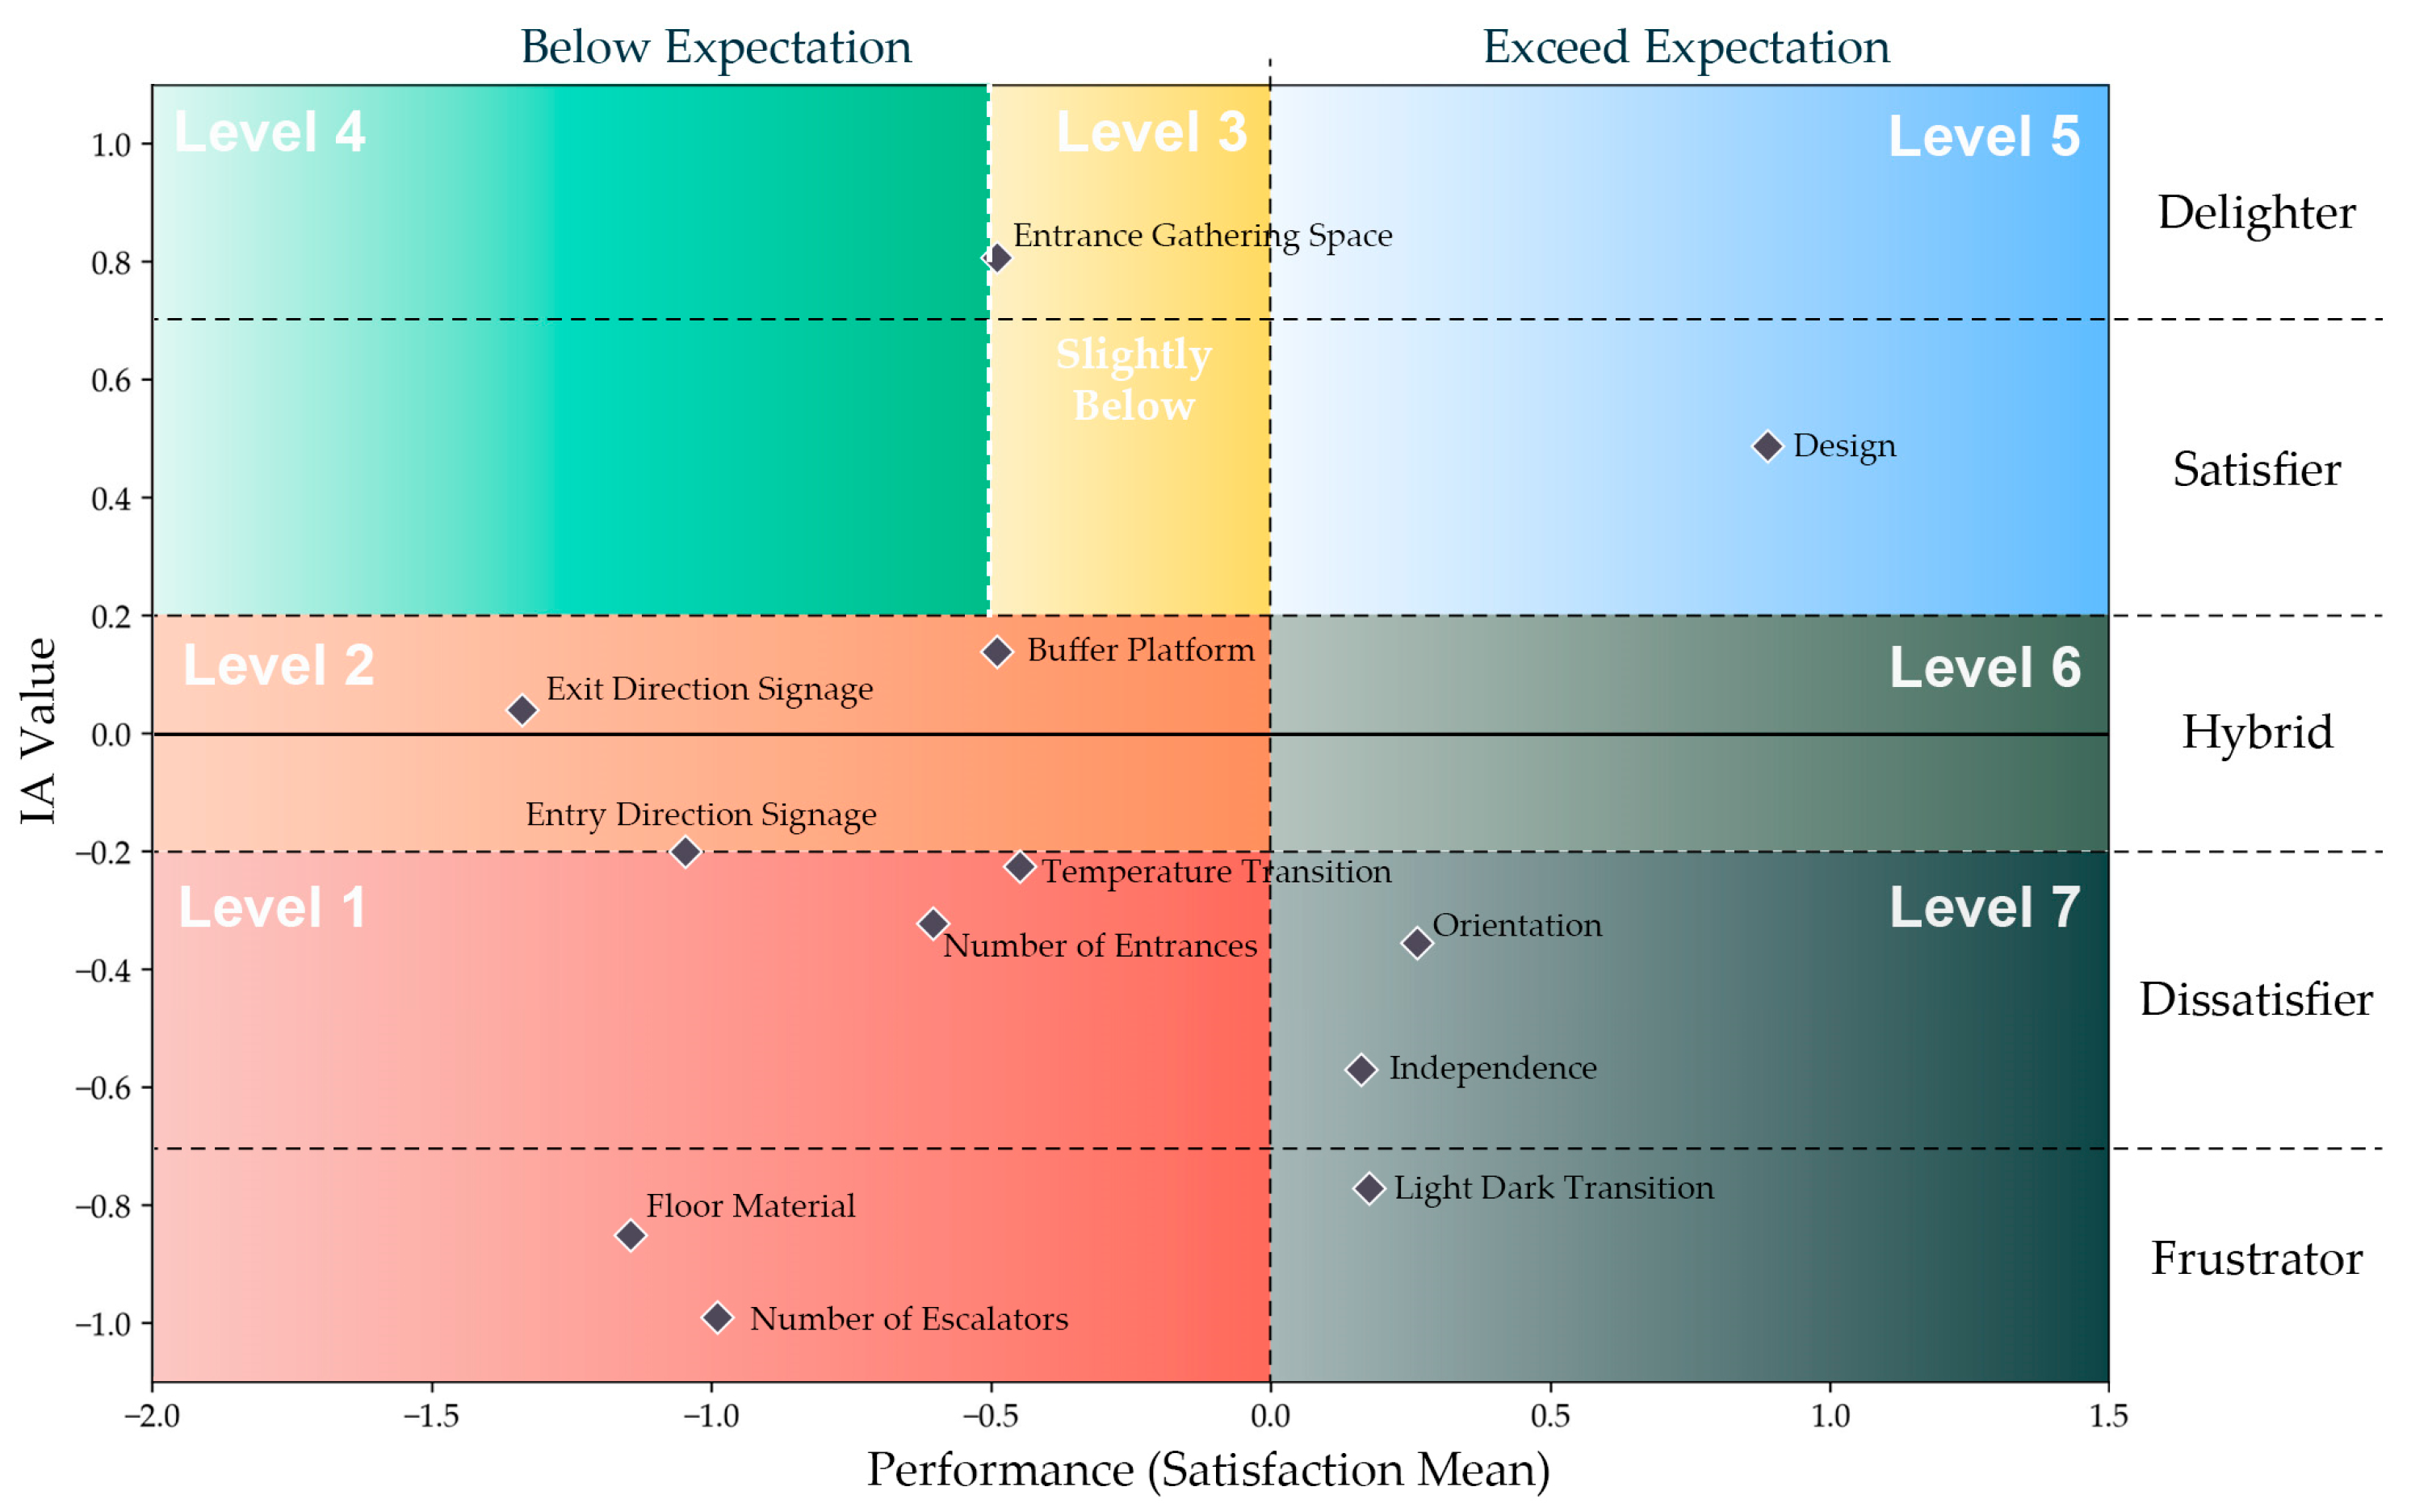
3.3. Asymmetric Impact of Attributes and AIPA Results

When calculating the effect size of penalties and rewards, relying solely on a satisfaction value of 0 as the benchmark for meeting expectations may prove too inflexible and detached from reality. In practical situations, it is rare to observe an exact match between preferences and perceptions. Therefore, this study redefines the scenario of meeting expectations with a broader satisfaction range of −1 to 1. This adjustment recognizes that minor differences between preference and perception are both normal and within acceptable limits. To provide a more detailed understanding, satisfaction values smaller than −1 (ranging from −6 to −2) are indicative of scenarios falling below expectations. On the other hand, scores greater than 1 (from 2 to 6) are interpreted as exceeding expectations, highlighting situations where perceived attributes significantly outshine the desired standards.
The predicted value of overall passenger satisfaction under three distinct scenarios for each attribute is estimated using the GBDT model. When an attribute falls below expectations, the predicted satisfaction level is denoted as “PSb”. For scenarios where the attribute meets expectations, the corresponding predicted satisfaction is labeled “PSm”. Lastly, when an attribute exceeds expectations, the predicted satisfaction level is referred to as “PSe”.
The penalty index (PI) quantifies the decrease in the predicted overall satisfaction when an attribute’s performance drops from “meeting expectation” to “below expectation,” while the reward index (RI) measures the increase in overall satisfaction when an attribute’s performance improves from “meeting expectation” to “exceeding expectation”. These indices collectively assess the impact of performance relative to expectations on overall satisfaction. For each attribute, PI and RI were combined to determine its total potential effect on overall satisfaction, termed as the range of impact on overall satisfaction (RIOS). Additionally, the asymmetry in each attribute’s impact (impact asymmetry, IA) is derived by evaluating its potential to generate dissatisfaction (dissatisfaction-generating potential, DGP) and its ability to generate satisfaction (satisfaction-generating potential, SGP), using the following equations.
P I i = P S b i P S m i ,
R I i = P S e i P S m i ,
D G P i = P I i / R I O S i ,
S G P i = R I i / R I O S i ,
I A i = S G P i D G P i .
In accordance with the classification thresholds established in prior research [16,17], attributes are categorized based on their IA values into distinct groups: Frustrators are those with an IA value less than −0.7. Dissatisfiers are defined by IA values ranging from −0.7 (inclusive) to just below −0.2. Hybrid attributes have IA values that fall between −0.2 and 0.2, inclusive. Satisfiers are characterized by IA values greater than 0.2 but equal to or less than 0.7. Finally, attributes are considered delighters if their IA value is greater than 0.7.
Table 5 illustrates the factor classification of the key attributes of subway entrances for Harbin and Shenyang.
An overview of the factor structures reveals a predominance of nonlinear relationships between subway entrance attributes and passenger satisfaction. In this context, only three attributes in Harbin and two in Shenyang demonstrate linear associations with passenger satisfaction. Predominantly, the key attributes identified are categorized as either frustrators or dissatisfiers. Specifically, in Harbin, out of 14 significant attributes, five are classified as frustrators and four as dissatisfiers. In contrast, in Shenyang, among 12 important attributes, three are identified as frustrators and five as dissatisfiers. The occurrence of delighters and satisfiers is notably infrequent in both cities, with each city presenting only one delighter and one satisfier.
For a comprehensive visual guide to attribute prioritization, AIPA matrices for Harbin and Shenyang were developed, as depicted in Figure 7 and Figure 8, respectively. Within an AIPA matrix, the horizontal axis represents performance, while the vertical axis indicates the IA values. The positioning of attributes on these matrices was determined based on their average performance levels, calculated here as the mean satisfaction derived from the difference between perceived and preferred levels, as well as their IA values. A performance value of zero serves as a reference point to divide the matrix into zones of low and high performance. Utilizing these matrices enables the formulation of targeted improvement strategies for subway entrances, tailored to the asymmetric impact types and performance of each attribute.
The AIPA matrices were color-coded to clearly distinguish different levels of improvement priority for subway station entrance attributes. This color-coding facilitated a more intuitive understanding of which attributes require urgent attention versus those that are less critical.
Highest Priority (Level 1): frustrators and dissatisfiers that perform below expectations are assigned the highest priority. Their inadequacy directly contributes to passenger dissatisfaction, making their improvement crucial.
High Priority (Level 2): hybrid factors with low performance also demand prompt enhancement. These factors, characterized by linear associations with satisfaction, similarly lead to dissatisfaction when not adequately met.
Moderate Priority (Level 3): attributes classified as delighters and satisfiers, when performing slightly below expectations (as indicated in the yellow zones of Figure 7 and Figure 8), present opportunities for relatively simple enhancements that can significantly boost satisfaction.
Elevated Priority (Level 4): for delighters and satisfiers that are markedly below expectations, more substantial improvement efforts are needed. Elevating these attributes to meet or exceed expectations can have a profound positive impact on passenger satisfaction.
Conversely, the approach to attributes that exceed expectations is more nuanced:
Lower Priority (Level 5): when delighters and satisfiers exceed expectations, they are positioned at a lower priority, but are still important due to their asymmetric impact on satisfaction.
Even Lower Priority (Level 6): hybrid factors exceeding expectations are given slightly lower priority compared to delighters/satisfiers. This is due to potential diminishing returns from their linear impact.
Lowest Priority (Level 7): frustrators and dissatisfiers that exceed expectations are deemed the lowest priority. While their adequacy is important, they do not inherently generate satisfaction if met.
The results depicted in Table 6 articulate the prioritization of improvement areas for subway entrances in Harbin and Shenyang, which are divided into three main categories based on the urgency of need and potential impact on passenger satisfaction.
In the Immediate Need for Improvement category, Harbin prioritizes nine attributes across the first and second levels, with exit direction signage (10.5%) leading the list, emphasizing the critical need for clear navigation. Essential attributes for comfort and safety, like floor material and stair step height, follow suit. Safety measures, number of escalators, and stair tread area size underscore the need for secure and convenient transit, while light dark transition addresses lighting quality. Portal size and buffer platform are also key, highlighting the value of space management. Shenyang similarly places importance on floor material and access points, such as escalators and entrances, with temperature Transition also recognized for comfort. Exit and entry direction signage, along with buffer platform, are significant for navigation and space efficiency.
For the Potential for Enhanced Satisfaction category, Harbin sees room for improvement in entrance gathering space and design, which occupy the fourth and fifth priority levels, and the sixth-level attribute independence, suggesting enhancements could streamline passenger flow. Shenyang’s focus is on entrance gathering space for communal utility and design for aesthetic function, indicating potential for a more pleasant transit experience.
The No Need for Improvement category indicates Harbin and Shenyang have attributes like orientation and independence that meet satisfaction criteria, signaling that current directional clarity and architectural integration are sufficient. Shenyang’s light dark transition, while important, requires no immediate action, pointing to satisfactory lighting. This suggests that the existing design and spatial configuration of subway stations are well aligned with passenger preferences.

4. Discussion

Subway station entrances are vital connectors between urban environments and underground transit systems, particularly in cities with cold climates. These entrances are more than just access points; they play a critical role in defining the commuter experience, especially under harsh winter conditions. Designing these entrances requires a specialized approach to meet user needs, promote safety and comfort, and encourage sustainable travel in cold environments. This study emphasizes the importance of these entrances in cold climates, where their design and functionality significantly affect the overall quality of the urban transit experience. This research delves into how the attributes of subway station entrances affect passenger satisfaction. By examining key factors and their impact on commuter contentment, the study highlights the elements that are most influential in enhancing the travel experience. The comparative analysis of Harbin and Shenyang—two winter cities in China—provides insights into prioritizing improvements in similar cold climate regions. This perspective is crucial for understanding commuter preferences and needs in cold weather, guiding the optimization of subway station entrance designs to boost passenger satisfaction.
In the context of limited resources, prioritizing the enhancement of attributes to maximize impact is essential. Previous studies have utilized widely recognized methodologies like importance-performance analysis (IPA), the three-factor theory, and impact-asymmetry analysis (IAA) to prioritize improvements. While these methods provide a structured framework for evaluating the significance of different attributes and their impact on satisfaction, they are not without limitations, such as multicollinearity in regression analyses. Traditional regression analysis, commonly employed in such studies, often struggles with issues of multicollinearity where independent variables are highly correlated. This correlation can distort the true effect of each variable on the dependent variable, leading to unreliable coefficient estimates. Additionally, linear regression models may not adequately capture the nonlinear relationships and interactive effects between various attributes of subway entrances and passenger satisfaction. To address these challenges, some scholars have advocated the use of gradient-boosting decision trees (GBDT) in conjunction with IAA [16,17]. Our research adopts this innovative approach, employing GBDT to determine the relative importance of subway station entrance attributes. This method effectively manages complex relationships between variables and is particularly adept at resolving issues of multicollinearity. GBDT, being a nonlinear model, can handle complex and nonlinear interactions between variables more effectively than linear regression models. It also offers better predictive accuracy and is robust against overfitting, making it more suitable for our study where the goal is to understand the intricate dynamics influencing passenger satisfaction. Building upon this foundation, our study further integrates GBDT with asymmetric impact-performance analysis (AIPA). By employing the AIPA matrix, we enhance our ability to make informed priority judgments. This integrated approach offers a more intuitive and visually accessible method for assessing attribute performance, taking into account both the type of attribute and its current performance status.
Nevertheless, it is crucial to address the limitations and considerations related to the interpretation of these findings before making any policy implications. Firstly, while the attribute selection for this study was grounded in the extensive literature and informed by a focus group, it may not fully capture the complete spectrum of factors influencing passenger satisfaction. This includes the dimensions of passenger flows and station capacity, which, though crucial in the functional efficacy of subway station entrances, were not explicitly incorporated as variables in our analysis. These aspects are integral to understanding the dynamics of passenger movement and the resulting impact on user experience, especially in relation to the varying volume and capacity demands in subway systems [58]. Despite this limitation, the GBDT models for Harbin and Shenyang demonstrated significant explanatory power with R2 values of 0.6944 and 0.8133, respectively, suggesting that the selected attributes can explain a considerable portion of the variance in predicting passenger satisfaction. Regarding the priority levels detected in the AIPA matrices, it is evident that frustrators and dissatisfiers performing below expectations, as well as hybrid factors with low performance, should be accorded the highest priority for improvement [16,42]. On the other hand, for attributes like delighters and satisfiers markedly below expectations or exceeding expectations and hybrid factors exceeding expectations, it is challenging to ascertain their exact rank in priority levels. The rankings provided in this study should be viewed as suggestive rather than definitive. Finally, it is important to consider the potential bias in localizations. Although the study compared two winter cities with differing subway entrance design characters, the factor classification and priority results may vary in other regions. The findings specific to Harbin and Shenyang may not be directly applicable to other urban environments with different climatic conditions or cultural contexts.
In selecting the key features for our study, we employed a dual-criteria approach, integrating both mean decrease in impurity (MDI) and permutation importance. This decision was informed by the limitations observed in previous studies that relied solely on MDI for ranking the contribution of features. While MDI is useful for assessing an independent variable’s contribution in reducing prediction error, it is not always reliable, as it can be biased towards variables with more categories or higher cardinality. This bias potentially skews the true importance of features, leading to misleading conclusions about their impact on model performance. To mitigate these limitations, we incorporated permutation importance alongside MDI. Permutation importance evaluates the decrease in model performance when the values of a feature are randomly shuffled, thus providing a direct reflection of its impact on prediction accuracy. This method also accounts for interactions between features, offering a more holistic understanding of their importance. By combining MDI with permutation importance, we aimed to achieve a more balanced and accurate assessment of feature significance. However, this methodology is not without its limitations. One such limitation arises from the benchmarks set for selecting variables: a minimum MDI value of 0.01 and a mean permutation importance above 0.01. While these thresholds were established to focus on variables with a substantial impact on the model’s predictive power, they might inadvertently exclude variables with lower, yet still potentially meaningful, impacts. Features with permutation importance means over 0, though falling below our set benchmark, might still contribute to passenger satisfaction in more subtle ways. This limitation highlights the challenge in setting precise benchmarks in feature selection—a balancing act between focusing on the most influential variables and acknowledging the potential contributions of less prominent ones.
The study reveals that most key attributes of subway station entrances, such as spatial configuration, spatial legibility, functional convenience, and transitional aspects, impact passenger satisfaction asymmetrically. This asymmetry is particularly pronounced in cold climate zones like Harbin and Shenyang. A significant finding is that many of the key attributes impacting satisfaction are either frustrators or dissatisfiers. This implies that in cold climate zones, these attributes, which often relate to basic needs and essential features of subway entrances, play a crucial role in shaping passengers’ travel experiences. The need for well-designed and functionally efficient entrances becomes even more critical in these harsher climates to ensure commuter satisfaction.
The study observes similarities and differences in how attributes are classified in Harbin and Shenyang. Attributes such as floor material, orientation, buffer platform, and the number of escalators are classified similarly in both cities, indicating their general importance across winter cities. Some attributes, though classified into different but similar categories in the two cities, show similar impact patterns. For instance, design is categorized as a delighter in Harbin and a satisfier in Shenyang. In both cases, these attributes generate satisfaction when present and do not necessarily cause dissatisfaction when absent. Similar patterns are observed for the number of entrances, entrance gathering space, and light–dark transition. The slight differences in classification between the two cities might be attributable to variances in weather conditions or demographic factors. Notably, there are distinct differences in the classification of certain attributes. For example, exit direction signage is a frustrator in Harbin, meaning its absence could lead to dissatisfaction, whereas in Shenyang, it is a hybrid factor, indicating a linear association. This difference could be explored further in the context of urban morphology and passengers’ navigation preferences. Independence is another attribute with varying classifications; it is a hybrid factor in Harbin and a dissatisfier in Shenyang. This divergence might be influenced by the harsher winters in Harbin, where an independently built subway entrance, offering flexibility and visibility, is more critical. In Shenyang, where the winters are milder, the architectural integration of entrances with adjacent buildings may not pose as much of a challenge, and thus, its absence as an independent structure might not be as significantly dissatisfying.
Analyzing the priorities in Harbin and Shenyang reveals several key insights into urban development and design, particularly for subway station entrances in winter cities. In both Harbin and Shenyang, the prioritization of floor material as a first priority underscores the critical importance of anti-slip and safety features during winter. This emphasis reflects a heightened concern for preventing accidents and ensuring passenger safety in icy and slippery conditions, which are common in cold climates. Similarly, the number of escalators being a top priority in both cities highlights the focus on efficiency and convenience. Another significant finding is the emphasis on exit direction signage. In Harbin, this feature is the highest priority, while in Shenyang, it is a second priority but still an immediate need for improvement. This prioritization signals the importance of clear and efficient navigation within subway stations, which is crucial for enhancing the commuter experience. However, beyond these common features, Harbin and Shenyang have varied needs for immediate improvement, with Harbin showing a broader range of attributes requiring attention than Shenyang. This variation underscores the need for city-specific strategies in urban planning and design, especially in adapting to the unique challenges and requirements of each urban environment.
In terms of design, the study categorizes it as a delighter in Harbin and a satisfier in Shenyang, both with considerable relative importance. Despite being a lower priority in the study, this is mainly due to the already satisfactory performance of design aspects in these cities. Enhancing design in cities where it is lacking can significantly align with people’s aesthetic needs and contribute greatly to boosting passenger satisfaction. The architectural and aesthetic characteristics of subway station entrances play a pivotal role in creating an inviting and visually appealing transit environment, which is an essential factor in enhancing the overall attractiveness of the public transit system.
Finally, the study identifies certain features under the No Need for Improvement category, despite their high relative importance. These attributes, categorized as frustrators or dissatisfiers exceeding expectations, indicate that they already meet or surpass passenger satisfaction criteria in Harbin and Shenyang. However, this does not imply a universal applicability of these findings. In other cities, where these features might not meet expectations, they should be prioritized for improvement.
Furthermore, when extending our research beyond the specific contexts of Harbin and Shenyang, it becomes imperative to consider the broader applicability of our findings. In assessing the transferability of our results to other winter cities with varied cultural backgrounds, the role of cultural nuances in urban design cannot be overstated. While environmental challenges posed by cold climates might bear similarities, cultural factors can exert a significant influence on the prioritization and design of subway entrance attributes. It is, therefore, essential for urban planners to adapt the insights garnered from our study in a manner that aligns with the local practices and societal norms of different cities. This approach ensures that the proposed solutions are not only effective in tackling climate-related challenges but also resonate deeply with the unique cultural fabric of each urban environment. In summary, while our findings offer a substantial framework for enhancing the commuter experience in winter cities, the practical application of these insights necessitates a careful adaptation to the cultural diversity and specific requirements of varied urban settings. This aspect of our study paves the way for future research endeavors aimed at exploring the intricate interplay between environmental design and cultural context, thereby contributing to the development of more inclusive and culturally attuned urban planning strategies.

5. Conclusions

Utilizing data from the winter cities of Harbin and Shenyang in China, this study provides an insightful analysis into the influence of subway station entrance attributes on passenger satisfaction. By meticulously examining key factors and their impact, the research brings to light those elements most critical in augmenting the travel experience. A comparative analysis between Harbin and Shenyang yields valuable insights for prioritizing improvements in similar cold climate regions.
In addressing the common issue of multicollinearity in regression analyses found in previous studies, this research innovatively integrates gradient-boosting decision trees (GBDT) with asymmetric impact-performance analysis (AIPA). The GBDT model effectively determines the relative importance of subway station entrance attributes, while the AIPA matrix aids in making informed prioritization decisions. This integrated approach offers a more intuitive and visually accessible method for assessing the performance of various attributes.
The study’s rigorous methodology led to the identification of pivotal independent variables through the lens of MDI-based feature importance and permutation importance. In Harbin, 16 independent variables emerged as key influencers, with 14 directly related to subway entrance attributes. Shenyang presented a similar pattern, with 17 variables identified, 12 of which pertain to subway entrance characteristics.
A significant revelation of the study is the predominance of nonlinear relationships between subway entrance attributes and passenger satisfaction. In both cities, the majority of key attributes fall into the categories of either frustrators or dissatisfiers, with the occurrence of delighters and satisfiers being notably scarce—each city featuring only one attribute in these positive categories.
The analysis, supported by AIPA matrices, identified 10 attributes in Harbin and 7 in Shenyang that require immediate improvement. Notably, floor material, the number of escalators, and exit direction signage emerged as common critical needs in both cities, indicating shared priorities in winter urban settings. The study also delineates attributes with potential for enhanced satisfaction and those that currently meet the required standards of improvement.
In conclusion, the findings of this study are instrumental for urban designers and city managers in making strategic decisions for urban development. The insights garnered significantly contribute to enhancing the overall commuter experience in winter cities, emphasizing the need for tailored solutions that address specific urban challenges and preferences in cold climates.

Supplementary Materials

A comprehensive explanation of the core principles and the detailed algorithm of GBDT is available online. For an in-depth understanding, please refer to Video S1: https://www.youtube.com/watch?v=3CC4N4z3GJc (23 December 2023); Video S2: https://www.youtube.com/watch?v=2xudPOBz-vs (23 December 2023); and Document S1: https://scikit-learn.org/stable/modules/generated/sklearn.ensemble.GradientBoostingRegressor.html (23 December 2023).

Author Contributions

Conceptualization, X.J.; methodology, X.J.; software, X.J. and Y.D.; validation, X.J. and Q.L.; formal analysis, X.J., Y.D. and Q.L.; investigation, X.J. and Y.D.; resources, X.J., Y.D. and Q.L.; data curation, Y.D.; writing—original draft preparation, X.J.; writing—review and editing, Y.D. and Q.L.; visualization, X.J. and Y.D.; project administration, X.J.; funding acquisition, X.J. All authors have read and agreed to the published version of the manuscript.

Funding

This research was funded by the National Natural Science Foundation of China (No. 52208046) and the Fundamental Research Funds for the Central Universities (No. N2211003 and No. N2211002).

Data Availability Statement

The data presented in this study are available from the authors upon reasonable request. The data are not publicly available due to privacy and ethical considerations related to participant data protection, as it includes personal responses gathered from questionnaires.

Acknowledgments

The authors would like to thank Jason Cao of the University of Minnesota for his enlightenment on the original ideas of the research. The authors appreciate the anonymous reviewers for their valuable comments and suggestions.

Conflicts of Interest

The authors declare no conflicts of interest.

Appendix A. The Algorithm of Gradient-Boosting Decision Trees

The gradient-boosting decision trees (GBDT) model involves constructing decision trees. GBDT classifies observations using decision trees at various split points (refer to Figure A1), employing the mean response within a leaf for prediction.
Figure A1. An example of the decision tree.
Buildings 14 00101 g0a1
The algorithm of GBDT constructs a robust predictive model by iteratively adding decision trees. Each subsequent tree in the sequence aims to correct the residual errors of its predecessors, guided by the gradient of a designated loss function. The GBDT algorithm’s process for regression tasks can be summarized as follows.
Input: data x i , y i = 1 n and a differentiable loss function L y i , F x .
Step 1: initialize model with a constant value:
F 0 x = argmin γ i = 1 n L y i , γ ,
where y i represents the observed values and γ represents the predicted values.
Step 2: form m = 1 to M (m refers to the number of an individual tree):
(A) Compute:
r i m = L y i , F x i F x i F x = F m 1 x for   i = 1 , 2 , , n ,
where r i m represents the pseudo residual.
(B) Fit a regression tree to the rim values and create terminal regions Rjm, for j = 1, 2,…, Jm.
(C) For j = 1, 2,…, Jm, compute:
γ j m = argmin γ x i R i j L y i , F m 1 x i + γ .
(D) Update:
F m x = F m 1 x + ϑ j = 1 J m γ j m I ( x R j m ) ,
where ϑ refers to the learning rate.
Step 3: output FM(x).

Appendix B. Questionnaire Description

The questionnaire employed in this study was designed to gather data on the attributes of subway station entrances that affect passenger satisfaction in the winter cities of Harbin and Shenyang. It consisted of four sections: demographic information, preference ratings, perception ratings, and passenger satisfaction. To maintain conciseness, the matrix containing the attributes and rating options is not presented here. Instead, readers are referred to Table 1 for the detailed list of the 21 attributes. The specific questions included in each section of the questionnaire are as follows:
Section 1: Demographic Information
Participants were asked to provide personal demographic information to understand the context of their responses better.
  • Gender: “Please indicate your gender”. (Options: Female, Male)
  • Age: “Please select your age group”. (Options: 18–25, 26–30, 31–40, 41–50, Over 50)
  • Monthly Income (in CNY): “Please select your monthly income range”. (Options: <2000, 2000–5000, 5001–8000, 8001–10,000, >10,000)
  • Subway Usage Time: “When do you typically use the subway?” (Options: Peak Hours, Day, Night, Not Fixed)
  • Subway Usage Frequency: “How frequently do you use the subway?” (Options: Daily, Frequent, Weekly, Sporadic) Note: ‘Frequent’ is defined as 3–5 days a week, and ‘Weekly’ as 1–2 days a week.
  • Peak Subway Usage Season: “During which season do you use the subway the most?” (Options: Summer, Winter, Spring/Autumn, No Difference)
Section 2: Preference Ratings
This section was designed to gauge the respondents’ preferences for different subway entrance attributes.
  • “Please rate the importance of the following subway entrance attributes on a scale of 1 to 7, where 1 is ‘not at all important’ and 7 is ‘extremely important’”. (A list of 21 attributes was provided for rating.)
Section 3: Perception Ratings
Respondents evaluated the presence and quality of the same subway entrance attributes they rated in the Preference section.
  • “On a scale of 1 to 7, where 1 is ‘extremely not true’ and 7 is ‘entirely true’, how accurately do the following statements describe the subway entrance you most frequently use?” (Statements related to the 21 attributes were provided for assessment.)
Section 4: Passenger Satisfaction
The final section captured the respondents’ overall satisfaction with the subway entrance they most frequently used.
  • “On a scale of 1 to 7, where 1 is ‘strongly dissatisfied’ and 7 is ‘strongly satisfied’, how would you rate your satisfaction with the subway entrance you most frequently use?”
The survey was conducted using an online questionnaire design platform hosted by wjx.cn, which facilitated ease of access for participants. Participation was entirely voluntary, and the survey was designed to be self-administered. The online platform was chosen for its robust privacy features, which prioritized user privacy and were intended to encourage candidness in responses.

References

  1. Mao, R.; Bao, Y.; Duan, H.; Liu, G. Global urban subway development, construction material stocks, and embodied carbon emissions. Humanit. Soc. Sci. Commun. 2021, 8, 83. [Google Scholar] [CrossRef]
  2. Hoque, I.; Rohatgi, S. Assessment of Urban Morphology Through Local Climate Zone Classification and Detection of the Changing Building States of Siliguri Municipal Corporation and Its Surrounding Area, West Bengal. J. Geogr. Res. 2022, 5, 28–43. [Google Scholar] [CrossRef]
  3. Yang, X.; Chen, Z.; Cai, H.; Ma, L. A Framework for Assessment of the Influence of China’s Urban Underground Space Developments on the Urban Microclimate. Sustainability 2014, 6, 8536–8566. [Google Scholar] [CrossRef]
  4. Cornaro, A.; Admiraal, H. Changing world–major challenges: The need for underground space planning. In Proceedings of the 48th ISOCARP Congress, Perm, Russia, 10–13 September 2012; International Society of City and Regional Planners: Hague, The Netherlands, 2012. [Google Scholar]
  5. Li, Z.; Lin, X.; Han, X.; Lu, X.; Zhao, H. Landscape Efficiency Assessment of Urban Subway Station Entrance Based on Structural Equation Model: Case Study of Main Urban Area of Nanjing. Buildings 2022, 12, 294. [Google Scholar] [CrossRef]
  6. Li, S.; Yang, J.; Qin, P.; Chonabayashi, S. Wheels of Fortune: Subway Expansion and Property Values in Beijing. J. Reg. Sci. 2016, 56, 792–813. [Google Scholar] [CrossRef]
  7. Seyfried, A.; Passon, O.; Steffen, B.; Boltes, M.; Rupprecht, T.; Klingsch, W. New Insights Into Pedestrian Flow Through Bottlenecks. Transport. Sci. 2009, 43, 395–406. [Google Scholar] [CrossRef]
  8. Leng, H.; Zhao, J.; Yuan, Q.; Zhao, J. Zooming Into Climatic Conditions to Understand Cities: A Review and Perspective on Studies of Chinese Winter Cities. Trans. Urban Data Sci. Technol. 2023, 2, 123–139. [Google Scholar] [CrossRef]
  9. Dursun, D.; Yavas, M. Climate-Sensitive Urban Design in Cold Climate Zone: The City of Erzurum, Turkey. Int. Rev. Spat. Plan. Sustain. Dev. 2015, 3, 17–38. [Google Scholar] [CrossRef]
  10. Watanabe, N.; Setoguchi, T.; Sato, K.; Tsutsumi, T. New City Block Design Approaches Incorporating Environmental Assessment for Downtown Districts in Cities With Severe Winter Climates. J. Asian Archit. Build. Eng. 2016, 15, 455–462. [Google Scholar] [CrossRef]
  11. Ebrahimabadi, S. Outdoor Comfort in Cold Climates: Integrating Microclimate Factors in Urban Design; Luleå tekniska universitet: Luleå, Sweden, 2015. [Google Scholar]
  12. Iseki, H.; Taylor, B.D. Style Versus Service? An Analysis of User Perceptions of Transit Stops and Stations. J. Public Transp. 2010, 13, 23–48. [Google Scholar] [CrossRef]
  13. Yong Qi, S.; Dilum, D.; Fazilatulaili, A.; Thusal, B. Passenger satisfaction towards metro infrastructures, facilities and services. Transp. Res. Procedia 2020, 48, 3980–3995. [Google Scholar] [CrossRef]
  14. Sahar, T.; Sajjad, S. Evaluation of passenger satisfaction with service quality: A consecutive method applied to the airline industry. J. Air Transp. Manag. 2020, 83, 101764. [Google Scholar] [CrossRef]
  15. Ding, C.; Cao, X.; Næss, P. Applying gradient boosting decision trees to examine non-linear effects of the built environment on driving distance in Oslo. Transp. Res. A-POL 2018, 110, 107–117. [Google Scholar] [CrossRef]
  16. Cao, J.; Hao, Z.; Yang, J.; Yin, J.; Huang, X. Prioritizing neighborhood attributes to enhance neighborhood satisfaction: An impact asymmetry analysis. Cities 2020, 105, 102854. [Google Scholar] [CrossRef]
  17. Dong, W.; Cao, X.; Wu, X.; Dong, Y. Examining pedestrian satisfaction in gated and open communities: An integration of gradient boosting decision trees and impact-asymmetry analysis. Landsc. Urban Plan. 2019, 185, 246–257. [Google Scholar] [CrossRef]
  18. Wang, C.; Qiu, Z.; Pan, R.; Wang, X.; Yan, Y. Exploring the Spatial Variation of Access/Egress Distances of Subway Stations Using Mobile Phone Positioning Data in Chengdu, China. J. Adv. Transp. 2023, 2023, 8008667. [Google Scholar] [CrossRef]
  19. Liu, Y.; Hu, Y.; Xiao, Y.; Chen, J.; Huang, H. Effects of different types of entrances on natural ventilation in a subway station. Tunn. Undergr. Space Technol. 2020, 105, 103578. [Google Scholar] [CrossRef]
  20. Zhou, J.; Koutsopoulos, H.N.; Saidi, S. Evaluation of Subway Bottleneck Mitigation Strategies Using Microscopic, Agent-Based Simulation. Transp. Res. Rec. 2020, 2674, 649–661. [Google Scholar] [CrossRef]
  21. Tu, Q.Z.; Zhang, Z.; Zhang, Q. Directional Signage Location Optimization of Subway Station Based on Big Data. IEEE Access 2020, 8, 12354–12363. [Google Scholar] [CrossRef]
  22. Zheng, M.-C. Empirical Study on Congested Subway Transfer Traffic Patterns. Int. J. Transp. Dev. Integr. 2018, 2, 258–270. [Google Scholar] [CrossRef]
  23. Luo, W.; Sun, L.; Yao, L.; Gong, Q.; Rong, J. Experimental Study for Optimizing Pedestrian Flows at Bottlenecks of Subway Stations. Promet—TrafficTransp. 2018, 30, 525–538. [Google Scholar] [CrossRef]
  24. Li, Q.; Ji, C.; Jia, L.; Qin, Y. Effect of Height on Pedestrian Route Choice Between Stairs and Escalator. Discret. Dyn. Nat. Soc. 2014, 2014, 965305. [Google Scholar] [CrossRef]
  25. Novak, A.C.; Komisar, V.; Maki, B.E.; Fernie, G. Age-Related Differences in Dynamic Balance Control During Stair Descent and Effect of Varying Step Geometry. Appl. Ergon. 2016, 52, 275–284. [Google Scholar] [CrossRef] [PubMed]
  26. Edwards, N. Performance-Based Building Codes: A Call for Injury Prevention Indicators That Bridge Health and Building Sectors. Inj. Prev. 2008, 14, 329–332. [Google Scholar] [CrossRef] [PubMed]
  27. Yang, S.; Jin, J.; Lu, X. Research on Spatial Arrangement of Metro Station Floor Facilities Based on Pathfinder. Am. J. Civ. Eng. 2019, 7, 147–151. [Google Scholar] [CrossRef]
  28. Nouri, F.; Khorasani-Zavareh, D.; Mohammadi, R. Factor’s Affecting Safe Emergency Evacuation of Subways in Iran: Findings of a Qualitative Study. J. Inj. Violence Res 2020, 117–134. [Google Scholar]
  29. Shen, C.-W.; Mao, M.-N.; Hsu, Y.-T.; Miralinaghi, M. Research on Features of Pedestrians Using Smartphones at Transit Stations Based on Social Force Model. Transp. Res. Rec. 2022, 2676, 708–721. [Google Scholar] [CrossRef]
  30. Pu, Y.; Srikukenthiran, S.; Morrow, E.; Shalaby, A.; Klumpenhouwer, W. Capacity Analysis of a Passenger Rail Hub Using Integrated Railway and Pedestrian Simulation. Urban Rail Transit 2022, 8, 1–15. [Google Scholar] [CrossRef]
  31. Xue, H.; Jia, L.; Guo, J. Adaptive Multilevel Collaborative Passenger Flow Control in Peak Hours for a Subway Line. Adv. Math. Phys. 2020, 2020, 3862157. [Google Scholar] [CrossRef]
  32. Kabošová, L.; Katunský, D.; Kmeť, S. Wind-Based Parametric Design in the Changing Climate. Appl. Sci. 2020, 10, 8603. [Google Scholar] [CrossRef]
  33. Prior, J.; Connon, I.L.C.; McIntyre, E.; Adams, J.; Capon, A.; Kent, J.; Rissel, C.; Thomas, L.; Thompson, S.; Westcott, H. Built Environment Interventions for Human and Planetary Health: Integrating Health in Climate Change Adaptation and Mitigation. Public Health Res. Pract. 2018, 28, e2841831. [Google Scholar] [CrossRef] [PubMed]
  34. Valdez, B.; Schorr, M.; Quintero, M.; García, R.B.; Rosas, N. Effect of Climate Change on Durability of Engineering Materials in Hydraulic Infrastructure: An Overview. Corros. Eng. Sci. Technol. 2010, 45, 34–41. [Google Scholar] [CrossRef]
  35. Larsson, A.; Berggård, G.; Rosander, P.; Gard, G. Gait Speed With Anti-Slip Devices on Icy Pedestrian Crossings Relate to Perceived Fall-Risk and Balance. Int. J. Environ. Res. Public Health 2019, 16, 2451. [Google Scholar] [CrossRef] [PubMed]
  36. Aultman-Hall, L.; Lane, D.; Lambert, R.R. Assessing Impact of Weather and Season on Pedestrian Traffic Volumes. Transp. Res. Rec. 2009, 2140, 35–43. [Google Scholar] [CrossRef]
  37. Li, G.; Han, C.; Shen, J.; Wang, X.; Gu, T.; Yang, Z.; Zhang, L. A Demographic Characteristics-Based Study on the Visual Impact Assessment of the External Form of Entrance Pavilions to the Underground Stations of China’s Subway. Appl. Sci. 2023, 13, 4030. [Google Scholar] [CrossRef]
  38. Lü, Y.; Wang, J.; Bai, X.; Wang, H. Design and Implementation of LED Lighting Intelligent Control System for Expressway Tunnel Entrance Based on Internet of Things and Fuzzy Control. Int. J. Distrib. Sens. Netw. 2020, 16. [Google Scholar] [CrossRef]
  39. Kim, M.; Braatz, R.D.; Kim, J.T. Indoor Air Quality Control for Improving Passenger Health in Subway Platforms Using an Outdoor Air Quality Dependent Ventilation System. Build. Environ. 2015, 92, 407–417. [Google Scholar] [CrossRef]
  40. Lovejoy, K.; Handy, S.; Mokhtarian, P. Neighborhood satisfaction in suburban versus traditional environments: An evaluation of contributing characteristics in eight California neighborhoods. Landsc. Urban Plan. 2010, 97, 37–48. [Google Scholar] [CrossRef]
  41. Cao, X.; Wang, D. Environmental correlates of residential satisfaction: An exploration of mismatched neighborhood characteristics in the Twin Cities. Landsc. Urban Plan. 2016, 150, 26–35. [Google Scholar] [CrossRef]
  42. Albayrak, T.; Caber, M. Prioritisation of the hotel attributes according to their influence on satisfaction: A comparison of two techniques. Tour. Manag. 2015, 46, 43–50. [Google Scholar] [CrossRef]
  43. Arbore, A.; Busacca, B. Rejuvenating importance-performance analysis. J. Serv. Manag. 2011, 22, 409–429. [Google Scholar] [CrossRef]
  44. Matzler, K.; Bailom, F.; Hinterhuber, H.H.; Renzl, B.; Pichler, J. The asymmetric relationship between attribute-level performance and overall customer satisfaction: A reconsideration of the importance–performance analysis. Ind. Mark. Manag. 2004, 33, 271–277. [Google Scholar] [CrossRef]
  45. Matzler, K.; Sauerwein, E. The factor structure of customer satisfaction: An empirical test of the importance grid and the penalty-reward-contrast analysis. Int. J. Serv. Ind. Manag. 2002, 13, 314–332. [Google Scholar] [CrossRef]
  46. Slevitch, L.; Oh, H. Asymmetric relationship between attribute performance and customer satisfaction: A new perspective. Int. J. Hosp. Manag. 2010, 29, 559–569. [Google Scholar] [CrossRef]
  47. Sauerwein, E.; Bailom, F.; Matzler, K.; Hinterhuber, H.H. The Kano Model: How to Delight Your Customers. Available online: https://faculty.kfupm.edu.sa/CEM/bushait/CEM_515-082/kano/kano-model2.pdf (accessed on 28 June 2019).
  48. Johnston, R. The determinants of service quality: Satisfiers and dissatisfiers. Int. J. Serv. Ind. Manage. 1995, 6, 53–71. [Google Scholar] [CrossRef]
  49. Yin, J.; Cao, X.J.; Huang, X.; Cao, X. Applying the IPA–Kano model to examine environmental correlates of residential satisfaction: A case study of Xi’an. Habitat Int. 2016, 53, 461–472. [Google Scholar] [CrossRef]
  50. Lai, I.K.W.; Hitchcock, M. Sources of satisfaction with luxury hotels for new, repeat, and frequent travelers: A PLS impact-asymmetry analysis. Tour. Manag. 2017, 60, 107–129. [Google Scholar] [CrossRef]
  51. Flanagan, J.C. The critical incident technique. Psychol. Bull. 1954, 51, 327. [Google Scholar] [CrossRef]
  52. Vavra, T.G. Improving Your Measurement of Customer Satisfaction: A guide to Creating, Conducting, Analyzing, and Reporting Customer Satisfaction Measurement Programs; ASQ Quality Press: Milwaukee, WI, USA, 1997. [Google Scholar]
  53. Brandt, R.D. A procedure for identifying value-enhancing service components using customer satisfaction survey data. In Add Value to Your Service: The Key to Success; Surprenant, C.F., Ed.; American Marketing Association: Chicago, IL, USA, 1987; pp. 61–65. [Google Scholar]
  54. Caber, M.; Albayrak, T.; Loiacono, E.T. The Classification of Extranet Attributes in Terms of Their Asymmetric Influences on Overall User Satisfaction:An Introduction to Asymmetric Impact-Performance Analysis. J. Travel Res. 2013, 52, 106–116. [Google Scholar] [CrossRef]
  55. Mikulić, J.; Prebežac, D. Prioritizing improvement of service attributes using impact range-performance analysis and impact-asymmetry analysis. Manag. Serv. Qual. 2008, 18, 559–576. [Google Scholar] [CrossRef]
  56. Albayrak, T.; Caber, M. Destination attribute effects on rock climbing tourist satisfaction: An Asymmetric Impact-Performance Analysis. Tour. Geogr. 2016, 18, 280–296. [Google Scholar] [CrossRef]
  57. Ji, X.; Shao, L.; Du, Y. Collaborating with Local Communities to Identify Improvement Priorities for Historic Urban Landscape Based on Residents’ Satisfaction: An Application of Asymmetric Impact-Performance Analysis in Dandong, China. Sustainability 2020, 12, 1463. [Google Scholar] [CrossRef]
  58. Cirianni, F.; Leonardi, G.; Iannò, D. Operating and Integration of Services in Local Public Transport. In New Metropolitan Perspectives; Bevilacqua, C., Calabrò, F., Della Spina, L., Eds.; Smart Innovation, Systems and Technologies; Springer: Cham, Switzerland, 2021; Volume 178, pp. 1523–1531. [Google Scholar] [CrossRef]
Figure 1. Illustration of the typical subway station entrance components.
Buildings 14 00101 g001
Figure 2. Comparison of the enclosure levels of the subway entrance structures in Harbin and Shenyang. (a) Typical subway entrance in Harbin (full closure); (b) typical subway entrance in Shenyang (partial closure).
Buildings 14 00101 g002
Figure 3. Survey locations in Harbin and Shenyang. (a) Harbin. (b) Shenyang.
Buildings 14 00101 g003
Figure 4. Factors of the impact-asymmetry analysis and their influence on satisfaction.
Buildings 14 00101 g004
Figure 5. Comparison of MDI-based importance and permutation importance of independent variables in Harbin. (a) MDI-based importance. (b) Permutation importance.
Buildings 14 00101 g005
Figure 6. Comparison of MDI-based importance and permutation importance of independent variables in Shenyang. (a) MDI-based importance. (b) Permutation importance.
Buildings 14 00101 g006
Figure 7. Factor classification results for Harbin on AIPA matrix.
Buildings 14 00101 g007
Figure 8. Factor classification results for Shenyang on AIPA matrix.
Buildings 14 00101 g008
Table 1. Selected attributes of subway station entrance influencing passenger satisfaction.
DimensionsVariablesAbbr. 1Description
Exterior Spatial
Configuration
Number of
Entrances
NumEntrancesThe total number of entry points that serve both as entrances and exits at a subway station.
DistributionDistributionDescribes the spatial layout and distribution of subway station entrances within the surrounding urban environment.
DesignDesignDetails the architectural and aesthetic characteristics of the subway station entrances, including their form and structural elements.
OrientationOrientationSpecifies the compass direction that subway station entrances face, potentially influencing passenger flow and station accessibility.
Portal SizePortalSizeDefines the dimensions of the entry and exit portals, which can affect passenger flow rates and congestion.
IndependenceIndependenceIndicates whether the subway entrance is an independent structure or is architecturally integrated with adjacent buildings.
Spatial LegibilityEntry Direction SignageEntryDirSignAssesses the presence and effectiveness of signage guiding passengers to the correct entrance pathways.
Exit Direction SignageExitDirSignEvaluates the clarity and positioning of signage directing passengers to the exit routes.
Number of
Escalators
NumEscalatorsEnumerates the escalators available within the subway station for passenger use.
Escalator
Operation
EscalatorOpCategorizes escalators based on the direction of service provided—ascending, descending, or both.
Functional
Convenience
Vertical
Traffic Pattern
VertTrafficPatAssesses the efficiency of pedestrian flow and trajectory design, examining whether there are conflict points or disruptions when passengers choose between stairs and escalators.
Horizontal
Traffic Pattern
HorizTrafficPatAnalyzes the design of movement paths for passengers entering and exiting the station, focusing on avoiding congestion and ensuring conflict-free pedestrian flow.
Stair Area WidthStairWidthMeasures the width of stair areas, which influences the capacity to handle passenger volumes and flow.
Stair Tread
Area Size
StairTreadSzSpecifies the area size of individual stair treads, a factor in both safety and passenger flow efficiency.
Stair Step HeightStairStepHtRecords the variation in height between steps, relevant for ergonomic design and passenger comfort.
Safety MeasuresSafetyMsrsLists and describes additional safety measures in place, such as handrails, lighting, and emergency signage.
Buffer PlatformBufferPlatformMeasures the size of designated buffer areas where passengers can pause or wait, helping to manage flow and reduce congestion.
Floor MaterialFloorMaterialDescribes the anti-slip features of flooring materials used, crucial for safety in high-traffic pedestrian areas.
Transitional Environmental DynamicsEntrance
Gathering Space
EntrGathSpaceQuantifies the size of spaces at subway entrances where passengers may gather, aiding in the management of foot traffic and reducing bottlenecks.
Light and Dark TransitionLightDarkTransExamines the change in lighting between the external environment and the subway station interior, affecting passenger comfort and visibility.
Temperature TransitionTempTransAssesses the difference in temperature between the inside of the subway station and the external environment, with implications for passenger comfort levels.
Notes: 1 variable abbreviations are used during the modeling and analysis phases. Consequently, all plots derived from these processes also utilize these abbreviations for consistency.
Table 2. Sample characteristics.
CharacteristicsSegmentsTotal SampleHarbinShenyang
GenderFemale60.57%64.85%55.91%
Male39.43%35.15%44.09%
Age18–2513.14%17.33%8.60%
26–3042.27%33.66%51.61%
31–4023.97%19.80%28.50%
41–5012.63%18.81%5.91%
Over 507.99%10.40%5.38%
Income 1<20009.54%9.40%9.68%
2000–500046.13%51.49%40.32%
5001–800027.84%26.24%29.57%
8001–10,0006.70%2.97%10.75%
>10,0009.79%9.90%9.68%
Subway Usage Time 2Peak Hours20.36%15.84%25.27%
Day13.66%14.36%12.90%
Night0.52%0.99%0.00%
Not Fixed65.46%68.81%61.83%
Subway Usage
Frequency 3
Daily10.31%7.43%13.44%
Frequent10.31%10.89%9.68%
Weekly17.01%14.85%19.35%
Sporadic62.37%66.83%57.53%
Peak Subway Usage SeasonSummer10.82%12.87%8.60%
Winter15.46%23.76%6.45%
Spring/Autumn2.84%2.48%3.23%
No Difference70.88%60.89%81.72%
Notes: 1 Income here is the respondent’s monthly income in CNY; 2 Peak Hours refer to morning and afternoon rush hours, day to non-peak daylight hours, and night to post-evening hours; 3 Frequent refers to those who use subway 3–5 days a week and Weekly refers to those who use subway 1–2 days a week.
Table 3. Model parameters and performance indicators.
CityLearning
Rate
N_EstimatorsMax_DepthMin_Samples _SplitMin_Samples _LeafR2RMSE
Harbin0.13008280.69440.6284
Shenyang0.052006240.81330.5581
Table 4. The relative importance of key independent variables in predicting passenger satisfaction.
CategoriesVariablesHarbinShenyang
RankMDIPerm 1Perm Std 2RankMDIPermPerm Std
DemographicsIncome--------73.8%0.0350.020
Age45.3%0.0310.02493.6%0.0840.026
Sporadic Rider 3--------103.3%0.0220.009
Daily Rider 3--------122.6%0.0260.012
Summer Rider 4--------161.5%0.0240.017
All-Year Rider 4103%0.0240.016--------
Influential
Attributes 5
Orientation128.4%0.209 0.098142%0.0550.020
ExitDirSign210.5%0.134 0.07256%0.0620.021
FloorMaterial35.9%0.047 0.02929.8%0.1360.065
StairStepHt54.5%0.039 0.031--------
PortalSize63.8%0.032 0.027--------
BufferPlatform73.7%0.048 0.010151.9%0.0260.012
NumEntrances83.3%0.027 0.018132%0.0130.009
SafetyMsrs93.2%0.065 0.019--------
NumEscalators112.9%0.023 0.01246%0.0570.014
StairTreadSz122.5%0.024 0.019--------
Independence131.5%0.034 0.01138.6%0.1970.053
EntrGathSpace141.3%0.073 0.03264.5%0.0260.013
Design151.3%0.037 0.01783.7%0.0670.029
LightDarkTrans161%0.045 0.020125%0.2080.068
EntryDirSign--------113.2%0.0560.017
TempTrans--------171.4%0.0110.007
Other
Attributes
Total of Other
Attributes
--17.9%------11.1%----
Notes: 1 Perm refers to permutation importance mean; 2 Perm Std refers to the standard deviation of the permutation importance; 3 Sporadic Rider and Daily Rider represent the subway usage frequency of the respondents; 4 Summer Rider and All-Year Rider represent the peak subway usage season of the respondents; 5 some variables are represented by abbreviations (refer to Table 1 for their full names).
Table 5. Factor classification of the key subway entrance attributes for Harbin and Shenyang.
Subway Entrance AttributesRankRIOSSGPDGPIAClassificationSat. Mean 1
Harbin
Orientation11.640.170.83−0.65Dissatisfier0.03
Exit Direction Signage21.110.070.93−0.87Frustrator−1.43
Floor Material30.790.001.00−1.00Frustrator−1.81
Stair Step Height41.280.210.79−0.58Dissatisfier−0.86
Portal Size51.370.590.410.18Hybrid−0.12
Buffer Platform61.040.570.430.14Hybrid−0.78
Number of Entrances70.400.070.93−0.86Frustrator0.32
Safety Measures80.600.100.90−0.81Frustrator−1.13
Number of Escalators90.720.120.88−0.77Frustrator−1.59
Stair Tread Area Size101.360.360.64−0.29Dissatisfier−0.96
Independence110.930.580.420.16Hybrid0.18
Entrance Gathering Space120.550.700.300.40Satisfier−1.22
Design130.340.870.130.75Delighter0.66
Light Dark Transition141.320.340.66−0.32Dissatisfier−0.52
Shenyang
Light Dark Transition11.760.110.89−0.77Frustrator0.18
Floor Material21.270.080.92−0.85Frustrator−1.14
Independence31.480.210.79−0.57Dissatisfier0.17
Number of Escalators41.070.001.00−0.99Frustrator−0.98
Exit Direction Signage51.340.520.480.04Hybrid−1.33
Entrance Gathering Space61.230.910.090.81Delighter−0.48
Design70.700.740.260.49Satisfier0.89
Entry Direction Signage81.350.400.60−0.20Dissatisfier−1.04
Number of Entrances90.570.340.66−0.32Dissatisfier−0.60
Orientation101.420.320.68−0.36Dissatisfier0.27
Buffer Platform111.870.570.430.14Hybrid−0.48
Temperature Transition121.760.390.61−0.22Dissatisfier−0.44
Notes: 1 Sat. Mean refers to the mean satisfaction score, calculated as the difference between the perception level and preference level for each attribute.
Table 6. Improvement priorities for subway entrances in Harbin and Shenyang.
Priority LevelsHarbinShenyang
Immediate Need
for Improvement
First PriorityExit Direction Signage (10.5%)
Floor Material (5.9%)
Stair Step Height (4.5%)
Safety Measures (3.2%)
Number of Escalators (2.9%)
Stair Tread Area Size (2.5%)
Independence (1.5%)
Light Dark Transition (1%)
Floor Material (9.8%)
Number of Escalators (6%)
Number of Entrances (2%)
Temperature Transition (1.4%)
Second PriorityPortal Size (3.8%)
Buffer Platform (3.7%)
Exit Direction Signage (6%)
Entry Direction Signage (3.2%)
Buffer Platform (1.9%)
Potential for
Enhanced Satisfaction
Third Priority-- Entrance Gathering Space (4.5%)
Fourth PriorityEntrance Gathering Space (1.3%)--
Fifth PriorityDesign (1.3%)Design (3.7%)
Sixth PriorityIndependence (1.5%)--
No Need
for Improvement
No PriorityOrientation (28.4%)
Number of Entrances (3.3%)
Light Dark Transition (25%)
Independence (8.6%)
Orientation (2%)
Notes: within each priority level, attributes are listed in order of their relative importance (MDI), indicated by the values in parentheses.
Disclaimer/Publisher’s Note: The statements, opinions and data contained in all publications are solely those of the individual author(s) and contributor(s) and not of MDPI and/or the editor(s). MDPI and/or the editor(s) disclaim responsibility for any injury to people or property resulting from any ideas, methods, instructions or products referred to in the content.

