Molecular Mechanisms Underpinning Aggregation in Acidiphilium sp. C61 Isolated from Iron-Rich Pelagic Aggregates


1
Institute of Biodiversity, Friedrich Schiller University Jena, 07743 Jena, Germany
2
The German Centre for Integrative Biodiversity Research (iDiv) Halle-Jena-Leipzig, 04103 Leipzig, Germany
*
Author to whom correspondence should be addressed.
Microorganisms 2020, 8(3), 314; https://doi.org/10.3390/microorganisms8030314
Submission received: 17 December 2019
/
Revised: 21 February 2020
/
Accepted: 23 February 2020
/
Published: 25 February 2020
(This article belongs to the Section Environmental Microbiology)
Abstract
:Iron-rich pelagic aggregates (iron snow) are hot spots for microbial interactions. Using iron snow isolates, we previously demonstrated that the iron-oxidizer Acidithrix sp. C25 triggers Acidiphilium sp. C61 aggregation by producing the infochemical 2-phenethylamine (PEA). Here, we showed slightly enhanced aggregate formation in the presence of PEA on different Acidiphilium spp. but not other iron-snow microorganisms, including Acidocella sp. C78 and Ferrovum sp. PN-J47. Next, we sequenced the Acidiphilium sp. C61 genome to reconstruct its metabolic potential. Pangenome analyses of Acidiphilium spp. genomes revealed the core genome contained 65 gene clusters associated with aggregation, including autoaggregation, motility, and biofilm formation. Screening the Acidiphilium sp. C61 genome revealed the presence of autotransporter, flagellar, and extracellular polymeric substances (EPS) production genes. RNA-seq analyses of Acidiphilium sp. C61 incubations (+/− 10 µM PEA) indicated genes involved in energy production, respiration, and genetic processing were the most upregulated differentially expressed genes in the presence of PEA. Additionally, genes involved in flagellar basal body synthesis were highly upregulated, whereas the expression pattern of biofilm formation-related genes was inconclusive. Our data shows aggregation is a common trait among Acidiphilium spp. and PEA stimulates the central cellular metabolism, potentially advantageous in aggregates rapidly falling through the water column.
1. Introduction
Pelagic aggregates, composed of microorganisms, phytoplankton, feces, detritus, and biominerals, are local hotspots for microbial interaction in nearly all aquatic habitats [1,2,3]. These snow-like aggregates are stabilized by a matrix of extracellular polymeric substances (EPS) and vary in size, ranging from micrometers to centimeters, depending on their residence time in the water column and the trophic state of the ecosystem [1,4,5]. Microbial colonization and coordinated group behavior within these pelagic aggregates are likely regulated by chemical signaling, including quorum sensing signaling molecules [6,7]; however, most chemical mediators involved in interspecies interaction are still unknown.
Iron-rich pelagic aggregates (iron snow), analogous to the more organic-rich marine or freshwater aggregates, are characterized by lower chemical and microbial complexity [5]. Iron snow forms at the redoxcline of stratified iron-rich lakes, where the oxygen-rich epilimnion water meets ferrous iron (Fe2+) of the anoxic hypolimnion [5]. Many of these lakes are acidic due to the inflow of protons in addition to Fe2+ and sulfate (SO42-) from mine tailings [8,9]. Under acidic conditions, Fe2+ is oxidized by microorganisms to ferric iron (Fe3+), from which goethite and schwertmannite form via hydrolysis of Fe3+ cations [10,11]. In lignite mine lakes, these biominerals form the main inorganic component of pelagic aggregates [12,13]. These aggregates are stabilized by the adsorption of other metals, nutrients, and organic matter. Iron snow is an attractive habitat for heterotrophic microorganisms, especially those capable of using Fe3+ as an electron acceptor, such as Acidiphilium species [14]. Together, iron-oxidizing bacteria (FeOB) and iron-reducing bacteria (FeRB) can comprise up to 60% of the total microbial community found in iron snow aggregates [15]. To study the interactions between these iron-cycling bacteria, we isolated several key players from iron snow, including Acidiphilium, Acidocella, Acidithrix, and Ferrovum species [13,16,17]. The iron-oxidizing isolate Acidithrix sp. C25 forms large cell-mineral aggregates in the late stationary phase [13]. When co-cultured with the iron-reducing isolate Acidiphilium sp. C61, motile cells of Acidiphilium also form cell aggregates with similar morphology to iron snow. Comparative metabolomics identified the aggregation-inducing signal, 2-phenethylamine (PEA), which also induced faster growth of Acidiphilium sp. C61 [17].
PEA is a small molecule that exhibits an array of seemingly unrelated functions, including roles as a neurotransmitter and in food processing [18]. PEA was found in the brains of humans and other mammals [19] and reportedly has stimulatory effects, resulting in the release of biogenic amines [20]. In high concentrations, PEA can act as an anti-microbial against Escherichia coli on beef meat [18]. Bacteria can produce PEA via decarboxylation of phenylalanine or as a by-product of the tyrosine decarboxylase reaction [21]. PEA is capable of inhibiting both swarming and the expression of the flhDC gene cluster, which encodes a flagellar regulon that regulates flagellar motility in Proteus mirabilis [22,23]. Swarmer cell differentiation is dependent on specific environmental conditions, including the presence of a solid surface, inhibition of flagellar rotation, and density-based cell–cell signaling by extracellular signals [24,25,26]. However, swarming is not known to exist in Acidiphilium spp. and this flhDC gene cluster is absent in all sequenced Acidiphilium spp. genomes [17]. Therefore, the molecular mechanisms underlying PEA-induced aggregate formation in Acidiphilum spp. remain unknown.
To broaden our understanding of chemical communication between iron-cycling bacteria shaping pelagic aggregates, we amended different Acidiphilium spp. and two other iron snow key players with PEA to see if this aggregation effect was isolate specific. We sequenced the genome of Acidphilium sp. C61 to gain more insights into the metabolic pathways and potential behaviors (e.g., motility, chemotaxis) of this organism. Furthermore, we performed comparative transcriptomics of Acidphilium sp. C61 amended with 10 μM PEA compared to cultures without PEA to elucidate the genetic mechanisms underlying aggregate formation.
2. Materials and Methods
2.1. Bacterial Strains, Growth Conditions, and Microscopic Characterization of Aggregate Formation in Acidophilic Bacteria
For incubation studies, three different Fe-reducing Acidiphilium spp. (Acidiphilium sp. C61, Acidiphilium cryptum JF-5, and Acidiphilium SJH) isolated from different environments were used. Briefly, Acidiphilium sp. C61 was isolated just below the redox cline in the water column of the central basin (pH 2.8–3.0) of lignite mine Lake 77 (Lusatian mining area in east-central Germany) [13,17], A. cryptum JF-5, isolated from Lake 77 sediments [14], and Acidiphilium SJH (strain kindly provided by Barrie Johnson, School of Natural Sciences, Bangor University) was originally isolated from an abandoned pyrite mine in North Wales [27]. In addition, we tested the FeRB Acidocella sp. C78, isolated from the Lake 77 water column [17], and the FeOB Ferrovum sp. PN-J47 (strain kindly provided by Michael Schlömann, Technical University Bergakademie Freiberg) [28] to determine the effect of two different concentrations of 2-Phenethylamine (PEA) (Alfa Aesar, Kandel, Germany) (10 and 50 µM) on potential aggregate formation in monoculture incubations. Incubations were carried out using a defined medium, artificial pilot-plant water (APPW) medium (pH 2.5), and prepared as previously described (0.022 g L−1 K2SO4, 3.24 g L−1 MgSO4·7H2O, 0.515 g L−1 CaSO4·2H2O, 0.058 g L−1 NaHCO3, 0.010 g L−1 NH4Cl, 0.014 g L−1 Al2(SO4)3·18H2O, 0.023 g L−1 MnCl2·4H2O, 0.0004 g L−1 ZnCl2) [28] with the exception of added yeast extract (0.2 g L−1) to ensure growth of Acidiphilium and Acidocella strains [14,17]. All incubations were grown aerobically at room temperature on a rotary shaker (100 rpm) for three days.
All incubations were prepared in triplicate and growth was monitored spectrophotometrically (OD600nm) using a DR3900 spectrometer (Hach Lange, Düsseldorf, Germany) or indirectly using the 1,10-phenanthroline method [29] to monitor the oxidation of Fe2+ (Ferrovum sp. PN-J47). Acidiphilium spp., Acidocella sp. C78, and Ferrovum sp. PN-J47 were grown to exponential phase (OD600nm = 0.03; A512nm = 1.5) in the presence of 0, 10, or 50 µM PEA. Then, 10 µM SYTO 13 (Thermo Scientific, Schwerte, Germany) was used to stain nucleic acids of cells in all subsamples taken. Additionally, 8 μL of each cell culture was stained with SYTO 13 and placed on glass microscope slides. Aggregate formation was visually examined using an Axioplan fluorescence microscope (Zeiss, Oberkochen, Germany).
An additional 2 mM glucose was added to the above Acidiphilium sp. C61 culture supplemented with 0, 10, 50 µM PEA. Sterile pre-processed glass slides (Roth, Karlsruhe, Germany), which were immersed in H2O2: HNO3 (1:1 v/v, Roth, Karlsruhe, Germany) overnight, were submerged in 50 mL conical tubes with 35 mL cultures. Glass slides were taken out and applied 50 μL SYTO 13 to stain nucleic acids of cells in the biofilm. Biofilm formation was visually examined using the above Axioplan fluorescence microscope.
2.2. Genomic DNA Extraction and Whole Genome Sequencing of Acidiphilium sp. C61
Acidiphilium sp. C61 genomic DNA was extracted using a phenol–chloroform based method from cultures grown to an OD600nm of 0.060 in APPW+YE medium. Briefly, biomass was harvested by centrifugation at 12,000× g for 10 min at room temperature and subjected to bead beating (6.5 m s−1 for 30 s with 0.6 g Zirconium/glass-Beadsbeads (⌀ = 1 mm. Carl Roth, Karlsruhe, Germany) in 750 µL sodium phosphate buffer (120 mM, pH 8.0) plus 250 µL TNS solution (500 mM Tris-HCl pH 8.0, 100 mM NaCl, 10% SDS w/v). Cell debris was separated by centrifugation. Nucleic acid extraction of the supernatant was performed in two sequential steps: first with phenol–chloroform–isoamyl alcohol (25:24:1 v/v/v, AppliChem, Darmstadt, Germany) and second with chloroform–isoamyl alcohol (24:1 v/v, AppliChem, Darmstadt, Germany). The aqueous phase was precipitated overnight at −20 °C with two volumes of polyethylene glycol 6000 (Carl Roth, Karlsruhe, Germany). Glycogen (20 mg mL−1, Sigma-Aldrich, Darmstadt, Germany) was added to facilitate precipitation. DNA was collected by centrifugation (20,000× g at 4 °C for 90 min). The resulting pellets were washed with ice-cold ethanol (70% v/v), centrifuged, and resuspended in 50 µL elution buffer (Qiagen, Hilden, Germany). Genomic DNA was sent to RTL genomics (Lubbock, TX, USA) for library preparation and whole genome sequencing using PacBio® SMRTBell reagents (Pacific Biosciences, Menlo Park, CA, USA) and a PacBio RSII instrument.
2.3. Genome Assembly and Annotation
RTL genomics performed initial quality control and assembly of the Acidiphilium sp. C61 whole genome sequence. Raw data were subjected to quality control using FastQC (v. 0.11.7) (http://www.bioinformatics.babraham.ac.uk/projects/fastqc/) and assembled using HGAP3 (Hierarchical Genome Assembly Process 3 ) implemented in the SMRTLink software suite (v. 4.0) [30]. Basic genome characteristics were determined with QUAST (v. 4.0) [31]. Genome completeness and contamination level were estimated using the lineage-specific workflow of CheckM (v. 1.0.12) [32] with default settings, except for the “reduced_tree” parameter, which was applied to reduce the computational demand. The contamination percentage provided by CheckM represents the redundancy of single copy marker genes in this Acidiphilium sp. C61 genome sequence. The assembled genome was subsequently annotated using dfast (v. 1.1.0) [33] with default settings. This annotation was complemented by additional BlastKOALA searches [34] with default settings of encoded amino acid sequences against the KEGG GENES database. We collected amino acid sequences of known autotransporters and iron reductases from the NCBI non-redundant protein database by text searches. These sequences were clustered based on a sequence identity of 90% using CD-HIT (v. 4.7) [35] and used as queries for diamond (v. 0.9.26.127) searches with default settings [36] against the genome of Acidiphilium sp. C61 to identify potential genes encoding known autotransporters and iron reductases.
2.4. Pangenomic Analysis
We collected six publically available genomes from the GenBank Assembly Database of related Acidiphilium spp., including A. cryptum JF-5 (GenBank assembly accession: GCA_000016725.1), A. multivorum AIU301 (GCA_000202835.1), A. angustum ATCC 35903 (GenBank assembly accession: GCA_000701585.1), A. rubrum ATCC 35905 (GCA_900156265.1), Acidiphilium sp. JA12-A1 (GCA_000724705.2), and Acidiphilium sp. PM (GCA_000219295.2). We performed a pangenomic analysis combining the six publically available Acidiphilium spp. genomes and our Acidiphilium sp. C61 isolate genome using anvi’o (v. 5.5), following a previously published workflow [37,38]. Briefly, the headers of the retrieved genome fasta files were simplified using the program “anvi-script-reformat-fasta”. The “anvi-gen-contigs-database”, which incorporates prodigal (v. 2.6.3) to identify open reading frames (ORFs), was used to profile Acidiphilium spp. genomes [39]. Genes were annotated with the program “anvi-run-ncbi-cogs” based on blastp (v. 2.5.0) [40], which searches against the December 2014 release of the Clusters of Orthologous Groups (COGs) database [41]. In this study, we define a pangenome as the whole gene set of all strains of Acidiphilium sp. We use the term “core genes” to describe all genes present in all Acidiphilium genomes and the term “accessory genes” when we discuss genes present in a single or multiple Acidiphilium genomes. The Acidiphilium pangenome was computed using the program “anvi-pan-genome” (settings: minbit: 0.5, mcl-inflation: 10), which relies on blastp for calculating amino acid sequence similarities across genomes, the minbit heuristic first implemented in ITEP [42] to identify and remove weak amino acid sequence matches, and the MCL algorithm [43] to identify clusters based on amino acid sequence similarity searches. The results were displayed using the program “anvi-display-pan” and analyzed using the interactive interface of anvi’o.
2.5. 16S rRNA Gene Phylogenetic Analysis
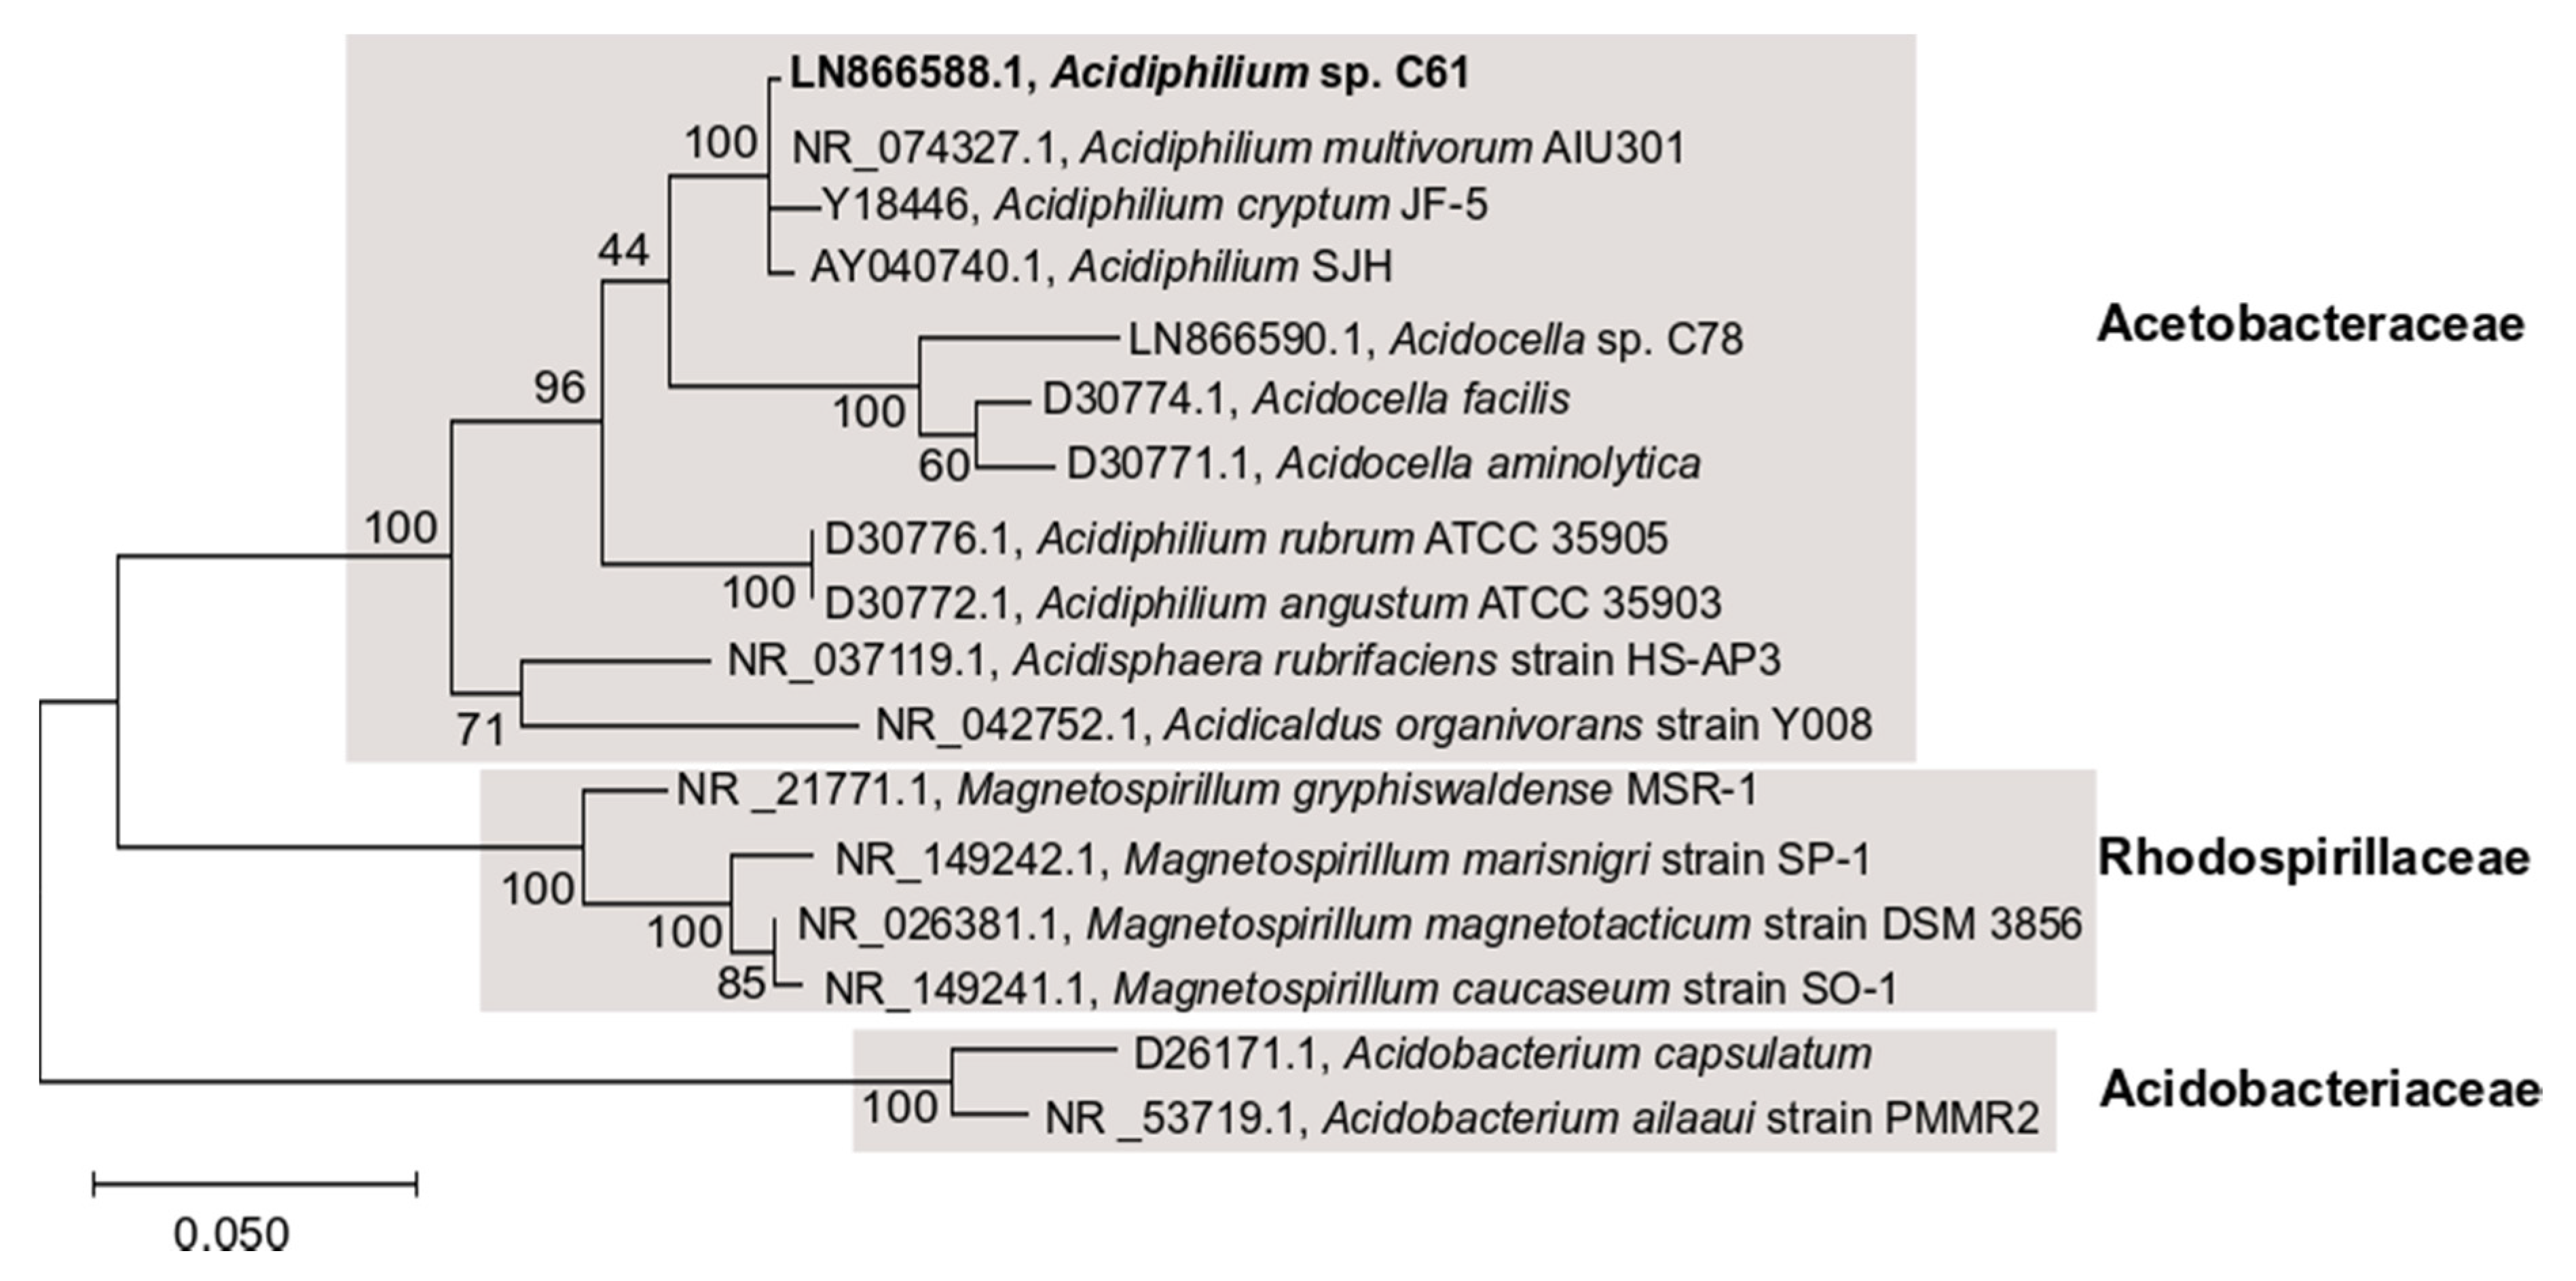
16S rRNA gene sequences from Acidiphilium sp. C61 (LN866588.1), A. cryptum JF-5 (Y18446.1), A. multivorum AIU301 (NR_074327.1), A. SJH (AY040740.1), A. rubrum (D30776.1), A. angustum (D30772.1), Acidocella sp. C78 (LN866590.1), Acidocella aminolytica (D30771.1), and Acidocella facilis (D30774.1), Acidisphaera rubrifaciens (NR_037119.1), Acidicaldus organivorans strain Y008 (NR_042752.1) from Acetobacteraceae, Magnetospirillum gryphiswaldense MSR-1 (NR_121771.1), Magnetospirillum marisnigri strain SP-1 (NR_149242.1), Magnetospirillum magnetotacticum strain DSM 3856 (NR_026381.1), Magnetospirillum caucaseum strain SO-1 (NR_149241.1) from Rhodospirillaceae, Acidobacterium capsulatum (D26171.1), Acidobacterium ailaaui strain PMMR-2 (NR_153719.1) from Acidobacteriaceae were identified and obtained from the NCBI Genbank database. The 16S rRNA sequences were aligned using ClustalW [44] in mega (v. X) [45]. A phylogenetic tree was constructed using maximum likelihood to estimate the relatedness of the aforementioned species. The maximum likelihood tree was constructed using the following settings: bootstrapping (100 replicates), substitution type (nucleotide), model (Tamura-Nei), ML heuristics (nearest-neighbor-interchange), initial tree (NJ/BioNJ).
2.6. RNA Extraction
RNA was extracted from triplicate Acidiphilium sp. C61 cultures grown to exponential phase (OD600nm = 0.3) in APPW+YE medium with 0 or 10 µM PEA. Glucose (2 mM) was added to the medium to enhance growth. Biomass was harvested after 4 days and RNA was extracted using a modified version of the DNA extraction method described above. DNA was removed from 50 µL total nucleic acid extracts through enzymatic digestion with 2.5 µL (2 U µL−1) TURBO DNAse (Thermofisher Scientific, Waltham, MA, USA), 0.5 µL (20 U µL−1) RNase inhibitor and 5 µL 10X DNAase buffer (Thermofisher Scientific, Waltham, MA, USA) for 1 h at 37 °C. After digestion, successful DNA digestion was checked by agarose gel electrophoresis. Total RNA was purified using the RNA Clean & Concentrator-5 kit (Zymo Research, Freiburg, Germany), according to the manufacturer’s instructions. RNA purity was assessed by spectrophotometry, and RNA quantities were determined by fluorometry using Qubit RNA HS Assay (Life Technologies, Carlsbad, CA, USA) and a Qubit® 3.0 fluorometer (Life Technologies, Carlsbad, CA, USA). RNA integrity was additionally assessed by agarose gel electrophoresis.
2.7. RNA-seq Library Preparation and Sequencing
Total RNA was subjected to library preparation using the NEBNext Ultra II directional RNA library prep kit for Illumina (New England Biolabs, Beverly, MA, USA), according to the manufacturer’s instructions. Size selection was used to select for fragments ranging between 150–200 bp in length. RNA libraries were quantified using a Qubit® 3.0 fluorometer as described above and their fragment size range was assessed by high-resolution, chip-based gel electrophoresis with a Bioanalyzer 2100 instrument (Agilent Technologies, Waldbronn, Germany) and the Agilent DNA7500 Kit (Agilent Technologies, Waldbronn, Germany). Libraries were pooled equimolarly and sequenced in paired-end (2 × 150 bp) mode on a HiSeq 2000 instrument (Illumina, Munich, Germany). Transcriptome sequencing (RNA-seq) was performed by Eurofins Genomics (Constance, Germany).
2.8. RNA-seq Data Pre-Processing
Demultiplexing of raw data was done with bclfastq (v. 2.19) (Illumina). The quality of raw, demultiplexed RNA-seq datasets was assessed using FastQC (v. 0.11.7) (http://www.bioinformatics.babraham.ac.uk/projects/fastqc/). Raw data (raw reads) was adapter trimmed using trimgalore (v. 0.4.3, cutoff: 20) (https://www.bioinformatics.babraham.ac.uk/projects/trim_galore/) and filtered using sickle (v. 1.33, quality threshold: 20) (https://github.com/najoshi/sickle). Ribosomal RNA-derived sequences, as well as non-coding RNA sequences, were filtered out with SortMeRNA (v. 2.1) [46] using pre-compiled databases of SILVA [47] and Rfam [48]. The remaining, mRNA-derived sequences were mapped onto the assembled and annotated genome of Acidiphilium sp. C61 using bbmap (v. 38.12, settings: slow, k = 11) [49]. The resulting bam files were sorted and indexed with SAMtools (v. 1.3.1) [50]. Read count tables were generated from sorted and indexed bam files using featureCounts (v. 1.6.0) [51].
2.9. Differential Gene Expression Analysis
Differential gene expression analysis was carried out in the R framework for statistical computing (v. 3.5.1) (R Core Development Team, 2018) [52], using the package edgeR (v. 3.20.9), including all dependencies [53]. The analysis started from merged read count data of the two tested experimental conditions (10 μM PEA vs. 0 μM PEA supplementation). Pseudocounts, generated by log2-transforming counts+1 (where counts are equivalent to the raw counts per feature), were used for preliminary data exploration by generating M-A plots and multidimensional scaling. The biological coefficient of variation was calculated for each gene to assess biology-derived variation within replicate groups. Genes identified to be differentially expressed were false discovery rate (FDR) corrected and filtered with respect to log fold change, FDR-corrected p-value, and gene expression in counts per million (CPM).
2.10. Quantitative PCR
Total gene copy numbers of the Acidiphilium sp. C61 16S rRNA gene with and without PEA (0, 10, 50 µM; n = 3) were determined using quantitative PCR (qPCR), an Mx3000P instrument (Agilent Technologies, Waldbronn, Germany) and Maxima SYBR Green qPCR Mastermix (Agilent Technologies, Waldbronn, Germany). Acidiphilium sp. C61 16S rRNA gene copy numbers were determined using the primer set Bac8Fmod/Bac338Rabc [54,55] and previously published cycling conditions [56]. Genomic DNA was diluted to a range of 1–10 ng µL−1 and 0.6 to 6 ng of DNA was used as template. Standard curves were made using serial dilutions of plasmid-based standards carrying the amplicon defined by the used primer pair. These curves were linear for primer sets from 5 × 10⁸ to 5 × 101 with R2 values of 0.999–1.000, and the qPCR performed with efficiencies between 80% and 90%. Welch’s t-test was used to compare treatments using the calculated quantification results and determine statistical significance (p < 0.05).
2.11. Quantification of eDNA Concentrations
eDNA concentrations were determined according to Tang et al. [57] in Acidiphilium sp. C61 incubations grown with increasing concentrations of PEA (0, 10, 50 µM; n = 3). Bacterial cells were removed from samples (approximately 900 µL) via centrifugation (4 min, 6800× g). The supernatant (700 µL) was transferred to a sterile 1.5 mL Eppendorf tube and mixed with 50 µL protein precipitation solution (Thermofisher Scientific, Waltham, MA, USA) by inverting (10 times) and centrifuged again (10 min, 12,100× g). Then, 700 µL of the supernatant was subsequently mixed with 70 µL 2.5 M NaCl and 1400 µL 96% ethanol prior to incubation at −20 °C for at least 24 h. DNA was precipitated by centrifugation (25 min, 4 °C, 18,300× g) and washed once in 70% (v/v) ice-cold EtOH. The pellet was air dried and resuspended in 50 µL TE buffer (10 mM Tris, 1 mM EDTA, pH 7.5) by vortexing for 25 s. The eDNA concentration was determined by fluorimetric quantitation.
2.12. Data Deposition
The Acidiphilium sp. C61 genome sequence has been deposited at the European Nucleotide Archive EBI-ENA under the Bioproject number PRJEB35789. The RNA-seq sequencing data has been deposited at the ArrayExpress under the accession E-MTAB-8619.
3. Results
3.1. Effect of PEA on Phenotype and Growth of Iron Snow Key Players
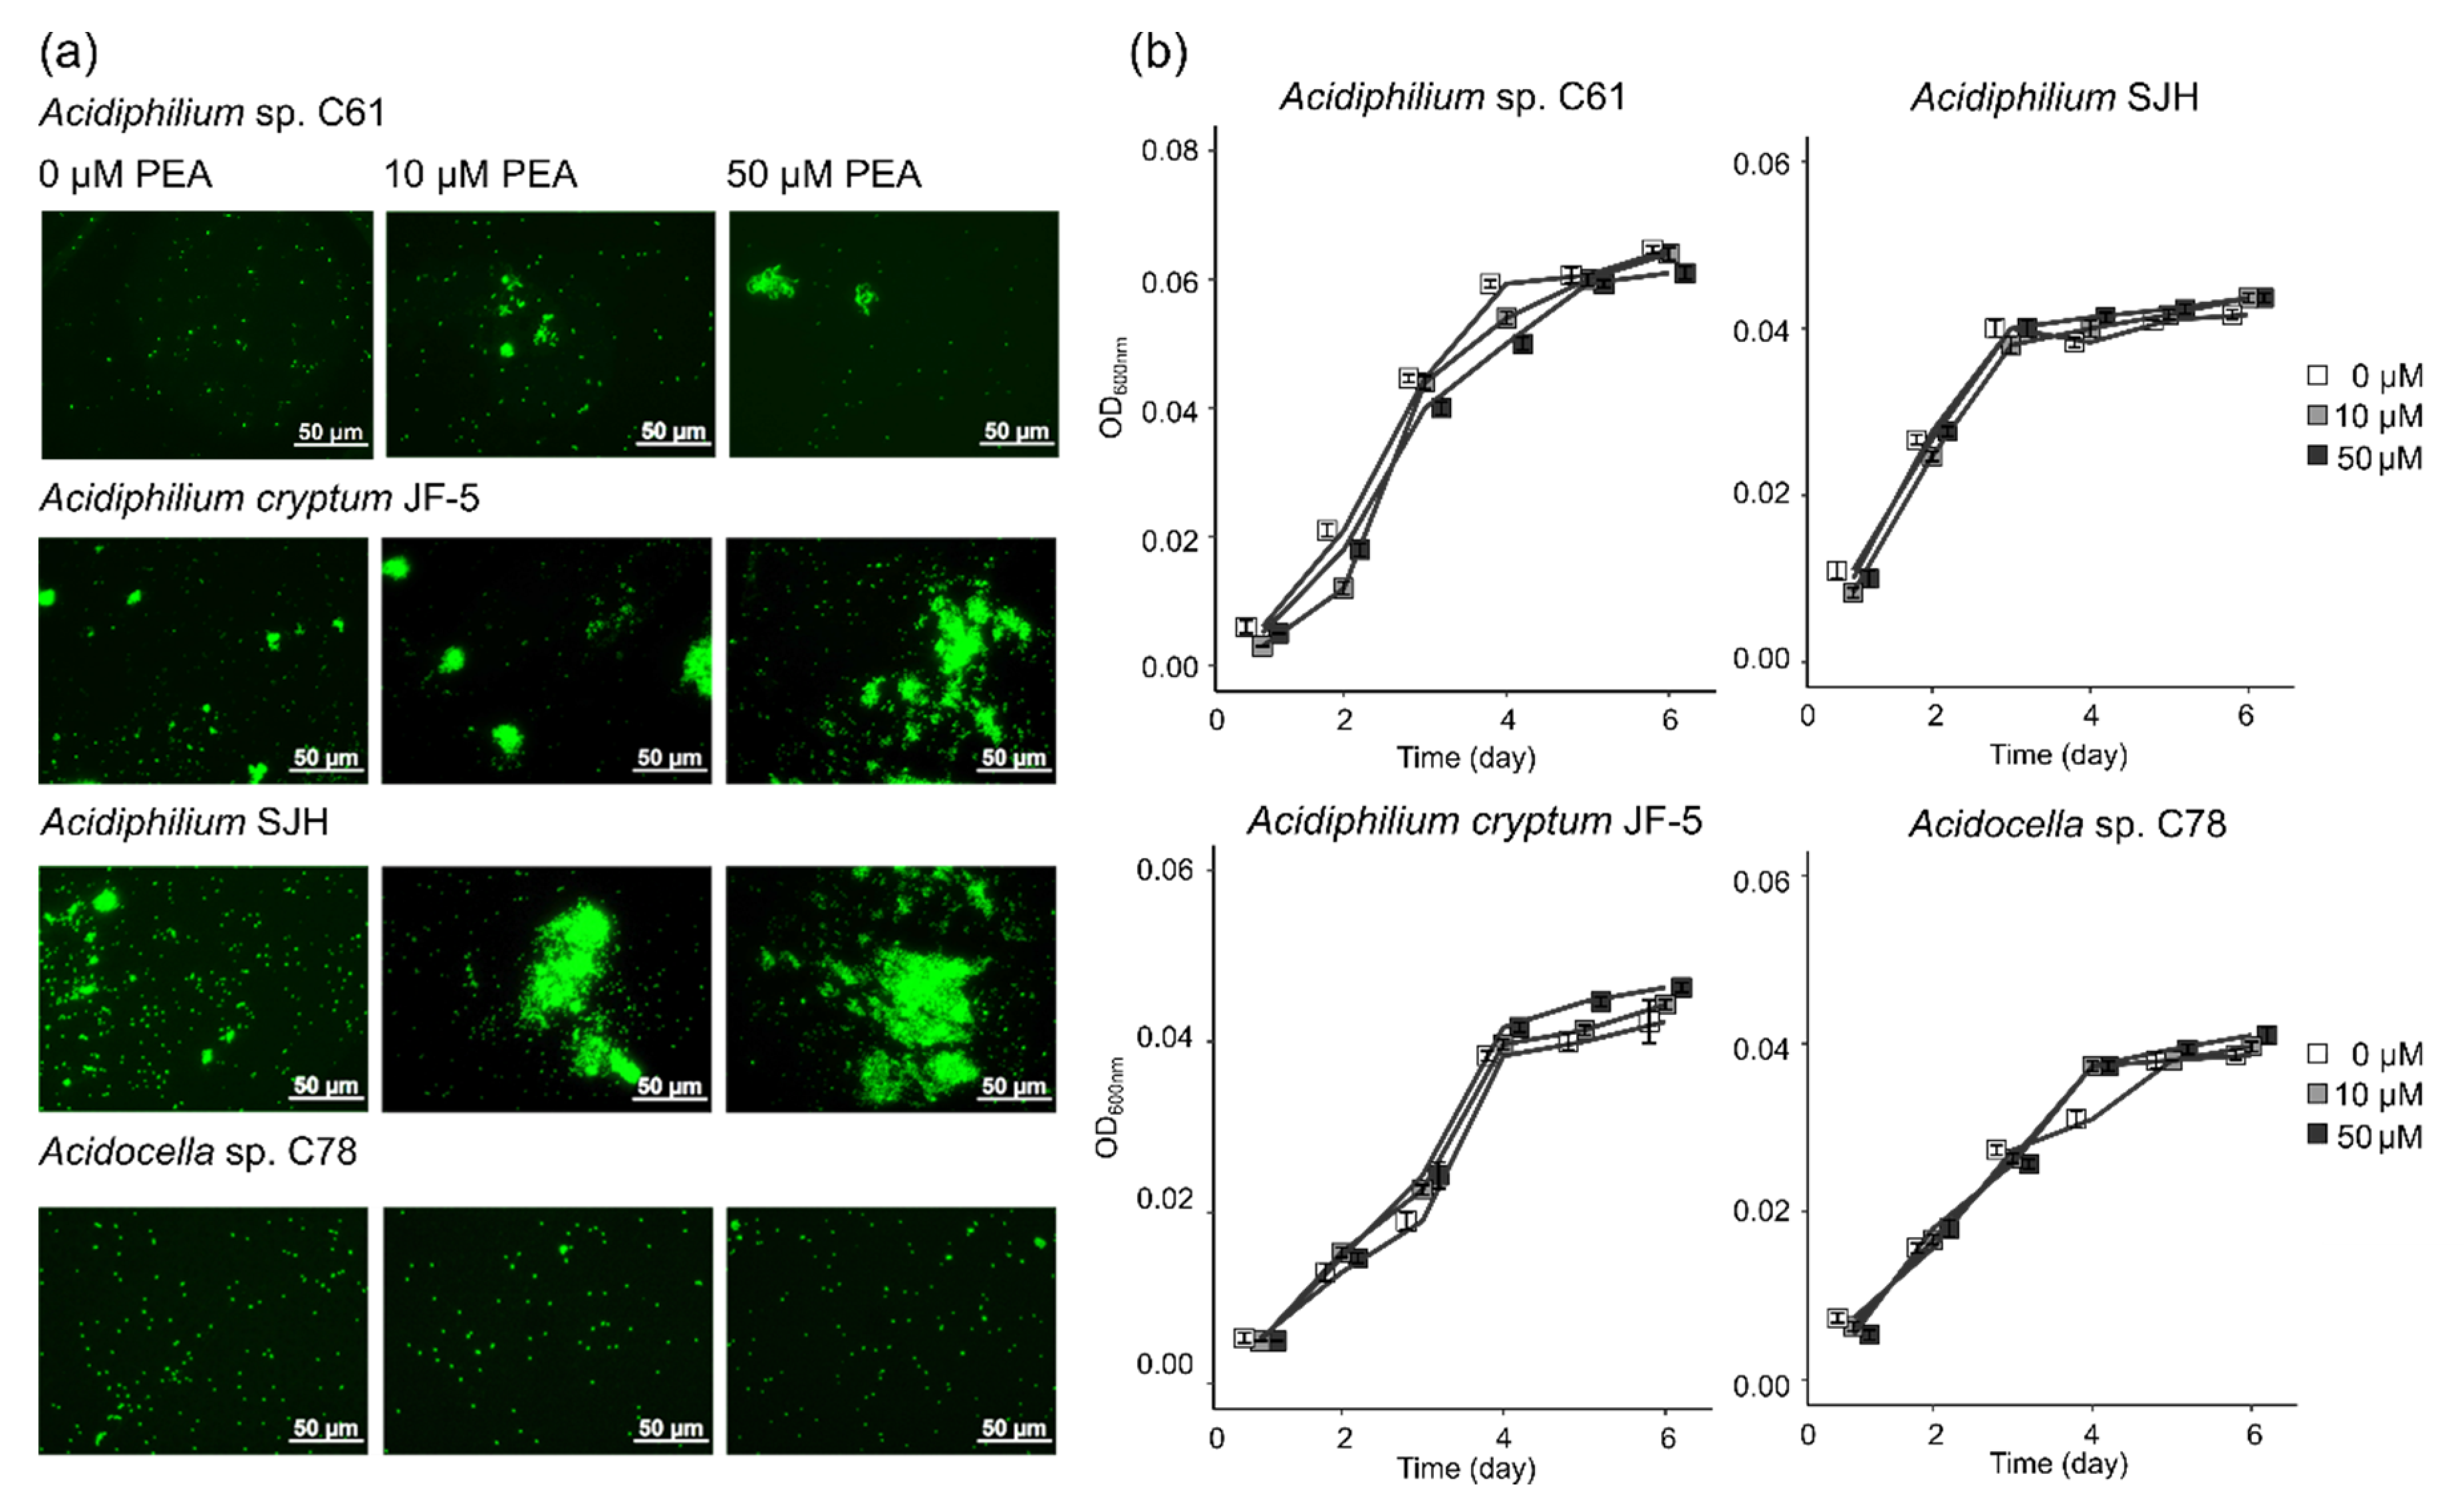
Given the previously observed, aggregation-inducing effect of PEA on Acidiphilium sp. C61 [17], we were interested in assessing the extent to which this phenotype is conserved across different Acidiphilium species and other iron reducers and oxidizers present in iron snow. Using three closely related Acidiphilium strains (Figure 1), we applied increasing concentrations of PEA (up to 50 μM) and used fluorescence microscopy to monitor any aggregate formation (Figure 2a). PEA induced aggregation in all tested Acidiphilium strains, with the greatest response observed in Acidiphilium SJH and A. cryptum JF-5, compared to Acidiphilium sp. C61. Higher concentrations of PEA resulted in increased numbers of aggregates formed (Figure 2a). In addition, biofilm formation of Acidiphilium sp. C61 on glass slides was enhanced in the presence of 10, 50, and 100 µM PEA after 5 days but not after 7 days.
For comparison, we also tested a potential response to PEA by the more distantly related Acidocella sp. C78 and the iron oxidizer Ferrovum sp. PN-J47, but we did not observe any aggregation (Figure 2a). Although PEA led to a distinct physiological response by Acidiphilium spp. following the addition of increasing concentrations of PEA, it did not have any effect on growth over time for the three tested Acidiphilium spp. or Acidocella sp. C78 (Figure 2b). However, rates of Ferrovum sp. PN-J47 iron oxidation increased 1.2- and 1.6-fold in the presence of 10 and 50 µM PEA, respectively (Figure S1).
3.2. Genome Sequencing, Assembly and Annotation of Acidiphilium sp. C61
We sequenced the genome of Acidiphilium sp. C61 to reconstruct its metabolic potential and to identify potential mechanisms enabling aggregate formation. Genome assembly led to a draft genome comprising six contigs (Table S1). The longest contig (326,6126 bp) accounted for 84.8% of the total assembly. Based on the presence and copy numbers of single-copy marker genes, the genome was 100% complete and showed a contamination of 2.24%. The assembled genome sequence of Acidiphilium sp. C61 has a size of 3.85 Mbp, a GC content of 66.1%, and contains 3700 open reading frames (ORF), of which 3604 are protein-coding genes and 96 are non-coding RNA genes (6 ribosomal RNA genes and 90 transfer RNA genes). Ninety transfer RNA genes comprised one tmRNA and multiple copies for all tRNA-genes except tRNA-Cys and tRNA-Trp. Among the 3604 protein-coding genes, 2155 genes were assigned a putative function and 1333 encode hypothetical proteins. In addition, we identified 116 transposase genes.
3.3. Potential Mechanisms of Aggregate Formation in Acidiphilium sp. C61
Given the previously observed phenotype of Acidiphilium sp. C61 forming aggregates upon exposure to PEA, our genome analysis focused on identifying mechanisms potentially involved in facilitating aggregate formation, including autoaggregation, motility, and biofilm formation. Since the aggregation effect was not specific to Acidiphilium sp. C61, we performed initial pangenome analyses of seven Acidiphilium spp. available in the GenBank Assembly database. The core genome of all Acidiphilium spp. analyzed included 1701 gene clusters, which comprised 52.1% of the gene clusters in the Acidiphilium sp. C61 genome (Figure 3a).
After screening the core genome for gene clusters relevant to aggregation, we observed that the seven strains shared 65 gene clusters (3.8% of overlapped gene clusters). These functions of these gene clusters are commonly associated with bacterial autoaggregation (autotransporter), motility (flagellar assembly, chemotaxis), and biofilm formation (exopolysaccharide biosynthesis and transport) (Figure 3b, Table S2-1) since the exact genes and mechanisms of three potential aggregations were not elucidated in previous studies. Out of the gene clusters, 541 were unique to Acidiphilium sp. C61, with the majority encoding hypothetical proteins (60%) (Table S2-2). Other strain-specific gene clusters encoded proteins involved in capsular polysaccharide biosynthesis, capsular polysaccharides transport (kps), the import of urea, and CRISPR/Cas systems, which function to protect against viral attack.
The inhibition of flagellar motility represents one mechanism of aggregation. Bacterial flagella consist of six components: basal body, motor, switch, hook, filament, and export apparatus, and screening the genome of Acidiphilium sp. C61 revealed genes for all six components (Table S3). Modulation of flagellar-based motility is facilitated in Acidiphilium sp. C61 by an intact chemotaxis pathway, including genes for methyl-accepting chemotaxis proteins (mcp) and two-component systems (cheAW, cheY) that transduce environmental signals and interact with the flagellar basal body (fliGMN) and motor proteins (motAB).
Next, we screened the genome for genes encoding autotransporters, which are outer membrane proteins that facilitate aggregation by binding to extracellular matrix components and the surface of other cells. One autotransporter gene and two genes coding for autotransporter modification proteins were identified in the Acidiphilium sp. C61 genome. In addition, we identified genes with a homology (amino acid sequence identity >30%) to other putative autotransporter genes (Table S3).
Extracellular polymeric substances (EPS) are considered to be one of the major structural components of the biofilm matrix that form on solid surfaces as well as non-surface attached aggregates, for example, pellicle biofilms that form at the air–liquid interface. Genes encoding proteins involved in the synthesis and secretion of exopolysaccharides, such as glycosyltransferases, the putative polysaccharide biosynthesis/export protein (wza), and the capsular polysaccharide export protein (kps) were identified. The presence of different pathways involved in exopolysaccharide precursor production suggests that EPS biosynthesis plays a role in Acidiphilium sp. C61 aggregate formation. Lastly, we looked for genes related to quorum sensing based biofilm formation and aggregation. Quorum sensing can induce aggregate formation through coordinated changes in gene expression mediated by autoinducers in response to cell density fluctuations, which can regulate biofilm formation. However, the Acidiphilium sp. C61 genome lacks autoinducer synthesis and receptor genes.
3.4. Central Metabolism and Iron Reduction Machinery in Acidiphilium sp. C61
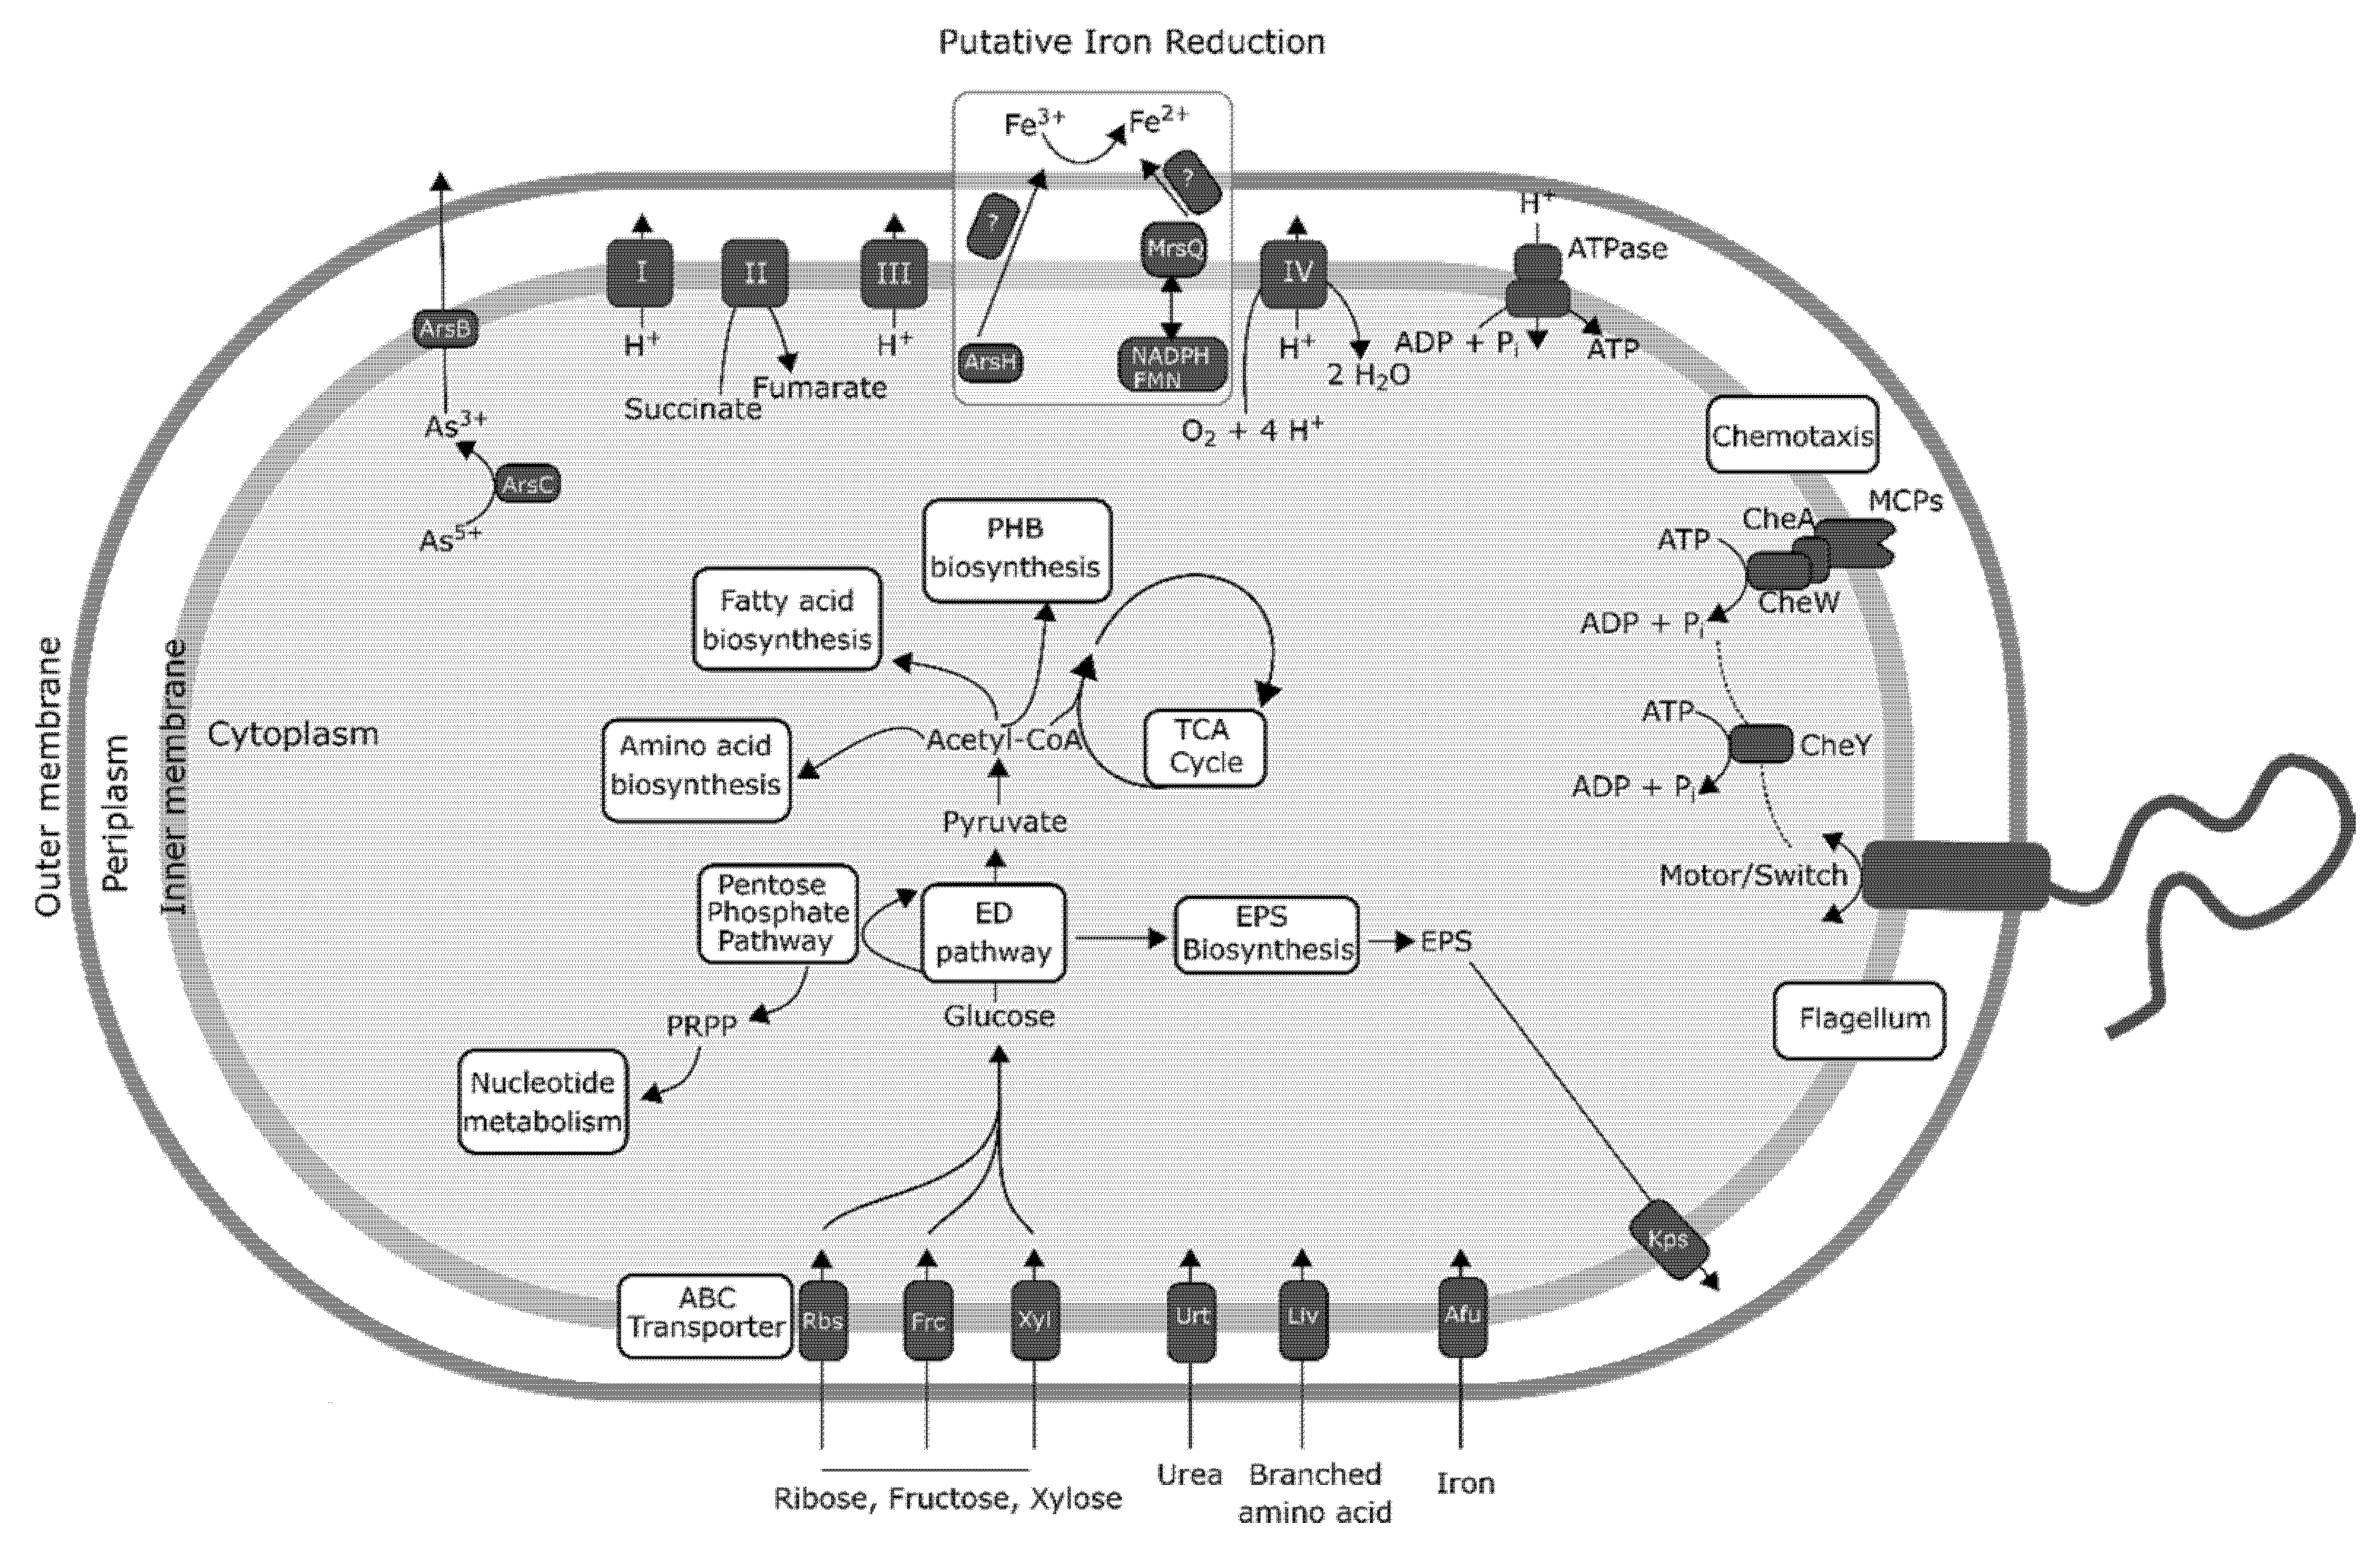
The lack of genomic information available for acidophilic FeRB prompted us to investigate the metabolic potential of Acidiphilium sp. C61 as a whole. The Acidiphilium sp. C61 genome encodes an incomplete glycolysis pathway but features full sets of genes required for the tricarboxylic acid (TCA) cycle and oxidative phosphorylation (Figure 4, Table S4). The lack of an intact glycolysis pathway is compensated by a complete pentose phosphate pathway. We found no genes related to major carbon fixation pathways, but Acidiphilium sp. C61 appears to be able to fix carbon dioxide heterotrophically since its genome encodes a pyruvate carboxylase (pyc) and a pyruvate orthophosphate dikinase (ppdk) similar to Acidiphilium sp. JA12-A1 [58]. Acidiphilium sp. C61 possesses genes encoding all pathways for the biosynthesis of proteinogenic amino acids, nucleotide and fatty acid biosynthesis (Figure 4). Multiple encoded transporters enable the transport and utilization of inorganic nutrients (e.g., afuABC) and organic substrates (e.g., kpsET). Among others, we identified genes encoding ribose (rbsABC), fructose (frcABC) and xylose (xylFGH) transporters. We also found seven genes of two complete pathways (starting from acetyl-CoA) responsible for the biosynthesis and accumulation of poly-β-hydroxybutyrate (PHB), a common storage material in prokaryotic cells typically synthesized in the presence of excess organic carbon and previously identified in Acidiphilium cryptum JF-5 [14,59] and Acidiphilium sp. JA12-A1 [58].
In comparison to neutrophilic and alkaliphilic FeRBs, our knowledge about the iron-reducing machinery in acidophiles is limited [60]. Acidiphilium sp. C61 possesses genes encoding for cytochrome c (Table S5-1), which is a outer-membrane cytochrome suggested to be involved in iron respiration of A. cryptum JF-5 [61]. No other conclusive iron reductases in acidophilic FeRB, such as Acidocella or Acidiphilium spp., have been identified to date [58,60]. We also identified a complete set of genes involved in oxidative phosphorylation and genes coding proteins known to be involved in electron transfer using a variety of electron donors such as NADH, NADPH, glutathione, and electron transfer mediators such as FMN and FAD (Table S5-2). These electron donors and electron transfer mediators are necessary to transfer electrons to Fe3+.
Furthermore, we searched for candidate iron reductase involved in iron reduction based on knowledge on other FeRB and electron transfer in general (Figure 4, Table S5-3). A homology search using all available iron reductases found in the NCBI non-redundant protein database against the genome of Acidiphilium sp. C61 was performed. Homology searches identified only one gene with a homology of 45.8% compared to msrQ (methionine sulfoxide reductase heme-binding subunit) from the neutrophilic FeRB Shewanella sp. Sh95 that could play a role in iron reduction. In addition, we identified a gene encoding an arsenate reductase (AcpC61_1183), which might function as iron reductase under acidic conditions [62].
3.5. Differential Gene Expression Analysis
We performed RNA-seq analysis on Acidiphilium sp. C61 with and without PEA exposure to examine transcriptome-wide responses to this aggregate-inducing chemical mediator. Under these specific growth conditions, we detected gene expression for 3598 out of 3604 genes encoded in the genome of Acidiphilium sp. C61. Gene expression ranged from 1.0 and 14.3 log2 counts per million (log2CPM). A detailed analysis of overall highly expressed genes (log2CPM >9) revealed primarily genes linked to carbohydrate metabolism, electron transfer, ATP synthesis, amino acid metabolism, and genetic information processing (DNA replication, transcription, protein biosynthesis) (Table S6). Except for a few seemingly random genes, genes linked to potential aggregation mechanisms were not among those featuring highest gene expression values. Gene expression for flagella biosynthesis, for instance, ranged between 6 and 10 log2CPM and between 5 and 9 log2CPM for chemotaxis.
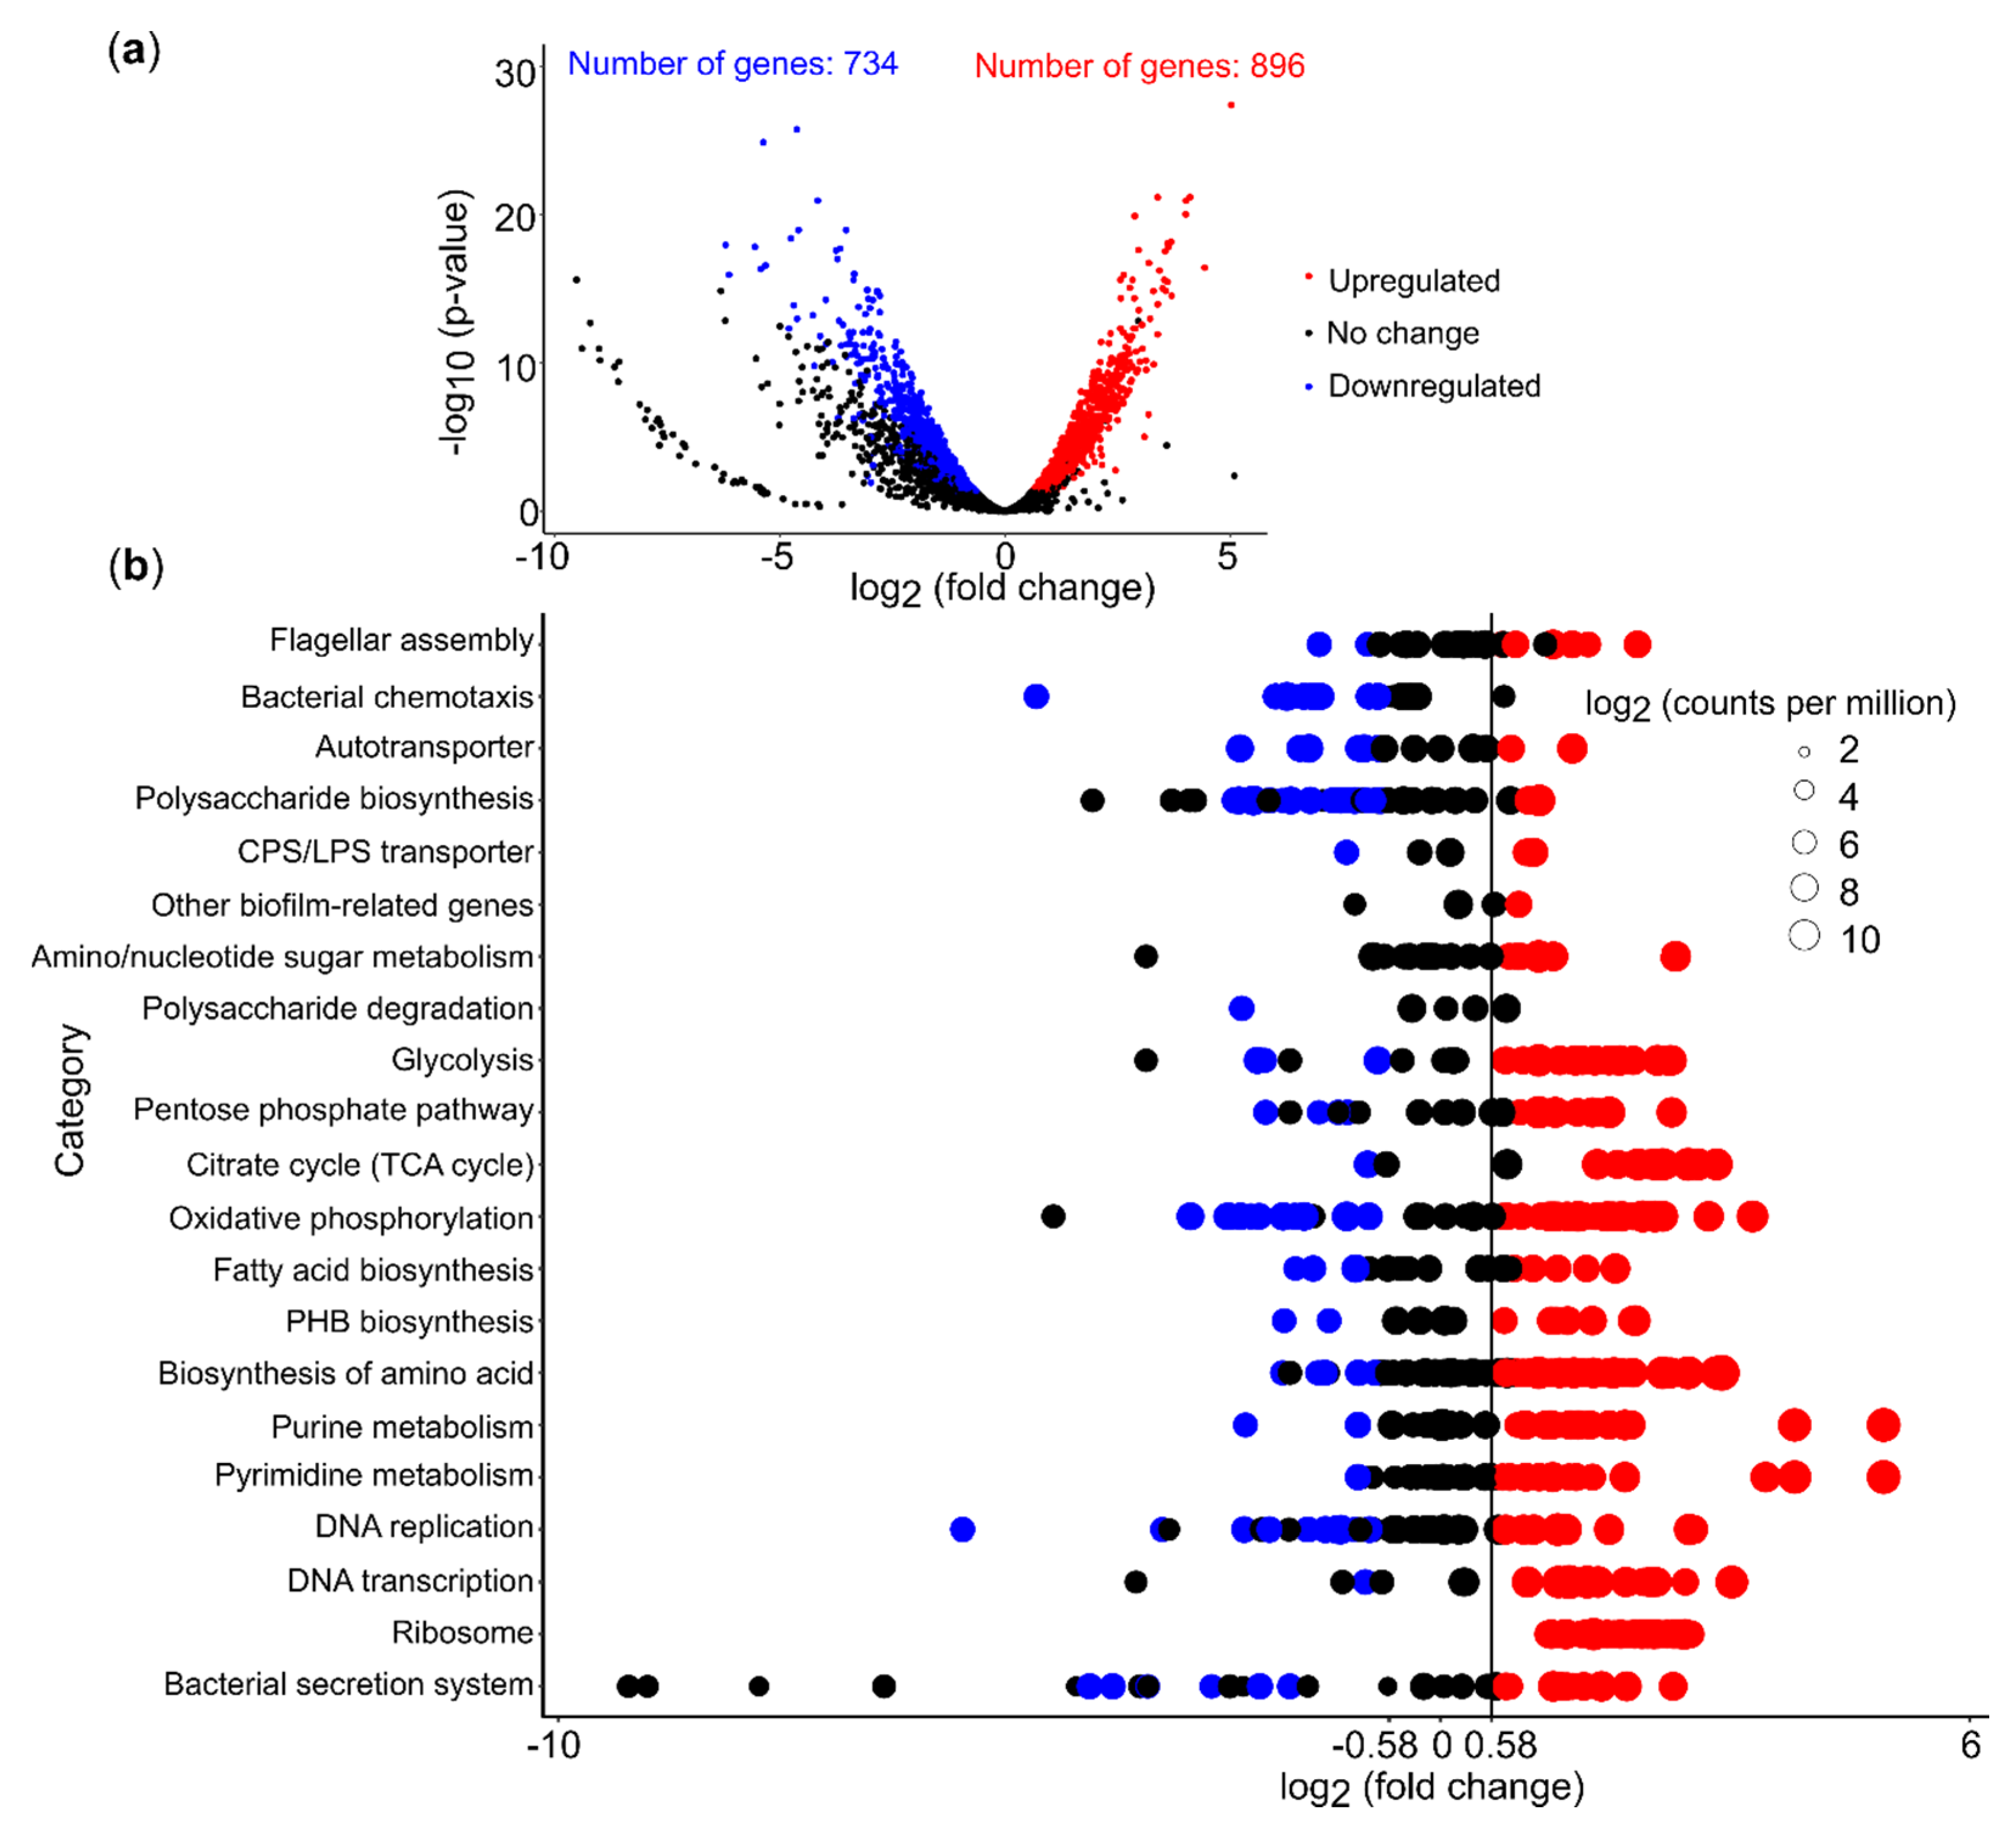
PEA addition triggered a pronounced shift in gene expression. Out of 3598 expressed genes, 45.3% were differentially expressed in Acidiphilium sp. C61 plus PEA incubations (log2 fold change (FC) >0.58 or <–0.58, log2 counts per million (CPM) >6 and false discovery rate (FDR <0.05) (Figure 5a, Table S7). Additionally, 896 genes were upregulated and 734 genes were downregulated, which equates to 55% and 45%, respectively, of all differentially expressed genes. Among these differentially expressed genes, 254 (26.5% of upregulated genes) and 216 (28.6% of downregulated genes) genes encode hypothetical proteins (Table S7). We focused on genes linked to potential aggregation mechanisms (Figure 5b, Table S8). Out of 29 genes involved in flagella biosynthesis, 6 were upregulated, including fliC (coding for the flagella filament), flgI (flagella P-ring protein precursor), flgB, flgC, flgG (encoding flagella proximal and distal rod proteins), fliL (flagella basal body rod protein). Only two genes, fliR (flagellar biosynthetic protein), flgA (flagella basal body P-ring formation, AcpC61_0944) were downregulated and the other flgA gene copy (AcpC61_1269) remained unchanged (Figure 5b, Table S8). Chemotaxis related genes ranged in expression between 4 and 8 log2CPM. We observed that multiple mcp genes were downregulated, while other components of the chemotaxis machinery, for example, two-component systems, were not affected by PEA. For exopolysaccharide synthesis genes, the majority of genes involved in the exopolysaccharide precursor biosynthesis pathways (e.g., UDP-glucose, UDP-galactose) were upregulated, whereas genes involved in capsular polysaccharide biosynthesis were downregulated (e.g., glycosyltransferase, capsular polysaccharide biosynthesis protein) (Figure 5b, Table S8). Genes linked to capsular polysaccharide export (kpsE, kpsT) were upregulated.
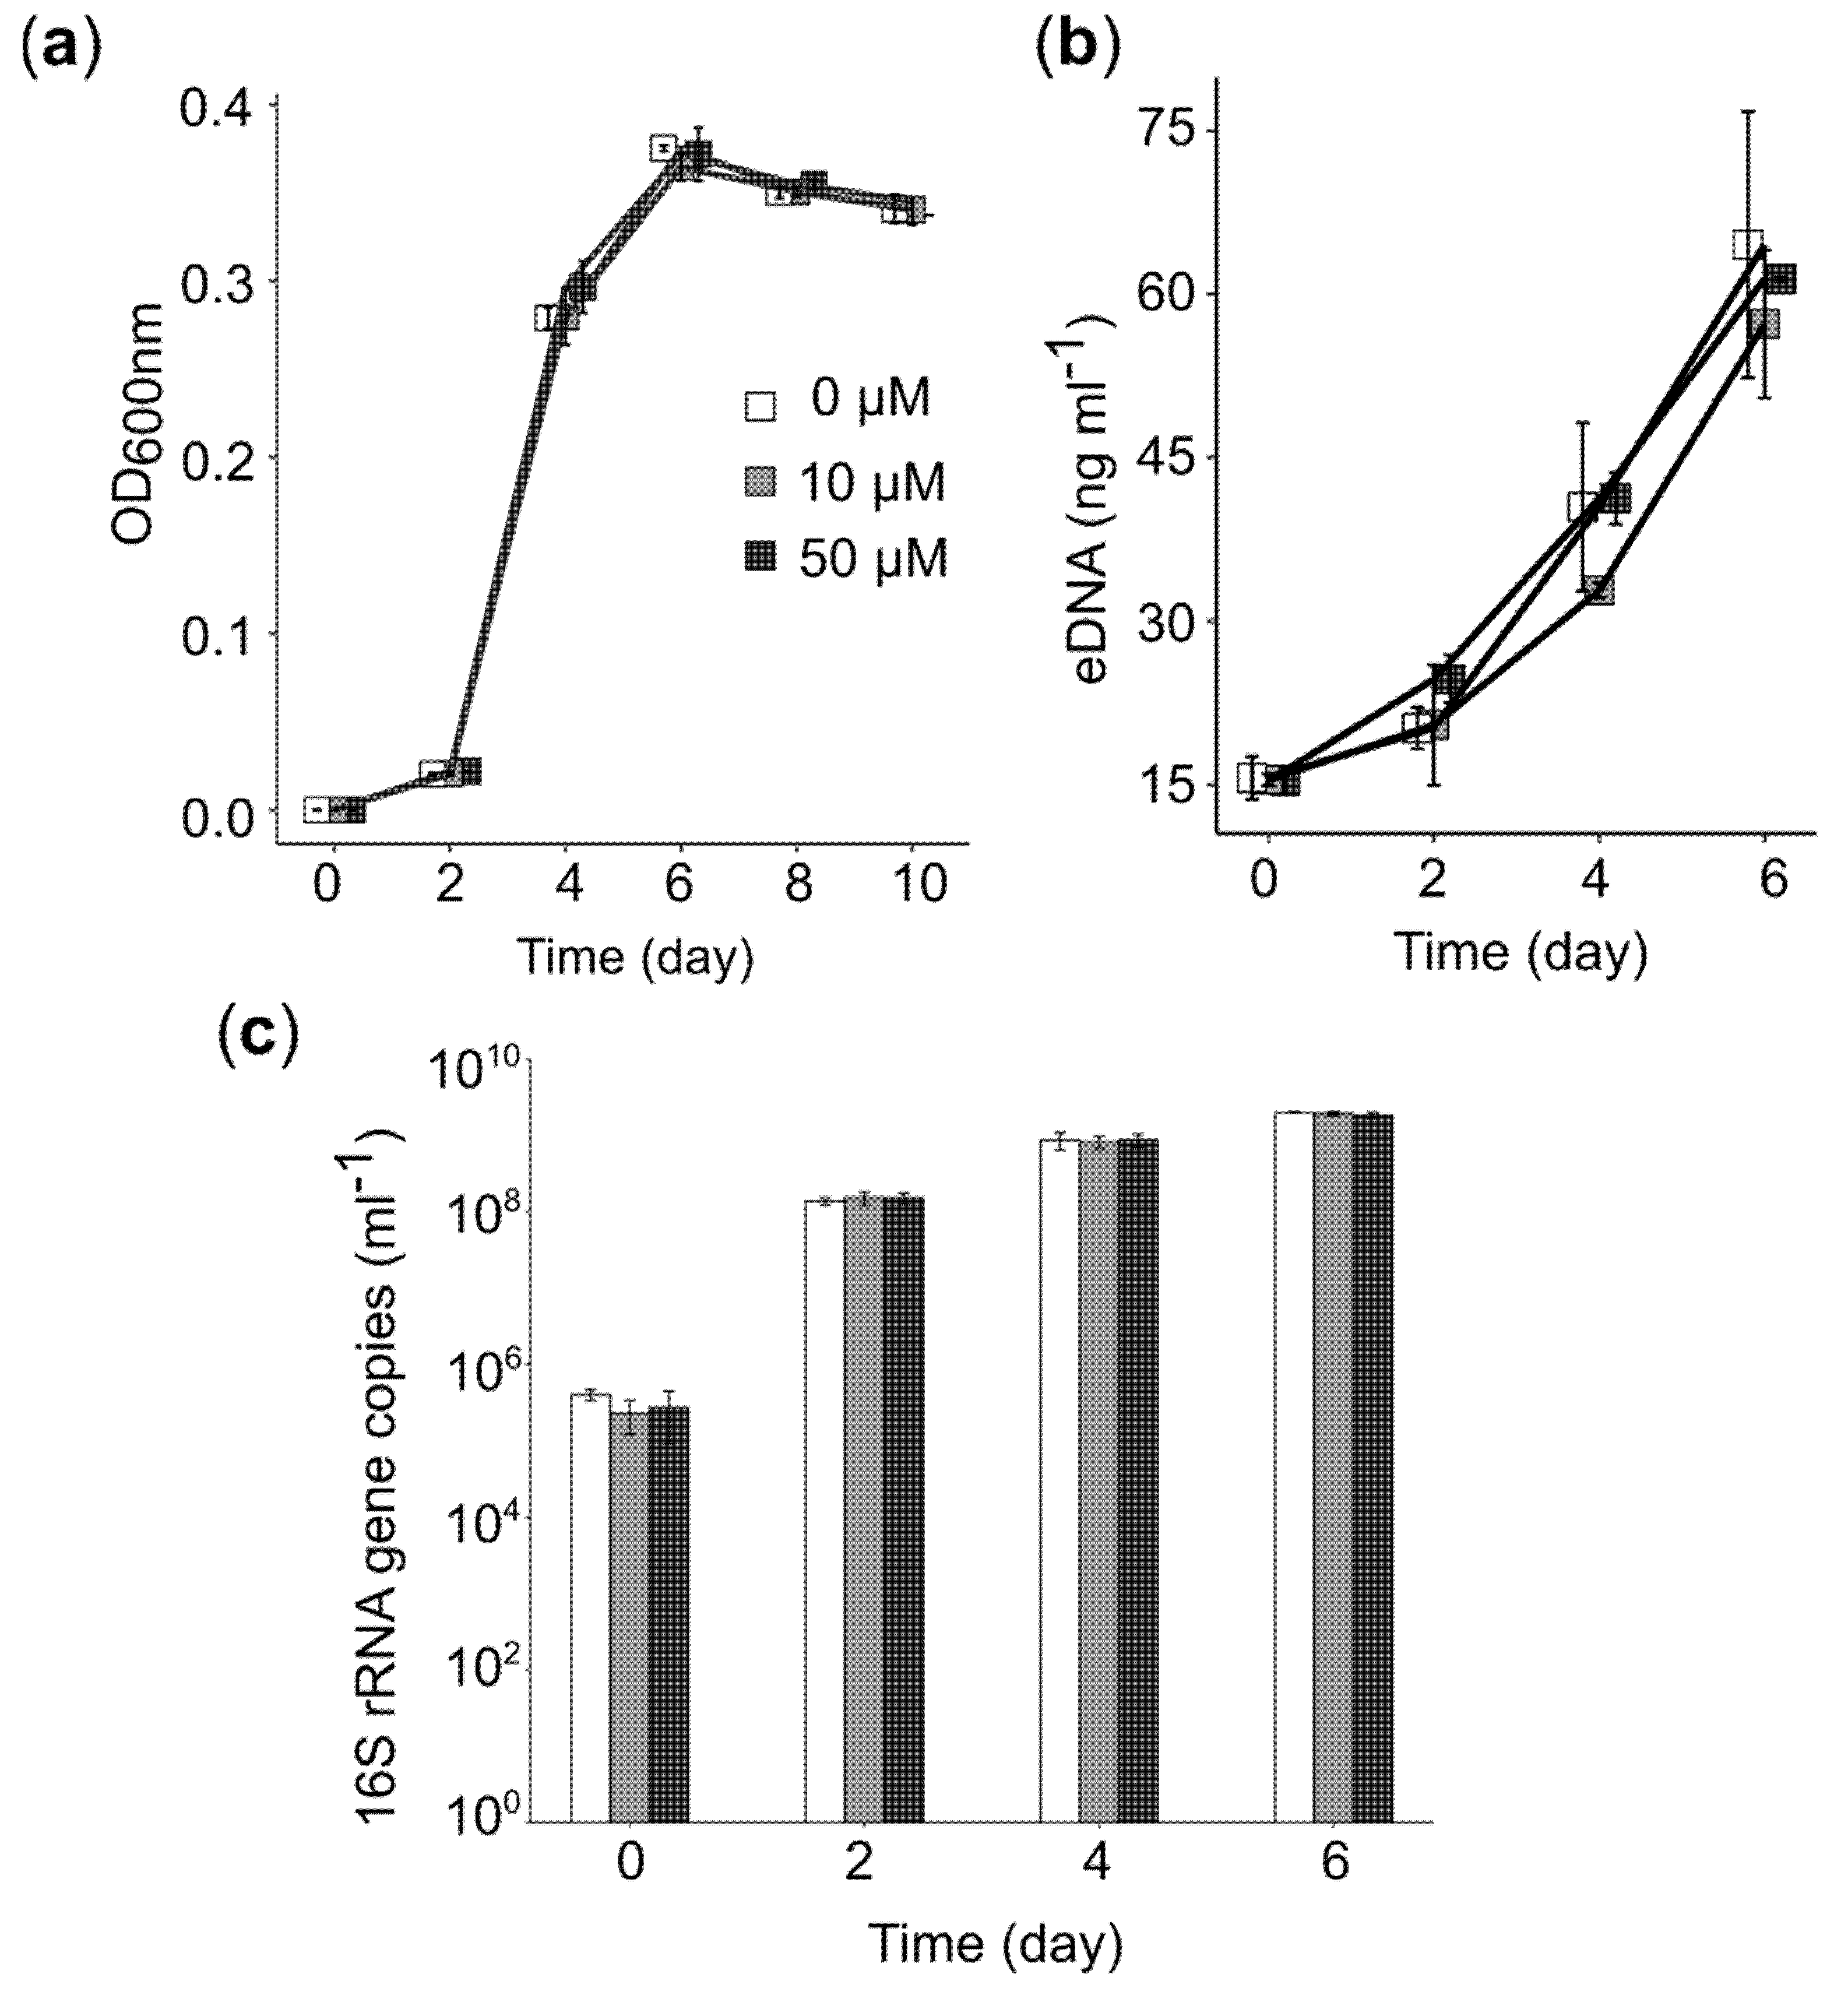
3.6. PEA Induced Upregulation of Central Cellular Metabolism
We also used RNA-seq data to assess the effect of PEA on genes linked to central cellular metabolism. More than 50% of the genes involved in glycolysis, the TCA cycle, and oxidative phosphorylation were upregulated (Figure 5b). Although we found that genes involved in energy production, for example, genes involved in DNA precursor biosynthesis, were highly expressed, we did not observe an increase in bacterial growth or production of eDNA (Figure 6). We did not detect a significant increase in bacterial 16S rRNA gene copies nor eDNA concentration in cultures of Acidiphilium sp. C61 in incubations supplemented with PEA despite enhanced aggregate formation. We also observed no change in the activity of DNA replication. However, we found that most genes involved in amino acid biosynthesis and transcription were upregulated (Figure 5b). Genes involved in the synthesis of ribosomes and genes encoding signal peptidases, which are involved in the removal of signal peptides from secretory proteins, were also upregulated. Genes linked to the Sec translocation pathway, which provides a major pathway of protein translocation from the cytosol across the cytoplasmic membrane in bacteria, were also upregulated (Table S8).
4. Discussion
Bacteria of the heterotrophic alphaproteobacterial genus Acidiphilium are ubiquitous in acidic environments [63]. These heterotrophs are often isolated as contaminants from iron-oxidizing mixed cultures composed of acidophiles like Acidithiobacillus ferrooxidans [64,65] or species related to Ferrovum myxofaciens P3G [58]. In these iron-oxidizing mixed cultures, Acidiphilium spp. enhance the activities of these chemolithoautotrophs in bioleaching. In return, Acidiphilium spp. seem to benefit from their secreted metabolites and biomass remnants [28,66]. Acidiphilium spp. have been also directly isolated from acidic mine drainage waters and sediments [14,67] and from acidic hypersaline river sediments in Australia, where they can make up high relative fractions of the microbial community [68].
Independent of their original ecological niche, all seven Acidiphilium spp. analysed by pangenomics show high similarities regarding their functional genome organization. Not surprisingly, both strains isolated from the same lake share the highest number of accessory gene clusters (93 gene clusters), with most of them being related to hypothetical proteins except a few related to transporters. Genes encoding different mechanisms of aggregation were present in all seven genomes, i.e., genes involved in the synthesis and secretion of EPS, suggesting that these mechanisms of aggregation are common in Acidiphilium spp. Indeed, all three Acidiphilium isolates tested in this study were able to aggregate to some extent, even without PEA addition. This morphological feature observed in Acidiphilium isolates has been previously documented, for example, the salt-tolerant Acidiphilium strain, AusYE3-1, also forms flocs and alters cell shapes from rod-shaped or coccobacillus to filamentous structures when stressed under high salt concentrations [68].
Our study shows PEA enhanced aggregation of all Acidiphilium strains tested, but not of other acidophiles [15,17] also present in iron snow. However, the PEA enhanced aggregate formation of Acidiphilium sp. C61 was less pronounced (Figure 2a) compared to the high number of large macroscopic cell aggregates formed by cultures of Acidiphilium sp. C61 soon after isolation from iron snow [17]. In that previous study, increased growth in the presence of 10 µM PEA was also observed, which could not be repeated in our study, suggesting adaptations during extended laboratory incubation of Acidiphilium sp. C61.
Based on our previous model [17], we anticipated that PEA induced gene expression changes would primarily be related to motility similar to its role in Proteus mirabilis [22,23]. However, the assembled genome of Acidiphilium sp. C61 lacks the flhDC gene cluster present in P. mirabilis, and flagellar motility was not negatively affected by PEA addition. Motility still seems to be essential for Acidiphilium sp. C61, as the six genes involved in flagella biosynthesis were even slightly upregulated. This finding agrees with the results of a metaproteomic approach, which detected many flagellin domain proteins from Acidiphilium spp. in iron snow samples [15]. Furthermore, chemotaxis sensor proteins were downregulated in the presence of PEA, enabling more smooth swimming. Thus, flagellar motility might help Acidiphilium sp. C61 join iron oxidizers, like Acidithrix sp. C25 in the growing aggregate, then again, there may not be sufficient time for the microorganism to switch from a pelagic to an attached lifestyle.
Acidiphilium, Acidithrix, Acidocella, and Ferrovum spp. can make up 53% of the total bacterial community of aggregates formed in acidic lignite lakes [15]. In these shallow lakes, iron snow forms a continuous shower of iron minerals, (in)organic matter and microorganisms (∼108–1010 cells (g dry wt−1)) rapidly falling through the water column to the sediment [5,69,70]. Thus, there is only a short lifespan of these pelagic aggregates, which consequently means there is only limited time for microbial-coordinated activities, and for energy and matter fluxes to occur within these aggregates. Although acyl-homoserine lactone (AHL) mediated gene regulation has been shown to influence EPS production and biofilm formation in many proteobacteria, including A. ferrooxidans [71], we could not find autoinducer synthesis or receptor genes linked to quorum sensing in the genome of Acidiphilium sp. C61. Thus, communication appears to occur via other interaction mechanisms mediated by diffusive exometabolites (infochemicals).
Bacterial EPS is usually composed of a mixture of polysaccharides, proteins, lipids, and extracellular DNA (eDNA) [72,73]; however, the main constituents of EPS extracted from Acidiphilium strain 3.2Sup(5) are proteins and carbohydrates mostly composed of carboxylic, hydroxylic, and amino groups [74]. Although we observed the upregulation of several genes for exopolysaccharide precursor synthesis (e.g., UDP-glucose, UDP-galactose) and capsular polysaccharide exporters in the presence of PEA, the overall expression pattern of genes involved in polysaccharide synthesis, as well as autotransporters, were inconsistent. Thus, we cannot conclude that biofilm formation, in general, is enhanced in the presence of PEA, nor can we explicitly conclude the mechanisms involved in Acidiphilium sp. C61 biofilm formation. Similarly, we did not detect significantly enhanced eDNA concentrations, indicating eDNA is likely not a primary constituent of EPS secreted by Acidiphilium sp. C61 and Acidiphilium sp. C61 may prefer to aggregate with other cells over forming biofilms.
The high surface area of the poorly crystalline iron mineral schwertmannite, which forms the inorganic matrix of iron snow [13,69], favors adsorption of organic matter that are ideal substrates for Acidiphilium spp. [14,15]. The above mentioned metaproteomic approach also identified Acidiphilium-related glucose uptake proteins in iron snow [15]. The genome of Acidiphilium sp. C61 contains ABC transporters for the uptake of ribose, fructose, and xylose (Figure 4). In contrast to the genome of Acidiphilium sp. JA12-A1 that lives in co-culture with Ferrovum sp. JA12 [58], we did not find polysaccharide-hydrolyzing enzymes, such as β-glucosidases, or break down EPS or cell envelope polysaccharides from decaying cells endoglucanases in Acidiphilium sp. C61. However, glycoside hydrolase, alpha-amylase, beta-N-acetylhexosaminidase, and glucoamylase were present in all Acidiphilium spp. based on the pangenomic analysis (GC_1878, GC_1672, GC_1296, GC_1827) (Table S2-3). In addition, Acidphilium sp. C61 possesses one more unique glycoside hydrolase (GC_6119), whereas another glycosidase (GC_1572) is present in the other six Acidiphilium strains. The capacity for polysaccharide degradation seems to be a common trait for Acidiphilium spp., but individual differences exist between the strains. Thus, these individual differences allow for niche differentiation and also ensures complementarity, since a diverse mixture of strains will colonize specific habitats.
In general, sugar compounds appear to be the preferred carbon source for biomass production in all Acidiphilium sp. We identified full sets of genes of the pentose phosphate pathway, compensating for the incomplete glycolysis pathway, a complete tricarboxylic acid (TCA) cycle, and genes encoding all pathways necessary for the synthesis of proteinogenic amino acids, nucleotide, and fatty acid biosynthesis. Acidiphilium sp. C61 is capable of urea uptake, a unique trait among Acidiphilium sp. Thus, it can be characterized as a prototrophic cell, able to synthesize all the compounds needed for growth listed above without the need for a partner organism. Different Acidiphilium strains present in complex communities appears to release a diverse suite of glycoside hydrolases and glucosidases to utilize the organic substances secreted by other community members or derived from microbial cell decay. In return, Acidiphilium spp. provide the chemolithoautotrophs with elevated CO2 concentrations locally, which is advantageous especially in low pH environments, such as acidic coal mining lakes. This type of interspecies carbon transfer has been previously described for acidophilic mixed cultures containing Acidiphilium cryptum and Acidithiobacillus ferrooxidans [75] and other mixed cultures derived from a pilot plant for remediation of acid mine drainage (AMD) containing Acidiphilium sp. JA12-A1 and an iron oxidizer related to Ferrovum myxofaciens P3G [76].
To our surprise, PEA did not preferentially affect one or more mechanisms of aggregate formation in Acidiphilium but induced upregulation of the central cellular metabolism by affecting more than 50% of the genes involved in glycolysis, the TCA cycle, and oxidative phosphorylation. Similarly, the synthesis of ribosomes, amino acid biosynthesis and transcription, as well as secretion systems, were stimulated. This broad range of affected upregulated genes points to a more general stimulatory mechanism of PEA, similar to its general role as a neurotransmitter [18] and stimulator for the release of biogenic amines in humans [20]. Thus, it is probable that these Acidiphilium cells are just more active in iron snow in the presence of the infochemical PEA released by Acidithrix sp. C25.
After the formation of iron minerals at the oxic-anoxic interface, iron snow will reach anoxic conditions in the hypolimnion. Since Fe3+ is energetically much more favorable as an electron acceptor at acidic compared to pH neutral conditions [77], the majority of the chemolithoautotrophic Fe2+ oxidizers are also capable of Fe3+ reduction, including Acidithrix sp. C25 [13]. These heterotrophic Acidiphilium spp., as well as other heterotrophic acidophiles, are also capable of Fe3+ reduction even in the presence of oxygen [78,79,80]. Thus, single cells within the iron snow aggregates may begin to respire Fe3+ in the redoxcline, even at low oxygen concentrations. Switching to this anaerobic metabolism requires activation, as genes responsible for Fe3+ reduction in Acidiphilium spp. do not seem to be constitutively expressed [78]. Although the Fe3+ reduction mechanism in Acidiphilium spp. has not yet been revealed in detail, different membrane-associated proteins potentially related to electron transport chain genes have been identified in iron snow, including OmpA/MotB domain proteins, TonB-dependent receptor, and ApcA [15]. Genome assembly of Acidiphilium sp. C61 reveals MsrQ that can bind to two b-type hemes via conserved histidine residues along with MsrP; these proteins form a methionine sulfoxide reductase operon functioning to repair oxidized periplasmic proteins [81]. Additionally, the cytosolic NAD(P)H flavin reductase (Fre) has been shown to function as a proficient electron donor to MsrQ moieties and the soluble dehydrogenase partner, in Escherichia coli, for example [81]. These findings suggest that Fre and MsrPQ might form a membrane-spanning two-component system for electron transfer (Figure 4). Because MsrPQ is involved in oxidative stress response, specifically in the repair of oxidized periplasmic proteins, such as oxidized methionine residues, there is a potential role for the MsrPQ operon in the maintenance of the activated methyl cycle, which can be remotely linked to iron reduction via the transsulfuration pathway. We also identified a gene coding for an arsenate reductase (AcpC61_1183). Previous studies suggest that TetH or ArsH have the potential to mediate Fe3+ reduction in acidophiles [62,82,83]. However, since we did not perform RNA-seq analysis of Acidiphilium sp. C61 under iron-reducing conditions, we do not know how PEA would affect its anaerobic metabolism.
5. Conclusions
Aggregation appears to be a common mechanism in all Acidiphilium spp., since nearly 4% of their shared gene clusters are associated with mechanisms responsible for aggregation, including autoaggregation, motility (flagellar assembly, chemotaxis), and biofilm formation (exopolysaccharide biosynthesis and secretion). All genes associated with these mechanisms were transcribed under our incubation conditions; however, RNA-seq data did not show clear evidence that PEA affected aggregate formation directly. Inconsistent gene expression patterns relating to the formation and secretion of EPS and flagellar-based motility, despite enhanced aggregate formation with the addition of PEA, suggests this compound functions as an infochemical regulating other cellular mechanisms, and not aggregation mechanisms directly. In fact, Acidiphilium cells seem to retain motility within the aggregates. We did observe induced upregulation of glycolysis, the TCA cycle, oxidative phosphorylation, and synthesis of ribosomes, although these activities were not linked to enhanced growth. Degradation of polysaccharides appears to be a major function within the heterotrophic Alphaproteobacterial genus Acidiphilium, which is optimized by the complementarity of specific genes present in unique strains in addition to shared core functions.
Supplementary Materials
Supplementary materials can be found at https://www.mdpi.com/2076-2607/8/3/314/s1. Figure S1: Fe(II) consumption of Ferrovum sp. PN-J47 supplemented with different concentrations of PEA (0, 10 and 50 µM), Table S1: Genome features of Acidiphilium sp. C61 in comparison to six other Acidiphilium spp., Table S2: Gene clusters (GCs) involved in aggregation, unique gene clusters, and polysaccharide degradtion in Acidiphilium sp. C61 by Pangenomics, Table S3: Aggregation genes identified in the genome of Acidiphilium sp. C61, Table S4: Genes of central metabolism present in the genome of Acidiphilium sp. C61, Table S5: Iron-reduction related genes (cytochrome c, electron transfer, iron reductase) identified in Acidiphilium sp. C61, Table S6: Top 10% of highly expressed genes of Acidiphilium sp. C61 in the presence of 10 µM PEA, Table S7: Summary of differential expressed genes in Acidiphilium sp. C61 after 10 µM PEA addition, Table S8: General gene expression pattern in Acidiphilium sp. C61 supplemented with 10 µM PEA addition.
Author Contributions
Q.L. performed the laboratory work and bioinformatics. R.E.C., and C.-E.W. supervised the lab work and data analysis. K.K. conceived and designed the experiments and acquired funding. Q.L. wrote the original draft. K.K., R.E.C., and C.-E.W. reviewed and edited the manuscript. All authors have read and agreed to the published version of the manuscript.
Funding
This work was supported in part by the Jena School for Microbial Communication (JSMC) graduate school and by the Collaborative Research Centre Chemical Mediators in Complex Biosystems (SFB 1127 ChemBioSys) of the Friedrich Schiller University Jena, both funded by the Deutsche Forschungsgemeinschaft (DFG). Additional support for this research was kindly provided by the German Centre for Integrative Biodiversity Research (iDiv) Halle-Jena-Leipzig, also funded by the Deutsche Forschungsgemeinschaft (DFG). Further support for this research was provided by the Carl Zeiss Foundation (Carl Zeiss Stiftung) to Q.L.
Acknowledgments
The authors thank Jens D. Wurlitzer (Friedrich Schiller University Jena) for technical assistance in the laboratory and Jiro F. Mori (Yokohama City University) for extraction of genomic DNA used for genome sequencing.
Conflicts of Interest
There is no conflict of interest claimed by the authors. The funders had no role in the design of the study; in the collection, analyses, or interpretation of data; in the writing of the manuscript, or in the decision to publish the results.
References
- Alldredge, A.L.; Silver, M.W. Characteristics, dynamics and significance of marine snow. Prog. Oceanogr. 1988, 20, 41–82. [Google Scholar] [CrossRef]
- Simon, M.; Grossart, H.-P.; Schweitzer, B.; Ploug, H. Microbial ecology of organic aggregates in aquatic ecosystems. Aquat. Microb. Ecol. 2002, 28, 175–211. [Google Scholar] [CrossRef] [Green Version]
- Thornton, D. Diatom aggregation in the sea: Mechanisms and ecological implications. Eur. J. Phycol. 2002, 37, 149–161. [Google Scholar] [CrossRef]
- Grossart, H.-P.; Simon, M. Limnetic macroscopic organic aggregates (lake snow): Occurrence, characteristics, and microbial dynamics in Lake Constance. Limnol. Oceanogr. 1993, 38, 532–546. [Google Scholar] [CrossRef]
- Reiche, M.; Lu, S.; Ciobotǎ, V.; Neu, T.R.; Nietzsche, S.; Rösch, P.; Popp, J.; Küsel, K. Pelagic boundary conditions affect the biological formation of iron-rich particles (iron snow) and their microbial communities. Limnol. Oceanogr. 2011, 56, 1386–1398. [Google Scholar] [CrossRef]
- Dang, H.; Lovell, C. Microbial surface colonization and biofilm development in marine environments. Microbiol. Mol. Biol. Rev. 2016, 80, 91–138. [Google Scholar] [CrossRef] [PubMed] [Green Version]
- Gram, L.; Grossart, H.-P.; Schlingloff, A.; Kiørboe, T. Possible quorum sensing in marine snow bacteria: Production of acylated homoserine lactones by Roseobacter strains isolated from marine snow. Appl. Environ. Microbiol. 2002, 68, 4111–4116. [Google Scholar] [CrossRef] [Green Version]
- Blodau, C. A review of acidity generation and consumption in acidic coal mine lakes and their watersheds. Sci. Total Environ. 2006, 369, 307–332. [Google Scholar] [CrossRef]
- Küsel, K. Microbial cycling of iron and sulfur in acidic coal mining lake sediments. Water Air Soil Pollut. Focus 2003, 3, 67–90. [Google Scholar]
- Bigham, J.M.; Schwertmann, U.; Traina, S.J.; Winland, R.L.; Wolf, M. Schwertmannite and the chemical modeling of iron in acid sulfate waters. Geochim. Cosmochim. Acta 1996, 60, 2111–2121. [Google Scholar] [CrossRef]
- Wang, H.; Bigham, J.M.; Tuovinen, O.H. Formation of schwertmannite and its transformation to jarosite in the presence of acidophilic iron-oxidizing microorganisms. Mater. Sci. Eng. C 2006, 26, 588–592. [Google Scholar] [CrossRef]
- Ciobotǎ, V.; Lu, S.; Tarcea, N.; Rösch, P.; Küsel, K.; Popp, J. Quantification of the inorganic phase of the pelagic aggregates from an iron contaminated lake by means of Raman spectroscopy. Vib. Spectrosc. 2013, 68, 212–219. [Google Scholar] [CrossRef]
- Mori, J.F.; Lu, S.; Händel, M.; Totsche, K.U.; Neu, T.R.; Iancu, V.V.; Tarcea, N.; Popp, J.; Küsel, K. Schwertmannite formation at cell junctions by a new filament-forming Fe(II)-oxidizing isolate affiliated with the novel genus Acidithrix. Microbiology 2016, 162, 62–71. [Google Scholar] [CrossRef] [PubMed]
- Küsel, K.; Dorsch, T.; Acker, G.; Stackebrandt, E. Microbial reduction of Fe(III) in acidic sediments: Isolation of Acidiphilium cryptum JF-5 capable of coupling the reduction of Fe(III) to the oxidation of glucose. Appl. Environ. Microbiol. 1999, 65, 3633–3640. [Google Scholar] [CrossRef] [Green Version]
- Lu, S.; Chourey, K.; Reiche, M.; Nietzsche, S.; Shah, M.B.; Neu, T.R.; Hettich, R.L.; Küsel, K. Insights into the structure and metabolic function of microbes that shape pelagic iron-rich aggregates (“Iron snow”). Appl. Environ. Microbiol. 2013, 79, 4272–4281. [Google Scholar] [CrossRef] [PubMed] [Green Version]
- Lu, S.; Gischkat, S.; Reiche, M.; Akob, D.M.; Hallberg, K.B.; Küsel, K. Ecophysiology of Fe-cycling bacteria in acidic sediments. Appl. Environ. Microbiol. 2010, 76, 8174–8183. [Google Scholar] [CrossRef] [Green Version]
- Mori, J.F.; Ueberschaar, N.; Lu, S.; Cooper, R.E.; Pohnert, G.; Küsel, K. Sticking together: Inter-species aggregation of bacteria isolated from iron snow is controlled by chemical signaling. ISME J. 2017, 11, 1075–1086. [Google Scholar] [CrossRef] [Green Version]
- Irsfeld, M.; Spadafore, M.; Prüß, B. β-Phenylethylamine, a small molecule with a large impact. Webmedcentral 2013, 4, 1–15. [Google Scholar]
- Paterson, I.A.; Juorio, A.V.; Boulton, A.A. 2-Phenylethylamine: A modulator of catecholamine transmission in the mammalian central nervous system? J. Neurochem. 1990, 55, 1827–1837. [Google Scholar] [CrossRef]
- Rothman, R.B.; Baumann, M.H. Balance between dopamine and serotonin release modulates behavioral effects of amphetamine-type drugs. Ann. N. Y. Acad. Sci. 2006, 1074, 245–260. [Google Scholar] [CrossRef]
- Marcobal, A.; De las Rivas, B.; Landete, J.M.; Tabera, L.; Muñoz, R. Tyramine and phenylethylamine biosynthesis by food bacteria. Crit. Rev. Food Sci. Nutr. 2012, 52, 448–467. [Google Scholar] [CrossRef] [PubMed] [Green Version]
- Stevenson, L.G.; Rather, P.N. A novel gene involved in regulating the flagellar gene cascade in Proteus mirabilis. J. Bacteriol. 2006, 188, 7830–7839. [Google Scholar] [CrossRef] [PubMed] [Green Version]
- Stevenson, L.G.; Szostek, B.A.; Clemmer, K.M.; Rather, P.N. Expression of the DisA amino acid decarboxylase from Proteus mirabilis inhibits motility and class 2 flagellar gene expression in Escherichia coli. Res. Microbiol. 2013, 164, 31–37. [Google Scholar] [CrossRef] [PubMed]
- Alavi, M.; Belas, R. Surface sensing, swarmer cell differentiation, and biofilm development. Methods Enzymol. 2001, 336, 29–40. [Google Scholar] [PubMed]
- Belas, R.; Suvanasuthi, R. The ability of Proteus mirabilis to sense surfaces and regulate virulence gene expression involves FliL, a flagellar basal body protein. J. Bacteriol. 2005, 187, 6789–6803. [Google Scholar] [CrossRef] [PubMed] [Green Version]
- Sturgill, G.; Rather, P.N. Evidence that putrescine acts as an extracellular signal required for swarming in Proteus mirabilis. Mol. Microbiol. 2004, 51, 437–446. [Google Scholar] [CrossRef]
- Bridge, T.A.M.; Johnson, D.B. Reductive dissolution of ferric iron minerals by Acidiphilium SJH. Geomicrobiol. J. 2000, 17, 193–206. [Google Scholar]
- Tischler, J.S.; Jwair, R.J.; Gelhaar, N.; Drechsel, A.; Skirl, A.M.; Wiacek, C.; Janneck, E.; Schlömann, M. New cultivation medium for “Ferrovum” and Gallionella-related strains. J. Microbiol. Methods 2013, 95, 138–144. [Google Scholar] [CrossRef]
- Tamura, H.; Goto, K.; Yotsuyanagi, T.; Nagayama, M. Spectrophotometric determination of iron(II) with 1,10-phenanthroline in the presence of large amounts of iron(III). Talanta 1974, 21, 314–318. [Google Scholar] [CrossRef]
- Chin, C.S.; Alexander, D.H.; Marks, P.; Klammer, A.A.; Drake, J.; Heiner, C.; Clum, A.; Copeland, A.; Huddleston, J.; Eichler, E.E.; et al. Nonhybrid, finished microbial genome assemblies from long-read SMRT sequencing data. Nat. Methods 2013, 10, 563–569. [Google Scholar] [CrossRef]
- Gurevich, A.; Saveliev, V.; Vyahhi, N.; Tesler, G. QUAST: Quality assessment tool for genome assemblies. Bioinformatics 2013, 29, 1072–1075. [Google Scholar] [CrossRef]
- Parks, D.H.; Imelfort, M.; Skennerton, C.T.; Hugenholtz, P.; Tyson, G.W. CheckM: Assessing the quality of microbial genomes recovered from isolates, single cells, and metagenomes. Genome Res. 2015, 25, 1043–1055. [Google Scholar] [CrossRef] [PubMed] [Green Version]
- Tanizawa, Y.; Fujisawa, T.; Nakamura, Y. DFAST: A flexible prokaryotic genome annotation pipeline for faster genome publication. Bioinformatics 2018, 34, 1037–1039. [Google Scholar] [CrossRef] [PubMed] [Green Version]
- Kanehisa, M.; Sato, Y.; Morishima, K. BlastKOALA and GhostKOALA: KEGG tools for functional characterization of genome and metagenome sequences. J. Mol. Biol. 2016, 428, 726–731. [Google Scholar] [CrossRef] [PubMed] [Green Version]
- Huang, Y.; Niu, B.; Gao, Y.; Fu, L.; Li, W. CD-HIT Suite: A web server for clustering and comparing biological sequences. Bioinformatics 2010, 26, 680–682. [Google Scholar] [CrossRef] [PubMed]
- Buchfink, B.; Xie, C.; Huson, D.H. Fast and sensitive protein alignment using DIAMOND. Nat. Methods 2015, 12, 59–60. [Google Scholar] [CrossRef]
- Eren, A.M.; Esen, Ö.C.; Quince, C.; Vineis, J.H.; Morrison, H.G.; Sogin, M.L.; Delmont, T.O. Anvi’o: An advanced analysis and visualization platform for ‘omics data. PeerJ 2015, 3, e1319. [Google Scholar] [CrossRef]
- Delmont, T.O.; Eren, E.M. Linking pangenomes and metagenomes: The Prochlorococcus metapangenome. PeerJ 2018, 2018, 1–23. [Google Scholar] [CrossRef] [Green Version]
- Hyatt, D.; Chen, G.L.; LoCascio, P.F.; Land, M.L.; Larimer, F.W.; Hauser, L.J. Prodigal: Prokaryotic gene recognition and translation initiation site identification. BMC Bioinformatics 2010, 11. [Google Scholar] [CrossRef] [Green Version]
- Altschul, S.F.; Gish, W.; Miller, W.; Myers, E.W.; Lipman, D.J. Basic local alignment search tool. J. Mol. Biol. 1990, 215, 403–410. [Google Scholar] [CrossRef]
- Tatusov, R.L.; Natale, D.A.; Garkavtsev, I.V.; Tatusova, T.A.; Shankavaram, U.T.; Rao, B.S.; Kiryutin, B.; Galperin, M.Y.; Fedorova, N.D.; Koonin, E.V. The COG database: New developments in phylogenetic classification of proteins from complete genomes. Nucleic Acids Res. 2002, 29, 22–28. [Google Scholar] [CrossRef] [PubMed]
- Benedict, M.N.; Henriksen, J.R.; Metcalf, W.W.; Whitaker, R.J.; Price, N.D. ITEP: An integrated toolkit for exploration of microbial pan-genomes. BMC Genomics 2014, 15, 8. [Google Scholar] [CrossRef] [PubMed] [Green Version]
- Enright, A.J.; Dongen, S.V.; Ouzounis, C.A. An efficient algorithm for large-scale detection of protein families. Nucleic Acids Res. 2002, 30, 1575–1584. [Google Scholar] [CrossRef]
- Larkin, M.A.; Blackshields, G.; Brown, N.P.; Chenna, R.; Mcgettigan, P.A.; McWilliam, H.; Valentin, F.; Wallace, I.M.; Wilm, A.; Lopez, R.; et al. Clustal W and Clustal X version 2.0. Bioinformatics 2007, 23, 2947–2948. [Google Scholar] [CrossRef] [PubMed] [Green Version]
- Kumar, S.; Stecher, G.; Li, M.; Knyaz, C.; Tamura, K. MEGA X: Molecular evolutionary genetics analysis across computing platforms. Mol. Biol. Evol. 2018, 35, 1547–1549. [Google Scholar] [CrossRef]
- Kopylova, E.; Noé, L.; Touzet, H. SortMeRNA: Fast and accurate filtering of ribosomal RNAs in metatranscriptomic data. Bioinformatics 2012, 28, 3211–3217. [Google Scholar] [CrossRef]
- Quast, C.; Pruesse, E.; Yilmaz, P.; Gerken, J.; Schweer, T.; Yarza, P.; Peplies, J.; Glöckner, F.O. The SILVA ribosomal RNA gene database project: Improved data processing and web-based tools. Nucleic Acids Res. 2013, 41, 590–596. [Google Scholar] [CrossRef]
- Kalvari, I.; Argasinska, J.; Quinones-Olvera, N.; Nawrocki, E.P.; Rivas, E.; Eddy, S.R.; Bateman, A.; Finn, R.D.; Petrov, A.I. Rfam 13.0: Shifting to a genome-centric resource for non-coding RNA families. Nucleic Acids Res. 2017, 46, D335–D342. [Google Scholar] [CrossRef]
- Bushnell, B. BBMap: A fast, accurate, splice-aware aligner. In Proceedings of the Conference: 9th Annual Genomics of Energy & Environment Meeting, Walnut Creek, CA, USA, 19 March 2014. [Google Scholar]
- Li, H.; Handsaker, B.; Wysoker, A.; Fennell, T.; Ruan, J.; Homer, N.; Marth, G.; Abecasis, G.; Durbin, R.; 1000 Genome Project Data Processing Subgroup. The sequence alignment/map format and SAMtools. Bioinformatics 2009, 25, 2078–2079. [Google Scholar] [CrossRef] [Green Version]
- Liao, Y.; Smyth, G.K.; Shi, W. FeatureCounts: An efficient general purpose program for assigning sequence reads to genomic features. Bioinformatics 2014, 30, 923–930. [Google Scholar] [CrossRef] [Green Version]
- R Core Team. R: A Language and Environment for Statistical Computing; R Foundation for Statistical Computing: Vienna, Austria, 2018. [Google Scholar]
- Robinson, M.D.; McCarthy, D.J.; Smyth, G.K. edgeR: A Bioconductor package for differential expression analysis of digital gene expression data. Bioinformatics 2009, 26, 139–140. [Google Scholar] [CrossRef] [PubMed] [Green Version]
- Daims, H.; Brühl, A.; Amann, R.; Schleifer, K.-H.; Wagner, M. The domain-specific probe EUB338 is insufficient for the detection of all bacteria: Development and evaluation of a more comprehensive probe set. Syst. Appl. Microbiol. 1999, 22, 434–444. [Google Scholar] [CrossRef]
- Loy, A.; Lehner, A.; Lee, N.; Adamczyk, J.; Meier, H.; Ernst, J.; Schleifer, K.-H.; Wagner, M. Oligonucleotide microarray for 16S rRNA gene-based detection of all recognized lineages of sulfate-reducing prokaryotes in the environment. Appl. Environ. Microbiol. 2002, 68, 5064–5081. [Google Scholar] [CrossRef] [PubMed] [Green Version]
- Herrmann, M.; Hädrich, A.; Küsel, K. Predominance of thaumarchaeal ammonia oxidizer abundance and transcriptional activity in an acidic fen. Environ. Microbiol. 2012, 14, 3013–3025. [Google Scholar] [CrossRef] [PubMed]
- Tang, L.; Schramm, A.; Neu, T.R.; Revsbech, N.P.; Meyer, R.L. Extracellular DNA in adhesion and biofilm formation of four environmental isolates: A quantitative study. FEMS Microbiol. Ecol. 2013, 86, 394–403. [Google Scholar] [CrossRef] [PubMed] [Green Version]
- Ullrich, S.R.; Poehlein, A.; Voget, S.; Hoppert, M.; Daniel, R.; Leimbach, A.; Tischler, J.S.; Schlömann, M.; Mühling, M. Permanent draft genome sequence of Acidiphilium sp. JA12-A1. Stand. Genomic Sci. 2015, 10, 1–10. [Google Scholar] [CrossRef]
- Ciobotǎ, V.; Burkhardt, E.M.; Schumacher, W.; Rösch, P.; Küsel, K.; Popp, J. The influence of intracellular storage material on bacterial identification by means of Raman spectroscopy. Anal. Bioanal. Chem. 2010, 397, 2929–2937. [Google Scholar] [CrossRef]
- Bird, L.J.; Bonnefoy, V.; Newman, D.K. Bioenergetic challenges of microbial iron metabolisms. Trends Microbiol. 2011, 19, 330–340. [Google Scholar] [CrossRef]
- Magnuson, T.S.; Swenson, M.W.; Paszczynski, A.J.; Deobald, L.A.; Kerk, D.; Cummings, D.E. Proteogenomic and functional analysis of chromate reduction in Acidiphilium cryptum JF-5, an Fe(III)-respiring acidophile. BioMetals 2010, 23, 1129–1138. [Google Scholar] [CrossRef]
- Mo, H.; Chen, Q.; Du, J.; Tang, L.; Qin, F.; Miao, B.; Wu, X.; Zeng, J. Ferric reductase activity of the ArsH protein from Acidithiobacillus ferrooxidans. J. Microbiol. Biotechnol. 2011, 21, 464–469. [Google Scholar] [CrossRef] [Green Version]
- Johnson, D.B.; Hallberg, K.B. The microbiology of acidic mine waters. Res. Microbiol. 2003, 154, 466–473. [Google Scholar] [CrossRef]
- Harrison, A.P.; Jarvis, B.W.; Johnson, J.L. Heterotrophic bacteria from cultures of autotrophic Thiobacillus ferrooxidans: Relationships as studied by means of deoxyribonucleic acid homology. J. Bacteriol. 1980, 143, 448–454. [Google Scholar] [CrossRef] [PubMed] [Green Version]
- Harrison, A.P. The acidophilic Thiobacilli and other acidophilic bacteria that share their habitat. Annu. Rev. Microbiol. 1984, 38, 265–292. [Google Scholar] [CrossRef] [PubMed]
- Johnson, D.B. Geomicrobiology of extremely acidic subsurface environments. FEMS Microbiol. Ecol. 2012, 81, 2–12. [Google Scholar] [CrossRef] [PubMed]
- Hallberg, K.B.; Johnson, D.B. Biodiversity of acidophilic prokaryotes. Adv. Appl. Microbiol. 2001, 49, 37–84. [Google Scholar] [PubMed]
- Lu, S.; Peiffer, S.; Lazar, C.S.; Oldham, C.; Neu, T.R.; Ciobota, V.; Näb, O.; Lillicrap, A.; Rösch, P.; Popp, J.; et al. Extremophile microbiomes in acidic and hypersaline river sediments of Western Australia. Environ. Microbiol. Rep. 2016, 8, 58–67. [Google Scholar] [CrossRef]
- Miot, J.; Jézéquel, D.; Benzerara, K.; Cordier, L.; Rivas-Lamelo, S.; Skouri-Panet, F.; Férard, C.; Poinsot, M.; Duprat, E. Mineralogical diversity in Lake Pavin: Connections with water column chemistry and biomineralization processes. Minerals 2016, 6, 24. [Google Scholar] [CrossRef]
- Peine, A.; Tritschler, A.; Küsel, K.; Peiffer, S. Electron flow in an iron-rich acidic sediment—Evidence for an acidity-driven iron cycle. Limnol. Oceanogr. 2000, 45, 1077–1087. [Google Scholar] [CrossRef]
- Rivas, M.; Seeger, M.; Holmes, D.S.; Jedlicki, E. A Lux-like quorum sensing system in the extreme acidophile Acidithiobacillus ferrooxidans. Biol. Res. 2005, 38, 283–297. [Google Scholar] [CrossRef] [Green Version]
- Stoodley, P.; Sauer, K.; Davies, D.G.; Costerton, J.W. Biofilms as complex differentiated communities. Annu. Rev. Microbiol. 2002, 56, 187–209. [Google Scholar] [CrossRef] [Green Version]
- Zafra, O.; Lamprecht-Grandío, M.; de Figueras, C.G.; González-Pastor, J.E. Extracellular DNA release by undomesticated Bacillus subtilis is regulated by early competence. PLoS ONE 2012, 7. [Google Scholar] [CrossRef] [PubMed] [Green Version]
- Tapia, J.M.; Muñoz, J.; González, F.; Blázquez, M.L.; Malki, M.; Ballester, A. Extraction of extracellular polymeric substances from the acidophilic bacterium Acidiphilium 3.2Sup(5). Water Sci. Technol. 2009, 59, 1959–1967. [Google Scholar] [CrossRef] [PubMed]
- Kermer, R.; Hedrich, S.; Taubert, M.; Baumann, S.; Schlömann, M.; Johnson, D.B.; Seifert, J. Elucidation of carbon transfer in a mixed culture of Acidiphilium cryptum and Acidithiobacillus ferrooxidans using protein-based stable isotope probing. J. Integr. OMICS 2012, 2, 37–45. [Google Scholar]
- Ullrich, S.R.; Poehlein, A.; Tischler, J.S.; González, C.; Ossandon, F.J.; Daniel, R.; Holmes, D.S.; Schlömann, M.; Mühling, M. Genome analysis of the biotechnologically relevant acidophilic iron oxidising strain JA12 indicates phylogenetic and metabolic diversity within the novel genus “Ferrovum”. PLoS ONE 2016, 11, e0146832. [Google Scholar] [CrossRef] [PubMed]
- Nitschke, W.; Bonnefoy, V. Energy acquisition in low pH environments. In Acidophiles: Life in Extremely Acidic Environments; Quatrini, R., Johnson, D.B., Eds.; Caister Academic Press: Poole, UK, 2016; pp. 19–48. [Google Scholar]
- Küsel, K.; Roth, U.; Drake, H.L. Microbial reduction of Fe(III) in the presence of oxygen under low pH conditions. Environ. Microbiol. 2002, 4, 414–421. [Google Scholar] [CrossRef]
- Coupland, K.; Johnson, D.B. Evidence that the potential for dissimilatory ferric iron reduction is widespread among acidophilic heterotrophic bacteria. FEMS Microbiol. Lett. 2008, 279, 30–35. [Google Scholar] [CrossRef] [Green Version]
- Johnson, D.B.; Kanao, T.; Hedrich, S. Redox transformations of iron at extremely low pH: Fundamental and applied aspects. Front. Microbiol. 2012, 3, 1–13. [Google Scholar] [CrossRef] [Green Version]
- Juillan-Binard, C.; Picciocchi, A.; Andrieu, J.P.; Dupuy, J.; Petit-Hartlein, I.; Caux-Thang, C.; Vivès, C.; Nivière, V.; Fieschi, F. A two-component NADPH oxidase (NOX)-like system in bacteria is involved in the electron transfer chain to the methionine sulfoxide reductase MsrP. J. Biol. Chem. 2017, 292, 2485–2494. [Google Scholar] [CrossRef] [Green Version]
- Osorio, H.; Mangold, S.; Denis, Y.; Ñancucheo, I.; Esparza, M.; Johnson, D.B.; Bonnefoy, V.; Dopson, M.; Holmesa, D.S. Anaerobic sulfur metabolism coupled to dissimilatory iron reduction in the extremophile Acidithiobacillus ferrooxidans. Appl. Environ. Microbiol. 2013, 79, 2172–2181. [Google Scholar] [CrossRef] [Green Version]
- Sugio, T.; Taha, T.M.; Takeuchi, F. Ferrous iron production mediated by tetrathionate hydrolase in tetrathionate-, sulfur-, and iron-grown Acidithiobacillus ferrooxidans ATCC 23270 cells. Biosci. Biotechnol. Biochem. 2009, 73, 1381–1386. [Google Scholar] [CrossRef] [Green Version]
Figure 1.
16S rRNA gene phylogenetic tree of Acidiphilium sp. C61 (bold) with other closely related isolates. The tree was reconstructed using the maximum likelihood method. GeneBank accession numbers for sequences are given. Scale bar shows 0.05 change per nucleotide position.
Figure 1.
16S rRNA gene phylogenetic tree of Acidiphilium sp. C61 (bold) with other closely related isolates. The tree was reconstructed using the maximum likelihood method. GeneBank accession numbers for sequences are given. Scale bar shows 0.05 change per nucleotide position.

Figure 2.
Effect of phenethylamine (PEA) on cell phenotype and growth of bacteria. (a) Fluorescence microscopy images of PEA-induced aggregate formation in Acidiphilium sp. C61, Acidiphilium cryptum JF-5, Acidiphilium SJH, and Acidocella sp. C78 incubations amended with increasing concentrations of PEA (0, 10, 50 µM) during aerobic growth. Total nucleic acids in subsamples taken after 3–4 days were stained with SYTO 13. (b) Aerobic growth curves (OD600nm) of Acidiphilium sp. C61, Acidiphilium cryptum JF-5, Acidiphilium SJH, and Acidocella sp. C78 (see methods for growth conditions) incubations grown with increasing PEA concentrations (0 µM, white square; 10 µM, grey square; and 50 µM, black square). Values represent means of triplicate samples (n = 3); error bars represent one standard deviation.

Figure 3.
Genome comparison and identification of overlapping gene clusters (GCs) involved in bacterial aggregation of Acidiphilium sp. C61. (a) Intersect plot of the genome comparison of Acidiphilium sp. C61 with 6 other Acidiphilium sp. The horizontal bar chart in panel (a) corresponds to the total number of GCs found in each Acidiphilium strain. The vertical bar chart in panel (a) depicts the number of shared or unique GCs of intersected set under the corresponding species name and dark connected dots on the bottom panel indicate which Acidiphilium sp. is linked to each intersected set. The orange bar corresponds to the total number of overlapping GCs in all 7 Acidiphilium spp., the yellow bar corresponds to the total number of unique GCs found in Acidiphilium sp. C61, and the red bar corresponds to the total number of unique overlapping GCs between Acidiphilium sp. C61 and Acidiphilium cryptum JF-5, both of which were isolated from the same acidic lake (Lake77). Note, only overlapping GCs with a value greater than 50 are shown. (b) Schematic representation of a subset of overlapping GCs involved in aggregation. The GCs linked to these 3 categories (autoaggregation, biofilm formation, motility) were identified based on homologous functions to genes encoding for known aggregation mechanisms. Briefly, the 1701 shared GCs present in all Acidiphilium spp. were manually inspected based on annotated gene functions. Amino acid sequences of overlapping GCs linked to autoaggregation, biofilm formation, and motility were subset and compared to the Acidiphilium sp. C61 genome using BLAST (autoaggregation) or annotated using dfast (biofilm formation and motility). The IDs (GCs_ID) and corresponding annotated functions (GCs_Product) for the identified GCs are shown. In some cases, multiple GCs encode for the same function.

Figure 4.
Genomic potential of Acidiphilium sp. C61, based on gene annotations described in the newly sequenced Acidiphilium sp. C61 genome. Here, the energy production pathway, oxidative phosphorylation pathway, sugar transporters, as well as all potential mechanisms (exopolysaccharide production, flagellar motility) of aggregate formation are included. Also shown are potential mechanisms of iron reduction derived from (1) previous publications [59,60] describing potential iron-reduction machinery in other acidic iron reducers, and (2) genes identified in the Acidiphilium sp. C61 genome with significant homology to iron reduction machinery described in other well-characterized iron-reducing bacteria, for example, Shewanella. ArsBC = arsenate reductase subunits B/C, MCPs = methyl-accepting chemotaxis proteins, CheA = chemotaxis protein CheA, CheY = chemotaxis protein CheY, EPS = extracellular polymeric substance, ED pathway = Entner–Doudoroff pathway, Rbs = ribose transport protein, Frc = fructose transport protein, Xyl = xylose transport protein, Urt = urea transport protein, Liv = branched-chain amino acid transport protein, Afu = iron transport protein, Kps = capsular polysaccharide export protein.

Figure 5.
Differential gene expression profiling of Acidiphilium sp. C61 upon PEA (10 µM) supplementation. (a) Volcano plot of differentially expressed genes (DEGs) with statistical significance and fold change in the control and treatment group. Significantly differentially expressed genes are defined by a log2FC (log2 fold change) > 0.58 or log2FC < –0.58, log2 counts per million (log2 CPM) > 6, and an adjusted p-value FDR (false discovery rate) < 0.05. Each dot represents a single expressed gene. Red dots represent upregulated genes, blue dots represent downregulated genes, and black dots represent genes not upregulated or downregulated. (b) Gene expression patterns of selected KEGG pathways in Acidiphilium sp. C61 incubations with 10 μM PEA. Each bubble denotes one gene and the bubble size indicates log2 CPM values. Red and blue bubbles represent up- and downregulated genes, while black bubbles represent non-significantly differentially expressed.

Figure 6.
Effect of PEA on eDNA release and growth in Acidiphilium sp. C61. (a) Growth curve of Acidiphilium sp. C61 culture supplemented with different concentrations of PEA (0 µM, white; 10 µM, grey; 50 µM, black), n = 3. (b) eDNA concentration in cultures of Acidiphilium sp. C61 supplemented with different PEA concentrations. (c) Bacterial 16S rRNA gene copies numbers mL−1 on days 0, 2, 4, 6 of the incubation were quantified and compared among Acidiphilium sp. C61 cultures with and without PEA.

© 2020 by the authors. Licensee MDPI, Basel, Switzerland. This article is an open access article distributed under the terms and conditions of the Creative Commons Attribution (CC BY) license (http://creativecommons.org/licenses/by/4.0/).
Share and Cite
MDPI and ACS Style
Li, Q.; Cooper, R.E.; Wegner, C.-E.; Küsel, K. Molecular Mechanisms Underpinning Aggregation in Acidiphilium sp. C61 Isolated from Iron-Rich Pelagic Aggregates. Microorganisms 2020, 8, 314. https://doi.org/10.3390/microorganisms8030314
AMA Style
Li Q, Cooper RE, Wegner C-E, Küsel K. Molecular Mechanisms Underpinning Aggregation in Acidiphilium sp. C61 Isolated from Iron-Rich Pelagic Aggregates. Microorganisms. 2020; 8(3):314. https://doi.org/10.3390/microorganisms8030314
Chicago/Turabian StyleLi, Qianqian, Rebecca E. Cooper, Carl-Eric Wegner, and Kirsten Küsel. 2020. "Molecular Mechanisms Underpinning Aggregation in Acidiphilium sp. C61 Isolated from Iron-Rich Pelagic Aggregates" Microorganisms 8, no. 3: 314. https://doi.org/10.3390/microorganisms8030314
Note that from the first issue of 2016, this journal uses article numbers instead of page numbers. See further details here.