Article

Preliminary Evidence for the Role Played by South Westerly Wind Strength on the Marine Diatom Content of an Antarctic Peninsula Ice Core (1980–2010)

British Antarctic Survey, High Cross, Madingley Road, Cambridge CB3 0ET, UK
*
Author to whom correspondence should be addressed.
Geosciences 2020, 10(3), 87; https://doi.org/10.3390/geosciences10030087
Submission received: 31 December 2019 / Revised: 5 February 2020 / Accepted: 18 February 2020 / Published: 26 February 2020

Abstract

:
Winds in the Southern Ocean drive exchanges of heat and carbon dioxide between the ocean and atmosphere. Wind dynamics also explain the dominant patterns of both basal and surface melting of glaciers and ice shelves in the Amundsen and Bellingshausen Seas. Long records of past wind strength and atmospheric circulation are needed to assess the significance of these recent changes. Here we present evidence for a novel proxy of past south westerly wind (SWW) strength over the Amundsen and Bellingshausen Seas, based on diatoms preserved in an Antarctic Peninsula ice core. Ecological affinities of the identified diatom taxa indicate an almost exclusively marine assemblage, dominated by open ocean taxa from the Northern Antarctic Zone (NAZ). Back-trajectory analysis shows the routes of air masses reaching the ice core site and reveals that many trajectories involve contact with surface waters in the NAZ of the Amundsen and Bellingshausen Seas. Correlation analyses between ice core diatom abundance and various wind vectors yield positive and robust coefficients for the 1980–2010 period, with average annual SWW speeds exhibiting the strongest match. Collectively, the data presented here provide new evidence that diatoms preserved in an Antarctic Peninsula ice core offer genuine potential as a new proxy for SWW strength.

1. Introduction

In the Antarctic Peninsula (AP) region, greatly accelerated warming over the second half of the 20th Century is attributed to a poleward shift of the southern westerly wind (SWW) belt associated with a shift to a more positive phase of the Southern Annular Mode (an index of the pressure gradient between the mid and high southern latitudes) in summer [1]. These circulation changes contribute to the flow of warmer air masses over the AP, resulting in increased snowfall in the region [2], and propel eddies of relatively warm Circumpolar Deep Water onto the continental shelf [3,4]. In the Amundsen Sea Embayment (ASE), surface velocities of outlet glaciers have accelerated over recent decades [5], along with grounding line retreat [6] and significant thinning of the West Antarctic ice sheet upstream from the ASE [7]. Estimates suggest that, if the thinning and retreat remains unchecked, glacial discharge in the ASE alone could raise global sea level 25 cm by 2100 [8]. Melting of basal ice from outlet glaciers and ice shelves by wind-forced incursions of Circumpolar Deep Water is likely a key mechanism behind the recent observed changes in the ASE [9]. A former study using satellite laser altimetry concludes that wind forcing could explain the dominant patterns of both sub-marine and surface melting in the ASE and coastal AP [10]. To assess the significance of these recent wind changes and their impact on Antarctic mass balance, an extended record of past wind strength and atmospheric circulation is needed.
Few instrumental records of winds exist within the high southern latitudes, limiting our ability to assess the role of wind strength and synoptic circulation on Antarctic climate, glacial and oceanographic changes. There are no permanent research stations along the ≈3700 km Pacific sector coastline of West Antarctica between Rothera Research Station on the western AP and McMurdo and Scott Base stations near the western Ross Ice Shelf. Much of our understanding of climate variability in this region therefore comes from the reanalysis datasets which provide the best representation of climate in the high southern latitudes, but only after 1979 when satellite observations were assimilated into the reanalysis models [11]. The accuracy of longer, pre-satellite reanalysis data is impossible to assess in the absence of empirical or proxy data over similar timescales. As such, proxy-derived records of Antarctic climate variability provide the best available resource with which to assess how well models represent past (pre-satellite) climate variability and consequently, how well they are able to predict future climate change. Reconstructing SWW speeds in the Amundsen and Bellingshausen Seas would be particularly valuable as the strength of SWW to the north of the ASE reflects the longitudinal position of the Amundsen Sea low, a feature that controls much of the climate over West Antarctica [12].
Ice cores provide a wealth of information about past climate, excellent age control and overlap with instrumental records [13]. The chemical composition of ice reflects changes in atmospheric composition and circulation, while patterns in the seasonal deposition of chemical species allows accurate dating of ice cores at annual and sub-annual resolution [14].
To date, ice core proxies for atmospheric circulation have relied on a variety of soluble and insoluble mineral fractions to determine dust concentrations in ice, most commonly insoluble particles and non-sea-salt calcium (nssCa) concentrations [15,16]. As these methods are based on the terrestrial component of the dust aerosol, they are strongly controlled by conditions in the source region(s) [17,18,19]. In addition to wind strength and direction, any changes in humidity, temperature, vegetation cover, land-use, area and/or elevation of source will influence the availability and entrainment of dust. Even under constant winds, a more (less) arid climate would increase (reduce) the amount of dust entrained into the atmosphere and lead to higher (lower) dust concentrations in the ice. Establishing a marine-based wind proxy for Antarctic ice core studies affords the potential to avoid the biases associated with terrestrial dust aerosols and to simplify the possible atmospheric transport pathways (trajectories) as marine aerosols are more consistently available and must be entrained at sea level.
Diatoms are particularly effective proxies at high southern latitudes as they are diverse, sensitive to oceanographic conditions, responsive to small environmental changes and abundant where other conventional proxies are typically scarce [20,21,22,23]. Diatoms are unicellular, autotrophic algae with a siliceous skeleton (frustule) that inhabit aquatic environments throughout the world, from moist soils and intertidal surfaces, to pelagic and benthic marine settings, freshwater ponds and lakes, melt-water pools, sea-ice brine channels and cryconite holes [24]. Diatom cells may be solitary or colonial (connected by mucous filaments and/or siliceous structures) and are commonly between 2–200 microns in diameter or length, although some frustules are up to 2 mm long. Diatoms provide a range of proxies that are widely used in paleoenvironmental studies of Cenozoic freshwater and marine habitats [25,26].
Diatom-based ecological and paleoenvironmental studies rely on accurate determination of the relative proportions of diatom taxa to quantify assemblage composition. Here we utilize diatoms as particle tracers. As fragments of large diatoms are often larger than whole valves of small diatoms, we do not discriminate between fragments and whole valves and include all diatom remains into the ‘total diatom content’. Although fragmentation compromises the ability to identify taxa, some fragments retain sufficiently distinctive features to make an accurate determination of genus and occasionally species.
Aeolian transport of diatoms occurs over long distances [27,28] and, where species have been identified, the diatom ecological affinities have been used to infer the potential source region(s) and transport pathway(s) [29,30,31,32]. Both marine and freshwater diatoms have been found in modern terrestrial ice masses as a result of aeolian transport [29,30,31,33,34,35]. In Antarctica, early studies of wind-carried diatoms were predominantly aimed at resolving whether the presence of marine diatoms in glacigenic terrestrial sediments were wind-transported ‘contaminants’ or glacially-reworked ‘in-situ’ components, commonly referred to as the ‘Sirius debate’ [33,36,37,38], with implications for the stability of ice sheets and ice stream dynamics. More recently, Delmonte et al. [15] attributed the presence of diatom fragments in dust samples extracted from glacial ice in the Dome B ice core, to enhanced transport from the exposed continental shelf and glacial-outwash sediments of Patagonia and Scherer et al. [39] used Pliocene climate and ice sheet models to explore scenarios that could explain the presence of marine diatoms in Transantarctic Mountain tillites. Despite existing literature showing the potential for wind-transported diatoms to be a proxy for atmospheric circulation [40,41], this potential has not been fully exploited in Antarctic ice core studies [24,30,31].
Here we present the feasibility of diatoms contained within annual ice layers, to provide a proxy for wind strength over the Amundsen and Bellingshausen Seas. Using diatom assemblage composition and pathways of wind-blown dispersion (referred to as air mass back trajectories) we discuss the likely source region, transport and other environmental influences on the diatom record preserved in the ice.

2. Materials and Methods

The 136 m Ferrigno ice core was drilled at the ice divide between the Ferrigno and Pine Island Glaciers on the Bryan Coast in Ellsworth Land, West Antarctica (74.57° S, 86.90° W, 1354 m.a.s.l.; Figure 1). The ice core dates back to 1702 AD [42] and the period investigated in this study (1980–2010) is in the top 26 m. The snow accumulation is converted to meters of water equivalent (m we), based on measured snow density and corrected for thinning using the Nye model [43], which assumes a vertical strain rate and an ice sheet that is frozen to the bed. Snow accumulation at this site exhibits a semi-annual cycle, peaking in the autumn and spring [44] with an annual average value of 0.42 m we per year (1980–2010). Snow accumulation in this region has increased during the 20th century [45], with a slight positive trend observed at this site since 1979 (+4.58 cm we per decade). Sections of ice were cut at annual resolution based on the seasonal cycle of non-sea salt sulphate that is assumed to peak between November and January such that the estimated dating error for the 1980–2010 interval is ±3 months for each year, with no accumulated error [2,42].
To extract the particulate and diatom content, each annual ice sample was melted in a class-100 clean room used exclusively for ice core analyses, then centrifuged (6 mins at 1200/1600 rpm) and decanted successively until samples were concentrated in 2–5 mL fluid. The decanted water was retained and drained through a 1 μm-filter to collect any suspended particulate content and safeguard against sample loss. The 2–5 mL sample liquid was homogenised and particles disaggregated using brief (≈1 s) exposure to a vortex mixer, pipetted onto a single coverslip (22 × 40 mm), dried in an isolated drying cupboard and then mounted onto a single microscope slide using Norland optical adhesive 61 (refractive index 1.56). The count strategy was tested on eight sample slides. The area of each slide comprised 42 transects, each transect was counted and the subtotals for each transect were tallied and divided by 42 to calculate the actual mean diatom density per transect for each slide. The number of transects required to achieve a representative count was established using a Monte Carlo Simulation. In this simulation X number of random transects were selected, the Monte Carlo Simulation divided the slide into X similar sized groups of transects with one transect randomly selected from each group to promote greater coverage across the slide, the actual diatom counts for the respective transects were summed and then divided by X to give a simulated diatom density. For values of X from 1 to 10 this calculation was repeated up to 10,000 times for each slide. The mean of the simulated diatom density for all values of X were plotted to show the number of transects needed to produce a representative diatom count (Figure 2). The simulation indicated that a minimum of five transects spread across the slide had to be counted in order to obtain representative results. Each sample slide was then studied over five transects using an Olympus BX42 compound light microscope at ×400 magnification to determine the diatom content (minimum size approx. 1 μm) and when possible, identify the diatom species. If necessary, magnification was temporarily increased to ×1000 to confirm identification. Taxonomic classification was based on Hasle and Syvertsen [49] integrated with descriptions by Johansen and Fryxell [50] and Cefarelli et al. [51].
Establishing the ecological association of the identified diatom species is an essential step in determining the likely source region(s) of the diatoms contained within the Ferrigno ice core. Ecological associations were based on Armand et al. [20,52], Crosta et al. [21], Esper and Gersonde [53,54], and Zielinkski and Gersonde [23]. ‘Diatom Count’ (n) refers to the raw count of the five transects, ‘Diatom Abundance’ (n a−1) is the diatom concentration in each annual layer that were converted to a ‘Calibrated Diatom Flux’ (n m−2 a−1) by multiplying with the annual water-equivalent accumulation, corrected for thinning [2,43].
Back trajectory analysis is used to examine the source regions and transport pathways of all air masses reaching the Ferrigno ice core location. Three-dimensional air mass back trajectories were provided by the British Atmospheric Data Centre (BADC) trajectory service (available at http://www.ceda.ac.uk) using European Centre for Medium-Range Weather Forecasts (ECMWF) operational archived data. This trajectory service has been used successfully in previous studies of air-mass trajectories to Antarctic ice core sites [44,55,56]. At present ERA-interim is not available with this service so the record is a combination of ERA-40 (1979–2001) and the ECMWF operational forecasts (2002–2012). The trajectories are calculated at ECMWF using six hourly T106 operational analyses of the three components of the wind and surface pressure which are interpolated on to a 2.5° × 2.5° grid. This grid is repeated at nine pressure levels (approx. 950, 850, 750, 650, 550, 450, 350, 250, 150 and 50 mb). The data are linearly interpolated in time and space. The output data consist of latitude, longitude, and pressure of the trajectory every 30 min.

3. Results

3.1. Diatom Assemblage Composition and Ecological Associations

A total of 67 diatom valves and fragments were found among all samples within the period of 1980 to 2010 in the Ferrigno ice core. Of these, 22 are positively identified to genus level or higher, 21 of which are exclusively marine taxa, including: Fragilariopsis, Odontella, Thalassiosira, Chaetoceros (Hyalochaete), Thalassiothrix, Eucampia and Dactyliosolen (Table 1, Figure 3a–d). The single remaining specimen of the identified diatoms is a Nitzschia sp. Species belonging to the Nitzschia genus have a broad distribution across marine, brackish and freshwater habitats ([57,58] and references therein). Given the source region of the Nitzschia specimen is ambiguous, the Nitzschia sp. is excluded from the marine assemblage.
Ecological associations are based on the modern distribution, abundance and tolerance of a species or species group and how these characteristics relate to one or more environmental gradients. Ecological affinities of marine diatoms are most frequently related to oceanographic zones (coastal, frontal, etc.) or particular ocean conditions (upwelling, stratification, etc.) [60]. In the Southern Ocean, circum-Antarctic regions are typically delineated by the fronts, water masses, currents and sea-ice cover [20,21,22,61] (Figure 4).

3.1.1. Fragilariopsis kerguelensis

F. kerguelensis (Figure 3c) is a pelagic marine diatom that is endemic to the Southern Ocean and the dominant diatom in the open ocean zone south of the Polar Front (PF) [21,62] with peak productivity along the southern rim of the PF [63]. F. kerguelensis is common in the iron-limited waters of the Antarctic Circumpolar Current (ACC) [64] and is negatively correlated with sea-ice concentration [65]. Experiments and observations show that the optimal growth of F. kerguelensis occurs in waters of 4–5 °C—the range of summer sea surface temperatures in the PF zone [62,66].

3.1.2. Thalassiosira lentiginosa

T. lentiginosa (Figure 3b) shares a similar distribution to that of F. kerguelensis, primarily focussed in the ACC open ocean zone south of the PF [23]. Whilst F. kerguelensis is most prevalent in spring waters, T. lentiginosa requires less nutrient stock and peak abundances typically occur in the summer/late season [52].

3.1.3. Thalassiothrix Group

The Thalassiothrix group contains several endemic Southern Ocean diatom species that exhibit similar needle-like morphologies and share common ecological affinities, including Thalassiothrix antarctica, Thalassiothrix spp., Trichotoxon rheinboldii and Thalassionema nitzschioides [49,67]. Maximum occurrences of the Thalassiothrix group have been reported in Antarctic and Subantarctic surface waters of the Atlantic and Australian sectors of the Southern Ocean, with peak abundances in the Subantarctic zone, north of the PF [62,68,69] and common occurrence throughout the iron-poor ACC region [64].

3.1.4. Diatom Preservation

F. kerguelensis is heavily silicified and its valves can persist where those of other species have totally or partially dissolved [23]. If dissolution was the prominent control on the ice core diatom assemblage and destructive enough to remove most other species, there would be evidence of partial dissolution in the frustules of the remaining specimens. With respect to F. kerguelensis and many other diatom species, dissolution would be evidenced by widened, distorted and/or conjoined pores on the diatom valves [70]. These dissolution characteristics are not evident on F. kerguelensis valves or other specimens identified from the Ferrigno ice core (see Figure 3b,c).

3.1.5. Summary of Ecological Affinities

Based on the ecological affinities of the positively identified marine diatom specimens (n = 21) present in the 1980–2010 layers of the Ferrigno ice core, 77% (n = 17) originate from the Northern Antarctic Zone (NAZ) (defined as the region between the seasonal sea-ice edge (SSIE) and the Subantarctic Front (SAF); Figure 1a and Figure 4), including the most common taxa: Fragilariopsis kerguelensis and Thalassiosira lentiginosa (Table 1). The paucity of identifiable species associated with sea-ice environments suggests that sea-ice environments are not a source of the diatoms found at the Ferrigno ice core site. The extent of sea-ice will vary and affects the distance open ocean diatoms must be transported. The potential impact of sea-ice cover on the entrainment and transport of diatoms will be considered in the relevant discussion sections to follow.

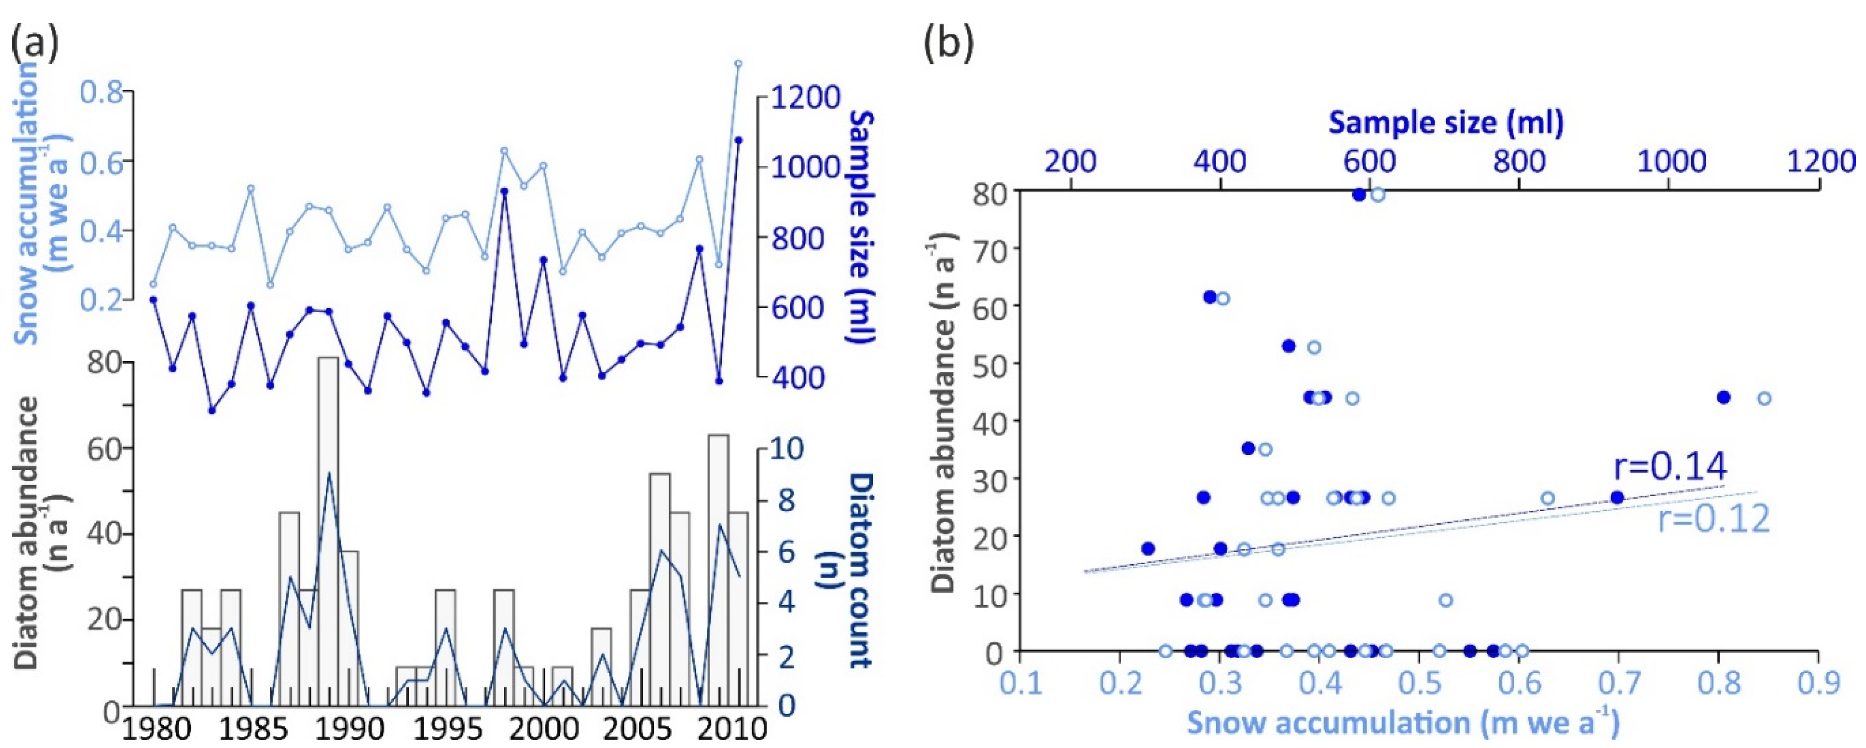
3.2. Diatom Abundance and Variability

Diatom abundances (n a−1) between 1980 and 2010 range from 0 to 79 n a−1 with a mean (± 1 s.d.) of 19.02 (± 21.10). Of the 31 samples counted, 12 were barren and 19 contained diatom material, with diatom abundances of greater than 40 n a−1 in six samples—1987, 1989, 2006, 2007, 2009 and 2010 (Figure 5a). Correlation analysis of diatom abundance with indices of ice volume show that the Ferrigno diatom record has a very weak correlation with sample size (r = 0.14) and snow accumulation (r = 0.12; Figure 5b).

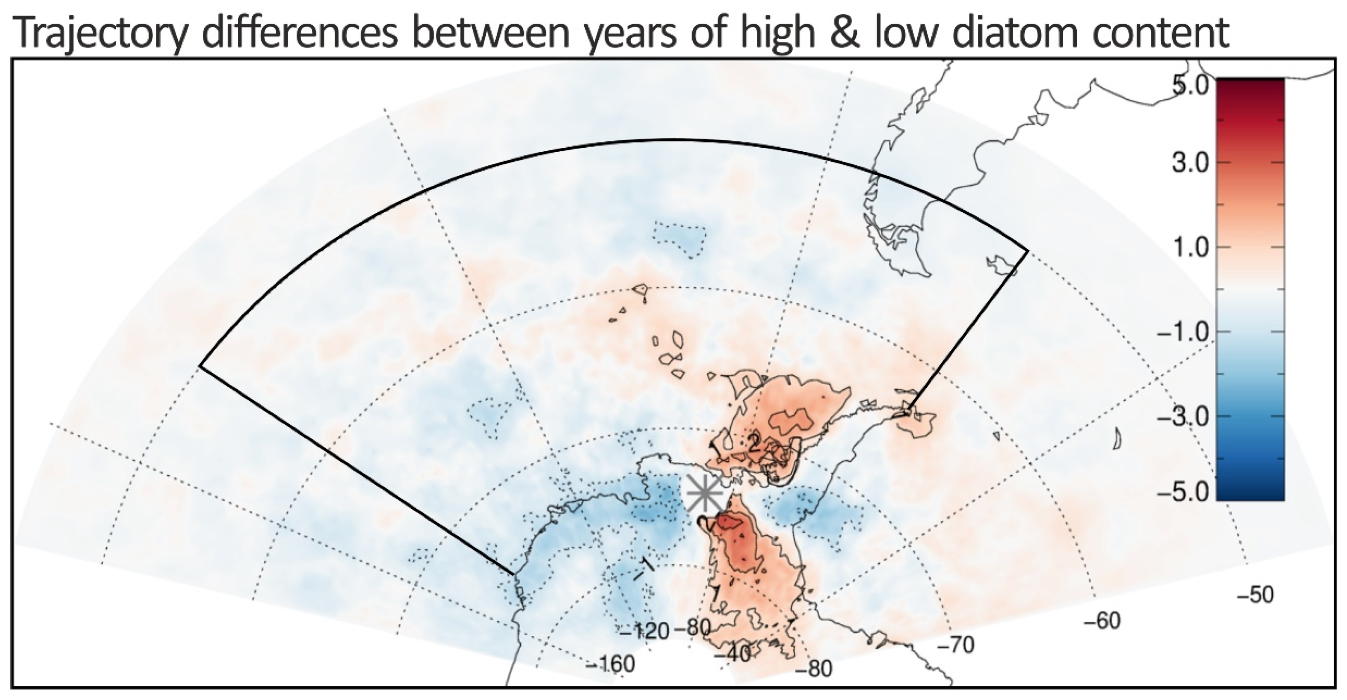
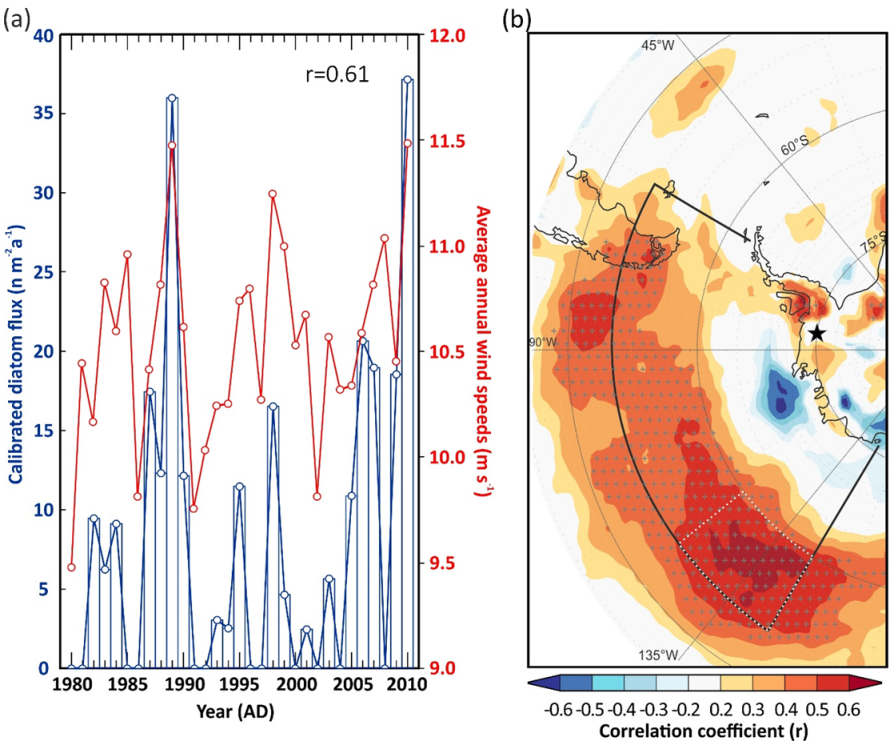
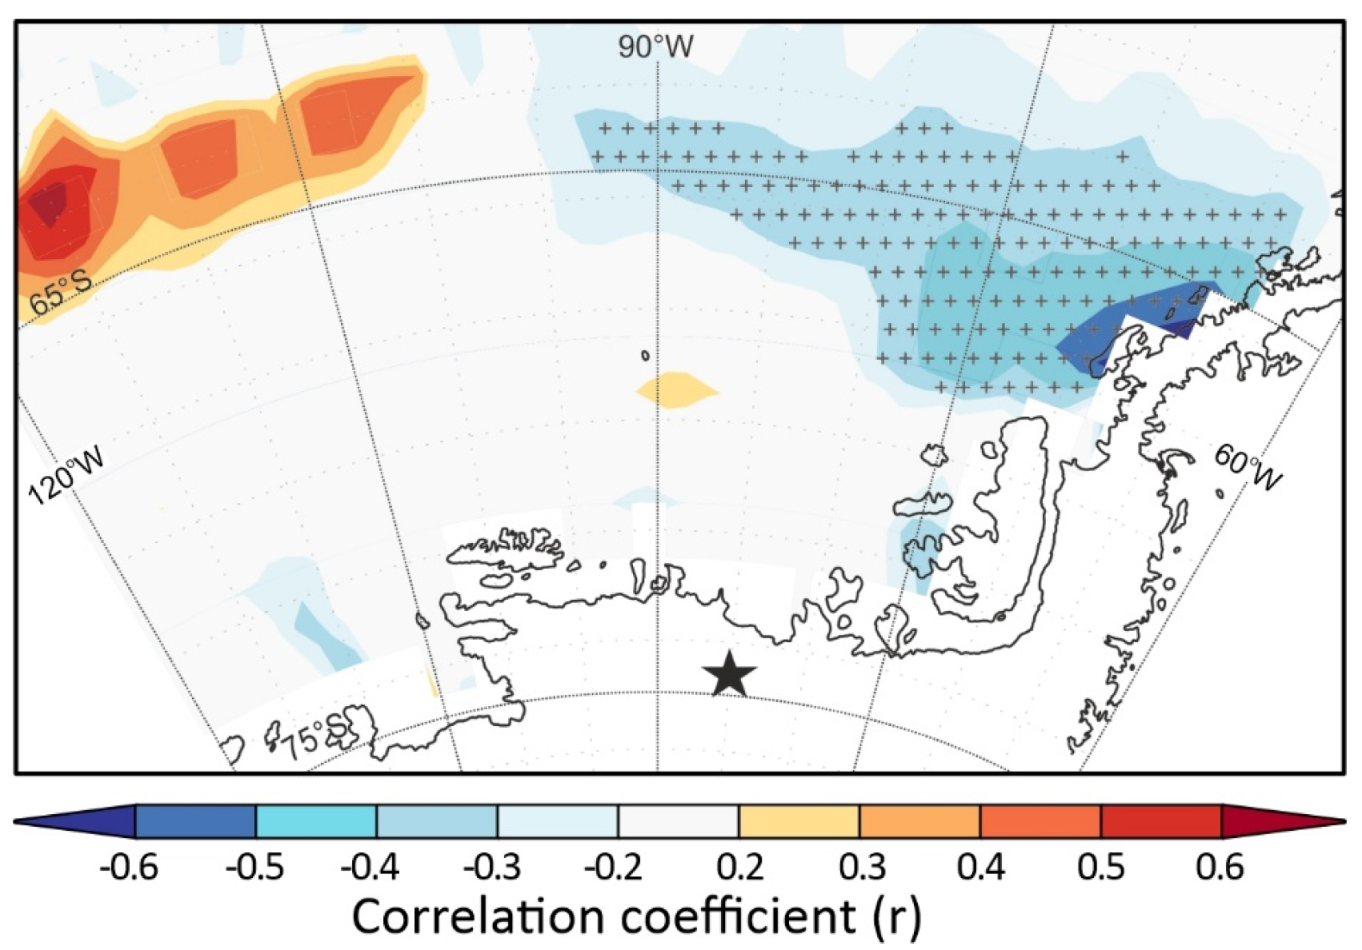
3.3. Air-Mass Circulation

Back trajectory analysis for the 1980–2010 period shows that 51% of all air masses reaching the Ferrigno ice core site originate from the north, over the Amundsen and Bellingshausen Seas (Figure 6a) [44]. Extracting only the 5-day trajectories that passed below 950 hPa (closest level to sea level) reveals that the dominant transport route, represented by the greatest density of trajectories, traverses the Amundsen and Bellingshausen Seas and is centred at ≈80° W (Figure 6b). These 5 day, 950 hPa back trajectories demarcate the area of potential entrainment of marine aerosols, ranging beyond 50° S and to 150° W, with the highest density of trajectories extending throughout much of the NAZ (Figure 6b). The pattern of back trajectories reflects the clockwise rotation of the ASL, with air masses advected eastwards and southwards to the north and east of the ASL, respectively (Figure 1b). The presence of NAZ diatoms in the Ferrigno ice core is entirely consistent with the Ferrigno back trajectories and the regional pattern of ASL atmospheric circulation.

4. Discussion

The potential for diatoms contained within the Ferrigno ice core to yield a reliable proxy for winds requires that wind is the dominant factor in the entrainment and transport of the diatoms from the source region to the ice core site. In the following paragraphs we discuss how winds and other elements may influence the entrainment and transport of diatoms to the Ferrigno ice core site in order to assess whether winds exert a primary control over these processes.
Although there are very few diatoms (n = 67) within the Ferrigno ice core, when converted to specimens per litre (water equivalent of ice) the Ferrigno diatom abundances (0–140 n L−1) are on a par with those recovered from snow and ice samples at other Antarctic sites, including Taylor Dome and Wilkes Land where diatoms comprise, respectively, 0–40 and 0–180 n L−1 [29,71]. Transfer of marine diatoms into the atmosphere occurs within sea spray and also from wind-scouring of exposed marine sediments. Most studies of aeolian diatoms in Antarctic ice describe assemblages that are dominated by non-marine, fresh-water taxa, inferred to be entrained from dried lake beds and exposed diatom-bearing sediments [33,37,72]. Located in the Transantarctic Mountains and the ice sheet plateau, the paucity of sea-spray sourced modern diatoms in these locations is likely due to the prevalence of katabatic (offshore) winds barring incursions of maritime air masses (Figure 1b) [71]. In contrast, extant marine diatoms, including taxa associated with sea-ice, were isolated from snow and ice samples at the more coastal sites of Taylor Dome and the Windmill Islands [29,71].
The absence of maritime air to continental sites not only prevents transport of diatoms but also moisture. This lack of moisture promotes exposure of sediments by inhibiting snow cover and stimulates entrainment by drying the sediment surface, making it less cohesive. The majority of air masses reaching the Ferrigno ice core site are of maritime origin, driven onshore over the Amundsen and Bellingshausen Seas by the clockwise circulation around the ASL [73]. The advection of moisture in these air masses produces some of the highest accumulation rates in the continent [45] and the extensive snow and ice cover observed throughout the AP [44]. This precipitation regime limits the exposure of sediment surfaces and greatly inhibits the scope for winds to entrain diatoms from exposed late Quaternary marine sediments. As such, we propose that sea spray is the principal source of diatom aerosols to the Ferrigno ice core site.
Sea spray droplets comprise a range of sizes up to several millimetres in diameter, capable of entraining any solitary diatoms and all but the largest diatom colonies [74,75,76]. Produced in the organic-rich sea surface microlayer by bubble breaking and wind shearing, sea spray production depends directly on the composition and air content of the surface waters, the area of whitecaps, the wave height, the steepness of waves and the wind speed [77]. The strong links between sea spray production and waves may also explain the prevalence of open ocean and NAZ diatoms in the ice core, as the sheltering and wave-dampening impact of sea-ice and icebergs [78] would inhibit entrainment of sea-ice and coastal diatoms by even the strongest winds.
Depending on the size, the timespan that droplets remain in the air above the ocean ranges from seconds to days [75]. Most of the largest spume and splash drops will fall back to the sea surface with minimal lateral transport but this process may accelerate the creation of smaller droplets. In the presence of strong winds, some of the large spume and splash drops will be suspended for longer, where they are sheared and split into smaller droplets with greater transport potential [76]. The unlimited fetch of the circumpolar Southern Ocean gives rise to the strongest winds and largest swells on earth—also known as the ‘Roaring Forties’, ‘Furious Fifties’ and ‘Shrieking or Screaming Sixties’. The strong winds and rough, cold seas that characterise the high southern latitudes are likely to produce more sea spray, entrain larger particles and carry aerosols further than in other oceanic regions [74,79]. As diatom cells comprise two valves made of structured outer layers of mesh-like hydrated silica (Figure 3a) with only organic material, water and/or air within, they are much less dense than similar-sized solid particles and are likely to remain in suspension, even in air, which is much lower density than water and therefore travel further.
The 5-day back trajectories extend beyond the NAZ (Figure 6b) and demonstrate that diatoms from the NAZ would need to remain air borne for less than 5 days in order to reach the Ferrigno ice core site. Analysis of the difference between back trajectories for the years of highest and lowest diatom fluxes reveal that years of elevated diatom content have a greater proportion of meridional trajectories arriving at the Ferrigno ice core site compared with those years barren of diatoms that are characterised by more zonal trajectories within the continental area of Antarctica (Figure 7). Although meridional trajectories of high diatom years comprise both maritime (northerly) and continental (southerly) air masses, the seasonal pattern of trajectories to the Ferrigno ice core site show that onshore northerly winds dominate for most of the year, southerly continental winds are only prevalent in austral summer (December, January, February) [44]. These summer air masses are unlikely to carry modern marine diatoms from the continental interior where wind-blown diatoms are predominantly fresh water taxa or relic marine taxa from outcrops of ancient (e.g., Pliocene) marine sediments [38,71,72]. The seasonal divergence of air mass trajectories from the reanalysis data also help to explain the paucity of diatom species from the continental shelf (such as Chaetoceros spp. and Fragilariopsis cylindrus [80,81]) as summer open water production would largely coincide with the prevalence of offshore, southerly winds. Even though the identified assemblage is almost completely marine in origin, the presence of non-marine taxa cannot be ruled out. The five-transect scanning method applied to analyse the samples has been demonstrated to provide representative results of the main components of the assemblage. However, this method does not show the whole diversity present in the sample. Although there may be non-marine and/or Pliocene taxa in the unstudied portion of the Ferrigno diatom assemblage, it is common practice in micropaleontology to assume that, in the absence of contradictory evidence, a sub-set of identified taxa are representative of the total assemblage.
Atmospheric circulation in the Amundsen and Bellingshausen Seas is principally controlled by the position and strength of the ASL [12]. This persistent deep low-pressure system, the result of the frequency and intensity of individual cyclones [82], is known to affect the climatic conditions on the AP and West Antarctica [2,73]. The location of the ASL pressure centre influences the regional pattern of zonal and meridional winds, controls the advection of heat and moisture to West Antarctica and drives the dynamic motion of sea-ice (Figure 1b) [83]. The strong match between back trajectories and diatom abundance corroborates the role of winds driven by the ASL in the entrainment, transport and delivery of diatoms to the Ferrigno ice core site.
In order to ascertain the wind aspect that exerts the strongest control on the diatom content of the Ferrigno ice core, indices of regional wind dynamics (including monthly, seasonal, annual, meridional and zonal average wind speeds) were analysed against diatom flux for 1980–2010. These analyses reveal the strongest positive correlation (r = 0.61; p < 5%) between diatom flux and average annual SWW speed anomalies (Figure 8a) centred around longitude 140° W, between 50° S and 60° S (Figure 8b). The area described in this correlation is not only consistent with the NAZ source region indicated by the ecological association of the diatoms, but also corroborates the transport trajectory of the Ferrigno methane sulphonic acid (MSA) record [83,84]. Highest correlation coefficients between diatom fluxes and (1) average monthly wind speeds are for June and August (r = 0.52 and 0.51 respectively; p < 5%; for the same region centred around longitude 140° W, between 50° S and 60° S); and (2) for average annual meridional wind speeds (r = 0.51; p < 5%; centred along 70° W). Correlation analyses also indicate a strong link between winds (for the same regions) and snow accumulation at the Ferrigno ice core site, with highest correlation coefficients returned for annual average meridional winds (r = 0.52; p < 5%; centred along 70° W) and for March and April average monthly wind speeds over the region centred around longitude 140° W, between 50° S and 60° S (r = 0.52 and 0.46 respectively; p < 5%). These results suggest that changes in snow accumulation are influenced by different seasonal wind patterns to those associated with the diatom flux.
Even though sea-ice taxa are not present in the diatom assemblage of the Ferrigno ice core, it is likely that sea-ice cover affects the transport distance between the NAZ source region and the Ferrigno ice core site. Extensive sea-ice cover over the Bellingshausen Sea (where onshore winds, determined by the position of the ASL, carry air masses to the Ferrigno ice core site) may be expected to limit the delivery of NAZ diatom species reaching the Ferrigno ice core site. However, sea ice cover in the Bellingshausen Sea is also largely controlled by the dynamics of the ASL and is negatively correlated with northerly (onshore) winds concentrated along 80° W such that higher (lower) flux of diatoms to the Ferrigno ice core site is consistent with both minimum (maximum) sea-ice cover (Figure 9) and stronger (weaker) SWW (Figure 8) [73,83]. In locations where sea ice extent and winds are not strongly correlated years of high (low) diatom content could be caused by either high (low) winds or minimum (maximum) sea ice cover and be difficult to differentiate.
As with the winds, differences in the Ferrigno snow accumulation are also strongly correlated with sea-ice but where diatom fluxes are associated with sea-ice conditions in the Bellingshausen Sea along the west AP (Figure 9), snow accumulation is linked with sea-ice conditions in the Amundsen-Ross Sea sector (centred around longitude 145 °W) [84].
In addition to wind conditions, the entrainment of diatoms from the surface ocean may be influenced by the availability of diatoms in the upper metres and centimetres of the water column. In the Southern Ocean, diatom productivity accounts for >85% [85] of total primary production but exhibits substantial spatial and temporal heterogeneity. Productivity patterns can be generalised into two regions that broadly coincide with the NAZ and SAZ [86,87]. In the seasonal sea-ice zone (SSIZ), within the SAZ, productivity is characterised by short-lived, intense blooms triggered by increasing light availability and melt-induced stratification during the spring and/or summer months. Highest productivity (>800 mg C m−2 d−1) occurs in the marginal ice zone on the continental shelf during Spring-Summer (November–February) [85,86,87]. Inter-annual variability in SAZ primary productivity is driven by changes in the distribution, timing and nature of sea-ice melt [87]. North of the SSIZ, the NAZ is characterised by more persistent but less intense spring and summer production. NAZ productivity is more uniform than in the SAZ, exhibiting considerably lower amplitudes of spatial and temporal variability (variance = 3.2%; annual mean = 1729 ± 60.7 Tg C a−1) across the pelagic Southern Ocean (south of 50° S and north of the sea-ice edge) between 1997 and 2006 [86]. Exceptions to this generalisation are the regions where terrigenous and/or crustal sources increase iron availability, typically this occurs where the ACC and APF interact with bathymetric highs and surface outcrops, including downstream of the Antarctic Peninsula and sub-Antarctic islands [88,89].
The NAZ in the Pacific sector of the Southern Ocean, identified as the potential source region for Ferrigno diatoms from reanalysis data and diatom ecology, is characterised by some of the most consistent rates of primary productivity in the whole Southern Ocean, with the lowest interannual variance of 4.06% (annual mean = 357 ± 14.5 Tg C a−1) between 1997 and 2006 occurring in the pelagic open ocean of the Amundsen-Bellingshausen sector, compared with 4.24–10.24% for the pelagic open ocean in all other sectors [86]. Primary production in the NAZ is also remarkably stable throughout austral autumn/winter (May to Aug) with production consistently ranging between 50 and 70 mg C m−2 d−1. These values compare with peak values of 300–400 mg C m−2 d−1 for the NAZ in spring (November–January), which in-turn are far lower and less varying than the 800–1400 mg C m−2 d−1 peak spring primary production recorded in the SAZ [86]. The modest seasonal and interannual variability in primary production exhibited throughout the NAZ, particularly in the Pacific sector, reduces the seasonal bias that diatom production may induce on the Ferrigno diatom content.
The data presented here provide positive evidence that years of elevated diatom flux in the Ferrigno ice core correspond to higher average SWW speeds over the NAZ of the Amundsen and Bellingshausen Seas and suggest that the diatom content of this ice core has potential as a proxy for past changes in SWW strength. Expanding the historical record of winds associated with the ASL may provide valuable insight on how recent conditions leading to basal melting, acceleration and thinning of WAP glaciers and the West Antarctic Ice Sheet compare with the last few centuries.

5. Conclusions

The aim of this work was to assess whether the diatom content of the Ferrigno ice core can provide a valid proxy for SWW. The direct relationship between sea spray production, droplet transport and wind, together with confirmation that sea-ice dynamics reinforce the wind signal and that ice volume is unrelated to diatom abundance, provides strong evidence that wind is the primary control on the diatom content of the Ferrigno ice core. Ecological assessment shows that, for the 1980–2010 interval, the majority of diatoms in the Ferrigno ice core are extant species from the NAZ. Back trajectory analyses corroborate the source and transport of NAZ diatoms, showing that the majority of air masses arriving at the Ferrigno ice core site are in contact with the sea surface across much of the NAZ in the Amundsen and Bellingshausen Seas. These results suggest that the dominant ecological associations of the diatom taxa provide a valid reference to the source region and that the diatom content of the ice core is primarily controlled by wind dynamics. Regression analyses show that diatom flux is most strongly correlated with average annual SWW speed in the NAZ of the Amundsen Sea (r = 0.61; p < 5%).
The evidence presented here shows that diatom fluxes contained in the Ferrigno ice core offer potential as a proxy for average annual SWW speeds in the Pacific sector of the Southern Ocean and suggests that the down-core record of diatom flux could provide the geoscience community with a novel and valuable tool to reconstruct relative changes in SWW strength for the pre-satellite era. Resolving past changes in the SWW can be used to constrain climate and ice sheet models and will ultimately help to reduce uncertainty in projections of West Antarctic ice sheet stability and contribution to sea-level rise.

Author Contributions

Conceptualisation, C.S.A. and E.R.T.; methodology, C.S.A., E.R.T. and D.R.T.; validation, C.S.A., E.R.T. and T.J.B.; investigation, R.A.W., E.C.L. and H.B.; formal analysis, C.S.A. and E.R.T.; writing—original draft preparation, C.S.A., E.R.T. and T.J.B.; writing—review and editing, C.S.A., E.R.T., T.J.B. and D.R.T. All authors have read and agreed to the published version of the manuscript.

Funding

This research was funded by the Natural Environment Research Council Grant NE/J020710/1.

Acknowledgments

This study is part of the British Antarctic Survey (BAS) Polar Science for Planet Earth Programme. We would like to thank P. Anker for drilling assistance, European Centre for Medium-Range Weather Forecasts (ECMWF) for the reanalysis data, CEDA for their trajectory service, V. Peck for helpful remarks on early drafts of the manuscript and reviewers for their constructive comments on submitted versions of this work.

Conflicts of Interest

The authors declare no conflict of interest. The funders had no role in the design of the study; in the collection, analyses, or interpretation of data; in the writing of the manuscript, or in the decision to publish the results.

Data Availability

Data (including data pertaining to Figure 5 and Figure 8) will be made publicly available through PANGAEA (www.pangaea.de) following publication.

References

  1. Marshall, G.J.; Orr, A.; Van Lipzig, N.P.M.; King, J.C. The Impact of a Changing Southern Hemisphere Annular Mode on Antarctic Peninsula Summer Temperatures. J. Clim. 2006, 19, 5388–5404. [Google Scholar] [CrossRef]
  2. Thomas, E.R.; Hosking, J.S.; Tuckwell, R.; Warren, R.A.; Ludlow, E.C. Twentieth century increase in snowfall in coastal West Antarctica. Geophys. Res. Lett. 2015, 42, 9387–9393. [Google Scholar] [CrossRef] [Green Version]
  3. Cook, A.J.; Holland, P.R.; Meredith, M.P.; Murray, T.; Luckman, A.; Vaughan, D. Ocean forcing of glacier retreat in the western Antarctic Peninsula. Science 2016, 353, 283–286. [Google Scholar] [CrossRef] [Green Version]
  4. Spence, P.; Griffies, S.M.; England, M.; Hogg, A.M.; Saenko, O.A.; Jourdain, N.C. Rapid subsurface warming and circulation changes of Antarctic coastal waters by poleward shifting winds. Geophys. Res. Lett. 2014, 41, 4601–4610. [Google Scholar] [CrossRef] [Green Version]
  5. Rignot, E. Changes in West Antarctic ice stream dynamics observed with ALOS PALSAR data. Geophys. Res. Lett. 2008, 35. [Google Scholar] [CrossRef] [Green Version]
  6. Rignot, E.; Mouginot, J.; Morlighem, M.; Seroussi, H.; Scheuchl, B. Widespread, rapid grounding line retreat of Pine Island, Thwaites, Smith, and Kohler glaciers, West Antarctica, from 1992 to 2011. Geophys. Res. Lett. 2014, 41, 3502–3509. [Google Scholar] [CrossRef] [Green Version]
  7. Pritchard, H.D.; Arthern, R.J.; Vaughan, D.; Edwards, L.A. Extensive dynamic thinning on the margins of the Greenland and Antarctic ice sheets. Nature 2009, 461, 971–975. [Google Scholar] [CrossRef] [PubMed]
  8. Ritz, C.; Edwards, T.; Durand, G.; Payne, A.J.; Peyaud, V.; Hindmarsh, R. Potential sea-level rise from Antarctic ice-sheet instability constrained by observations. Nature 2015, 528, 115–118. [Google Scholar] [CrossRef]
  9. Dutrieux, P.; De Rydt, J.; Jenkins, A.; Holland, P.R.; Ha, H.K.; Lee, S.H.; Steig, E.J.; Ding, Q.; Abrahamsen, P.; Schröder, M. Strong Sensitivity of Pine Island Ice-Shelf Melting to Climatic Variability. Science 2014, 343, 174–178. [Google Scholar] [CrossRef] [Green Version]
  10. Pritchard, H.D.; Ligtenberg, S.R.M.; Fricker, H.A.; Vaughan, D.; Broeke, M.R.V.D.; Padman, L. Antarctic ice-sheet loss driven by basal melting of ice shelves. Nature 2012, 484, 502–505. [Google Scholar] [CrossRef]
  11. Bromwich, D.H.; Fogt, R. Strong Trends in the Skill of the ERA-40 and NCEP–NCAR Reanalyses in the High and Midlatitudes of the Southern Hemisphere, 1958–2001. J. Clim. 2004, 17, 4603–4619. [Google Scholar] [CrossRef]
  12. Raphael, M.N.; Marshall, G.J.; Turner, J.; Fogt, R.; Schneider, D.; Dixon, D.A.; Hosking, J.S.; Jones, J.; Hobbs, W.R. The Amundsen Sea Low: Variability, Change, and Impact on Antarctic Climate. Bull. Am. Meteorol. Soc. 2016, 97, 111–121. [Google Scholar] [CrossRef]
  13. Alley, R.B. Reliability of ice-core science: Historical insights. J. Glaciol. 2010, 56, 1095–1103. [Google Scholar] [CrossRef] [Green Version]
  14. Legrand, M.; Mayewski, P. Glaciochemistry of polar ice cores: A review. Rev. Geophys. 1997, 35, 219–243. [Google Scholar] [CrossRef] [Green Version]
  15. Delmonte, B.; Paleari, C.I.; Ando’, S.; Garzanti, E.; Andersson, P.S.; Petit, J.R.; Crosta, X.; Narcisi, B.; Baroni, C.; Salvatore, M.C.; et al. Causes of dust size variability in central East Antarctica (Dome B): Atmospheric transport from expanded South American sources during Marine Isotope Stage 2. Quat. Sci. Rev. 2017, 168, 55–68. [Google Scholar] [CrossRef] [Green Version]
  16. Dixon, D.; Mayewski, P.A.; Goodwin, I.; Marshall, G.J.; Freeman, R.; Maasch, K.A.; Sneed, S.B. An ice-core proxy for northerly air mass incursions into West Antarctica. Int. J. Clim. 2011, 32, 1455–1465. [Google Scholar] [CrossRef] [Green Version]
  17. Bullard, J.; Baddock, M.; Bradwell, T.; Crusius, J.; Darlington, E.; Gaiero, D.; Gassó, S.; Gisladottir, G.; Hodgkins, R.; McCulloch, R.; et al. High-latitude dust in the Earth system. Rev. Geophys. 2016, 54, 447–485. [Google Scholar] [CrossRef] [Green Version]
  18. Lambert, F.; Delmonte, B.; Petit, J.-R.; Bigler, M.; Kaufmann, P.R.; Hutterli, M.A.; Stocker, T.F.; Rüth, U.; Steffensen, J.P.; Maggi, V. Dust-climate couplings over the past 800,000 years from the EPICA Dome C ice core. Nature 2008, 452, 616–619. [Google Scholar] [CrossRef] [Green Version]
  19. Wolff, E.; Barbante, C.; Becagli, S.; Bigler, M.; Boutron, C.; Castellano, E.; De Angelis, M.; Federer, U.; Fischer, H.; Fundel, F.; et al. Changes in environment over the last 800,000 years from chemical analysis of the EPICA Dome C ice core. Quat. Sci. Rev. 2010, 29, 285–295. [Google Scholar] [CrossRef]
  20. Armand, L.; Crosta, X.; Romero, O.; Pichon, J.-J. The Biogeography of Major Diatom Taxa in Southern Ocean Sediments: 1. Sea Ice Related Species. Palaeogeogr. Palaeoclim. Palaeoecol. 2005, 223, 93–126. [Google Scholar] [CrossRef]
  21. Crosta, X.; Romero, O.; Armand, L.; Pichon, J.-J. The biogeography of major diatom taxa in Southern Ocean sediments: 2. Open ocean related species. Palaeogeogr. Palaeoclim. Palaeoecol. 2005, 223, 66–92. [Google Scholar] [CrossRef]
  22. Armand, L.; Crosta, X.; Romero, O.; Pichon, J.-J. The Biogeography of Major Diatom Taxa in Southern Ocean Surface Sediments: 3. Tropical/Subtropical Species. Palaeogeogr. Palaeoclim. Palaeoecol. 2005, 223, 49–65. [Google Scholar] [CrossRef]
  23. Zielinski, U.; Gersonde, R. Diatom distribution in Southern Ocean surface sediments (Atlantic sector): Implications for paleoenvironmental reconstructions. Palaeogeogr. Palaeoclim. Palaeoecol. 1997, 129, 213–250. [Google Scholar] [CrossRef]
  24. Spaulding, S.A.; McKnight, D. Diatoms as indicators of environmental change in antarctic freshwaters. In The Diatoms: Applications for the Environmental and Earth Sciences; Smol, J.P., Stoermer, E.F., Eds.; Cambridge University Press: New York, NY, USA, 2010; pp. 267–283. [Google Scholar] [CrossRef]
  25. Crosta, X.; Koç, N. Diatoms: From Micropaleontology to Isotope Geochemistry. In Developments in Marine Geology; Hilaire-Marcel, C., de Vernal, A., Eds.; Elsevier: Amsterdam, The Netherlands, 2007. [Google Scholar]
  26. Lowe, R.; Stoermer, E.F.; Smol, J.P. (Eds.) The Diatoms: Applications for the Environmental and Earth Sciences, 2nd ed.; Cambridge University Press: Cambridge, UK, 2010. [Google Scholar]
  27. Romero, O.E.; Dupont, L.; Wyputta, U.; Jahns, S.; Wefer, G. Temporal variability of fluxes of eolian-transported freshwater diatoms, phytoliths, and pollen grains off Cape Blanc as reflection of land-atmosphere-ocean interactions in northwest Africa. J. Geophys. Res. Space Phys. 2003, 108. [Google Scholar] [CrossRef]
  28. Welch, H.E.; Muir, D.C.G.; Billeck, B.N.; Lockhart, W.L.; Brunskill, G.J.; Kling, H.J.; Olson, M.P.; Lemoine, R.M. Brown snow: A long-range transport event in the Canadian Arctic. Environ. Sci. Technol. 1991, 25, 280–286. [Google Scholar] [CrossRef]
  29. Budgeon, A.; Roberts, D.; Gasparon, M.; Adams, N. Direct evidence of aeolian deposition of marine diatoms to an ice sheet. Antarct. Sci. 2012, 24, 527–535. [Google Scholar] [CrossRef]
  30. Fritz, S.C.; Brinson, B.E.; Billups, W.E.; Thompson, L.G. Diatoms at >5000 Meters in the Quelccaya Summit Dome Glacier, Peru. Arctic. Antarct. Alp. Res. 2015, 47, 369–374. [Google Scholar] [CrossRef] [Green Version]
  31. Papina, T.S.; Blyakharchuk, T.; Eichler, A.; Malygina, N.; Mitrofanova, E.; Schwikowski, M. Biological proxies recorded in a Belukha ice core, Russian Altai. Clim. Past 2013, 9, 2399–2411. [Google Scholar] [CrossRef] [Green Version]
  32. Tormo, R.; Recio, D.; Silva, I.; Muñoz, A. A quantitative investigation of airborne algae and lichen soredia obtained from pollen traps in south-west Spain. Eur. J. Phycol. 2001, 36, 385–390. [Google Scholar] [CrossRef] [Green Version]
  33. McKay, R.; Barrett, P.; Harper, M.; Hannah, M. Atmospheric transport and concentration of diatoms in surficial and glacial sediments of the Allan Hills, Transantarctic Mountains. Palaeogeogr. Palaeoclim. Palaeoecol. 2008, 260, 168–183. [Google Scholar] [CrossRef]
  34. Ram, M.; Gayley, R.I. Insoluble particles in polar ice: Identification and measurement of the insoluble background aerosol. Geophys. Res. Lett. 1994, 21, 437–440. [Google Scholar] [CrossRef]
  35. Delmonte, B.; Baroni, C.; Andersson, P.S.; Narcisi, B.; Salvatore, M.; Petit, J.-R.; Scarchilli, C.; Frezzotti, M.; Albani, S.; Maggi, V. Modern and Holocene aeolian dust variability from Talos Dome (Northern Victoria Land) to the interior of the Antarctic ice sheet. Quat. Sci. Rev. 2013, 64, 76–89. [Google Scholar] [CrossRef]
  36. Burckle, L.H.; Kellogg, D.E.; Kellogg, T.B.; Fastook, J.L. A mechanism for emplacement and concentration of diatoms in glacigenic deposits. Boreas 2008, 26, 55–60. [Google Scholar] [CrossRef]
  37. Scherer, R.P. Pleistocene Collapse of the West Antarctic Ice Sheet. Science 1998, 281, 82–85. [Google Scholar] [CrossRef] [PubMed]
  38. Stroeven, A.P.; Prentice, M.J.; Kleman, J. Recycled Marine Microfossils in Glacial Tills of the Sirius Group at Mount Fleming: Transport Mechanisms and Pathways. Antarct. J. U. S. 1997, 32, 1. [Google Scholar]
  39. Scherer, R.P.; DeConto, R.M.; Pollard, D.; Alley, R.B. Windblown Pliocene diatoms and East Antarctic Ice Sheet retreat. Nat. Commun. 2016, 7, 12957. [Google Scholar] [CrossRef] [Green Version]
  40. Hausmann, S.; Larocque-Tobler, I.; Richard, P.J.; Pienitz, R.; St-Onge, G.; Fye, F. Diatom-inferred wind activity at Lac du Sommet, southern Québec, Canada: A multiproxy paleoclimate reconstruction based on diatoms, chironomids and pollen for the past 9500 years. Holocene 2011, 21, 925–938. [Google Scholar] [CrossRef]
  41. Wang, L.; Lu, H.; Liu, J.; Gu, Z.; Mingram, J.; Chu, G.; Li, J.; Rioual, P.; Negendank, J.F.W.; Han, J.; et al. Diatom-based inference of variations in the strength of Asian winter monsoon winds between 17,500 and 6000 calendar years B.P. J. Geophys. Res. Space Phys. 2008, 113. [Google Scholar] [CrossRef] [Green Version]
  42. Thomas, E.R.; Bracegirdle, T.; Turner, J.; Wolff, E. A 308 year record of climate variability in West Antarctica. Geophys. Res. Lett. 2013, 40, 5492–5496. [Google Scholar] [CrossRef] [Green Version]
  43. Nye, J.F. Correction Factor for Accumulation Measured by the Thickness of the Annual Layers in an Ice Sheet. J. Glaciol. 1963, 4, 785–788. [Google Scholar] [CrossRef] [Green Version]
  44. Thomas, E.R.; Bracegirdle, T. Precipitation pathways for five new ice core sites in Ellsworth Land, West Antarctica. Clim. Dyn. 2014, 44, 2067–2078. [Google Scholar] [CrossRef]
  45. Thomas, E.R.; Van Wessem, M.; Roberts, J.; Isaksson, E.; Schlosser, E.; Fudge, T.J.; Vallelonga, P.; Medley, B.; Lenaerts, J.T.M.; Bertler, N.A.N.; et al. Regional Antarctic snow accumulation over the past 1000 years. Clim. Past 2017, 13, 1491–1513. [Google Scholar] [CrossRef] [Green Version]
  46. Fetterer, F.; Knowles, K.; Meier, W.; Savoie, M.; Windnagel, A.K. Antarctic February and September 30-Year Means (1981–2010). In Sea Ice Index, Version 3; National Snow and Ice Data Centre: Boulder, CO, USA, 2017. [Google Scholar]
  47. Reanalysis Map of Mean Annual Wind Speed (M/S) for the Interval 1979–2015. In Climate Reanalyzer; Climate Change Institute, University of Maine: Orono, ME, USA, 2018; Available online: https://climatereanalyzer.org/ (accessed on 25 February 2020).
  48. Dee, D.P.; Uppala, S.M.; Simmons, A.J.; Berrisford, P.; Poli, P.; Kobayashi, S.; Andrae, U.; Balmaseda, M.A.; Balsamo, G.; Bauer, P.; et al. The Era-Interim Reanalysis: Configuration and Performance of the Data Assimilation System. Q. J. Roy. Meteorol. Soc. 2011, 137, 553–597. [Google Scholar] [CrossRef]
  49. Hasle, G.R.; Syvertsen, E.E. Chapter 2: Marine Diatoms. In Identifying Marine Phytoplankton; Tomas, C.R., Ed.; Academic Press: San Diego, CA, USA, 1997; pp. 5–385. [Google Scholar] [CrossRef]
  50. Johansen, J.; Fryxell, G.A. The genus Thalassiosira (Bacillariophyceae): Studies on species occurring south of the Antarctic Convergence Zone. Phycologia 1985, 24, 155–179. [Google Scholar] [CrossRef]
  51. Cefarelli, A.O.; Ferrario, M.E.; Almandoz, G.O.; Atencio, A.G.; Akselman, R.; Vernet, M. Diversity of the diatom genus Fragilariopsis in the Argentine Sea and Antarctic waters: Morphology, distribution and abundance. Polar Boil. 2010, 33, 1463–1484. [Google Scholar] [CrossRef] [Green Version]
  52. Armand, L.; Cornet-Barthaux, V.; Mosseri, J.; Quéguiner, B. Late summer diatom biomass and community structure on and around the naturally iron-fertilised Kerguelen Plateau in the Southern Ocean. Deep. Sea Res. Part II Top. Stud. Oceanogr. 2008, 55, 653–676. [Google Scholar] [CrossRef]
  53. Esper, O.; Gersonde, R. Quaternary surface water temperature estimations: New diatom transfer functions for the Southern Ocean. Palaeogeogr. Palaeoclim. Palaeoecol. 2014, 414, 1–19. [Google Scholar] [CrossRef]
  54. Esper, O.; Gersonde, R. New tools for the reconstruction of Pleistocene Antarctic sea ice. Palaeogeogr. Palaeoclim. Palaeoecol. 2014, 399, 260–283. [Google Scholar] [CrossRef]
  55. Abram, N.J.; Thomas, E.R.; McConnell, J.R.; Mulvaney, R.; Bracegirdle, T.; Sime, L.C.; Aristarain, A.J. Ice core evidence for a 20th century decline of sea ice in the Bellingshausen Sea, Antarctica. J. Geophys. Res. Space Phys. 2010, 115. [Google Scholar] [CrossRef] [Green Version]
  56. Thomas, E.R.; Dennis, P.; Bracegirdle, T.; Franzke, C. Ice core evidence for significant 100-year regional warming on the Antarctic Peninsula. Geophys. Res. Lett. 2009, 36. [Google Scholar] [CrossRef] [Green Version]
  57. Hamsher, S.; Kopalová, K.; Kociolek, J.P.; Zidarova, R.; Van De Vijver, B. Kopalov The genus Nitzschia on the South Shetland Islands and James Ross Island. Fottea 2016, 16, 79–102. [Google Scholar] [CrossRef] [Green Version]
  58. Scott, F.J.; Marchant, H.J. (Eds.) Antarctic Marine Protists; Australian Biological Resources Study; CSIRO Publishing: Clayton, Australia, 2005. [Google Scholar]
  59. Allen, C.S.; Pike, J.; Pudsey, C.J. Last glacial–interglacial sea-ice cover in the SW Atlantic and its potential role in global deglaciation. Quat. Sci. Rev. 2011, 30, 2446–2458. [Google Scholar] [CrossRef]
  60. Hasle, G.R. The biogeography of some marine planktonic diatoms. Deep. Sea Res. Oceanogr. Abstr. 1976, 23. [Google Scholar] [CrossRef]
  61. Moore, J.K.; Abbott, M.R. Phytoplankton chlorophyll distributions and primary production in the Southern Ocean. J. Geophys. Res. Space Phys. 2000, 105, 28709–28722. [Google Scholar] [CrossRef]
  62. Mohan, R.; Quarshi, A.A.; Meloth, T.; Sudhakar, M. Diatoms from the Surface Waters of the Southern Ocean during the Austral Summer of 2004. Curr. Sci. 2011, 100, 1323–1327. [Google Scholar]
  63. Bathmann, U.; Scharek, R.; Klaas, C.; Dubischar, C.; Smetacek, V. Spring development of phytoplankton biomass and composition in major water masses of the Atlantic sector of the Southern Ocean. Deep. Sea Res. Part II Top. Stud. Oceanogr. 1997, 44, 51–67. [Google Scholar] [CrossRef] [Green Version]
  64. Assmy, P.; Smetacek, V.; Montresor, M.; Klaas, C.; Henjes, J.; Strass, V.; Arrieta, J.; Bathmann, U.; Berg, G.M.; Breitbarth, E.; et al. Thick-shelled, grazer-protected diatoms decouple ocean carbon and silicon cycles in the iron-limited Antarctic Circumpolar Current. Proc. Natl. Acad. Sci. USA 2013, 110, 20633–20638. [Google Scholar] [CrossRef] [Green Version]
  65. Burckle, L.H.; Cirilli, J. Origin of Diatom Ooze Belt in the Southern Ocean: Implications for Late Quaternary Paleoceanography. Micropaleontology 1987, 33, 82–86. [Google Scholar] [CrossRef]
  66. Fischer, G.; Gersonde, R.; Wefer, G. Organic carbon, biogenic silica and diatom fluxes in the marginal winter sea-ice zone and in the Polar Front Region: Interannual variations and differences in composition. Deep. Sea Res. Part II Top. Stud. Oceanogr. 2002, 49, 1721–1745. [Google Scholar] [CrossRef]
  67. Hasle, G.R. Family Bacillariaceae: The Genera Thalassiothrix and Trichotoxon. In Polar Marine Diatoms; Medlin, L., Priddle, J., Eds.; British Antarctic Survey: Cambridge, UK, 1990; pp. 133–136. [Google Scholar]
  68. Smetacek, V.; Klaas, C.; Menden-Deuer, S.; Rynearson, T. Mesoscale distribution of dominant diatom species relative to the hydrographical field along the Antarctic Polar Front. Deep. Sea Res. Part II Top. Stud. Oceanogr. 2002, 49, 3835–3848. [Google Scholar] [CrossRef]
  69. Rigual-Hernández, A.S.; Trull, T.W.; Bray, S.G.; Cortina, A.; Armand, L. Latitudinal and temporal distributions of diatom populations in the pelagic waters of the Subantarctic and Polar Frontal zones of the Southern Ocean and their role in the biological pump. Biogeosciences 2015, 12, 5309–5337. [Google Scholar] [CrossRef] [Green Version]
  70. Warnock, J.P.; Scherer, R.P. Diatom species abundance and morphologically-based dissolution proxies in coastal Southern Ocean assemblages. Cont. Shelf Res. 2015, 102, 1–8. [Google Scholar] [CrossRef]
  71. Kellogg, D.E.; Kellogg, T.B. Glacial/Interglacial Variations in the Flux of Atmospherically Transported Diatoms in Taylor Dome Ice Core. Antarct. J. U. S. 1996, 31, 68–70. [Google Scholar]
  72. Burckle, L.H.; Gayley, R.I.; Ram, M.; Petit, J.-R. Diatoms in Antarctic ice cores: Some implications for the glacial history of Antarctica. Geology 1988, 16, 326. [Google Scholar] [CrossRef]
  73. Hosking, J.S.; Orr, A.; Marshall, G.J.; Turner, J.; Phillips, T.; Hosking, J.S. The Influence of the Amundsen–Bellingshausen Seas Low on the Climate of West Antarctica and Its Representation in Coupled Climate Model Simulations. J. Clim. 2013, 26, 6633–6648. [Google Scholar] [CrossRef] [Green Version]
  74. De Leeuw, G.; Andreas, E.L.; Anguelova, M.D.; Fairall, C.W.; Lewis, E.; O’Dowd, C.; Schulz, M.; Schwartz, S.E. Production flux of sea spray aerosol. Rev. Geophys. 2011, 49. [Google Scholar] [CrossRef] [Green Version]
  75. Grythe, H.; Ström, J.; Krejci, R.; Quinn, P.O.; Stohl, A. A review of sea-spray aerosol source functions using a large global set of sea salt aerosol concentration measurements. Atmospheric Chem. Phys. Discuss. 2014, 14, 1277–1297. [Google Scholar] [CrossRef] [Green Version]
  76. Troitskaya, Y.; Kandaurov, A.; Ermakova, O.; Kozlov, D.; Sergeev, D.; Zilitinkevich, S. Bag-breakup fragmentation as the dominant mechanism of sea-spray production in high winds. Sci. Rep. 2017, 7, 1614. [Google Scholar] [CrossRef]
  77. O’Dowd, C.; De Leeuw, G. Marine aerosol production: A review of the current knowledge. Philos. Trans. R. Soc. A Math. Phys. Eng. Sci. 2007, 365, 1753–1774. [Google Scholar] [CrossRef] [Green Version]
  78. Montiel, F.; Squire, V.; Bennetts, L. Reflection and transmission of ocean wave spectra by a band of randomly distributed ice floes. Ann. Glaciol. 2015, 56, 315–322. [Google Scholar] [CrossRef] [Green Version]
  79. Salter, M.; Nilsson, E.D.; Butcher, A.; Bilde, M. On the seawater temperature dependence of the sea spray aerosol generated by a continuous plunging jet. J. Geophys. Res. Atmos. 2014, 119, 9052–9072. [Google Scholar] [CrossRef] [Green Version]
  80. Kellogg, D.E.; Kellogg, T.B. Recent Diatom Distributions in the Amundsen Sea. Antarct. J. U. S. 1986, 161–162. [Google Scholar]
  81. Pike, J.; Allen, C.S.; Leventer, A.; Stickley, C.E.; Pudsey, C.J. Comparison of contemporary and fossil diatom assemblages from the western Antarctic Peninsula shelf. Mar. Micropaleontol. 2008, 67, 274–287. [Google Scholar] [CrossRef]
  82. Turner, J.; Phillips, T.; Hosking, J.S.; Marshall, G.J.; Orr, A.; Hosking, J.S. The Amundsen Sea low. Int. J. Clim. 2012, 33, 1818–1829. [Google Scholar] [CrossRef] [Green Version]
  83. Holland, P.R.; Kwok, R.; Kwok, R. Wind-driven trends in Antarctic sea-ice drift. Nat. Geosci. 2012, 5, 872–875. [Google Scholar] [CrossRef]
  84. Thomas, E.R.; Abram, N.J. Ice core reconstruction of sea ice change in the Amundsen-Ross Seas since 1702 A.D. Geophys. Res. Lett. 2016, 43, 5309–5317. [Google Scholar] [CrossRef] [Green Version]
  85. Rousseaux, C.S.; Gregg, W.W. Interannual Variation in Phytoplankton Primary Production at A Global Scale. Remote. Sens. 2013, 6, 1–19. [Google Scholar] [CrossRef] [Green Version]
  86. Arrigo, K.R.; Dijken, G.L.; Bushinsky, S.M. Primary production in the Southern Ocean, 1997–2006. J. Geophys. Res. Space Phys. 2008, 113. [Google Scholar] [CrossRef]
  87. Soppa, M.; Völker, C.; Bracher, A. Diatom Phenology in the Southern Ocean: Mean Patterns, Trends and the Role of Climate Oscillations. Remote. Sens. 2016, 8, 420. [Google Scholar] [CrossRef] [Green Version]
  88. De Jong, J.; Schoemann, V.; Maricq, N.; Mattielli, N.; Langhorne, P.; Haskell, T.; Tison, J.-L. Iron in land-fast sea ice of McMurdo Sound derived from sediment resuspension and wind-blown dust attributes to primary productivity in the Ross Sea, Antarctica. Mar. Chem. 2013, 157, 24–40. [Google Scholar] [CrossRef]
  89. Planquette, H.; Statham, P.J.; Fones, G.R.; Charette, M.A.; Moore, M.; Salter, I.; Menet-Nedelec, F.; Taylor, S.L.; French, M.; Baker, A.; et al. Dissolved iron in the vicinity of the Crozet Islands, Southern Ocean. Deep. Sea Res. Part II Top. Stud. Oceanogr. 2007, 54, 1999–2019. [Google Scholar] [CrossRef] [Green Version]
Figure 1. Southern hemisphere maps showing location of the Ferrigno ice core site (red star), the Amundsen and Bellingshausen Seas region (red outline) and the principal (a) oceanographic and (b) atmospheric features of the high southern latitudes. (a) Dashed grey lines mark the mean positions of the Subantarctic and Antarctic Polar Fronts (SAF and APF). Dotted grey lines indicate the mean extent of the seasonal and perennial sea-ice (SSI and PSI), calculated from daily remote sensed readings that have been averaged into monthly mean values and then into a single grid for the period 1981–2010 [46]. Shaded areas (from north to south) denote the Northern Antarctic Zone (NAZ; lightest), the mean SSI zone (mid-tone) and the mean PSI zone (darkest). (b) Arrows depict mean wind speeds (m s−1) for the period 1979–2015 derived from the European Centre for Medium-Range Weather Forecasts (ECMRWF) Re-Analysis data (ERA-Interim) [47,48]. Red-to-blue shading represents mean atmospheric pressure at sea level (hPa). Darkest blue shading marks the low pressure fields, with the Amundsen Sea Low (ASL) dominating the southern Amundsen and Bellingshausen Seas.
Geosciences 10 00087 g001
Figure 2. Mean diatom density produced by Monte Carlo simulations from counts of 1 to 10 transects.
Geosciences 10 00087 g002
Figure 3. (a) Illustration of a diatom frustule; b, c and d: images of diatoms from the Ferrigno ice core: (b) broken valve of Thalassiosira lentiginosa; (c) whole valve of Fragilariopsis kerguelensis; (d) fragment of a Dactyliosolen girdleband. Scale bars are in microns.
Geosciences 10 00087 g003
Figure 4. Diagram of oceanographic zones of the Southern Ocean (SAF—Subantarctic Front; APF—Antarctic Polar Front; SSIE—seasonal sea-ice extent; PSIE—perennial sea-ice extent; CP—Coastal Polynya). Coloured circles represent diatom productivity (increased density of circles corresponds to higher productivity); colours represent ecologically distinct diatom assemblages associated with the oceanographic zones (adapted from Allen et al. [59]).
Geosciences 10 00087 g004
Figure 5. Comparison of diatom abundance with parameters of ice volume for 1980–2010. (a) Plots of diatom abundance, sample volume and water-equivalent (we) rate of snow accumulation and (b) correlation coefficients between diatom abundance, sample volume and water-equivalent (we) rate of snow accumulation.
Geosciences 10 00087 g005
Figure 6. Density plots of 5-day back-trajectories reaching the Ferrigno ice core site (1980–2010) for (a) percentage of all trajectories (adapted from Thomas and Bracegirdle [44]); (b) all trajectories passing below 950 hPa with corresponding area of the NAZ for the Amundsen and Bellingshausen Seas illustrated by the white transparent overlay. Grey star indicates the location of the Ferrigno ice core; black outline marks the Amundsen and Bellingshausen Seas region.
Geosciences 10 00087 g006
Figure 7. Map showing the difference between back-trajectories for years with the 12 highest (red shading) and 12 lowest (blue shading) diatom abundance; presented as a percentage of all trajectories (see Figure 5a). Heavier shading illustrates higher proportion (%) of trajectories. Grey star indicates the location of the Ferrigno ice core and black outline replicates the demarcation of the Amundsen and Bellingshausen Seas given in Figure 1.
Geosciences 10 00087 g007
Figure 8. Correlation of calibrated diatom flux (n m−2 a−1) and average annual wind speed anomalies (ms−1) for 1980–2010. (a) Plot of diatom flux (blue) and average annual wind speed anomalies (red) (p < 1%); (b) correlation (detrended) analyses of diatom flux and annual wind speed anomalies. Grey hatching indicates region of significant (p < 5%) positive correlation (max r = 0.6); black star indicates the location of the Ferrigno ice core, black outline replicates the demarcation of the Amundsen and Bellingshausen Seas given in Figure 1 and white dotted margin indicates the approximate region for which winds were averaged for (a).
Geosciences 10 00087 g008
Figure 9. Correlation (detrended) of calibrated diatom flux (n m−2 a−1) with winter (August–October) sea-ice concentration 1980–2010. Hatching indicates region of significant (p < 5%) negative correlation (max r = −0.6); black star indicates the location of the Ferrigno ice core; sea ice area mapped from ERA-Interim grid at lower resolution than AP coastline and the area shown in the figure lies within the demarcation of the Amundsen and Bellingshausen Seas given in Figure 1.
Geosciences 10 00087 g009
Table 1. Summary of diatom identifications.
Diatom TaxaSample YearsNumber of SpecimensTotal
Fragilariopsis kerguelensis2006 (2)
1994
1990 (2)
1989 (2)
1988 (2)
2
1
2
2
2
9
Thalassiosira lentiginosa2006
1995
1993
1
1
1
3
Thalassiothrixgp2006
1989
1
1
2
Eucampia antarctica2005
1989
1
1
2
Fragilariopsisspp.*1998
1988
1
1
2
Chaetoceros rs198211
Dactyliosolengb198911
Odontella sp.200511
Nitzschia sp.199811
* Excluding F. curta, F. cylindrus and F. vanheurckii. Bold type indicates NAZ taxa; rs—resting spore; gb—girdle band; gp—group.

