1. Introduction
The first study on electrohydrodynamic propulsion was carried out in 1920 by Paul Alfred Biefeld and Thomas Townsend Brown, who hypothesized that the electric field interacted in some way with the gravitational field, in what they called the Biefeld-Brown Effect [
1,
2]. Subsequent studies confirmed that the gravitational field was unaffected, and that the thrust was produced by a phenomenon now known as ionic wind. For the Biefeld-Brown effect and the ionic wind to occur, two electrostatic forces and a neutral fluid are required. When a high potential difference, of the order of kV, is applied between two electrodes, one acting as the anode or emitter and the other as the cathode or collector, the fluid surrounding the anode is ionized and the resulting ions are pushed towards the collector [
3,
4], creating a net thrust in the opposing direction to the direction of ion flow, without moving parts or gas emissions.
From these initial studies, research continued, firstly, the Biefeld Brown effect was analyzed in depth; in [
5] the invalidity of Brown’s assumption of a possible connection of gravitation with electromagnetism was demonstrated and some previous results obtained in near-vacuum conditions were also studied. NASA studied this phenomenon in 2004, [
6], in a way closer to the study conducted in this article by proposing the use of asymmetrical capacitors (ACTs). In this research, they qualitatively predicted how the magnitude of the thrust changed as the design of the ACT varied. Tests were also performed in nitrogen and argon at reduced pressures. They concluded that Biefeld-Brown effect was fully explained by a very simple theory that uses only electrostatic forces and the transfer of momentum by multiple collisions.
Since then, even more detailed studies have been carried out, such as the one presented in [
7] which an experimental and theoretical analysis where the mobility of the ions and the dissipation of energy in the form of heat are evaluated. In 2013 a complete set of equations was obtained, [
8], for an asymmetrical capacitor. The paper was aimed at the optimization of electrical and geometrical parameters of this type of thruster as well as to obtain a simple mathematical model.
One of the first studies that tried to assess the feasibility of using ionic wind for electric propulsion flight was presented in 2014, [
9]. The calculation of the thrust force for different configurations of thrusters was thoroughly analyzed. The methodology used presents common points with the one applied in this paper, but it did not introduce the energy study and W/g efficiency analysis. Even so, the global conclusion is coincident insofar as it proposed the use of several thrusters in cascade capable of producing considerable thrust values.
In very similar terms, during the same year, another paper was published in which the aim was the optimization of the thrust produced by thrusters of very similar topologies manufactured in a “handmade” way, [
10].
The number of publications in this field is large. Until 2019 the design of EHD thrusters is deeply analyzed, refined, and oriented towards space propulsion. During this period, one can find very deep and rigorous studies brilliantly developed more in the field of physics than that of engineering. In [
11], a microfabricated atmospheric ion engine is presented. In 2017 three extensive publications can be found where different types of EHD thrusters are comprehensively analyzed. In [
12] the results of the modeling of single stage EHD thrusters with different cathode configurations working at sub-atmospheric pressure are shown. In [
13], a one-stage EHD thruster with a funnel-like cathode that uses nitrogen is thoroughly studied. Finally [
13], in a comprehensive manner, summarizes [
12] and [
13].
Despite its high energy efficiency, this type of propulsion is limited by the difficulty of producing a very limited thrust, unless a thorough and complex study is made on how to redesign the thrusters and use the aircraft cell itself to install to increase it. Nevertheless, its field of application, already pointed out by other researchers [
8], would be found in aerostatic or very light UAS combined with solar panels, nowadays of very low cost, light and flexible to obtain the necessary energy as primary source for the high voltage converter.
Some papers have been recently published in which the fundamentals of EHD thrusters have been applied to electric propulsion flight. Although the value of these studies is undeniable, methodologically they are not as rigorous as previous works and in some cases are inconclusive. Authors of present a study, somewhat similar to those carried out in [
12,
13,
14,
15], although it does not go as deeply into the physical analyses. By first time, the architecture of the DC/DC converters used to excite the electrodes is shown.
To the best of the authors’ knowledge, apart from the well-known test carried out by the Massachusetts Institute of Technology with an extremely light 5 m glider, and the use of ionic wind for drag reduction in fixed-wing aircrafts presented in [
16], no other attempts to connect electrohydrodynamic propulsion with atmospheric flight exist. In [
16] an asymmetrical capacitor is built on a wing section with one of the electrodes placed on the leading edge. With a handmade wind tunnel and a rather elementary instrumentation, the drag coefficient is measured for different angles of attack. Despite the rudimentary nature of the system, at low relative wind speeds (around 7 m/s) a reduction of the drag coefficient and increases in lift varying between 2 and 4%, depending on the angle of attack, are observed.
From the above review it can be concluded that the use of EHD thrusters as an aircraft propulsion system is a subject that has aroused and arouses interest, and its future viability, either as a pure propulsion method or combined with electric propulsion in atmospheric flight aircraft, manned or remotely piloted, presents a wide field of study.
For this reason, this paper presents a study, which to the best of the authors’ knowledge has not been carried out, in which the performance of electrohydrodynamic propulsion is quantified using simple thruster topologies, to compare it with conventional electric propulsion, taking into consideration, for the latter, the weight, power consumption the drawbacks that arise when trying to scale up the phenomenon.
For the sake of clarity, the following section will start by presenting the structure of the most elementary EHD thruster together with the equations governing its behavior, and then continue with the methodology, instruments and tests performed.
2. Materials and Methods
A brief review of the operating principles of an asymmetrical capacitor EHD thruster will be the starting point of this study. In an asymmetrical capacitor, one electrode acts as the emitter or anode, and the other as the collector or cathode. When a potential difference is applied between them, a non-uniform electric field is produced. Once the applied voltage reaches the value necessary to produce the corona effect, the gas surrounding the emitter is ionized, throwing ions towards the collector. If the displacement of the ions were to take place in an absolute vacuum, the ions would accelerate within the electric field until they are captured by the cathode.
However, when they do so in a gas, they collide with neutral particles to which they give up kinetic energy. The accelerated neutral particles, not being affected by the electric field, freely move between the emitter and the collector, causing a reaction force on the electrodes that translates into thrust.
Figure 1 shows an elementary asymmetrical capacitor.
The equations used below are based on the references [
8,
9], where a deep review of the physical processes involved in the system shown in
Figure 1 is addressed. However, such a complex and thorough analysis is out of the scope of this paper. Therefore, as the authors themselves indicate, the use of only three equations is enough to understand all the involved phenomena, as well as the methodology of our study.
being the current per length unit, the initial voltage, a constructive constant which depends on gas properties and the electrode design, the resultant thrust, the electrohydrodynamic force, the drag caused by the ionic wind flowing around the collector (a cylindrical electrode identical as the one used in our study), the distance between emitter and collector, the ion mobility and the electromechanical effectiveness, measured as the ratio between force and electrical power.
It can be deduced from Equation (2) that the thrust can be increased by reducing and increasing the value of as well as the distance between electrodes. However, the increase in caused by also decreases the electromechanical effectiveness .
The drag
is proportional to the ionic wind velocity [
8] and the velocity, in turn, is proportional to
so thrust can be expressed as follows:
where
is constant and the rest of the variables are as defined above.
From this mathematical analysis it was concluded in [
9] that the configuration that optimized the thrust had to contain 3 anodes. However, in the study to be presented below, it was decided to use only one. Although the use of a single anode reduces the efficiency of the asymmetric capacitor, this design is simpler constructively, and allows to achieve the objectives sought; to experimentally evaluate the thruster performance with different distances between collector and emitter, to quantitatively determine the influence of the electrode length, and to use a dual configuration with two identical asymmetric capacitors in parallel at different distances. All this, with μA current resolution and a reduction of the surface area occupied by using a single collector.
3. Results
The materials used in the manufacture of the thrusters will be first reviewed. For this purpose, the dielectric properties of different plastics (ABS, ASA and EPS) will be compared. Then, its structure, power supply system, measurement and environmental control will be presented. Subsequently, several subsections will include the studies of the electric field carried out by means of FEM analysis, and the obtained values will be compared.
Table 1 shows the dielectric properties of the plastics used in the construction of the Thrusters.
Table 1 shows how ABS and especially ASA, that are commonly used in 3D printing, have very high values of dielectric strength ideal for the manufacture of the structure of the thrusters. Although the study was carried out almost entirely using ASA, it was found that for the dimensions and working distances, the use of EPS did not pose any problem.
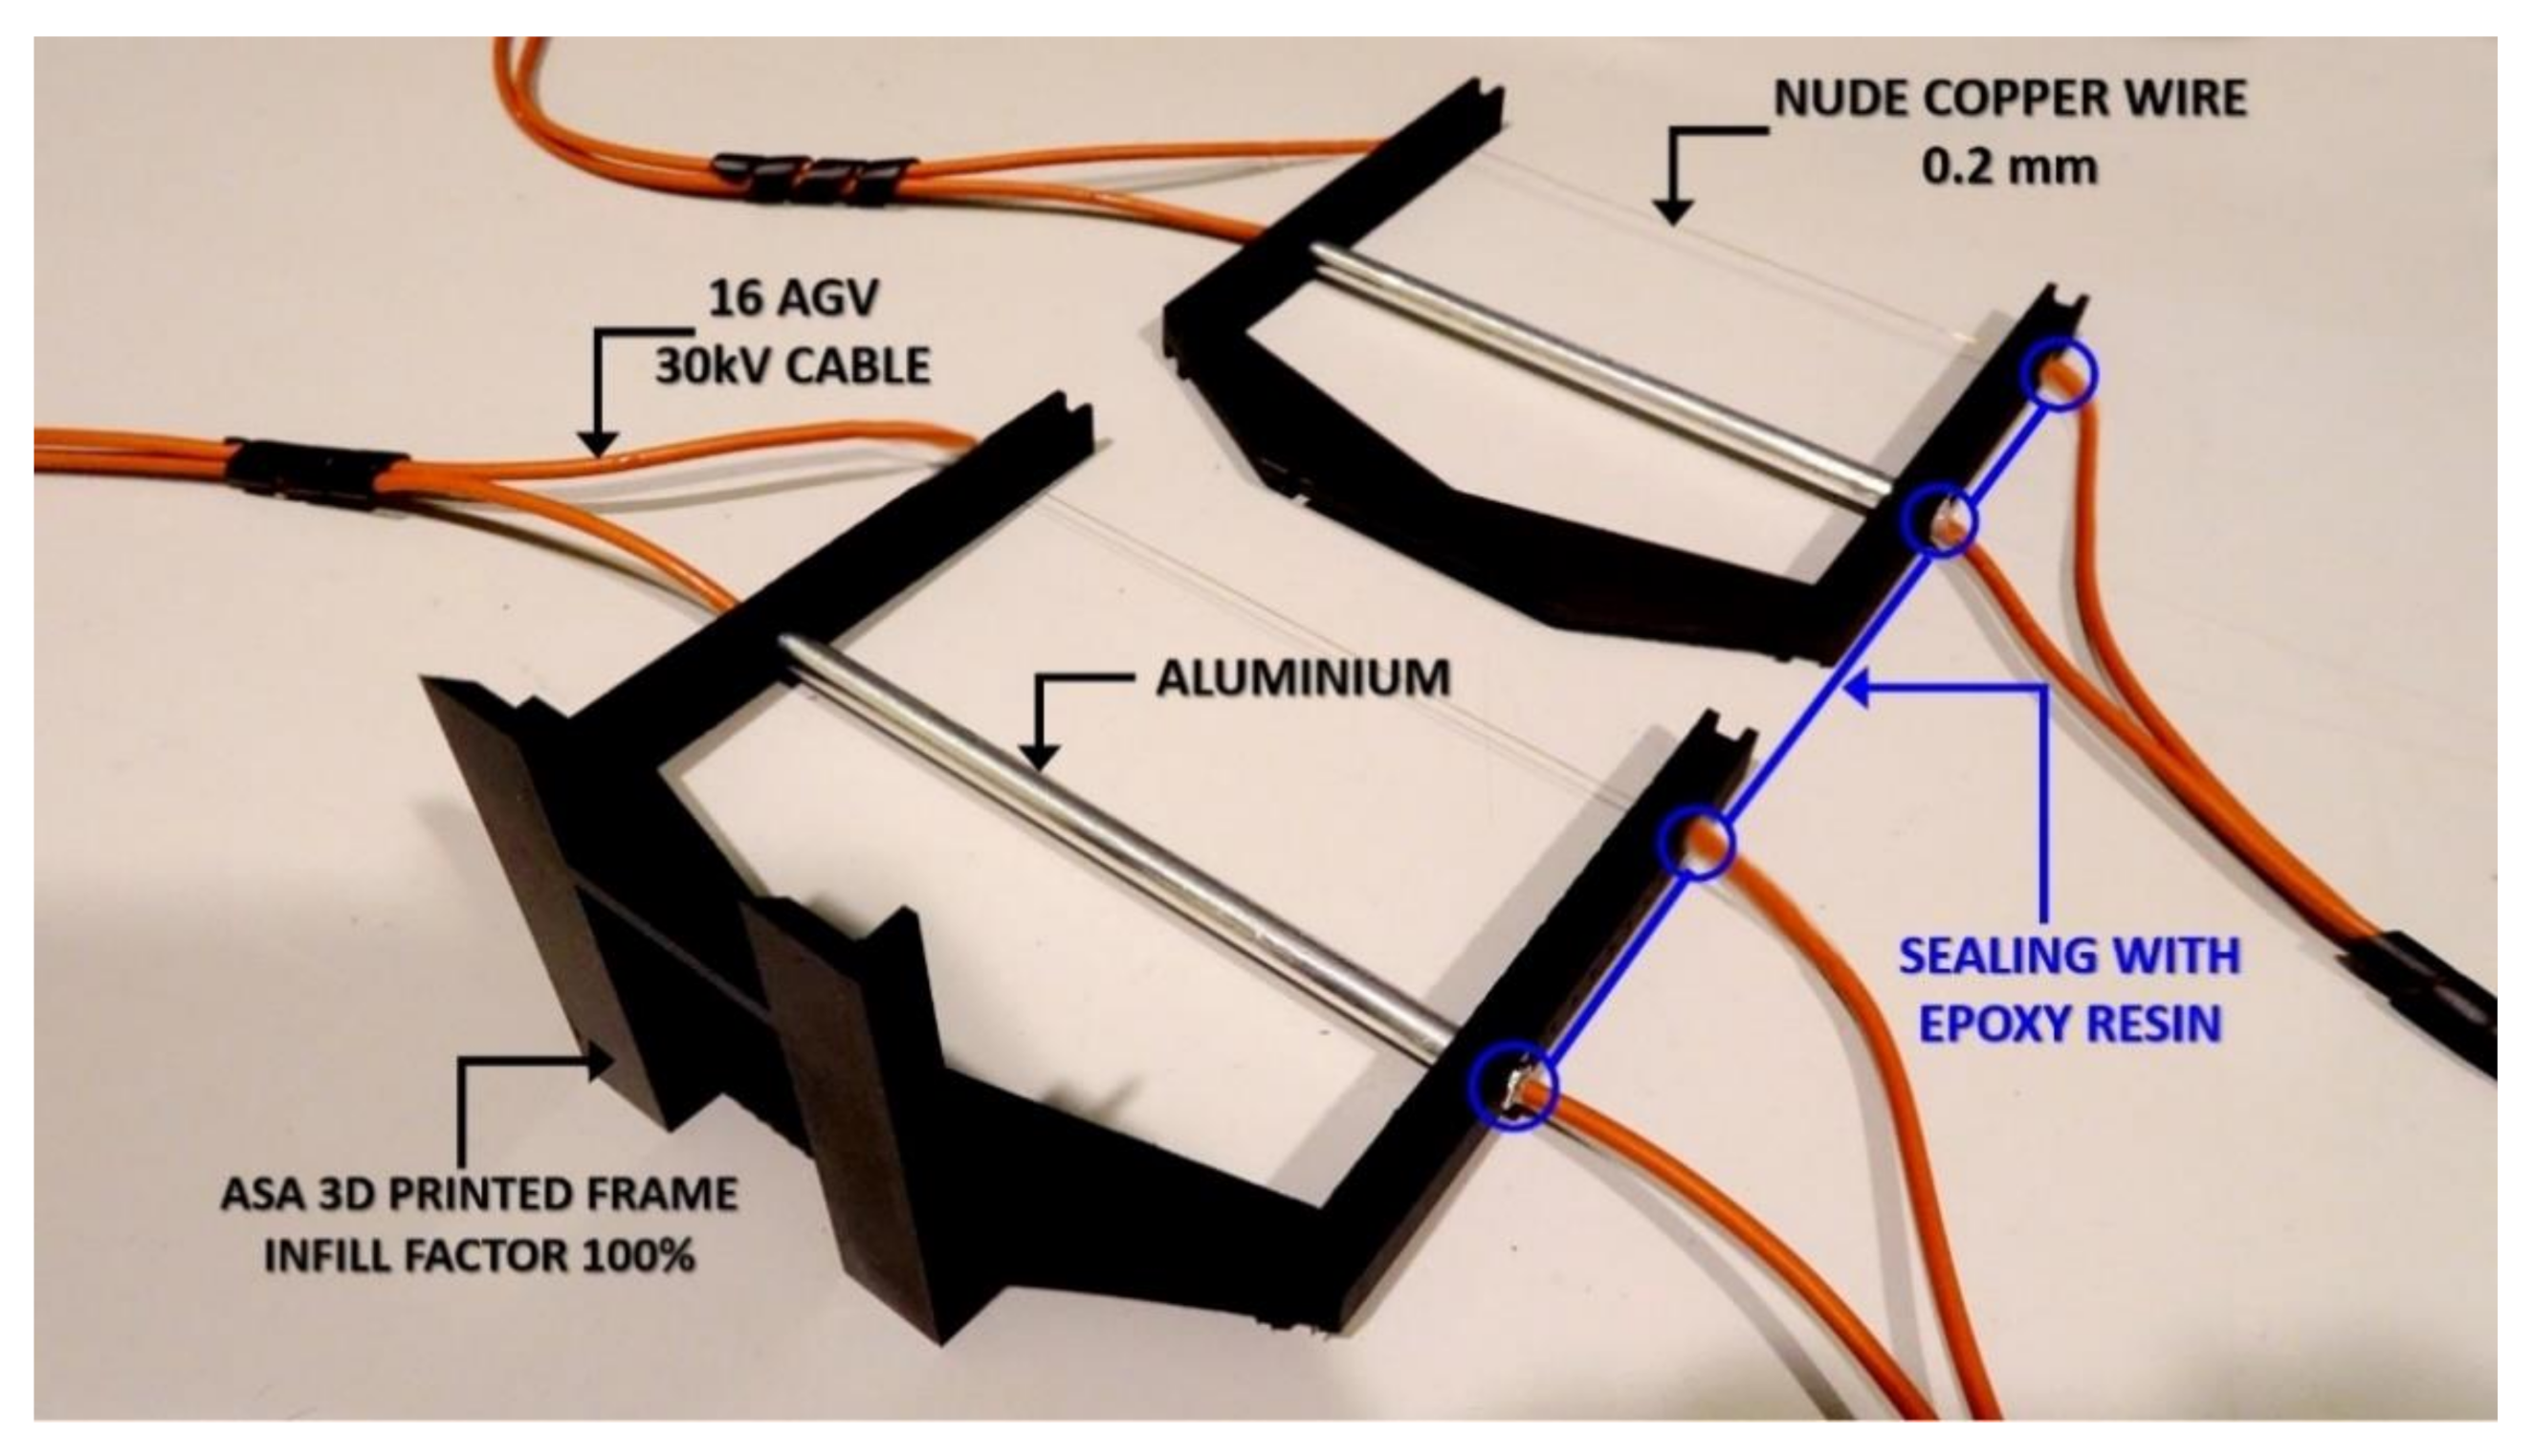
Regarding the remaining materials, bare copper wire of 0.25 mm diameter was used in the emitter. A hollow aluminum tube with an outer diameter of 6 mm and an inner diameter of 5 mm was used as collector. All the connections to the power source were made with 16 AWG 30 kV Electric Copper Core Flexible Silicone Wire, sealed with epoxy resin at the points where it was inserted into the frame of the thruster, to avoid any corona effect outside the emitter.
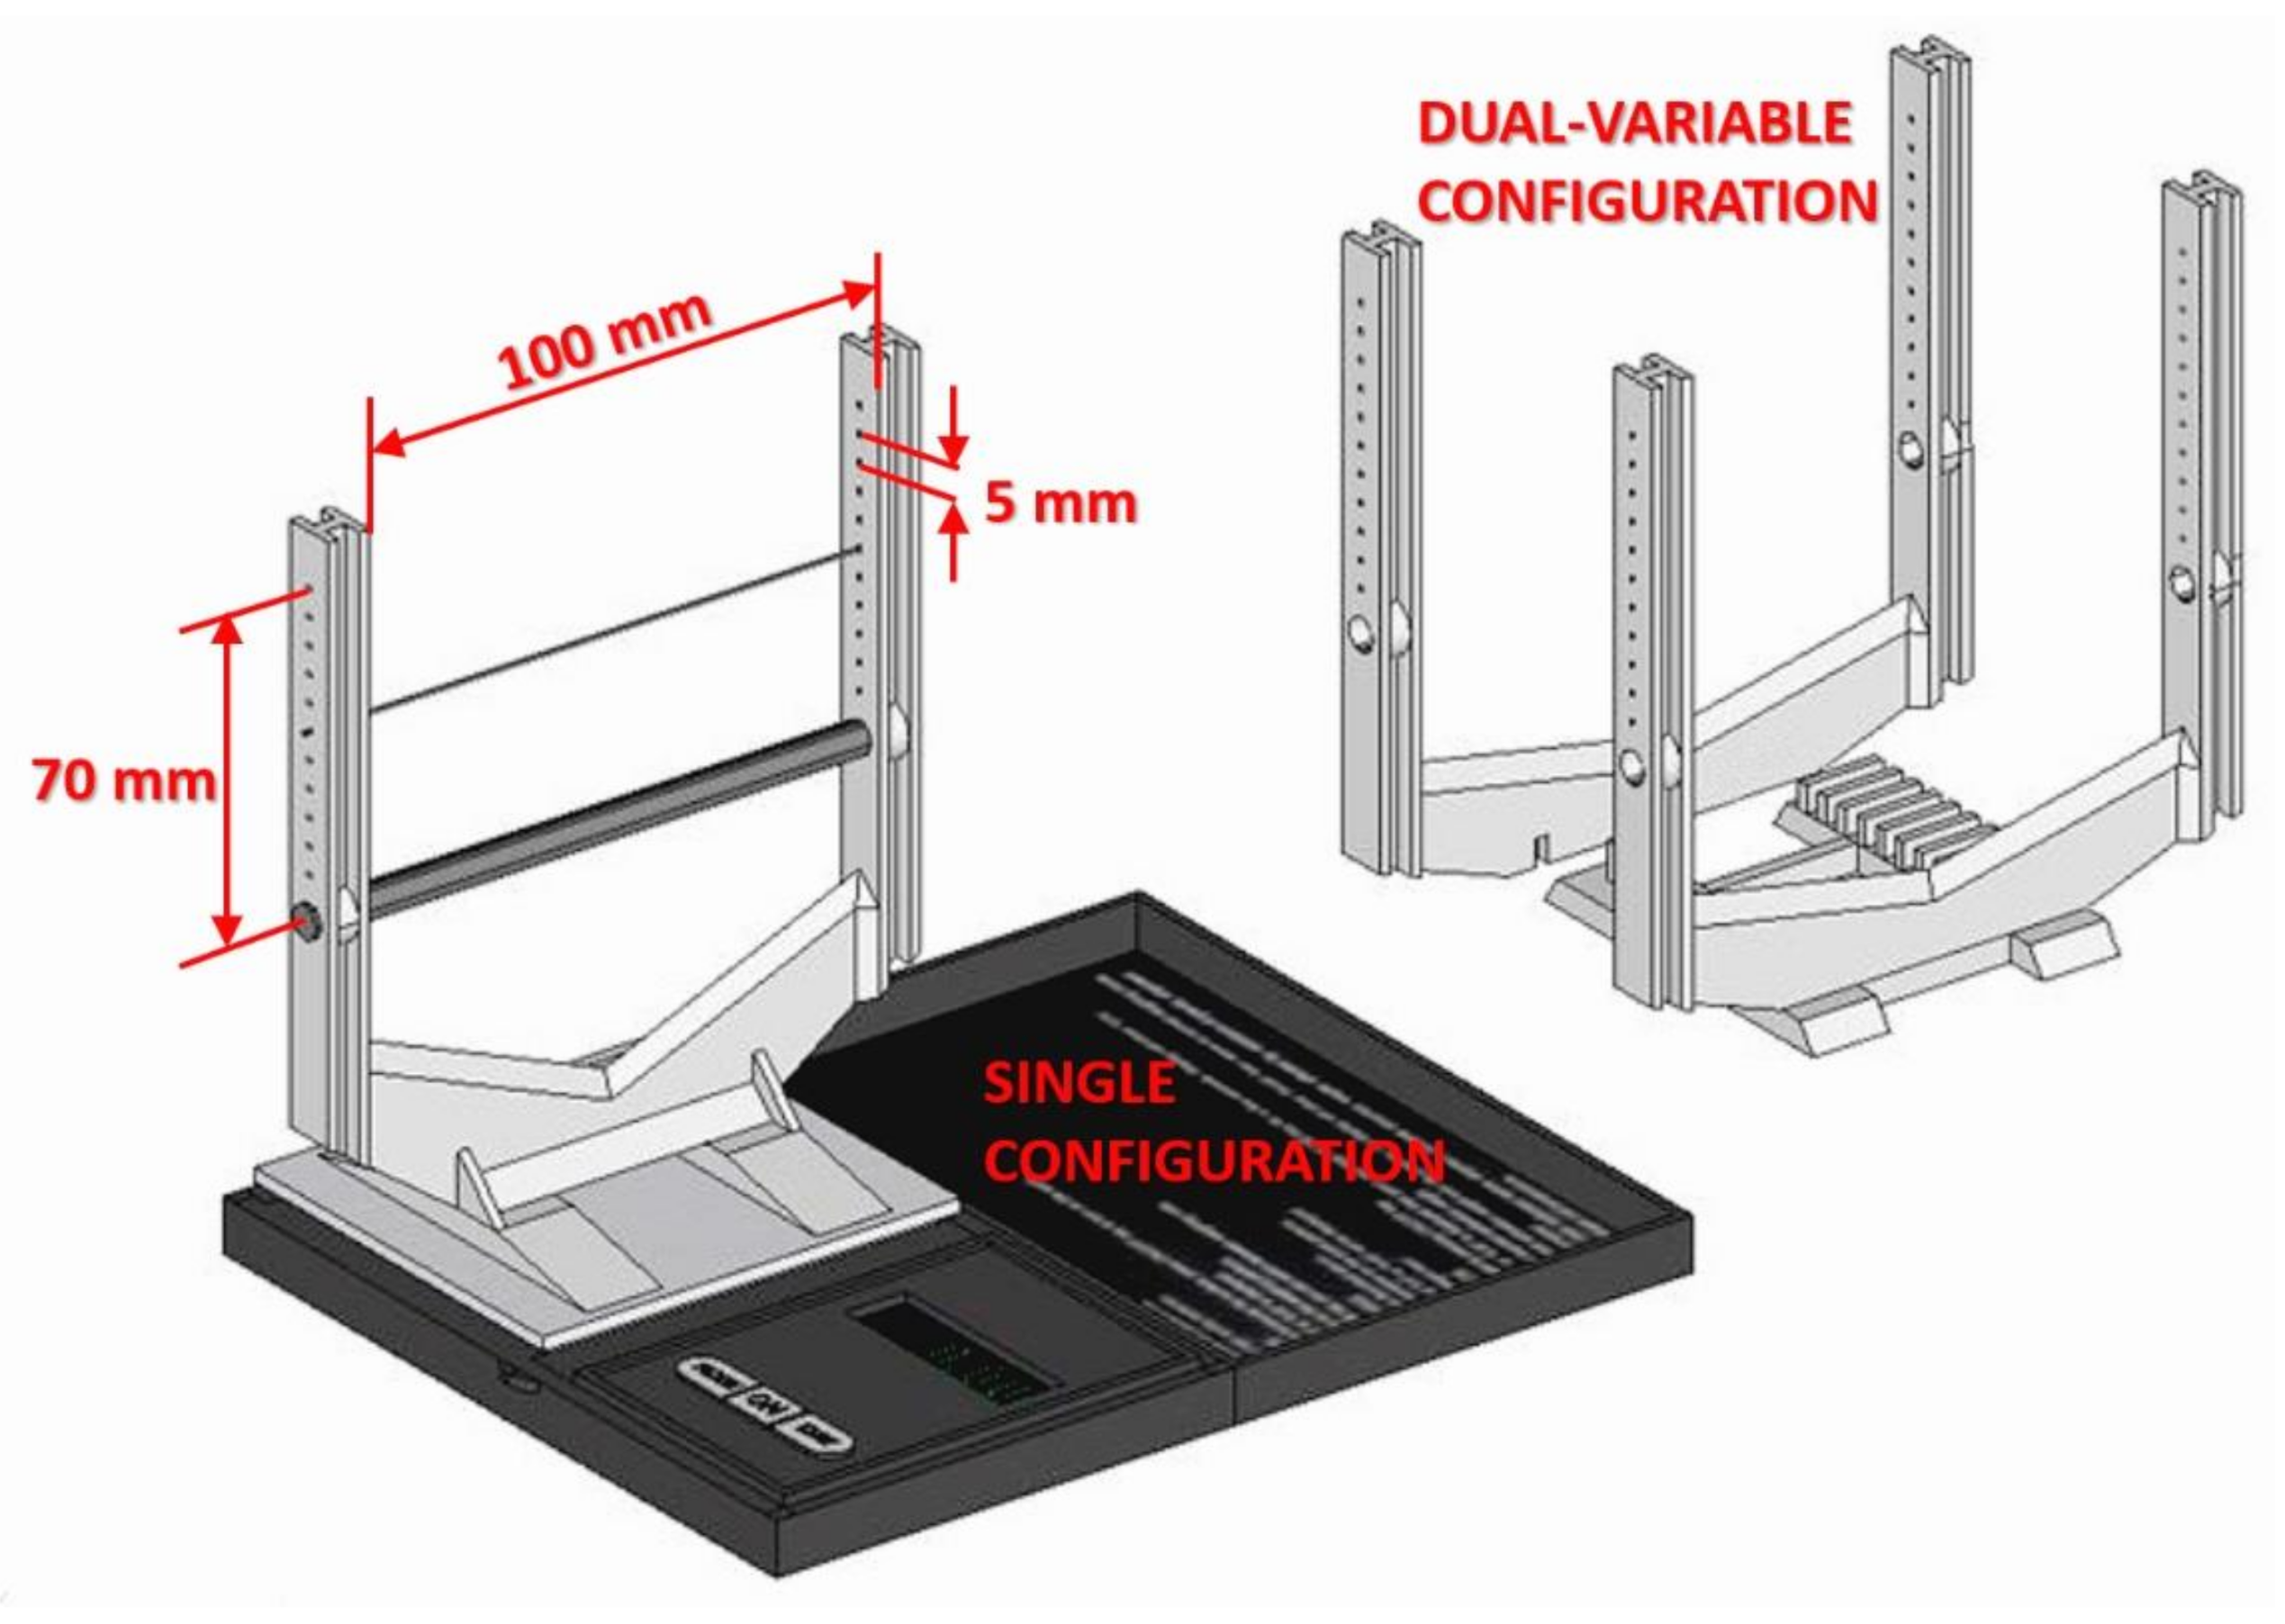
Figure 2 shows a general view, with the dimensions of the thrusters, in which a single and a dual configuration can be observed, the dimensions and the distance steps between anode and cathode are delimited.
3.1. Description of the EHD Trhusters
This section presents all the devices built as well as the equipment used as power supply and the test procedure.
Figure 3 shows the ASA 3D printed structure. The layer height used was of 0.1 mm with a 100% infill factor and a tolerance around 12 µm. The cathode, the anode, the high voltage cable for the connections and the sealing areas with epoxy resin are also presented.
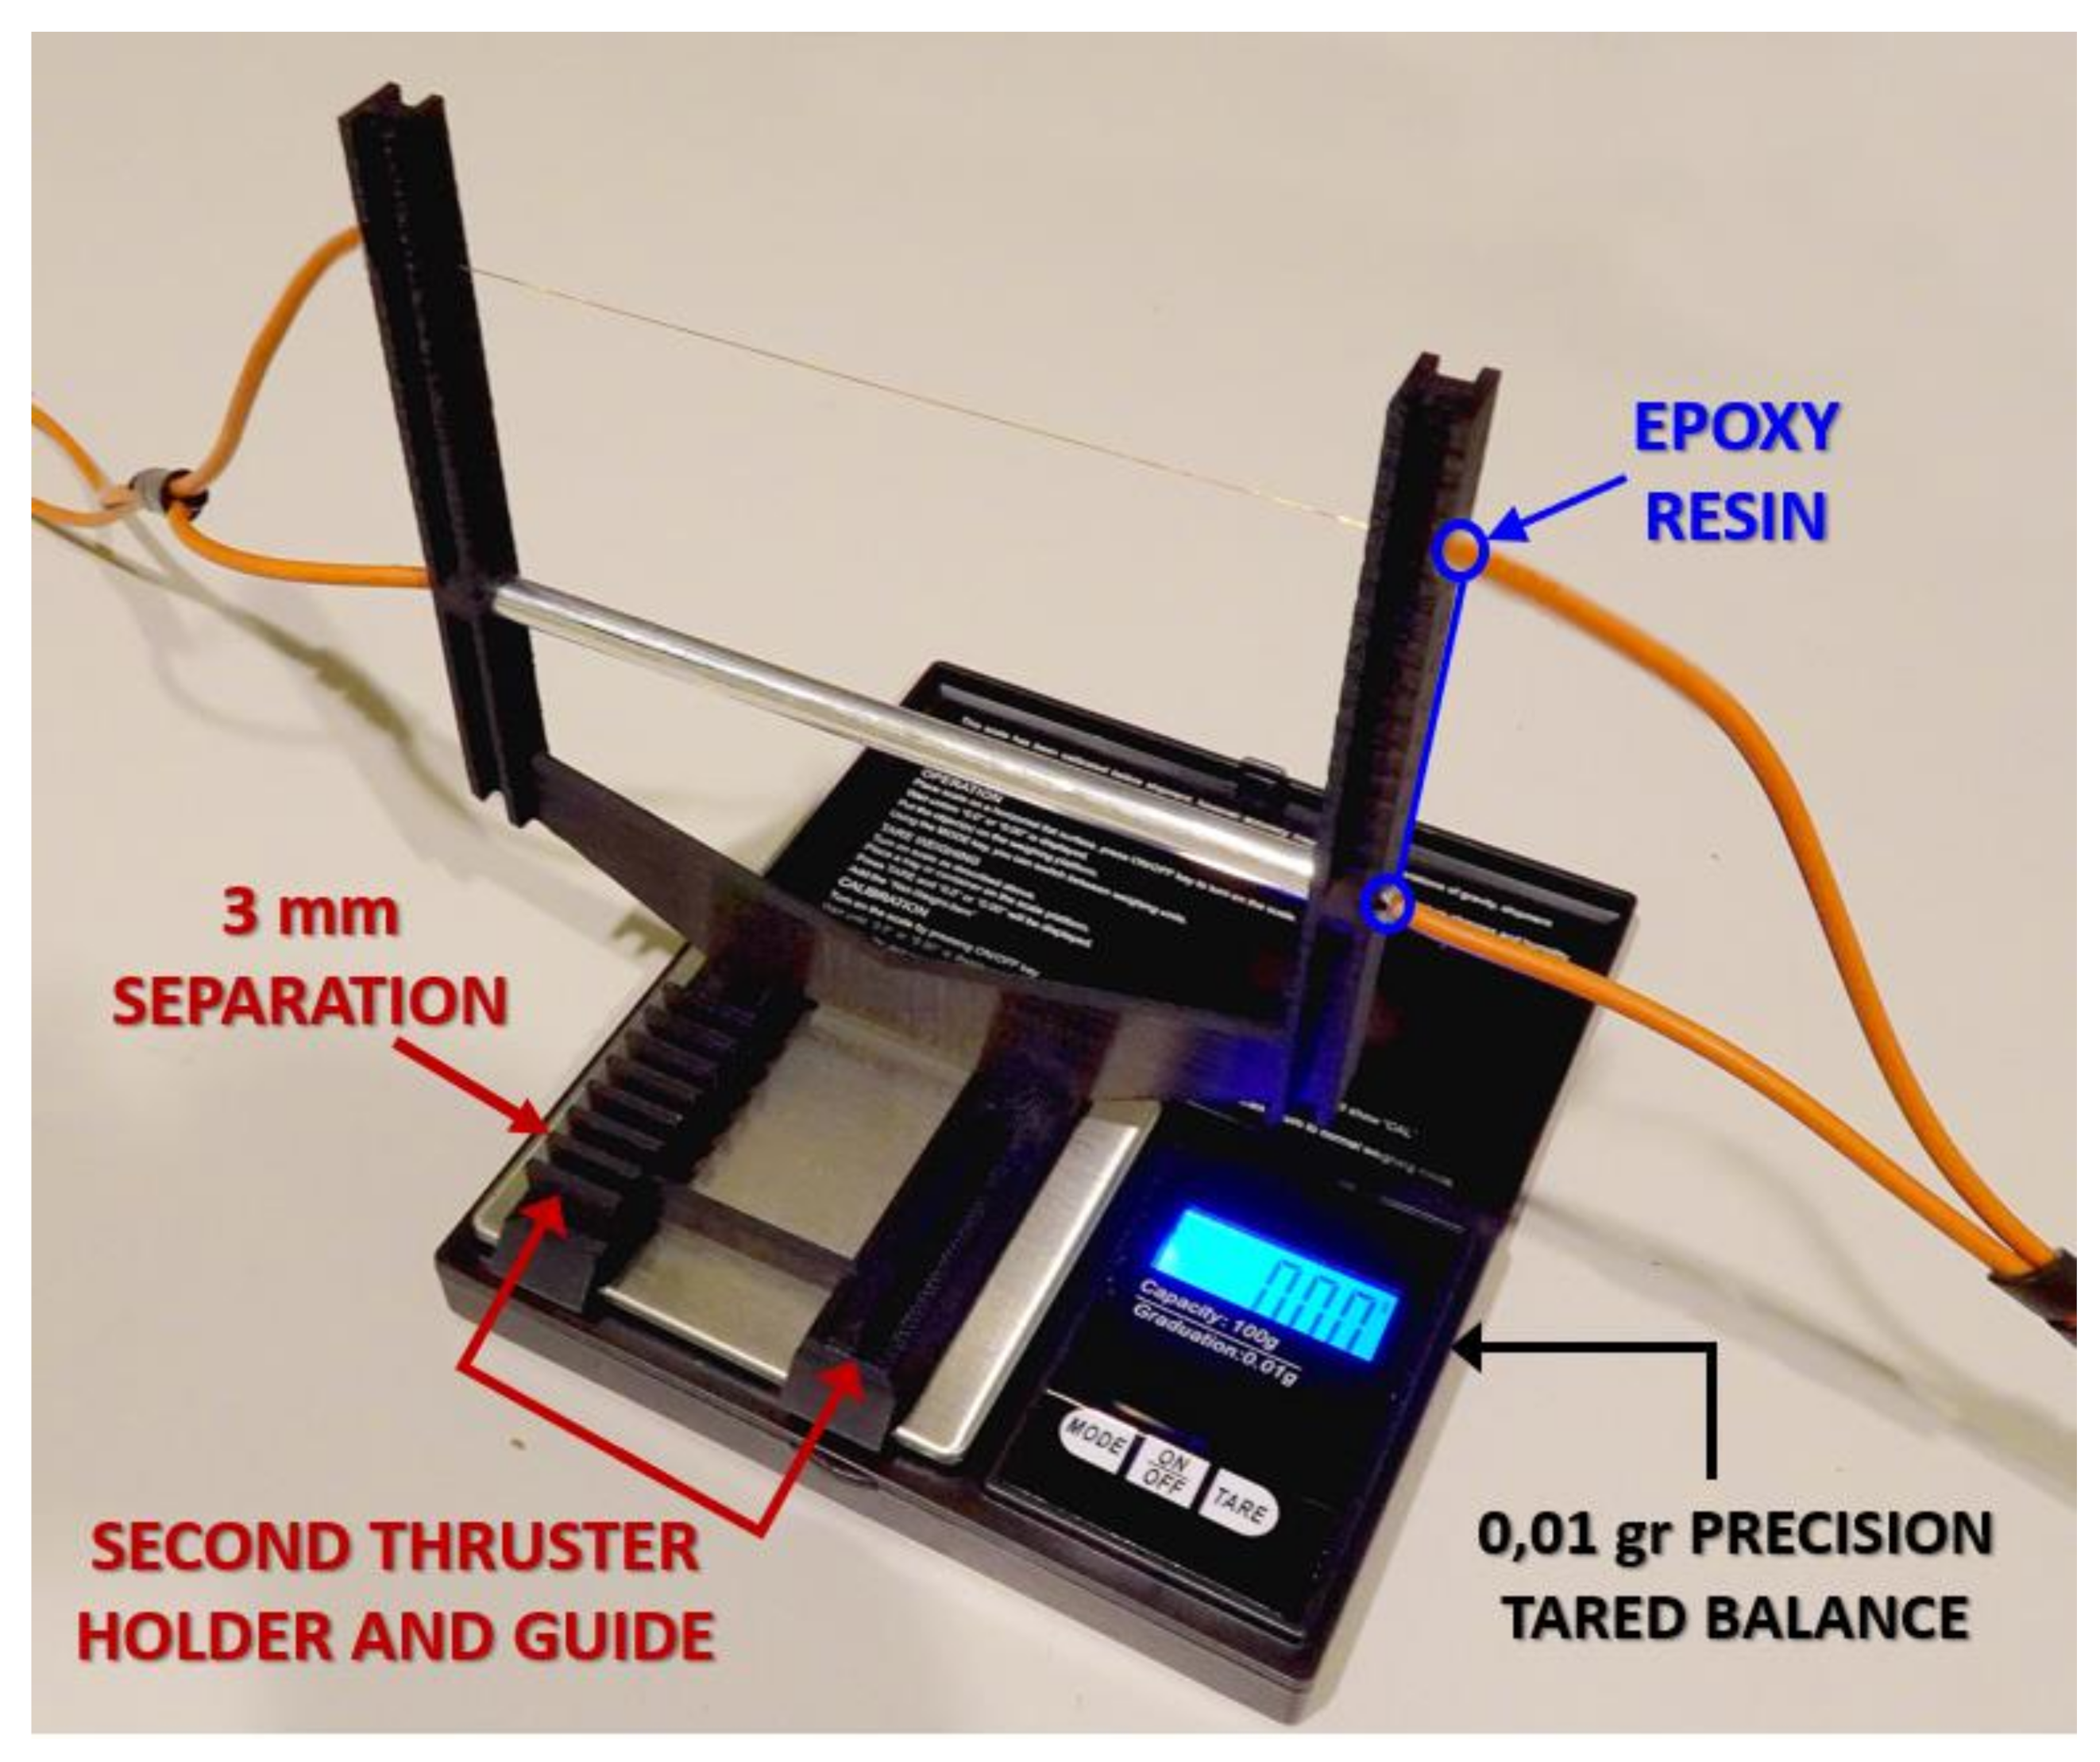
Figure 4 illustrates the method for measuring thrust using a precision balance. The process of measuring the thrust is straightforward; the thruster should be connected to the power supply and then, place it on the balance and tare the system to zero, to set the initial conditions. The thrust in g will appear as a negative value with an accuracy of 0.01 g.
In previous research [
15,
16], high voltage was usually applied to the thruster either by means of a flyback DC-DC converter or a relatively simple power supply, [
17]. While these options are undoubtedly adequate, none of them allow for an accurate current measurement since in all cases, an external current probe and, as in [
17], a Fluke™ 116 multimeter must be used. In this study, the thrust measurement setup is very similar to the one presented above but improved by the use of a high voltage laboratory, easing the current measurement and increasing the accuracy.
Figure 3.
Detailed view of the thruster.
Figure 3.
Detailed view of the thruster.
Figure 4.
Single-configuration asymmetrical capacitor ready for the measurement of thrust.
Figure 4.
Single-configuration asymmetrical capacitor ready for the measurement of thrust.
In all experimental tests a Baker™ D30R was used as power supply. This instrument is designed to perform DC Hipot, Surge, Dielectric Absportion (DA) and Polarization Index tests.
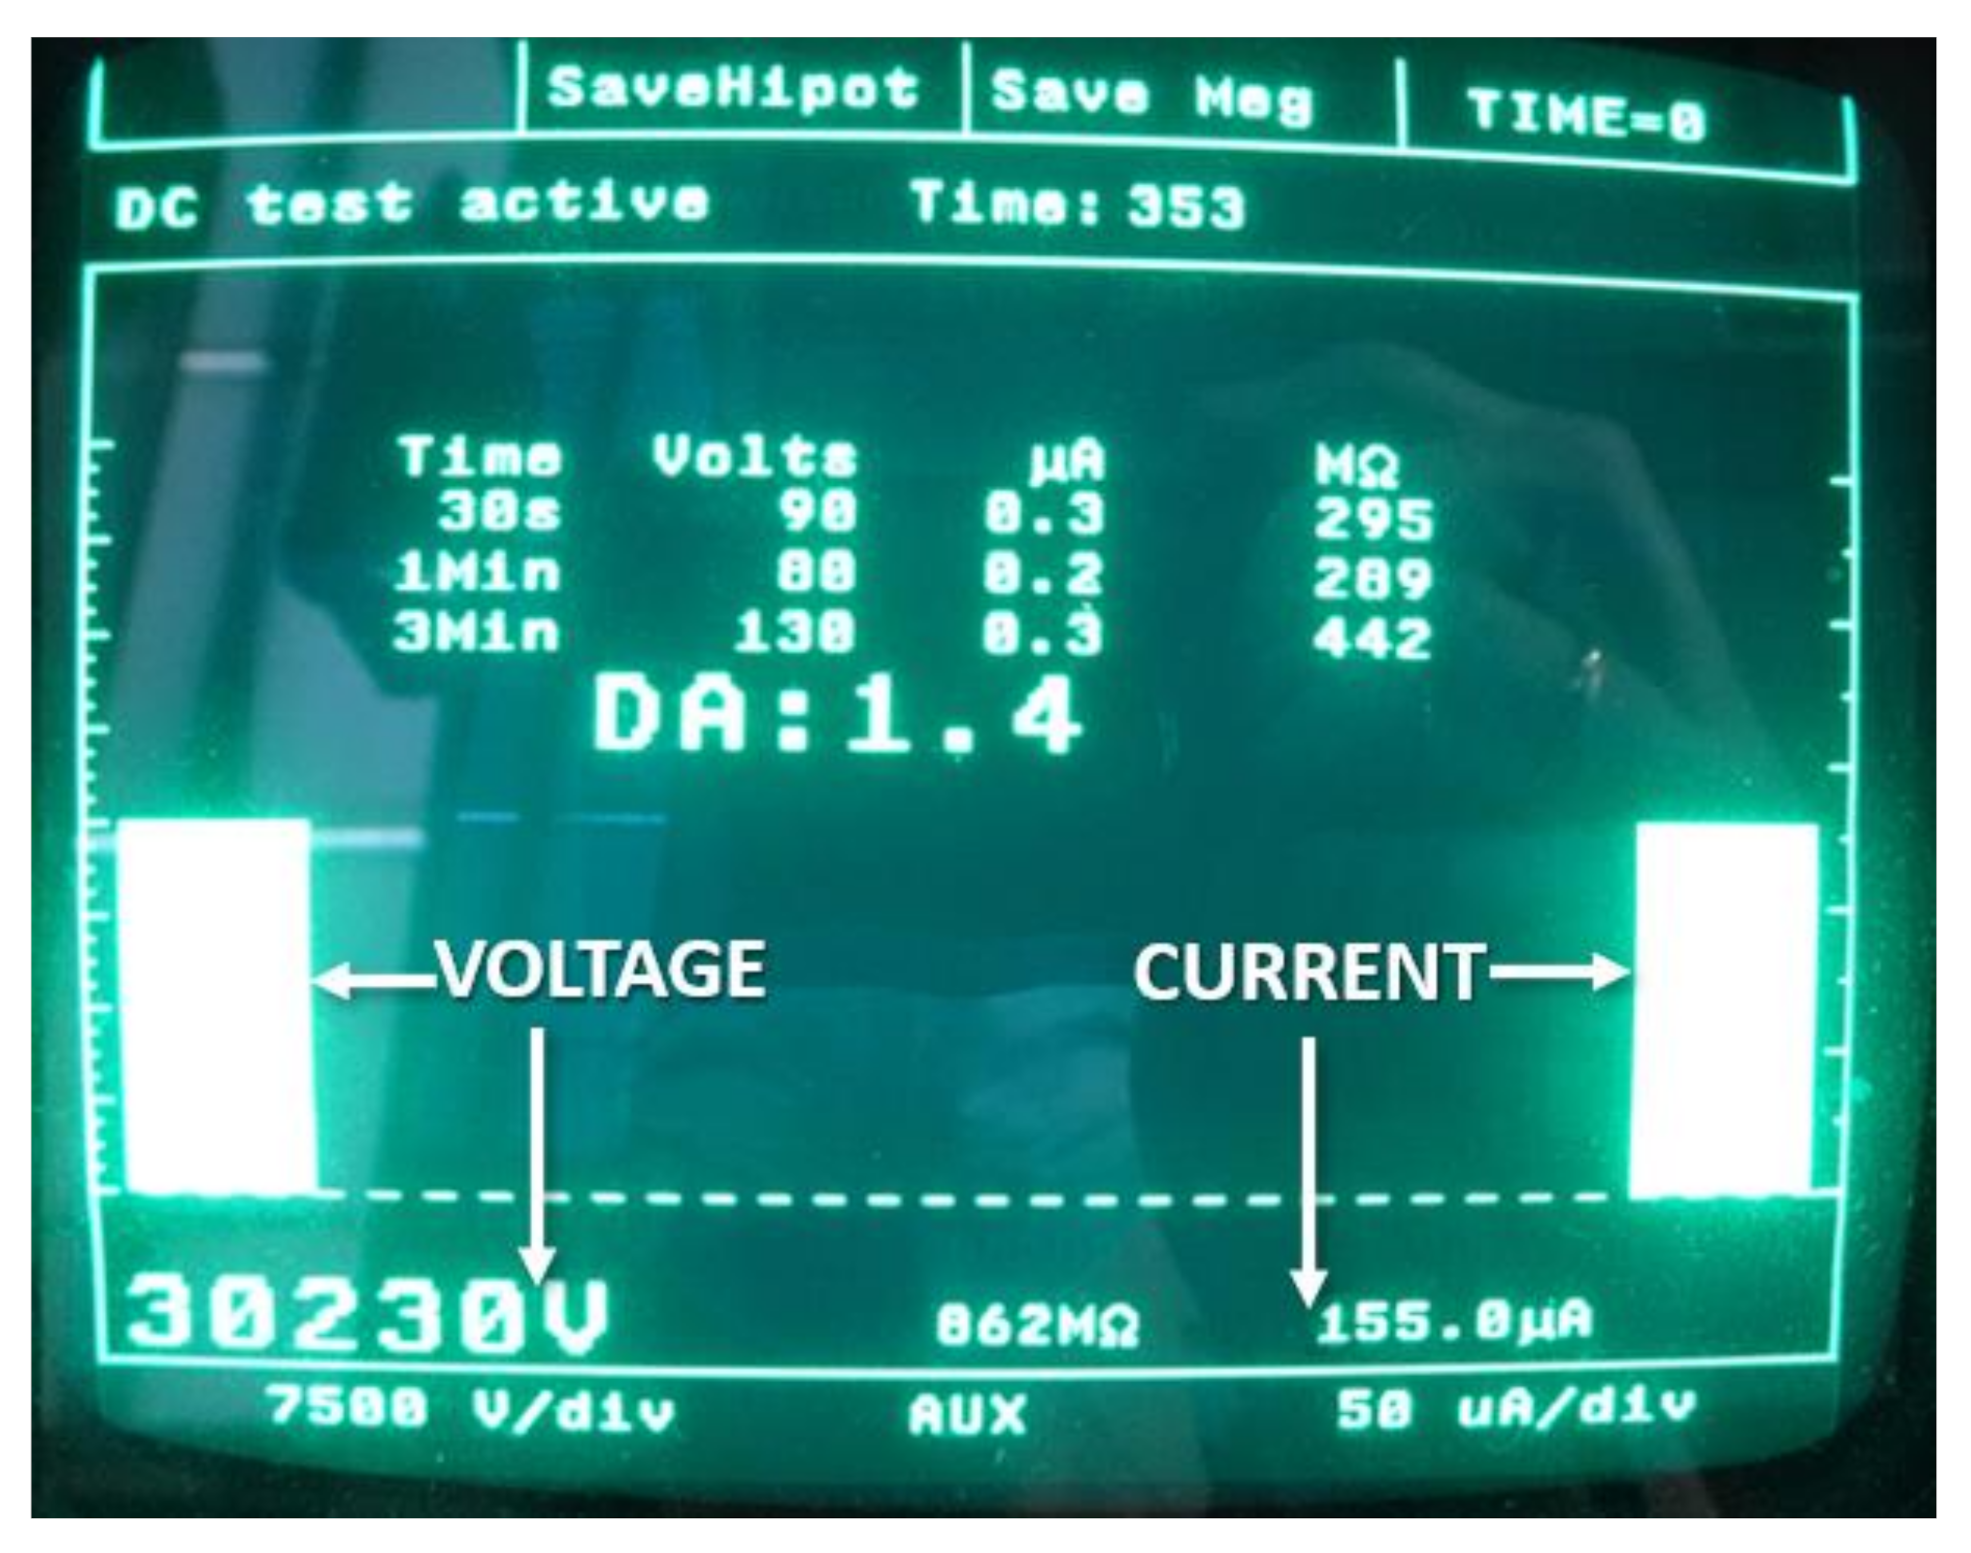
Figure 5 presents the setup during one of the thrusth measurements, a screenshot of the voltage and current measurements is shown in
Figure 6. Voltage is variable from 0 to 30 kV, although some previous tests were done at lower voltages, the results presented in the next sections were all obtained at 30 kV.
In addition to the advantages of variable voltage and innmediate current measurement, the instrument is equipped with a protection system that reduces or prevents the occurrence of arcing. When the current growth is too fast, the voltage application is deactivated. This prevents damages in the test specimen. The technical specifications of the instrument are summarised in
Figure 5, where it can be seen that the levels of accuracy in current measurement cannot be compared, for maximum current values below 1mA, with the use of a current probe and a multimeter.
Figure 6 shows voltage, current and insulation resistance during a test.
Figure 5.
Baker™ D30R Hipot, surge, DA and PI tester connected to the thruster during a test.
Figure 5.
Baker™ D30R Hipot, surge, DA and PI tester connected to the thruster during a test.
Figure 6.
Results of a test.
Figure 6.
Results of a test.
In order to carry out the experimental measurements with the maximum precision, environmental conditions under which they took place were controlled. For this purpose, a measurement station designed to be installed in an UAS to analyse environmental pollution was used. This piece of equipment measures humidity, temperature, and the concentration of multiple gases that appear as pollutants disolved in the air: CO, CO
2, SOx, NOx, and hydrocarbons. Each series of measurements was taken with virtually identical values for all variables.
Figure 7 shows a photograph of the instrument. The following section shows a brief analysis of the electric field and potential distributions in the single and dual thrusters.
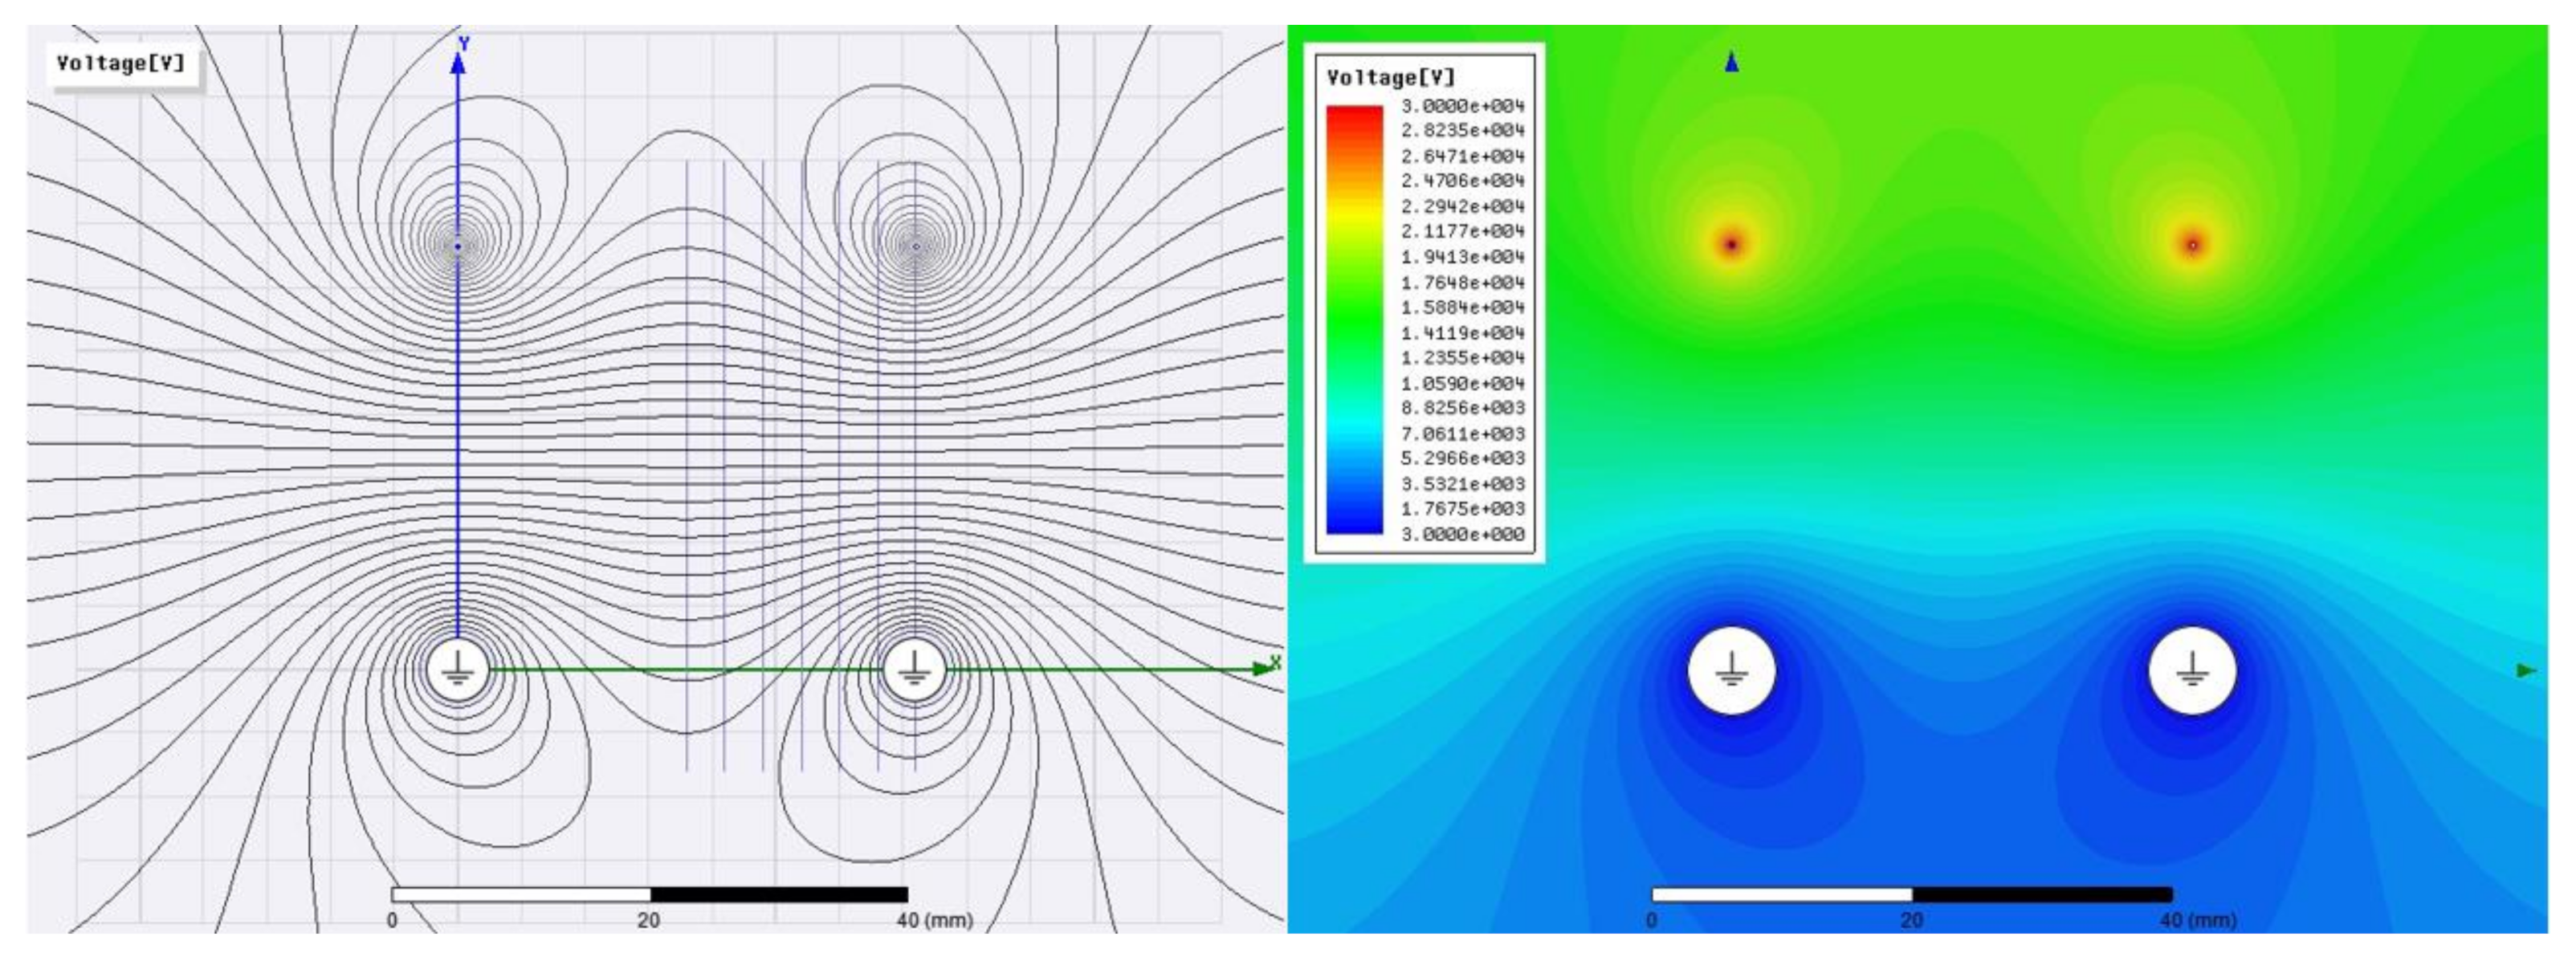
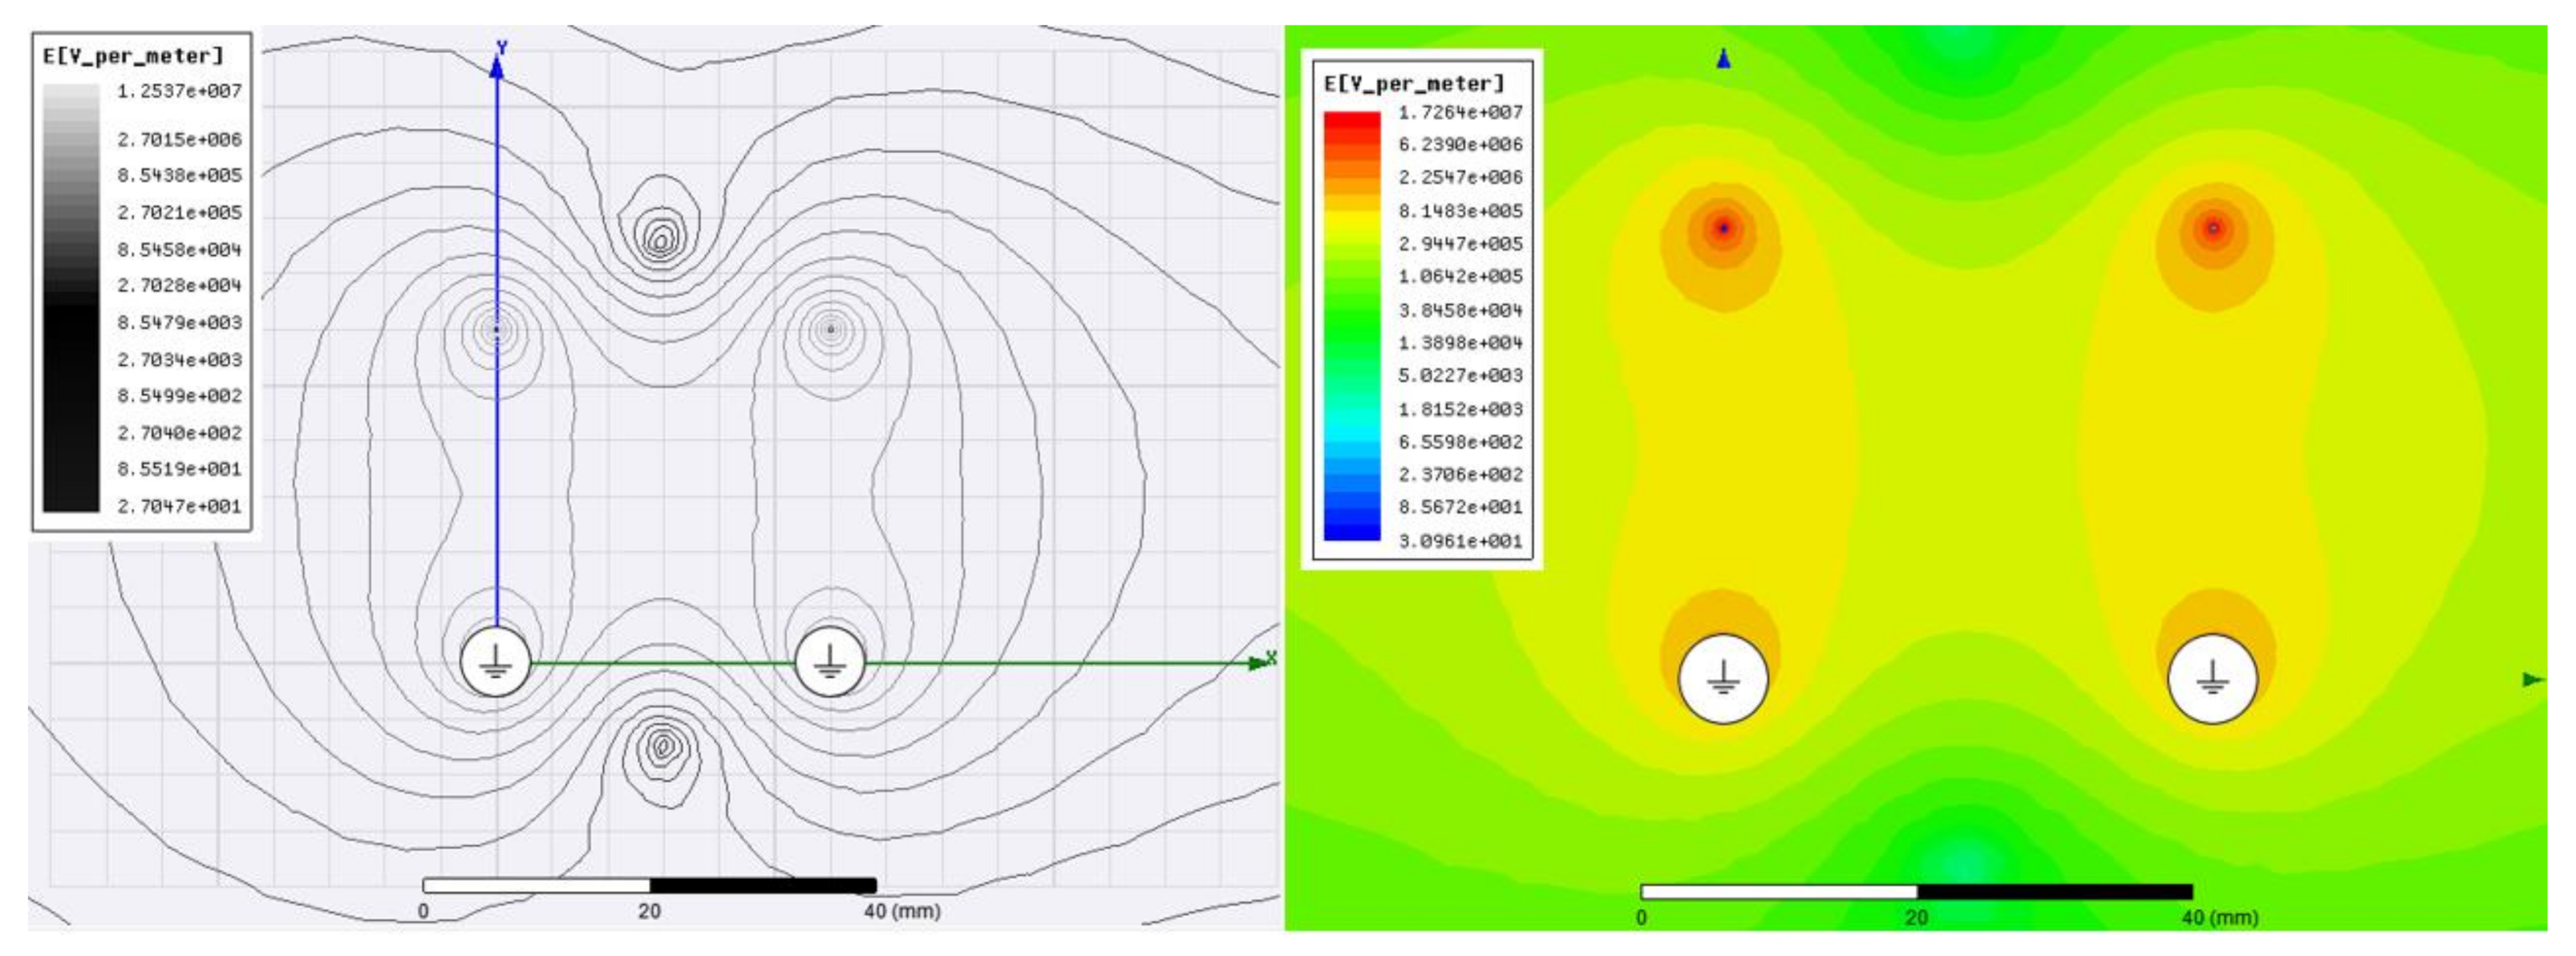
3.2. Finite Elements Analysis
The objective of this study is not to determine the optimal thruster configuration, but to observe the differences between the single and dual configuration. For this purpose, emitter and collector were simulated using Ansoft Maxwell2D™. The graphical results of the simulation are presented below if
Figure 8,
Figure 9,
Figure 10 and
Figure 11, followed by the conclusions that can be drawn from them.
In all the simulations only the potential and the electric field were studied. The magnetic field created by the current was disregarded since it could not be simultaneously simulated, and its effect was considered negligible. The results show phenomena that were already described in previous studies, [
1,
2,
3,
4,
5,
6,
7,
8,
9,
10]. The electric field in the collector is higher than that corresponding to intermediate air zones. This variation of the electric field is responsible for the appearance of a secondary corona effect, which reduces the overall efficiency. This effect is more intense when the distance between collector and emitter is reduced.
The dual model results indicate that the potential lines tend to adopt a flat distribution between the two thrusters. Reducing the distance and increasing the number of devices in parallel it is quite likely that a uniform potential would be achieved, that will give rise to a laminar ionic wind that could increase the overall efficiency. This possibility will be studied in the experimental tests.
3.3. Experimental Results of the Single Thruster
In this section the experimental results of the study of the single thruster will be presented, and in the following those of the dual thruster. Subsequently, the performance obtained in both cases will be compared with that of a conventional propulsion system consisting of a Brushless DC (BLDC) motor and its propeller, evaluated on a test bench specifically designed for this purpose.
All measurements were performed for the following environmental conditions:
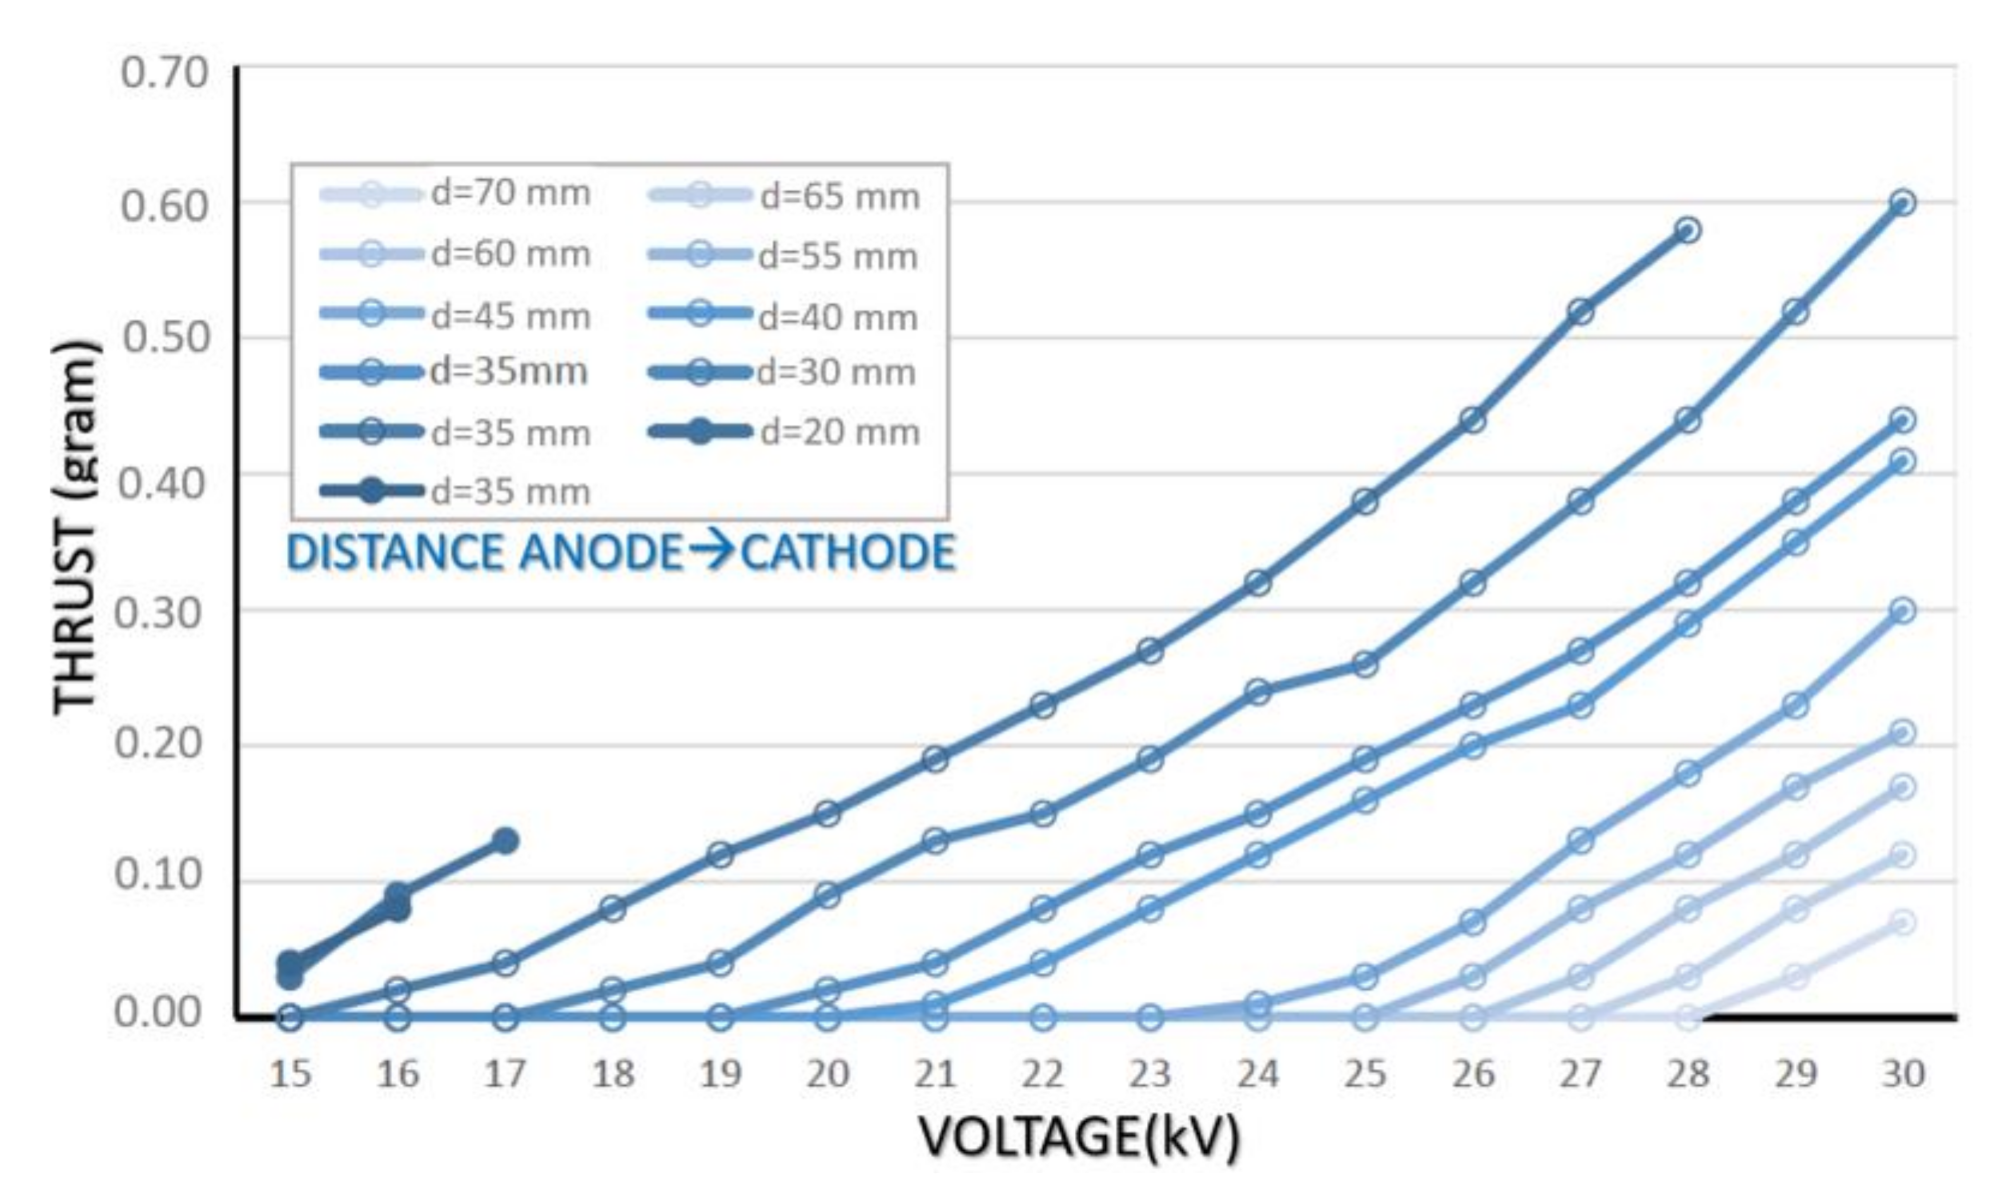
Figure 12 presents an almost linear variation between voltage and thrust. As shown in the graph, the best results are obtained when the emitter-collector distance is the range between 25 mm and 40 mm.
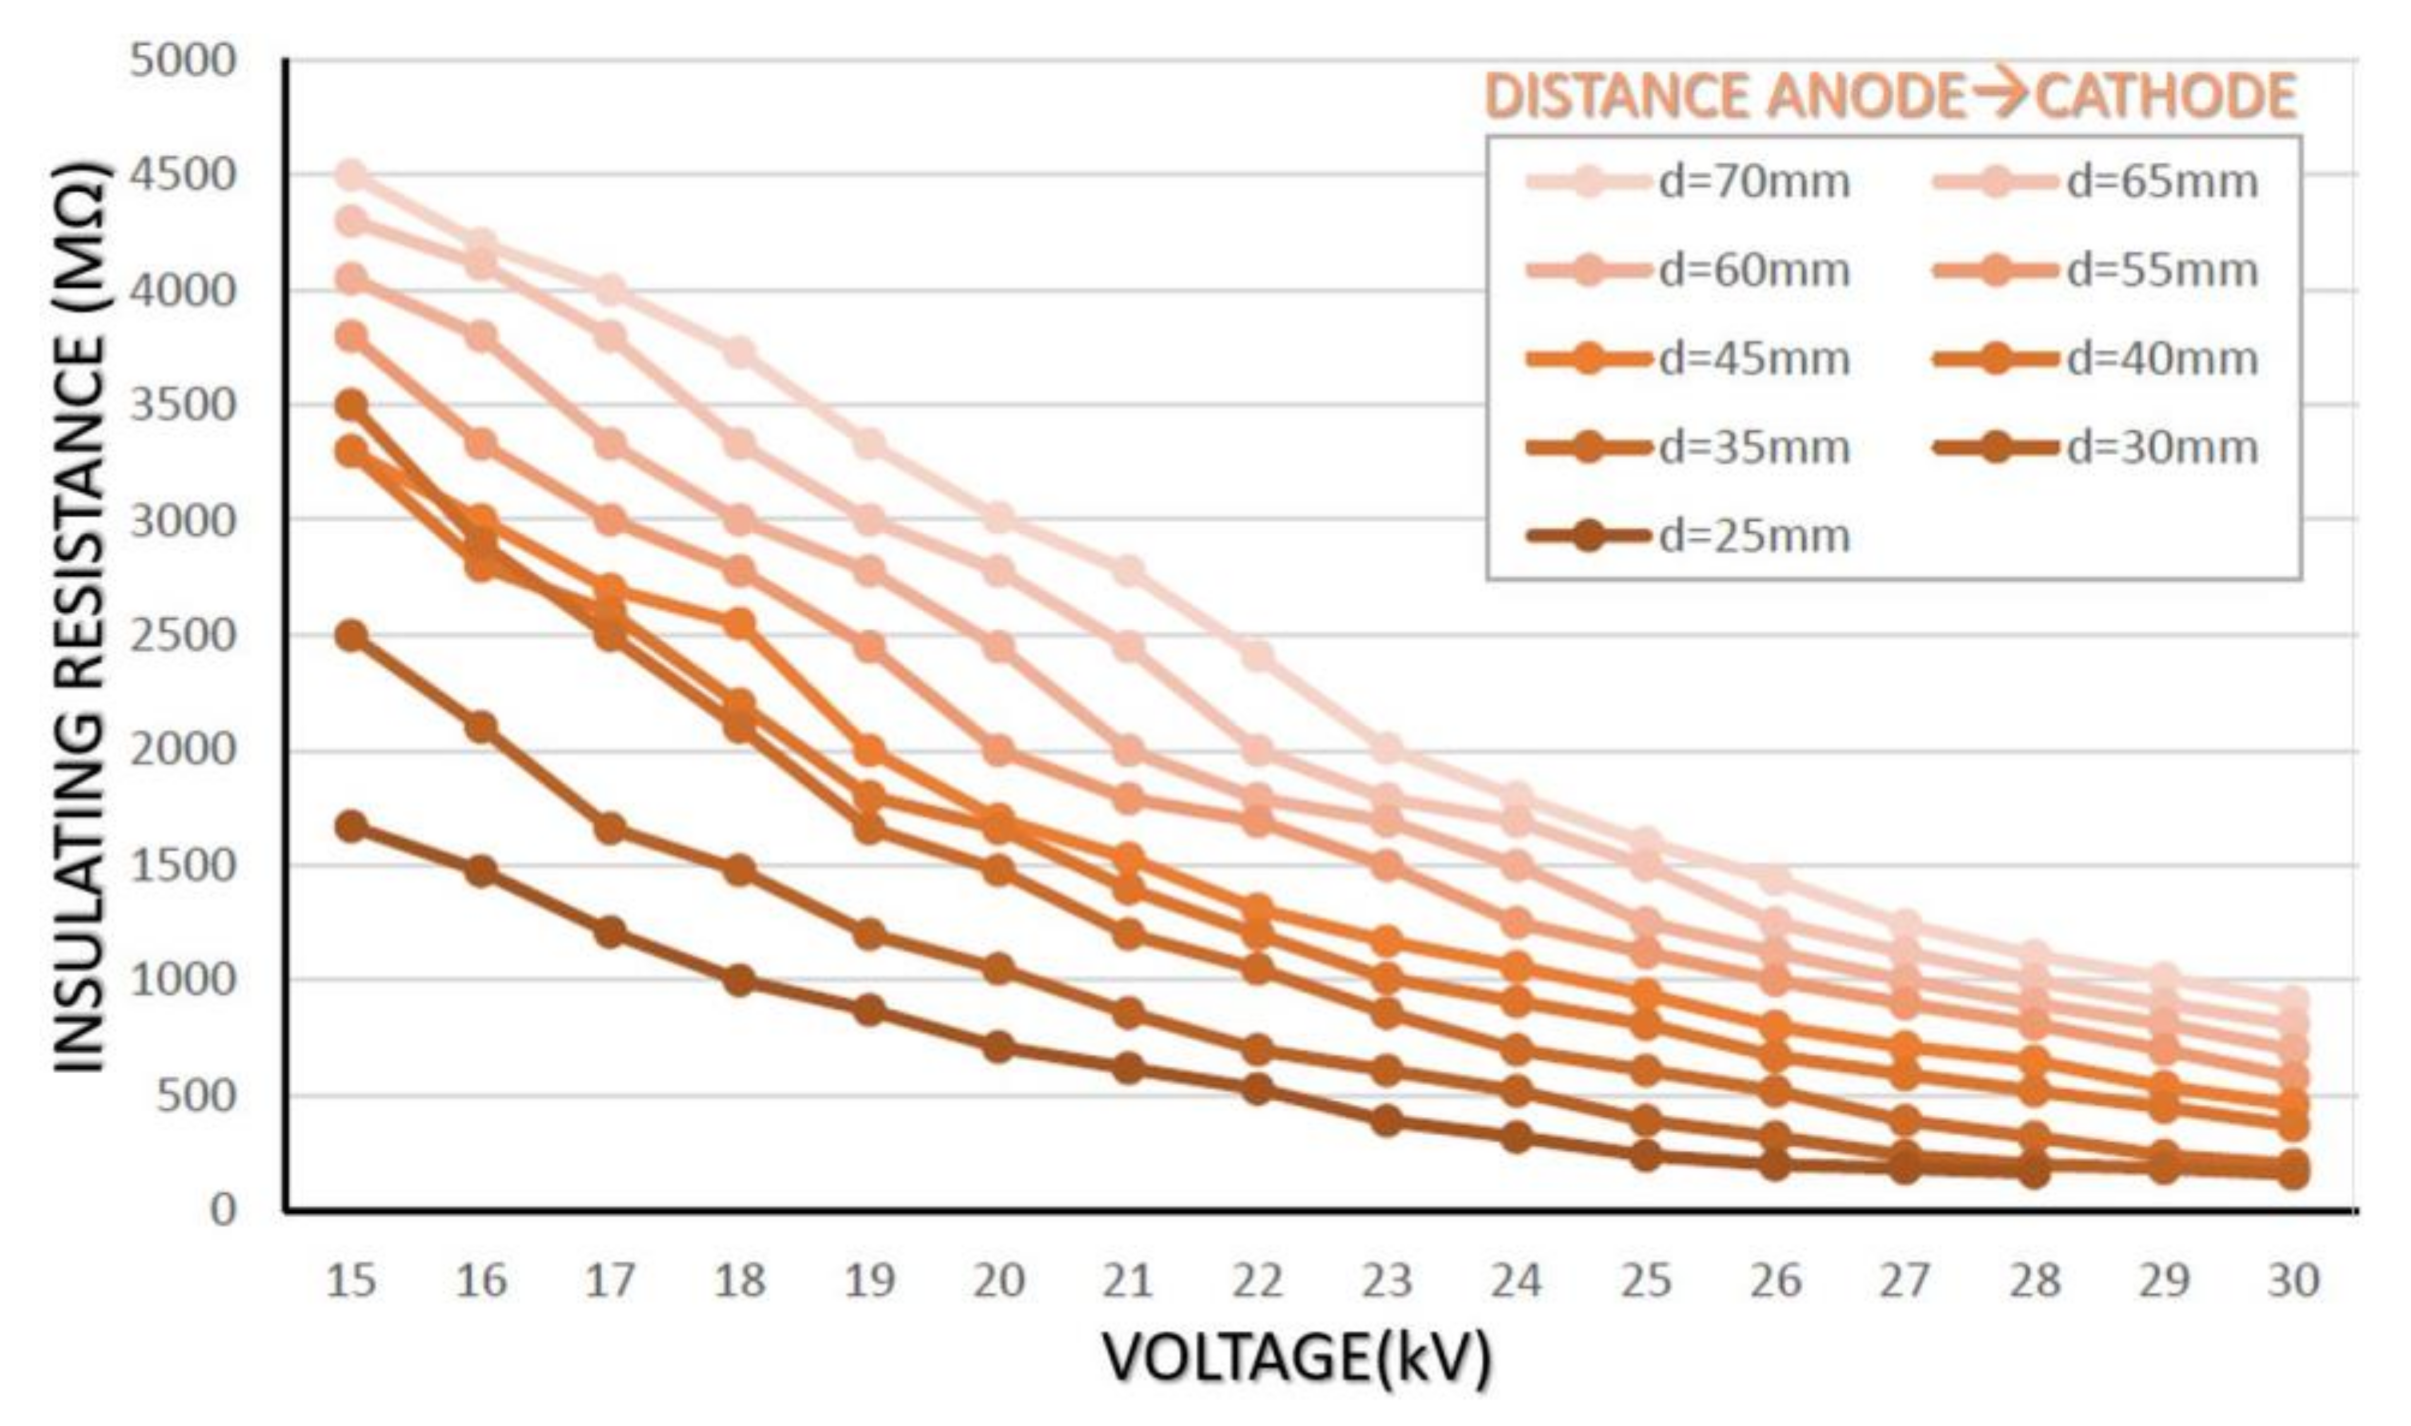
Figure 13 shows the current variation vs. voltage, at different electrodes separation. Current presents a nearly quadratic ratio that becomes almost linear when the electrodes approach one each other. The minimum distance is limited by the dielectric breakdown of the air between electrodes, in this case, 15 mm for a voltage of 15 kV. The instrument from
Figure 5 is designed to calculate insulation resistance as the quotient between voltage and circulating current, this way
Figure 14 has been obtained. Although in this graph it has not been possible to include the curves linked to distances at which arcing occurred it is useful to show that the minimum possible distance at 30 kV is 25 mm. Values of thrust in this initial test were low and its variation with distance relatively close to the resolution (0.01 g) of the measurement device. To improve the accuracy of the results and make possible a more rigorous analysis of the optimum distance between anode and cathode, the same thruster design was used but increasing the length of the electrodes up to 400 mm, its materials and measurement procedure were identical.
The conditions of the tests were the following:
Figure 12.
Single thruster: thrust vs. voltage for difference distances between cathode and anode.
Figure 12.
Single thruster: thrust vs. voltage for difference distances between cathode and anode.
Figure 13.
Single thruster: current vs. voltage for different distances between cathode and anode.
Figure 13.
Single thruster: current vs. voltage for different distances between cathode and anode.
Figure 14.
Single thruster: air insulating resistance vs. voltage for different distances between cathode and anode.
Figure 14.
Single thruster: air insulating resistance vs. voltage for different distances between cathode and anode.
Figure 15 shows how by increasing the electrode length 4 times the maximum thrust reaches 3.2 g compared to the 0.6 g obtained with the 100 mm thruster. The thrust increases by 5.4 while the length does it by 4. Although further study would be necessary, it is reasonable to think that this relationship is not linear, at least for this range of dimensions. The comparison of
Figure 13;
Figure 16, where the current consumption is observed, shows how increasing the length of the electrodes up to 400 mm produces a practically linear increase in current; 190 µA vs. 400 µA.
Figure 17 shows again the insulating resistance.
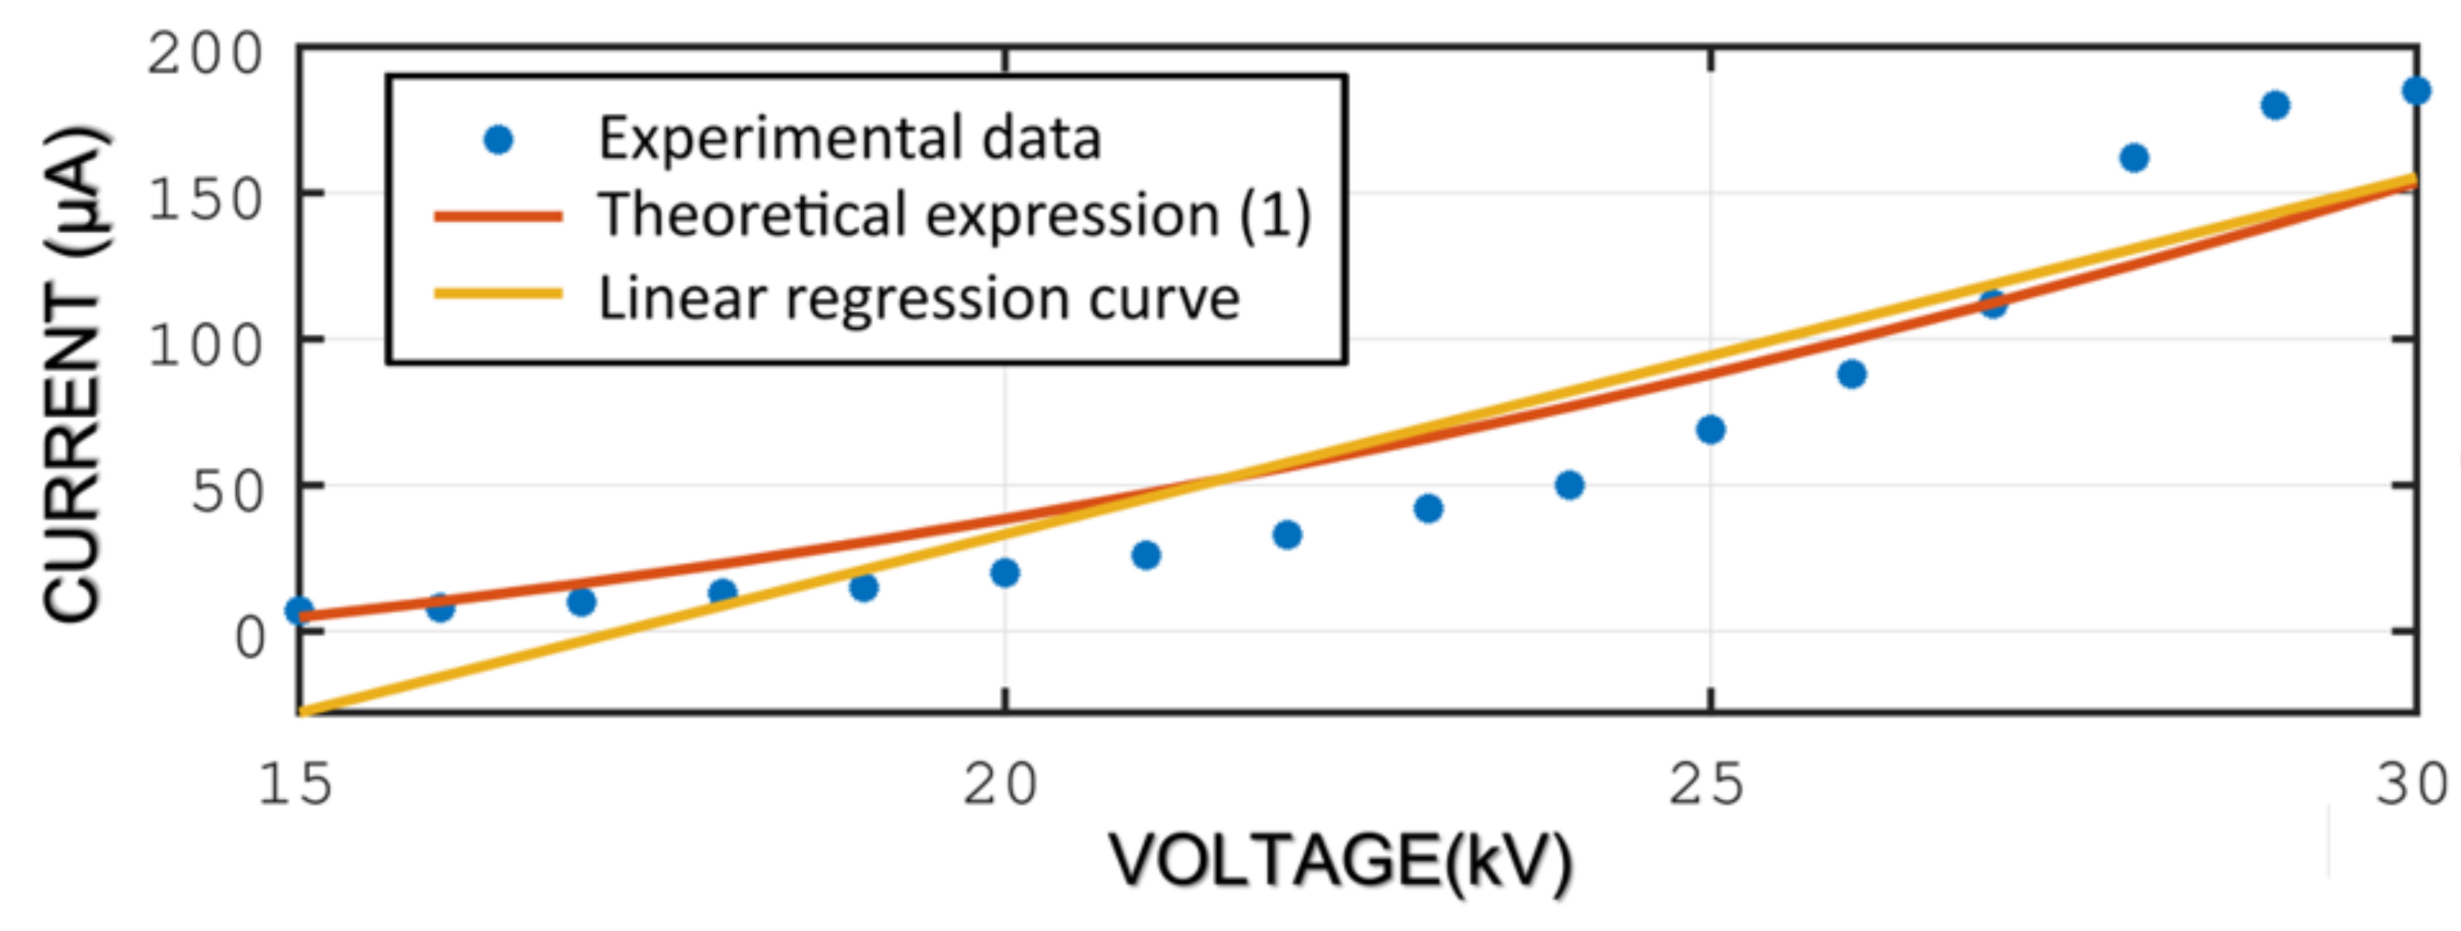
These results are in strong agreement with theoretical expression (1), where the current consumption is increased in quadratic manner with the applied potential. Considering the current drawn of the experimental set at d = 30 mm, it is possible to obtain an expression for the constant C, by a fit linear regression model of the experimental results curve, leading to a value of
, which is a result quite close to the approximation shown in [
9]. The linear approximation and the experimental results for a distance between electrodes of 30 mm are included in the
Figure 18. Similarly, it is possible to obtain a magnitude for the ion mobility, based on the expression (4) and fitting with the results shown in
Figure 12 for d = 30 mm. As it has been pointed out in [
8], the drag force can be estimated as 10% of the total thrust, resulting under these conditions a magnitude of
3.22
. This result is within the usual range of ion mobility according to literature [
8,
9].
All the obtained results might point to the fact that an increase in the length of the electrodes will imply a higher performance in terms of power consumed with respect to thrust generated (g/W). The distances between electrodes that produce the maximum thrust range between 25 and 40 mm. In the dual thruster experimental study, a table will be presented in which the optimum distance to obtain the maximum energy efficiency can be reviewed.
3.4. Experimental Results of the Dual Thruster
In this section the experimental results of the study of the dual thruster are presented. On this occasion, the whole family of previous graphs will not be repeated since they do not present significant changes. Only the most relevant one and a table with all the results obtained in numerical form will be included.
Figure 18 shows some slight differences with
Figure 12 and
Figure 15. It can be observed that when the second asymmetric capacitor is installed, the thrust curves for different distances are much more convergent than in previous cases. The maximum thrust is now of 6.4 g, twice that obtained with the previous configuration and, although between 40 mm and 60 mm distance the thrust variation is very small, the range of distances seems to have been extended. Although this statement is speculative, it seems plausible that this behavior is the result of the higher linearity of the electric field pointed out in
Section 3.2.
On the other hand, it is important to note that, although the maximum thrust may appear in
Figure 19 at 60 mm, this does not imply that the maximum energy efficiency in g/W occurs at that point.
Table 2 gathers the full set of values. The same convergence of
Figure 19 can be found, but the point of maximum performance, as already predicted by the initial tests, is at 40 mm.
To present the results in a more intuitive yet accurate fashion,
Figure 20 has been included. In this surface plot, the efficiency in g/W has been plotted as a function of the applied potential difference and all emitter-collector distances used in the experimental tests.
4. Discussion
In
Section 3.2 and
Section 3.3, experimental results have been presented that demonstrate how a dual configuration of two asymmetric capacitors in parallel produces higher thrust values while optimizes energy efficiency. Although the absolute values of thrust are low, in the order of 6 g, and the possibility of scaling them is, at least, complex, its energy efficiency, measured in g/W, will be compared with the maximum provided by a conventional electric propulsion system, and the potential use of electrohydrodynamic propulsion in manned or unmanned aircrafts will be evaluated. In fact, this comparison is aimed to verify how, despite the above limitations, in terms of power consumed per g of thrust generated, EHD thrusters outperform electric propulsion.
Manned aircrafts with electric propulsion use axial flux synchronous motors that directly drive the propeller shaft, either individually mounted or several in a tandem configuration. This type of machine provides high torque with a mechanical efficiency of the motor around 90%. Despite these good performances, its current consumption is very high, limiting the flight autonomy to values not exceeding 30 min, and its specific power (ratio mechanical power of the propulsor group to weight) is not as high as in other types of motor.
BLDC motors are the electric machines with the highest specific power [
18], reaching values of 350 g/kW, therefore, the comparison will be made with this type of motor, which will be the one with the highest thrust to power ratio as well.
To verify the higher performance of the EHD thrusters, two sources will be used; on the one hand, the values supplied by the most known manufacturer of this type of motor, and on the other hand, measurements collected in laboratory with instrumentation specifically designed for this purpose.
Table 3 shows the specifications of the BLDC motor with the highest performance in the current Unmanned Aerial Systems (UAS) market. It is a product manufactured by T-Motors™ in which high-quality materials have been used to achieve the lowest levels of losses: extremely thin and permeable laminations, high flux density NdFeBo permanent magnets, and silver plated conductors.
Although the quality of the motor and its performance are excellent, it has already demonstrated in [
19] that the data supplied by the manufacturer are inaccurate or overly optimistic, even although the propeller that produces the maximum efficiency was used in their measurements. Therefore, it must be considered that the column of values showing the overall performance in g/W provides higher values than the real ones.
By reviewing the table, it can also be appreciated that the maximum efficiency is produced at very low rotational speeds, where only a 11% of the maximum power that the motor can provide is being used, and drops to very low values, in the order of 10 g/W, as soon as the 50% of the available power is reached. If these values are compared with those presented for the electrohydrodynamic propulsion in previous sections (30 g/W), the overall efficiency is three times higher. If the results are obtained from experimental measurements on a standard UAS motor, the resulting performance for electric propulsion is even lower.
Table 3.
Technical specifications of the motor U88II-KV 85™, manufactured by T-Motors™.
Table 3.
Technical specifications of the motor U88II-KV 85™, manufactured by T-Motors™.
THROTTLE
(%) | THRUST
(g) | TORQUE
(Nm) | CURRENT
(A) | SPEED
(RPM) | POWER
(W) | EFFICIENCY
(g/W) |
|---|
| 40 | 1465 | 0.45 | 1.8 | 1584 | 86 | 16.96 |
| 42 | 1572 | 0.48 | 2 | 1631 | 96 | 16.38 |
| 44 | 1717 | 0.53 | 2.3 | 1692 | 110 | 15.55 |
| 46 | 1852 | 0.58 | 2.6 | 1748 | 126 | 14.84 |
| 48 | 1997 | 0.6 | 2.9 | 1810 | 139 | 14.35 |
| 50 | 2140 | 0.66 | 3.2 | 1872 | 154 | 13.93 |
| 52 | 2256 | 0.68 | 3.4 | 1928 | 163 | 13.82 |
| 54 | 2378 | 0.71 | 3.7 | 1988 | 178 | 13.39 |
| 56 | 2582 | 0.77 | 4.1 | 2047 | 197 | 12.85 |
| 58 | 2757 | 0.84 | 4.6 | 2142 | 221 | 12.49 |
| 60 | 2957 | 0.9 | 4.1 | 2190 | 245 | 12.08 |
| 62 | 3027 | 0.91 | 5.3 | 2232 | 254 | 11.9 |
| 64 | 3171 | 0.95 | 5.7 | 2287 | 274 | 11.59 |
| 66 | 3307 | 1 | 6.2 | 2349 | 298 | 11.11 |
| 68 | 3448 | 1.04 | 6.6 | 2384 | 317 | 10.88 |
| 70 | 3662 | 1.08 | 7.1 | 2439 | 341 | 10.75 |
| 75 | 4043 | 1.17 | 8.2 | 2570 | 394 | 10.27 |
| 80 | 4468 | 1.28 | 9.5 | 2680 | 456 | 9.8 |
| 90 | 5248 | 1.47 | 12.2 | 2917 | 586 | 8.96 |
| 100 | 6352 | 1.8 | 16.5 | 3200 | 792 | 8.02 |
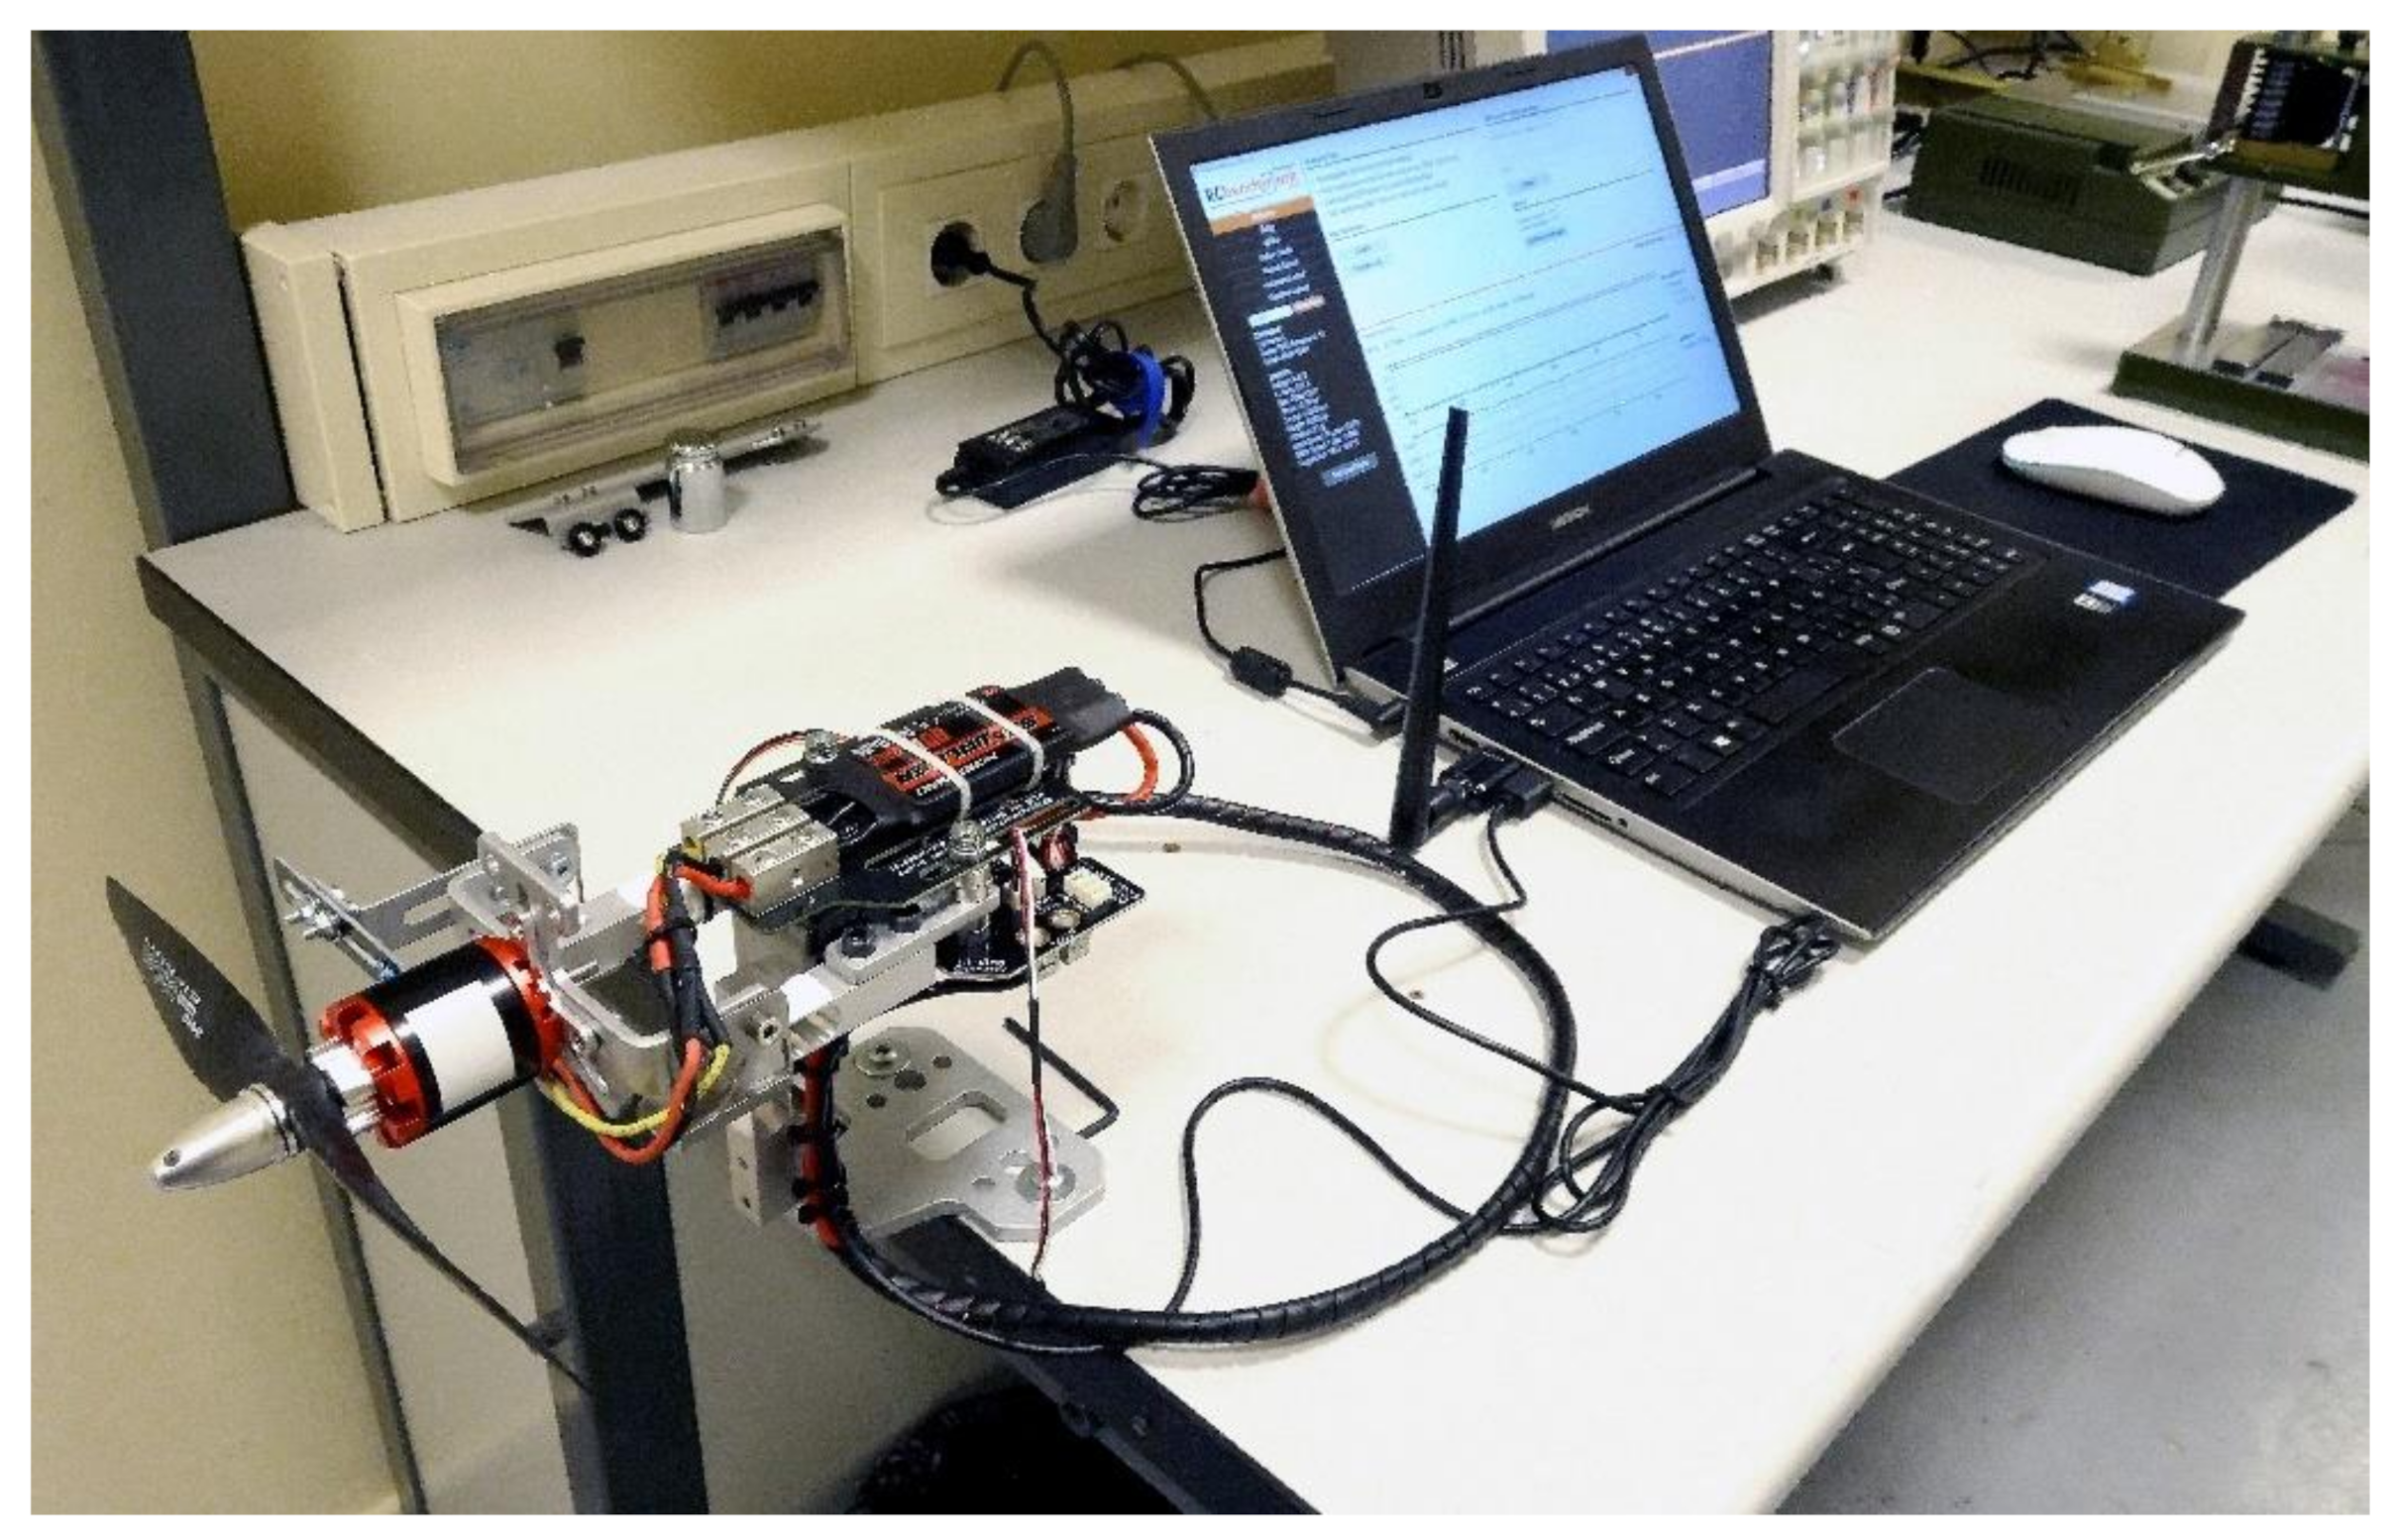
Figure 21 shows a test bench for the study of BLDC motors. This instrument includes two probes for measuring speed, three temperature probes, and load cells to measure the thrust produced by the propeller-motor assembly and the mechanical torque developed by the motor. It is a Tytorobotics™ Test Stand 1585. The software available for the instrument allows 18 variables of the motor to be recorded and exported to a data file. As the mechanical torque can be measured, the efficiency of the motor is calculated as the quotient between the mechanical power delivered to the shaft and the electrical power consumed. The overall efficiency in g/W which introduces the efficiency of the propeller to convert mechanical torque into thrust is calculated as the quotient between the measured thrust and the power consumed by the motor.
The motor installed in the test stand is a 450 W, 14 poles BLDC motor with a speed constant of 1000 RPM/V. The propeller is an Aeronaut™ 12 × 5 inches high-efficiency propeller and the motor is driven by an 80 A Electronic Speed Controller (ESC).
All the tests were carried out powering the system with a 5600 mAh—40C, 3S lithium polymer battery (12.6 V fully charged, 11.1 V in rated conditions). Since the test stand incorporates three accelerometers, propeller was balanced, and all the tests were carried out with a maximum RMS vibration of 0.5 g. As the overall efficiency is minimum when motor delivers its maximum power, current was limited during the tests to 25 A, this way, the motor was never driven above the 70% of its rated power. Even with all these constraints maximum motor efficiency was 79% and overall efficiency 4.3 g/W.
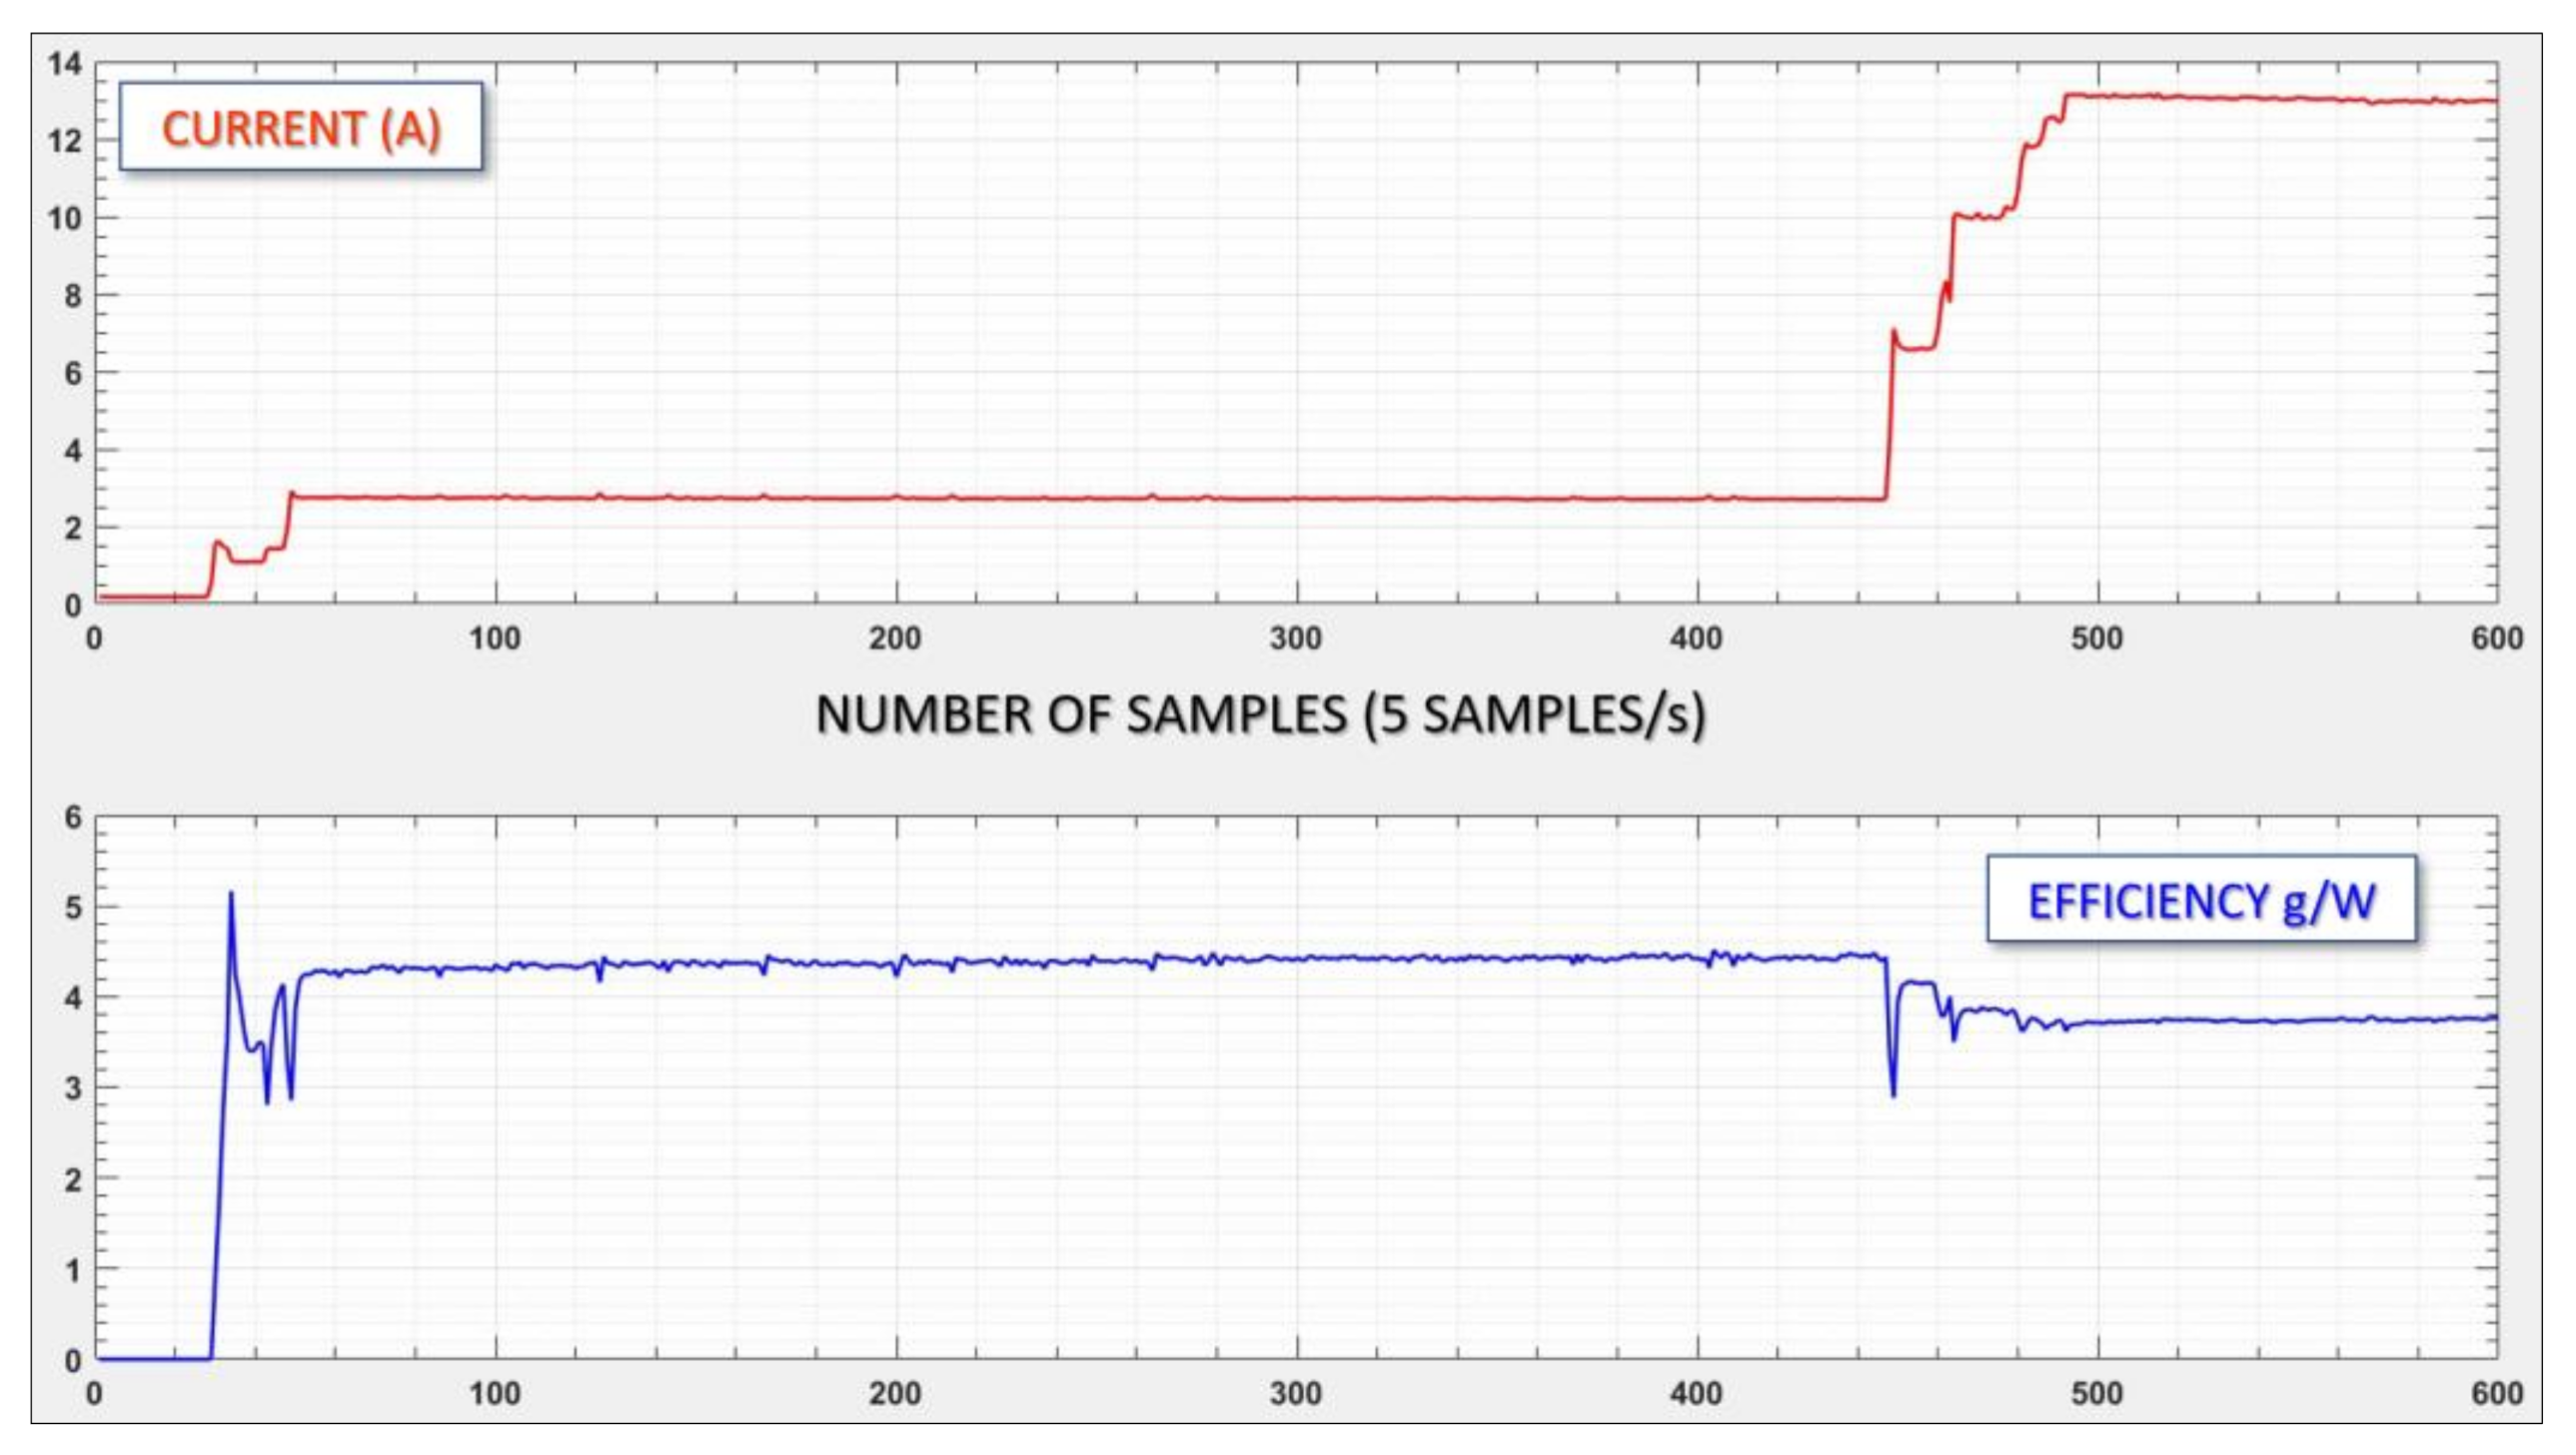
Figure 22 shows current consumption and overall efficiency. The first stage with current below 4 A produces the maximum g/W values, by only increasing the current to nearly 14 A efficiency falls to 3.8 g/W. Its minimum value of 3.7 appears at 25 A.
Figure 21.
Computer controlled test bench for the study of BLDC motors.
Figure 21.
Computer controlled test bench for the study of BLDC motors.
Figure 22.
Current and efficiency of a propulsion set (motor-propeller) for UAS.
Figure 22.
Current and efficiency of a propulsion set (motor-propeller) for UAS.
In view of the values obtained, despite its complexity and limitations, electrohydrodynamic propulsion is almost 10 times more efficient, in terms of energy consumption, than conventional electric propulsion, even when using motors with the highest specific power and performance.
Its application to atmospheric flight is still far from being an alternative, although in this study it has been analyzed, to the best of the authors’ knowledge, in a different way to that presented to date.
Some of the problems it poses are not particularly difficult to solve. Although this research has used laboratory equipment as a high voltage source, flyback converters, whose topology is extremely simple might be used instead. This DC-DC converter is lightweight for limited current and using synchronous rectification it is possible to obtain efficiencies of over 90%.
However, as indicated above, the absolute values of the thrust produced by the EHD thrusters are low. Attempting to scale them based on designs such as those used in this research is not feasible. The current consumption would be too high, and the power supply of the DC/DC converter would have to provide current values that are impossible to assume without reducing the energy efficiency to values well below those of conventional propulsion.
Since there have also been deep studies on the improvement of the drag coefficient (CD) of subsonic airfoils [
16], extending the study to larger aircraft could perhaps reduce their fuel consumption. In this sense, civil aviation has devoted and continues to devote an enormous effort in aspects such as sophisticated designs for winglets to reduce the induced drag derived from the pressure gradient between the pressure side and convex side of the wing airfoil, thus reducing fuel consumption. An EHD thruster could be installed in both the leading edge or the wing tips to reduce drag even more, especially nowadays when fuel consumption, fuel prices and emissions are issues of great social and environmental impact. the study has also shown the variability of current consumption with length and distance, it is not known whether it is possible or not to redirect the thruster design to another architecture where this problem is minimized. The possibility of injecting gases that increase the dielectric strength of the air is also an unexplored possibility. It can therefore be concluded that even if further complex and in-depth research is needed, electrohydrodynamic propulsion might serve if not as an alternative to conventional propulsion, then as a complement to it.


 ,
, 


