Extraction of Hidden Information under Sootiness on Murals Based on Hyperspectral Image Enhancement


1
School of Geomatics and Urban Spatial Informatics, Beijing University of Civil Engineering and Architecture, No.15 Yongyuan Road, Daxing District, Beijing 102616, China
2
Beijing Key Laboratory for Architectural Heritage Fine Reconstruction & Health Monitoring, No.15 Yongyuan Road, Daxing District, Beijing 102616, China
3
College of Geoscience and Surveying Engineering, China University of Mining and Technology, No.11, Xueyuan Road, Haidian District, Beijing 100083, China
*
Author to whom correspondence should be addressed.
Appl. Sci. 2019, 9(17), 3591; https://doi.org/10.3390/app9173591
Submission received: 14 July 2019
/
Revised: 22 August 2019
/
Accepted: 23 August 2019
/
Published: 2 September 2019
(This article belongs to the Special Issue Applications of Surface Science Methods in the Field of Cultural Heritage)
Abstract
:Changes in the environment and human activities can cause serious deterioration of murals. Hyperspectral imaging technology can observe murals in the range of visible to near infrared light, providing a scientific and non-destructive way for mural digital preservation. An effective method to extract hidden information from the sootiness of murals in order to enhance the visual value of patterns in ancient murals using hyperspectral imaging is proposed in this paper. Firstly, Minimum Noise Fraction transform was applied to reduce sootiness features in the background of the mural. Secondly, analysis of spectral characteristics and image subtraction were used to achieve feature enhancement of the murals. Finally, density slicing was performed to extract the patterns under the sootiness. The results showed that the extraction of hidden information was achieved with an overall accuracy of 88.97%.
1. Introduction
The temple mural is one of the dominant types of Chinese murals, usually painted on the walls of Buddhist and Taoist temples. However, due to human activities and environmental changes, these murals have been damaged, sometimes beyond recognition [1]. A very common practice in China involves burning incense and praying in temples, making the murals vulnerable to sootiness. This paper proposes a series of methods aimed to address problems related to the discovery of hidden information in murals (mainly including hidden patterns [2], text [3,4], underdrawings [5,6,7], smeared information [8], and restoration marks [9]) and the understanding of the artistic methods used to create them, in order to provide evidence for the identification and restoration of murals.
Traditional methods, such as X-ray imaging technology and UV-induced Fluorescence Photography [10,11], which are often used to reveal hidden information, have major problems due to logistics, the necessity to acquire permission by public administrations, and protection for operators. Therefore, traditional information extraction methods either cause certain damage to the cultural relics or do not effectively extract the implicit information.
New technologies have been used for the digital protection of murals, including hyperspectral imaging, which is a remote-sensing technology developed in the 1980s. It has been widely applied in many fields, such as terrestrial military [12], mineral exploration [13], geology [14], precision agriculture [15], and food engineering [16]. Hyperspectral imaging has a number of advantages [17,18], including being considered a safe detection technique due to it being non-contact and non-destructive. It also has the advantages of high spectral resolution with multiple bands and narrow bandwidth, and the ability to provide spectral information for each pixel in an image, i.e., information for each pixel in the paintings of a continuous spectral response curve, which provides the basis for performing implicit analysis and processing information. Because of these unique features, hyperspectral imaging has been introduced into the study of cultural relics, and this has become the focus of related research [19,20,21].
Hyperspectral technology is widely used for visual enhancement and to reveal hidden details in ancient manuscripts and paintings [22]. In 2008, Padoan et al. [3] studied the watermark of plant leaves in the 17th century, the Atlas manuscript was visible by enhancing the spectral image to restore the image affected by the ink. In 2017, Wu et al. [9] identified the mineral pigment and extracted traces of historical paintings based on hyperspectral short-wave infrared imaging. These two studies proved that hyperspectral imaging technology is a feasible and viable approach in the study of cultural relics. In 2011, Kim et al. [23] used hyperspectral imaging to assist in visual enhancement of old documents. Goltz et al. [24] used principal component analysis to somewhat reduce the effects of iron and ink stains on old documents and enhance document readability. In 2017, Guo et al. [25] removed background information using the principal component analysis technique and were able to enhance the smearing information around the crowns of the Qing emperor and officials. However, no hidden information could be extracted by means of the proposed method. In 2003, Balas et al. [26] described in detail the imaging characteristics and advantages of hyperspectral imaging technology, restoring scripts that were erased and covered in old manuscripts. In 2007, Salerno et al. [4] applied principal component analysis and independent component analysis to enhance Archimedes’ manuscript information that was erased from ancient parchments, which provided an important basis for modern historians. However, the information above murals is much more rich and complicated than that of documents. Pan et al. [27] extracted faint leaf-like patterns in tomb murals based on the normalization and density slice of hyperspectral images. However, this method is ineffective when there is no obvious absorption feature. Overall, there are still some challenges that require new methods and/or practical solutions.
The main objective of this study is to propose an effective method to enhance the visual value of patterns of ancient mural using hyperspectral imaging and to extract hidden information from the sootiness. One of the internal wall paintings in the Guanyin Temple was analyzed by hyperspectral imaging in order to extract the information covered by sootiness. After processing using forward and inverse Minimum Noise Fraction (MNF) transform, the patterns under the sootiness were greatly enhanced by image subtraction; then, information was extracted by density slicing. Hence, the proposed case study represents the application of a data elaboration method able to extract hidden information from sootiness and enhance the visual value of patterns of ancient murals.
2. Methods
2.1. The Case Study
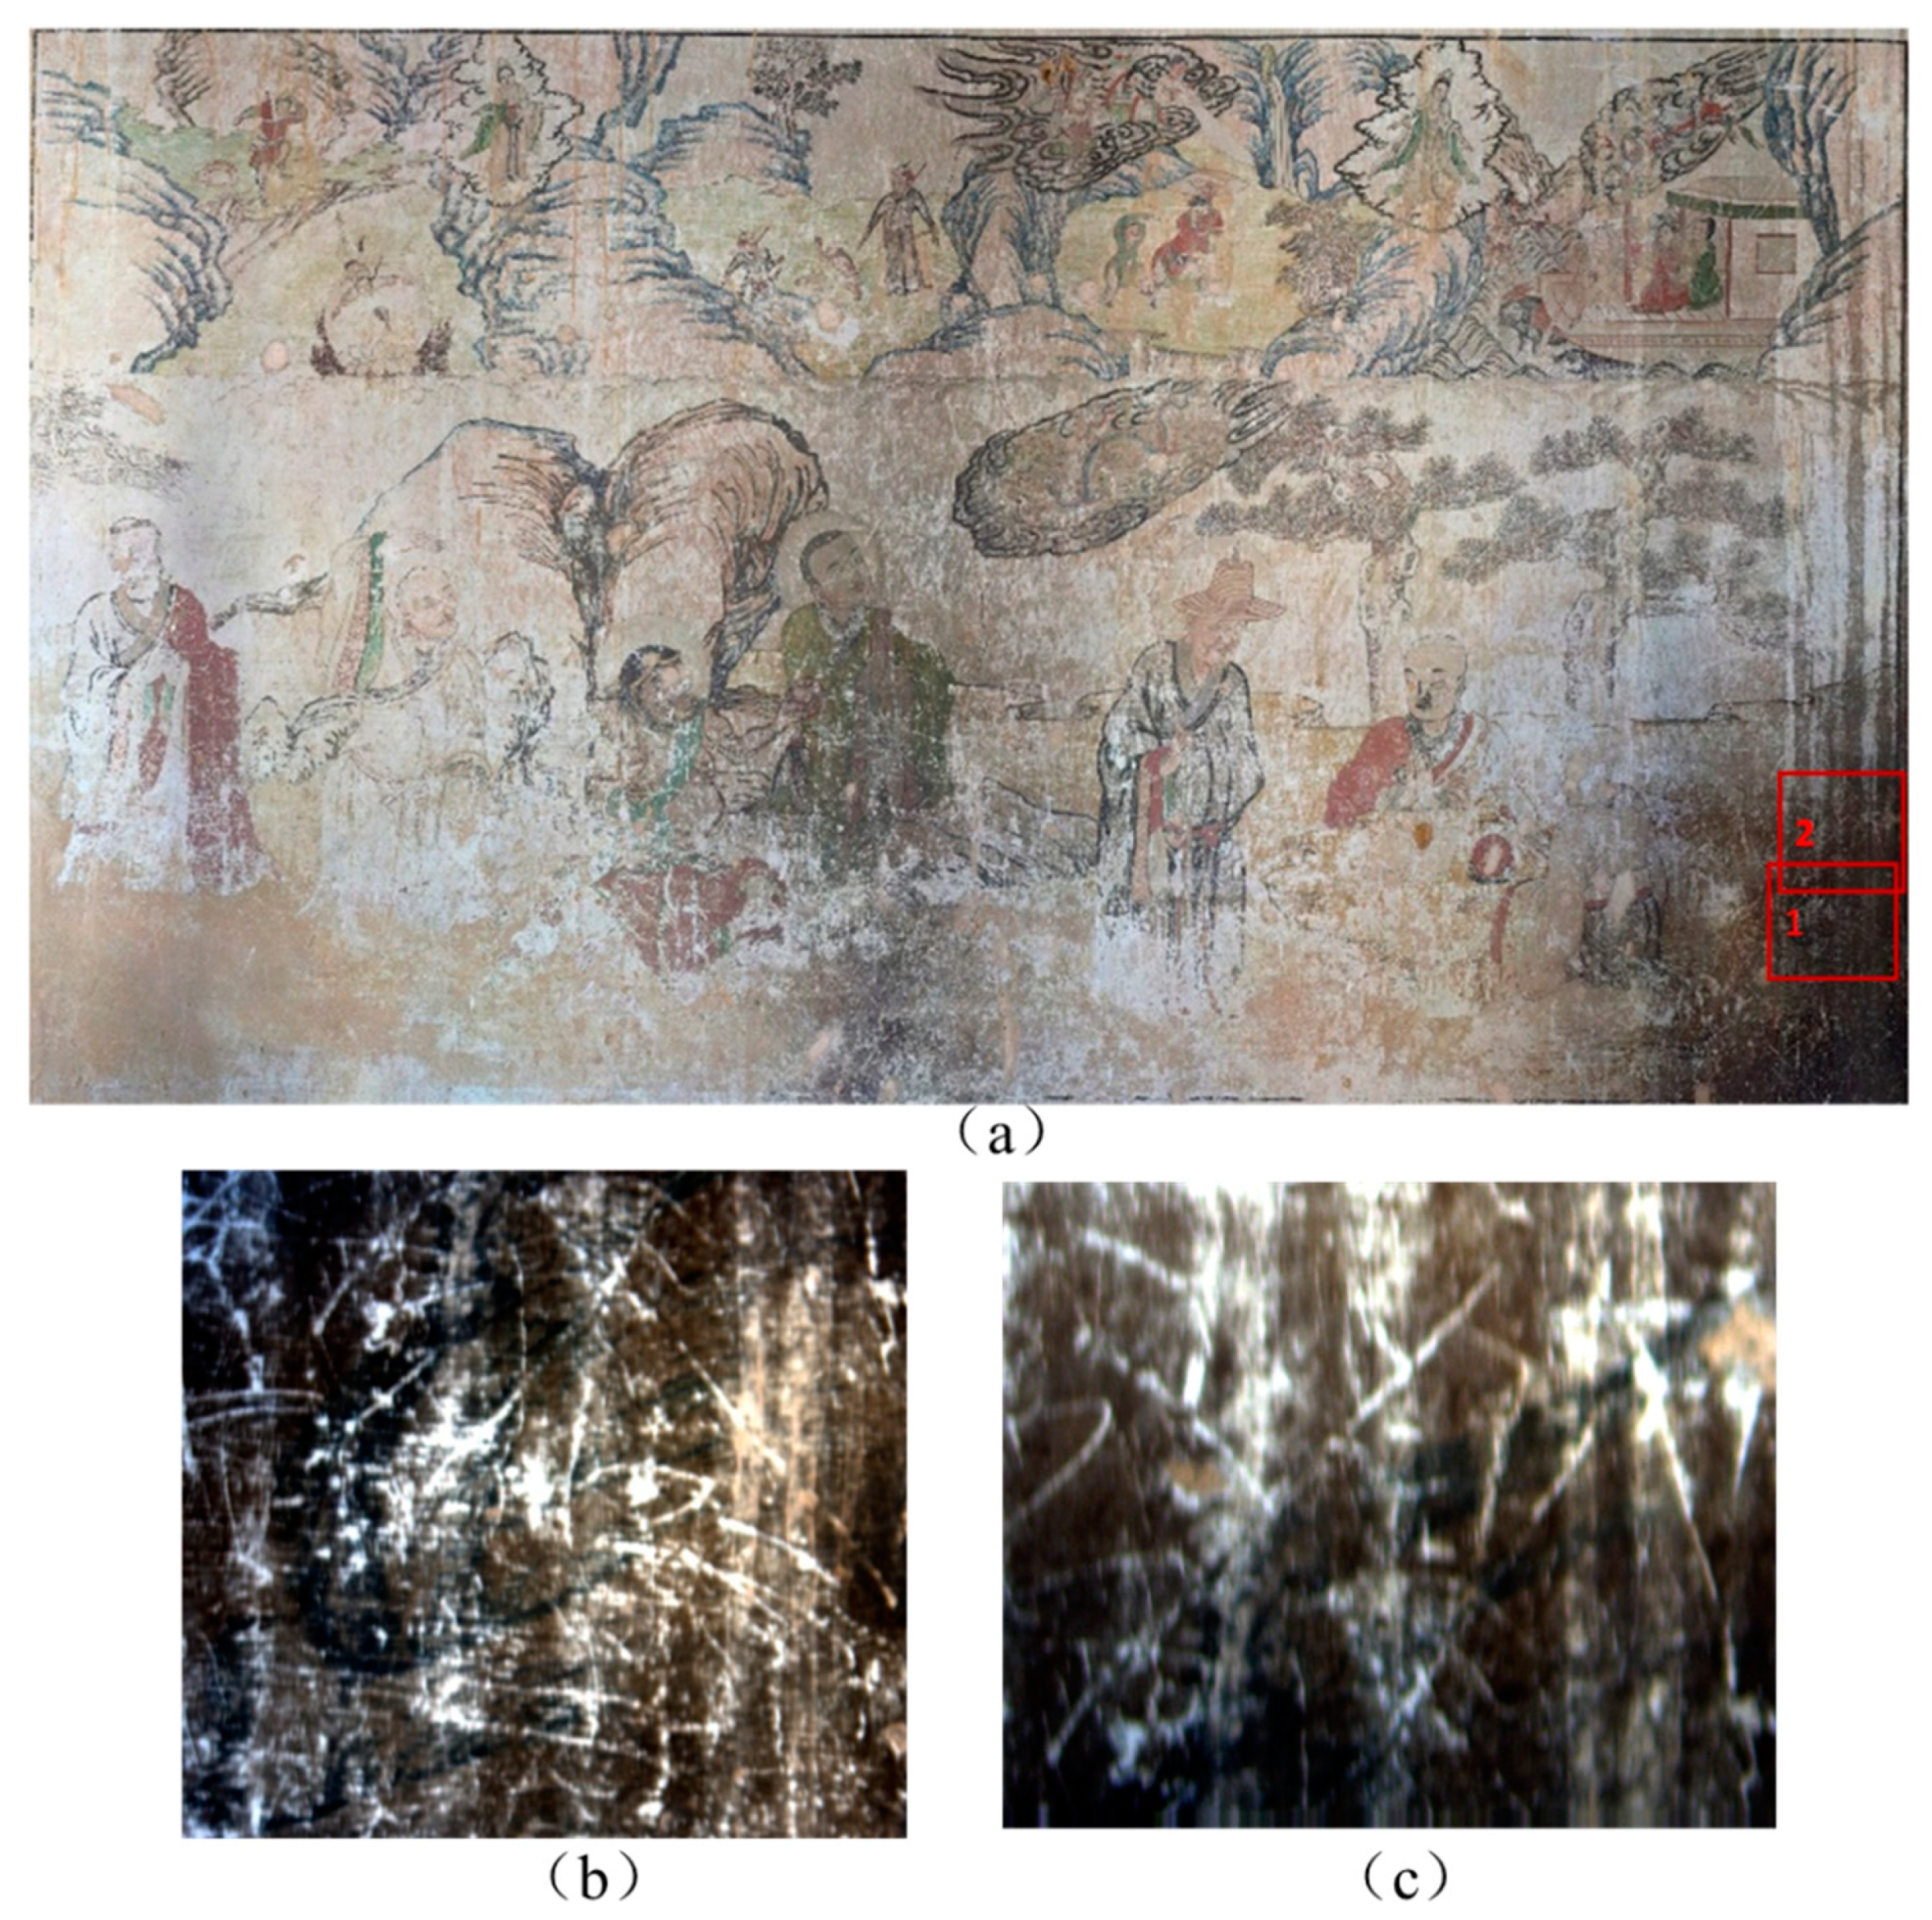
The mural selected in this study is on the western wall of the Guanyin Temple, located in Hei Long Temple Village in Yanqing District of Beijing, China. According to records in China, the temple was built in the Daoguang period of the Qing Dynasty, with a history of nearly two hundred years. The lower half of the mural consists of nine portraits of Arhats and the upper half is a variation of Guan Shiyin Bodhisattva. The characters are interesting and exquisite. As shown in Figure 1a, the mural’s preservation status is not very good, but still is discernible. It can be seen that the lower right corner is contaminated by sootiness, which results in the patterns of the mural being covered up and being unable to be recognized by the naked eye. In order to reveal the information covered by this sootiness, the hyperspectral data of the mural was captured and analyzed.
2.2. Analytical Method
In this study, the data of the experiment areas were captured by the Themis Vision Systems LLC VNIR400H portal scanning hyperspectral imaging camera, which integrated an automatic scanner, a spectrometer, and an and image sensor into one unit and was corrected by an accurate spectrum. The spatial resolution of the image obtained by the VNIR400H camera was 1392 × 1000 pixels. The spectral range of the camera was 400–1000 nm. The spectral resolution was 2.8 nm and the sampling interval was 0.6 nm.
The data were recorded as a hypercube with two-dimensional spatial images and wavelength bands as the third dimension, and hundreds of spectral bands were extracted from each pixel to form a relatively continuous spectral curve. As such, the hyperspectral data provided abundant reliable spatial and spectral information for the murals. Since some electrical interference occurred when the hyperspectral camera was in operation, some noise bands were caused in the original images. Therefore, 100–850 bands (433–910 nm) of the 1040 bands in the range of 400–1000 nm were selected manually so as to reduce the noise band interference.
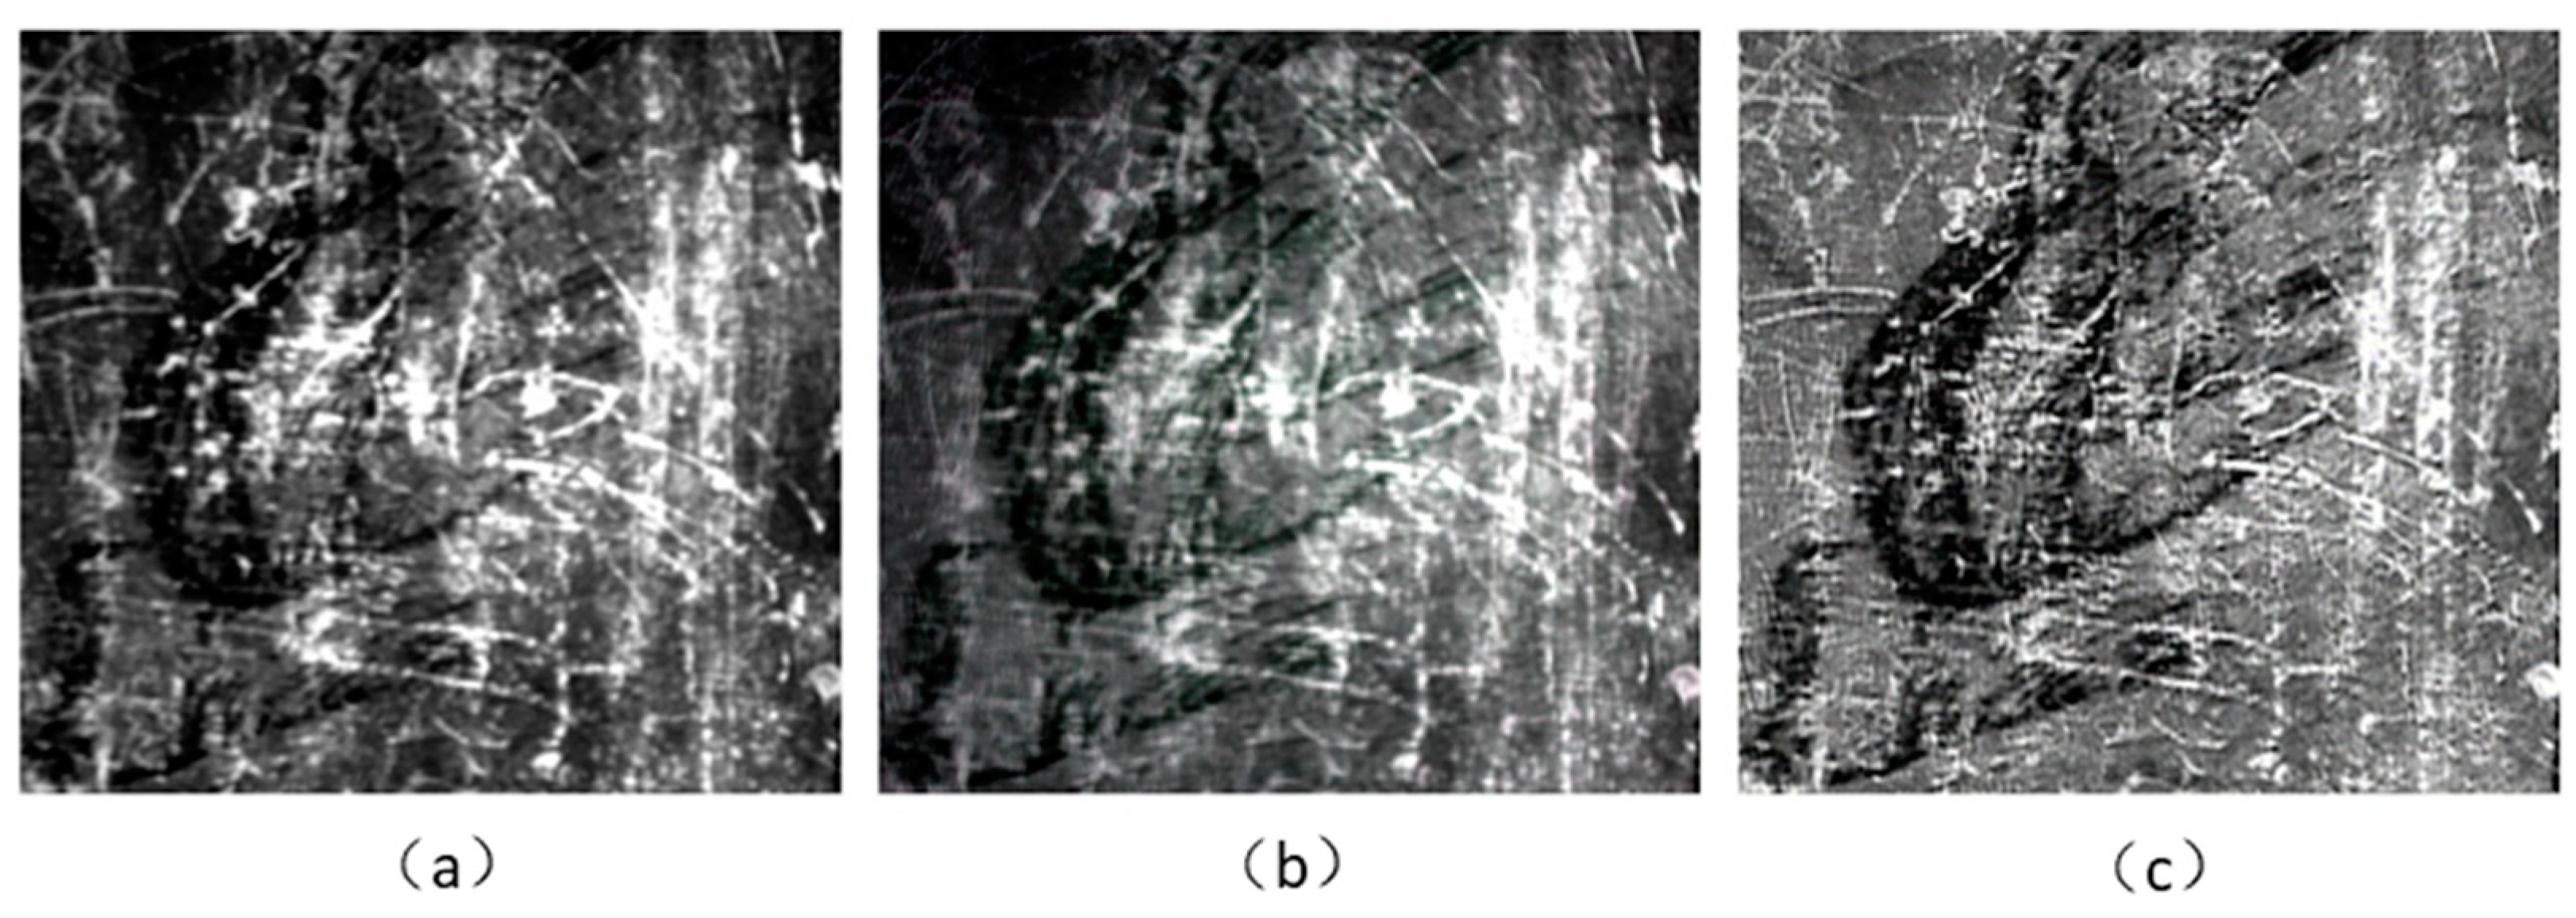
Figure 1a shows the complete picture of the mural, which is 5.10 m wide and 2.27 m high. The hyperspectral imaging camera used had certain limitations regarding the imaging range and resolution. When the instrument was about 0.8 m from the mural, areas measuring about 70 × 50 cm could be scanned. Therefore, the data of the entire mural were collected in fractions. Since the sootiness in the lower right corner of the entire mural was more serious, two experimental areas were selected here, with area 1 being 650 × 600 pixels and area 2 being 555 × 440 pixels; these are marked in red boxes in Figure 1a. The images of the two study areas, shown in Figure 1b,c, are color images (synthesized from original hyperspectral images) based on images at 460 nm, 549 nm, and 640 nm bands.
2.3. Overall Workflow
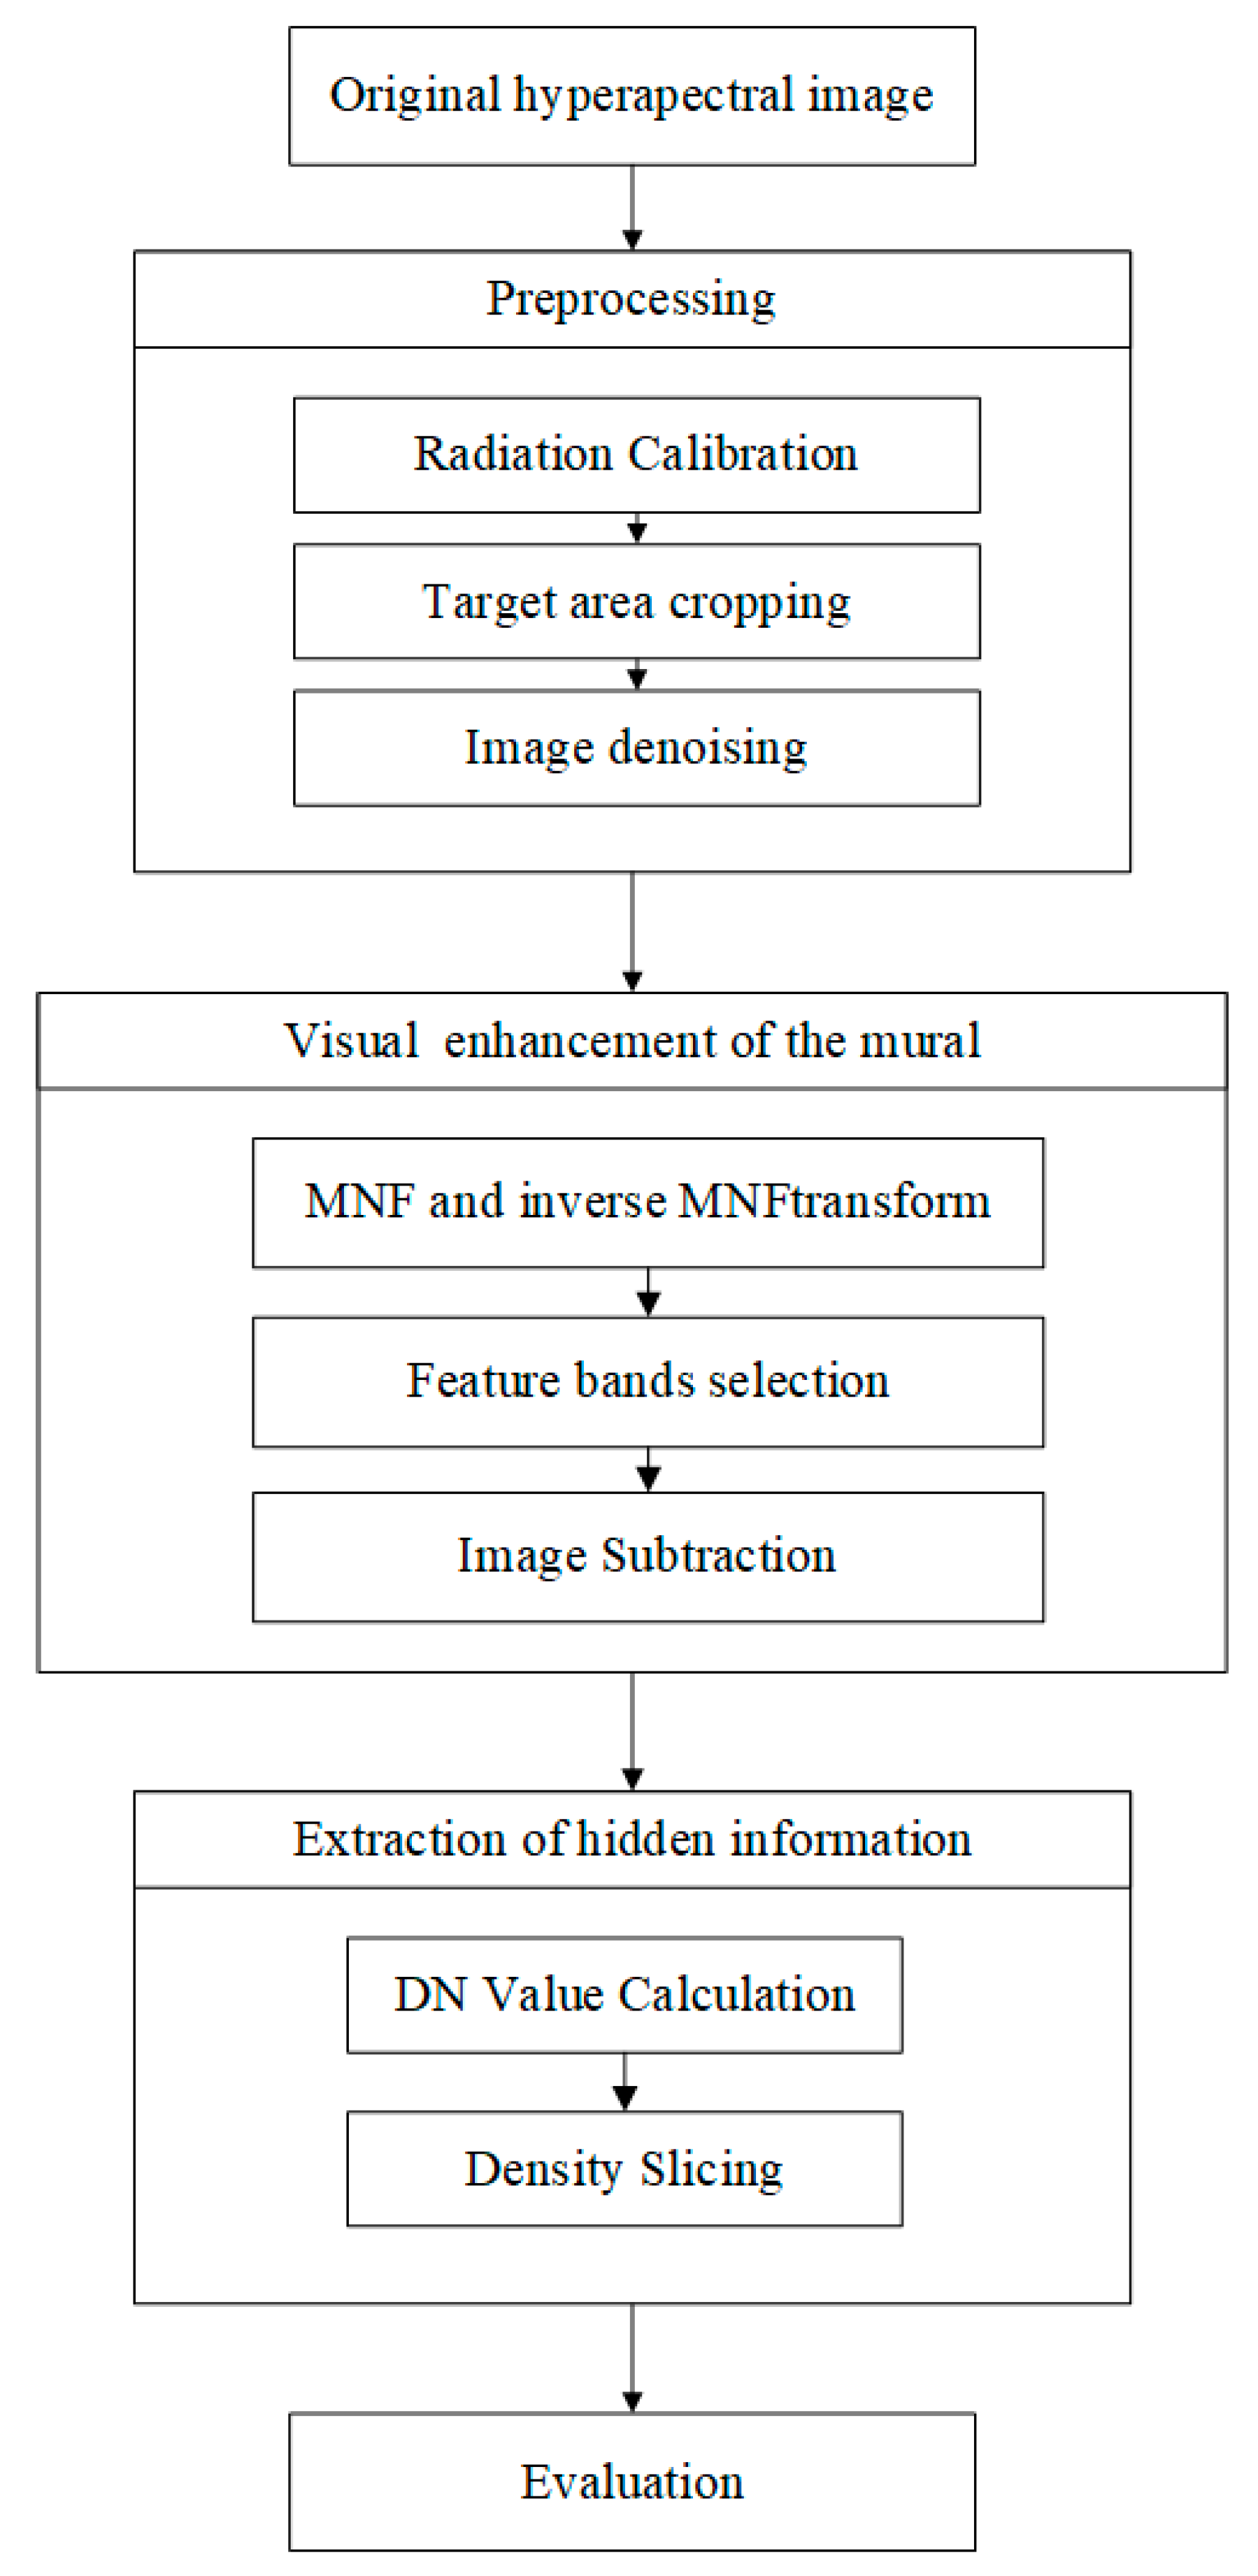
Figure 2 shows the overall workflow of the proposed method for the extraction of the hidden information of murals, including three main steps: (1) Data preprocessing, (2) visual enhancement using MNF, feature bands selection, and image subtraction, and (3) extraction using density slicing. The details of each step are discussed in the following sub sections.
The MNF in the above figure is used to determine the inner dimension of the image data, separate the noise in the data, and reduce the computational demand in the subsequent processing. The DN value in the above figure is the luminance value of the remote sensing image pixel and the gray value of the recorded feature.
2.4. Data Preprocessing
During the process of camera acquisition, the data were interfered with by uneven intensity distribution and dark current noise. Therefore, before the next analysis, the reflectance of the original hyperspectral data was radiation corrected using the following formula:
In Formula (1), is the corrected reflectance image, is the original image of the mural, is the reference image obtained from the whiteboard, and is the dark current image acquired with the light source off and the lens covered. The reflectance of the standard whiteboard is 99%.
If the whole hyperspectral image was processed directly, the effect and accuracy of extracting hidden information would have been interfered with. Therefore, in order to reduce other information interference, the image needed to be cropped.
2.5. Visual Enhancement
For the sootiness in the mural, direct feature extraction is usually unable to achieve good, precise results (see Section 4), therefore, visual enhancement is an essential step.
The visual enhancement was done via three steps (see Figure 1). First, MNF and inverse MNF transform were applied to enhance the features of the pattern and reduce the features of the scratches and sootiness in the mural’s background. This transformation performed two principal component analyses, respectively transforming the noise covariance matrix of the data and the noise-whitened data, and finally retaining the hyperspectral images with a large signal-to-noise ratio (SNR). In this process, the MNF transform was performed first, and then the hyperspectral image was represented by several bands. The bands containing pattern information were selected to perform inverse MNF transform. Then, the mean spectrum of the pattern and background was obtained, and the feature bands ranging between them were selected, i.e., the bands with the greatest difference. Next, image subtraction was applied to further enhance the pattern information. The formula used in this study was B1–B2, with B1 and B2 representing the maximum band and minimum band of the characteristic band range, respectively. This helped to enhance the pattern information, with a single band grayscale image obtained after this operation.
2.6. Extraction of Hidden Information
After the image subtraction, the digital number (DN) value range of the image was arbitrary. In order to make the target more consistent with human vision and facilitate the subsequent selection of the threshold and extraction, the DN value of each pixel in the subtracted hyperspectral image was transformed by the following formula:
In Formula (2), for the image obtained after subtraction, is the transformed DN value, is the maximum value of all of the DN values, and is the DN value of each pixel.
Finally, density slicing was performed on the grayscale image after DN value calculation to extract the patterns under the sootiness. This assumed that a certain kind of substance was expressed in a data range in a grayscale image, and this part of the pixel was separated from the image to form a class. The density slicing involved using thresholds for image segmentation so that all pixels with a grayscale value greater than or equal to a certain threshold were classified as target substances. The threshold was determined by examining the accuracy of extraction under different values. This achieved better extraction results when there was a strong contrast between the target and the background.
3. Results and Discussion
3.1. Visual Enhancement of the Mural
As shown in Figure 3 of the selected wall painting, the lower right corner of this mural is polluted by severe sootiness. Visually, the black sootiness and ink pigments of the mural are very close to each other in the original image. The low contrast between them as well as the bright white scratches makes it difficult to clearly distinguish the hidden information from the sootiness of the mural.
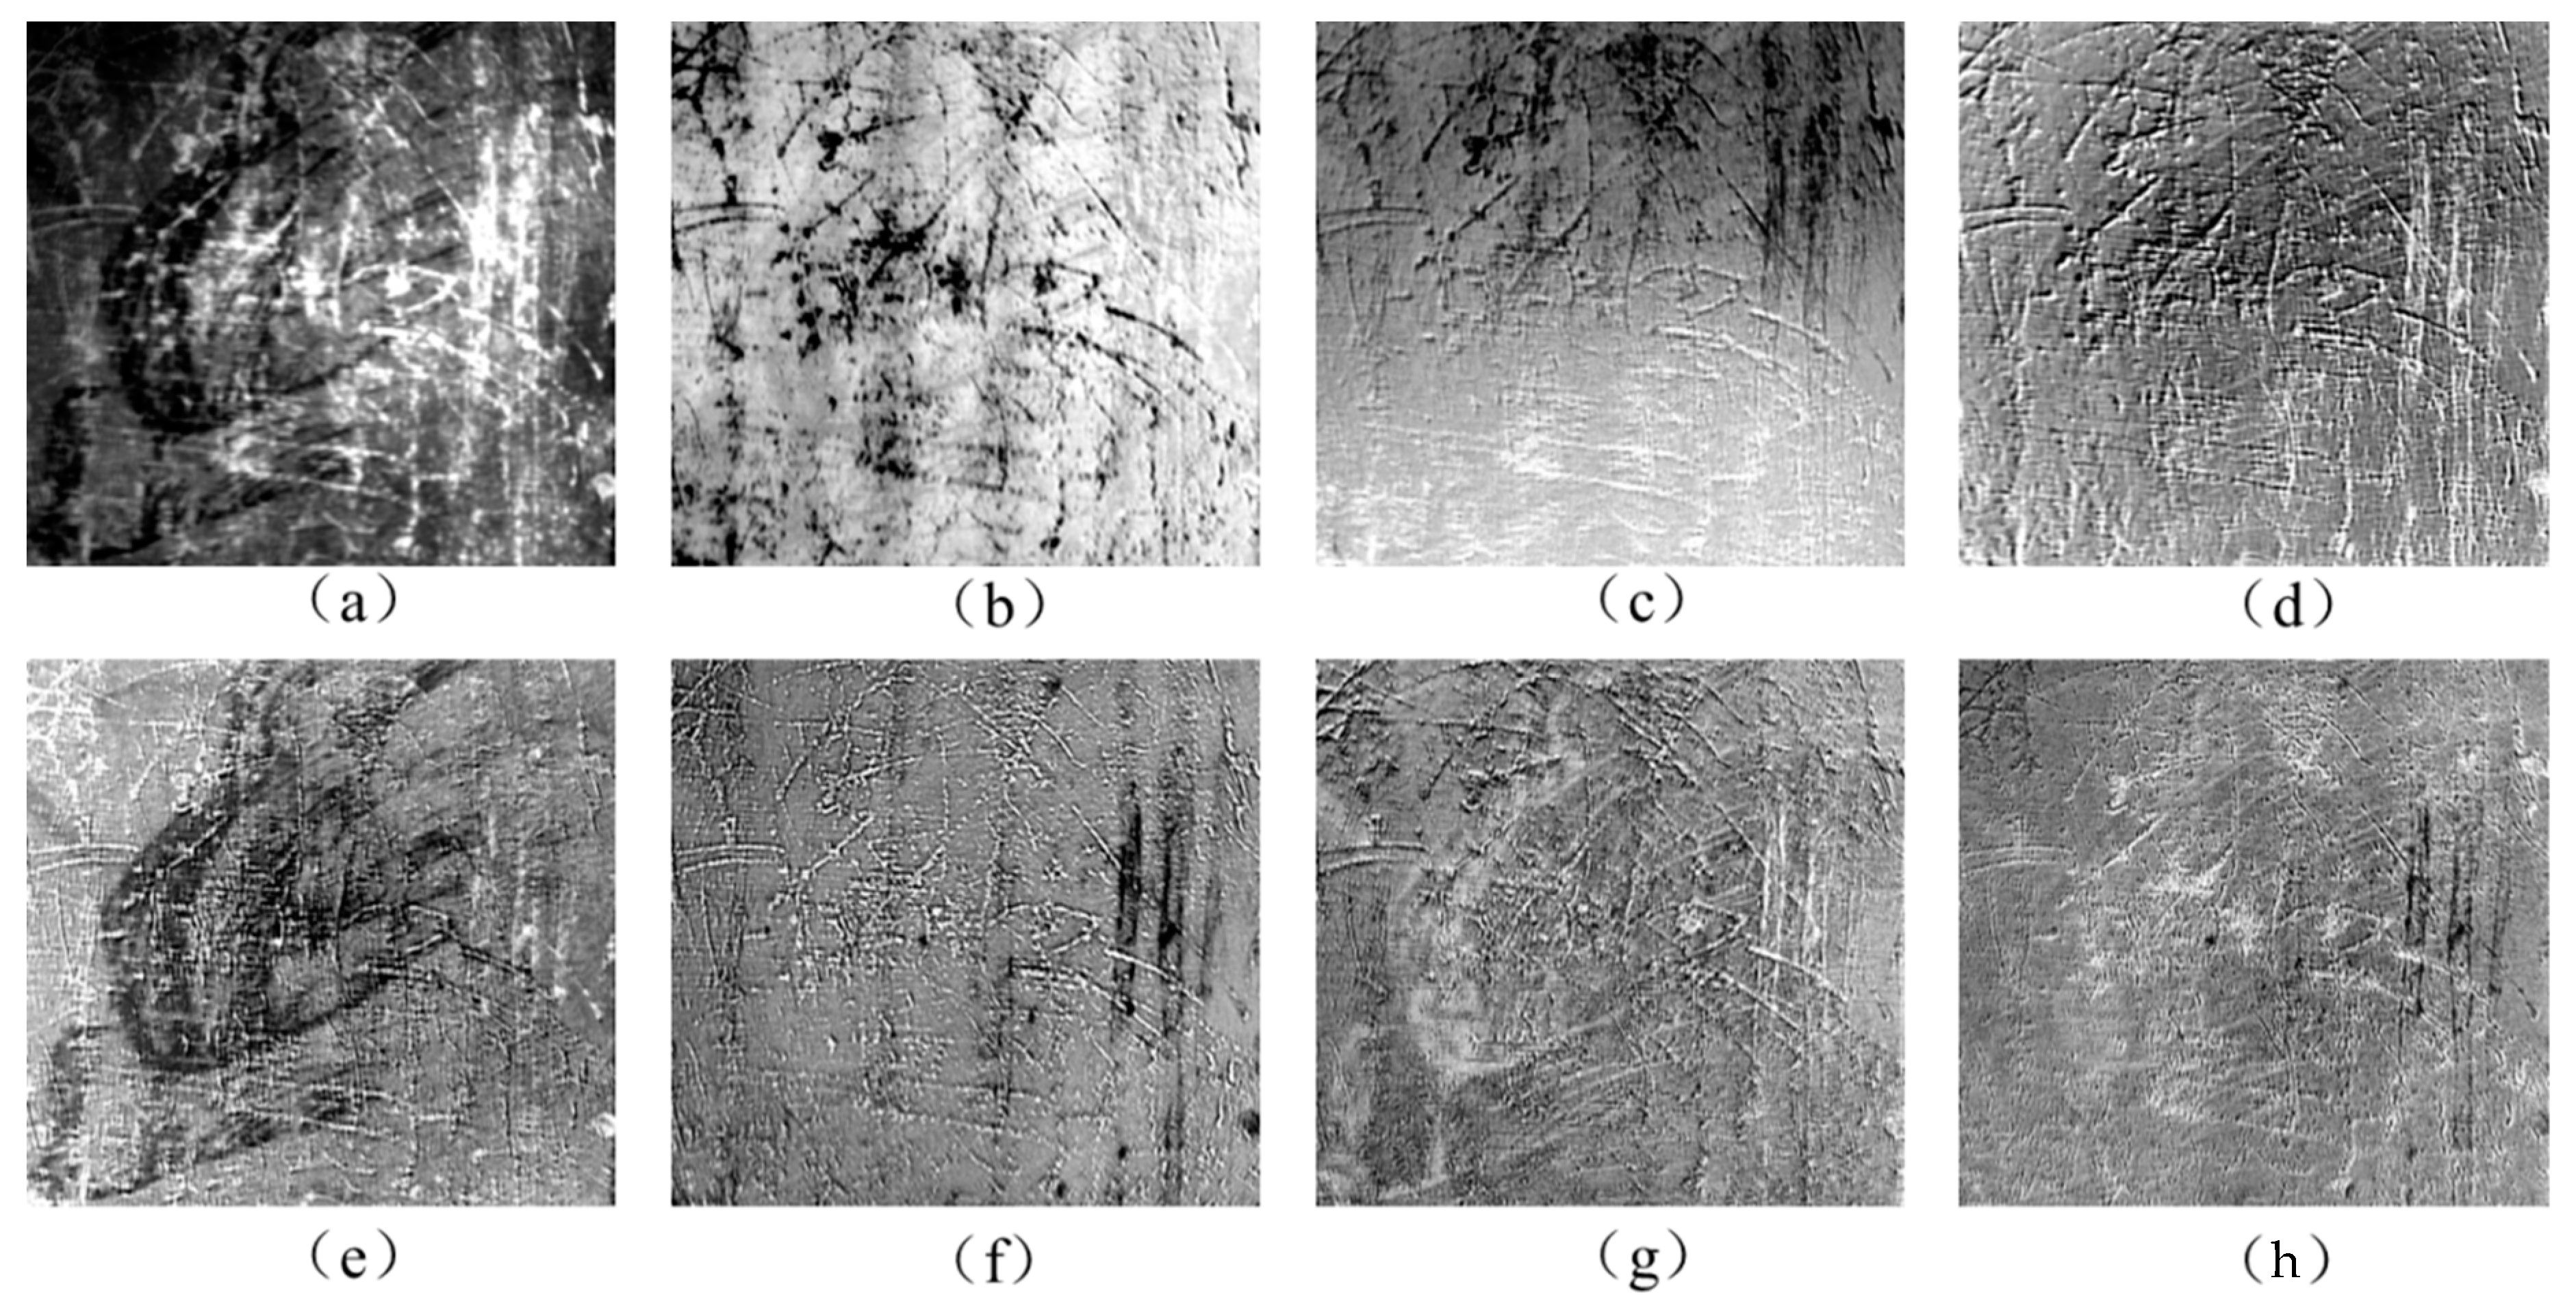
In the visual enhancement, the image first underwent forward MNF transform, followed by inverse MNF transformation on a few selected bands with distinct features of the mural information. Forward MNF transform concentrated the main features into several top components and arranges them according to their signal-to-noise ratio (SNR), therefore, some features of different information appeared in different components. Figure 3 shows the eight top component images from the results of the forward MNF. It can be seen that, among these components, the pattern information was mainly distributed in the first, fifth, and seventh components, while the other components mainly indicated sootiness and scratch information. Therefore, in this paper, MNF band 1, band 5, and band 7 were selected for area 1 (see Figure 3a,e,g) to perform inverse MNF transform, while the bands with scratches and noise were not considered.
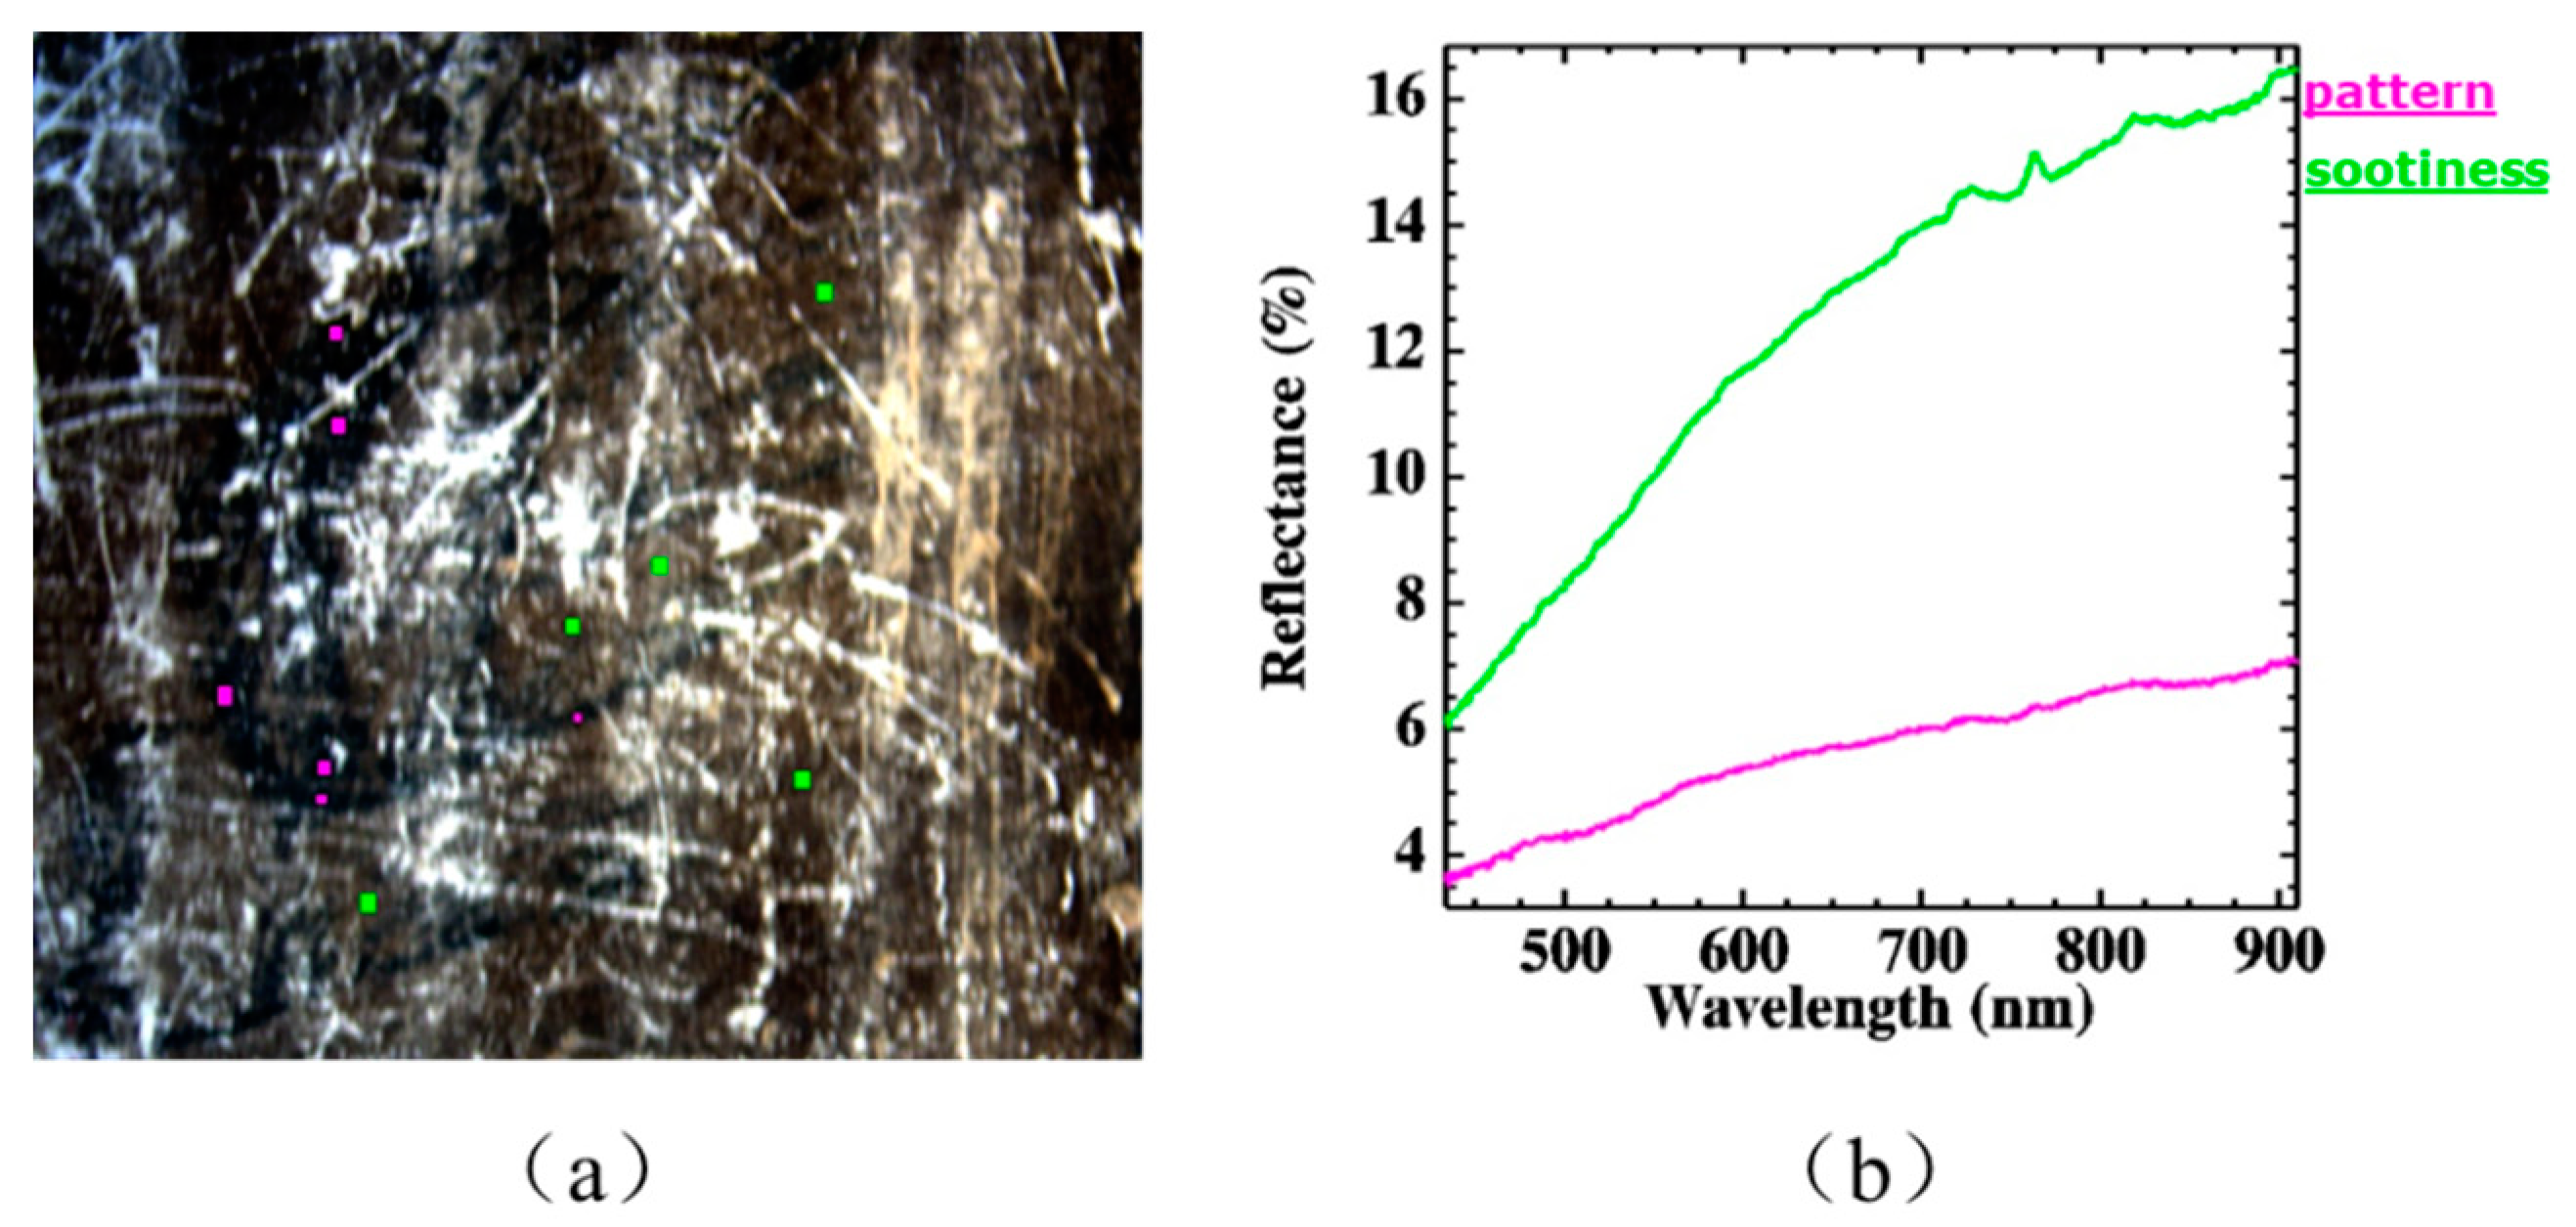
On the inverse MNF image, the region of interest (ROI) of the visible murals and sootiness was extracted, and the mean spectral curves were calculated accordingly. Figure 4b shows that the two spectral curves had the same trend, with the purple curve representing the blurring pattern and the green line representing the sootiness. However, there were significant differences in the reflectance and the slope of the curve in the 600–715 nm range. Therefore, a difference operation was performed on the MNF inverse transformed image B2−B1 (where B2 = 715 nm, B1 = 600 nm). The result of the image subtraction is shown in Figure 5b. After the image subtraction, the pattern in the sample data was significantly enhanced compared to the inverse MNF image (as shown in Figure 5a).
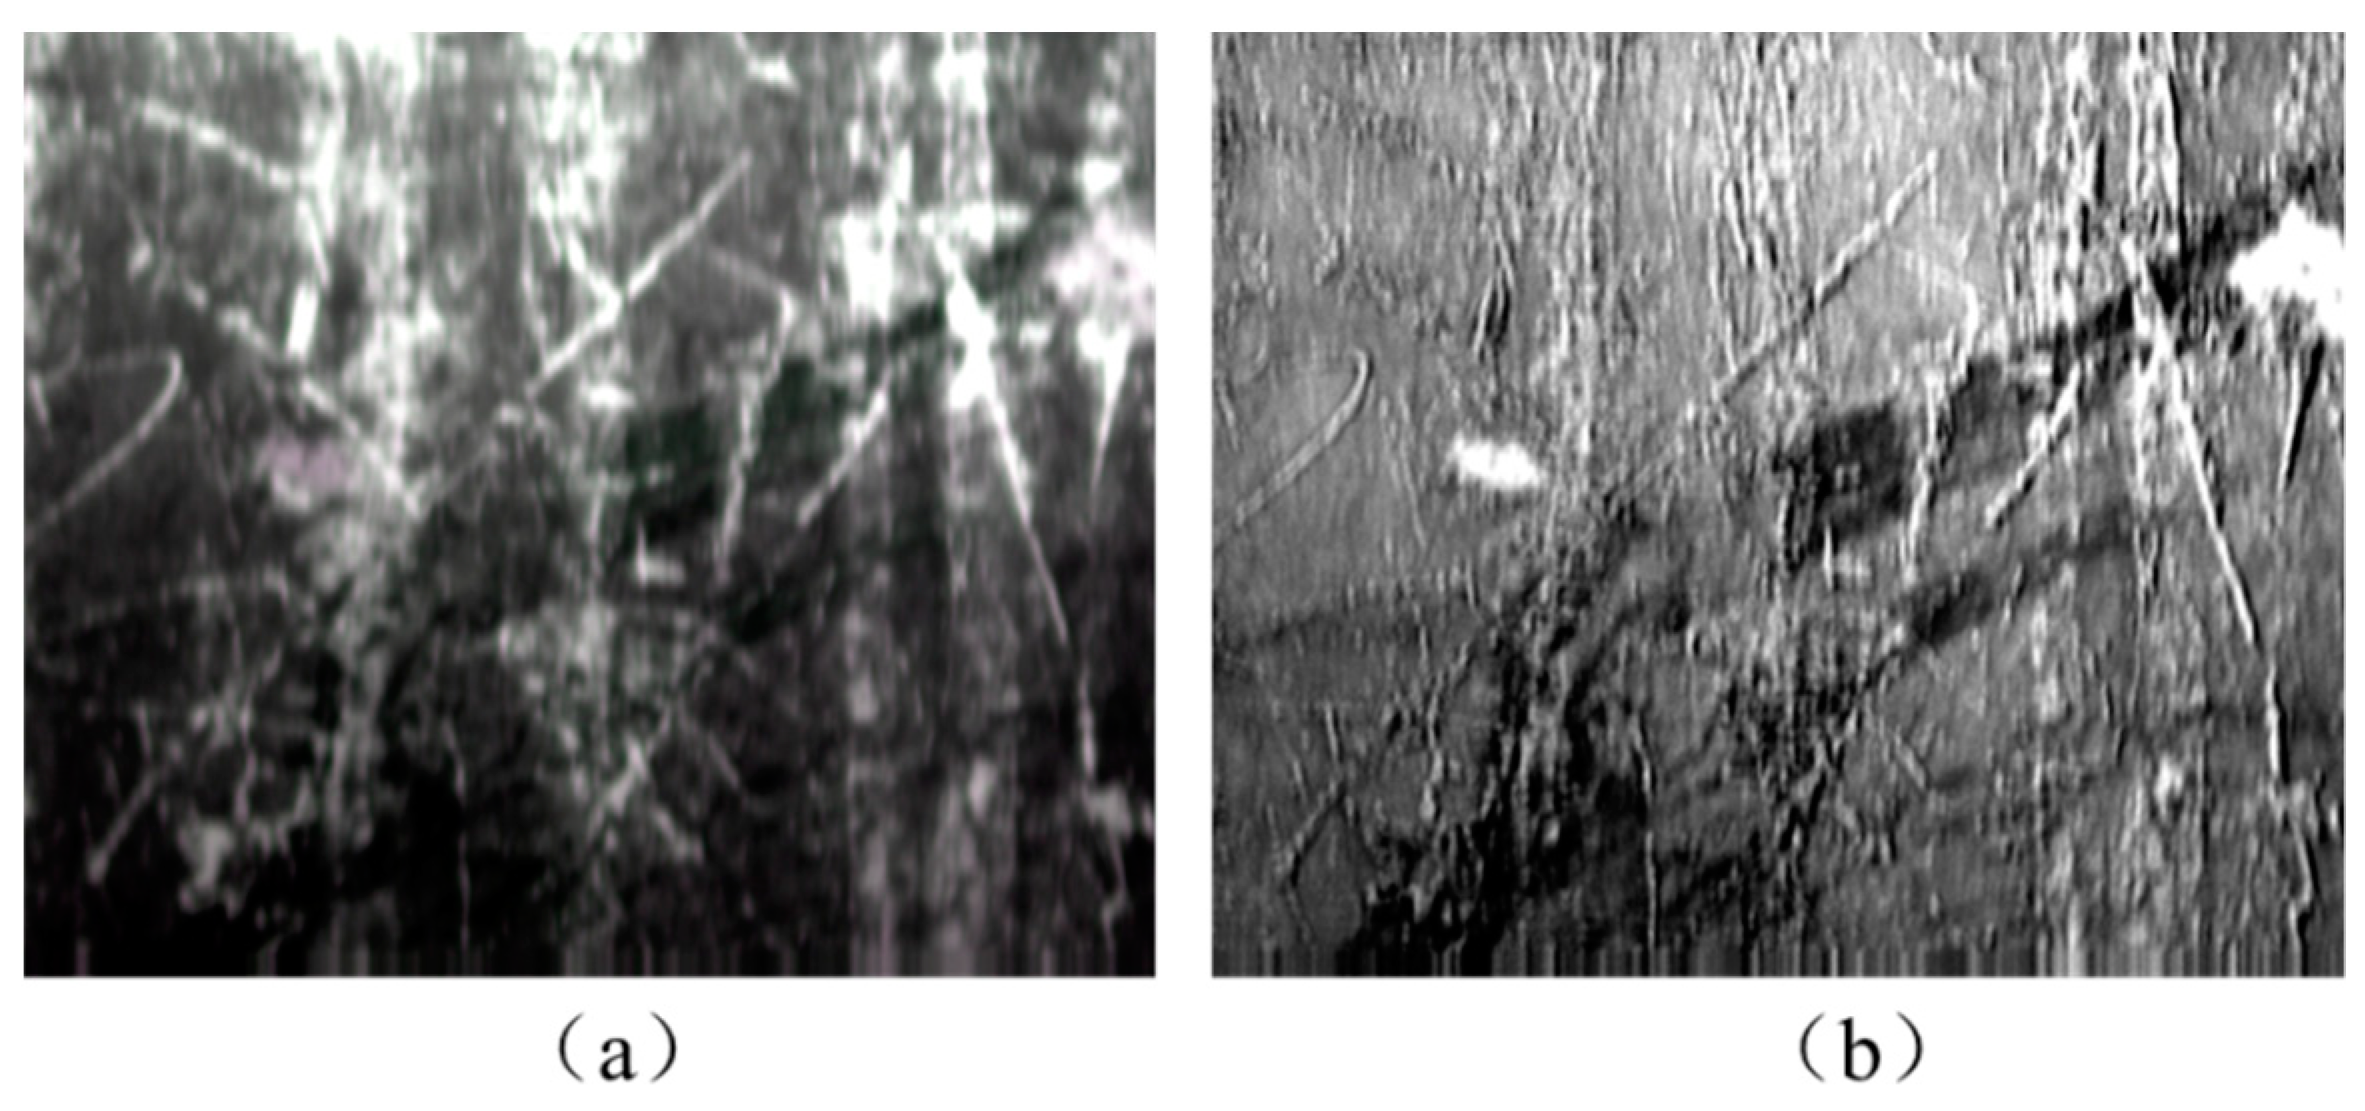
It should be noted that, except for the different band selections for inverse MNF transform, area 2 performed exactly the same operation as area 1; the enhancement results of area 2 are shown in Figure 6.
3.2. Extraction of Hidden Information under the Sootiness
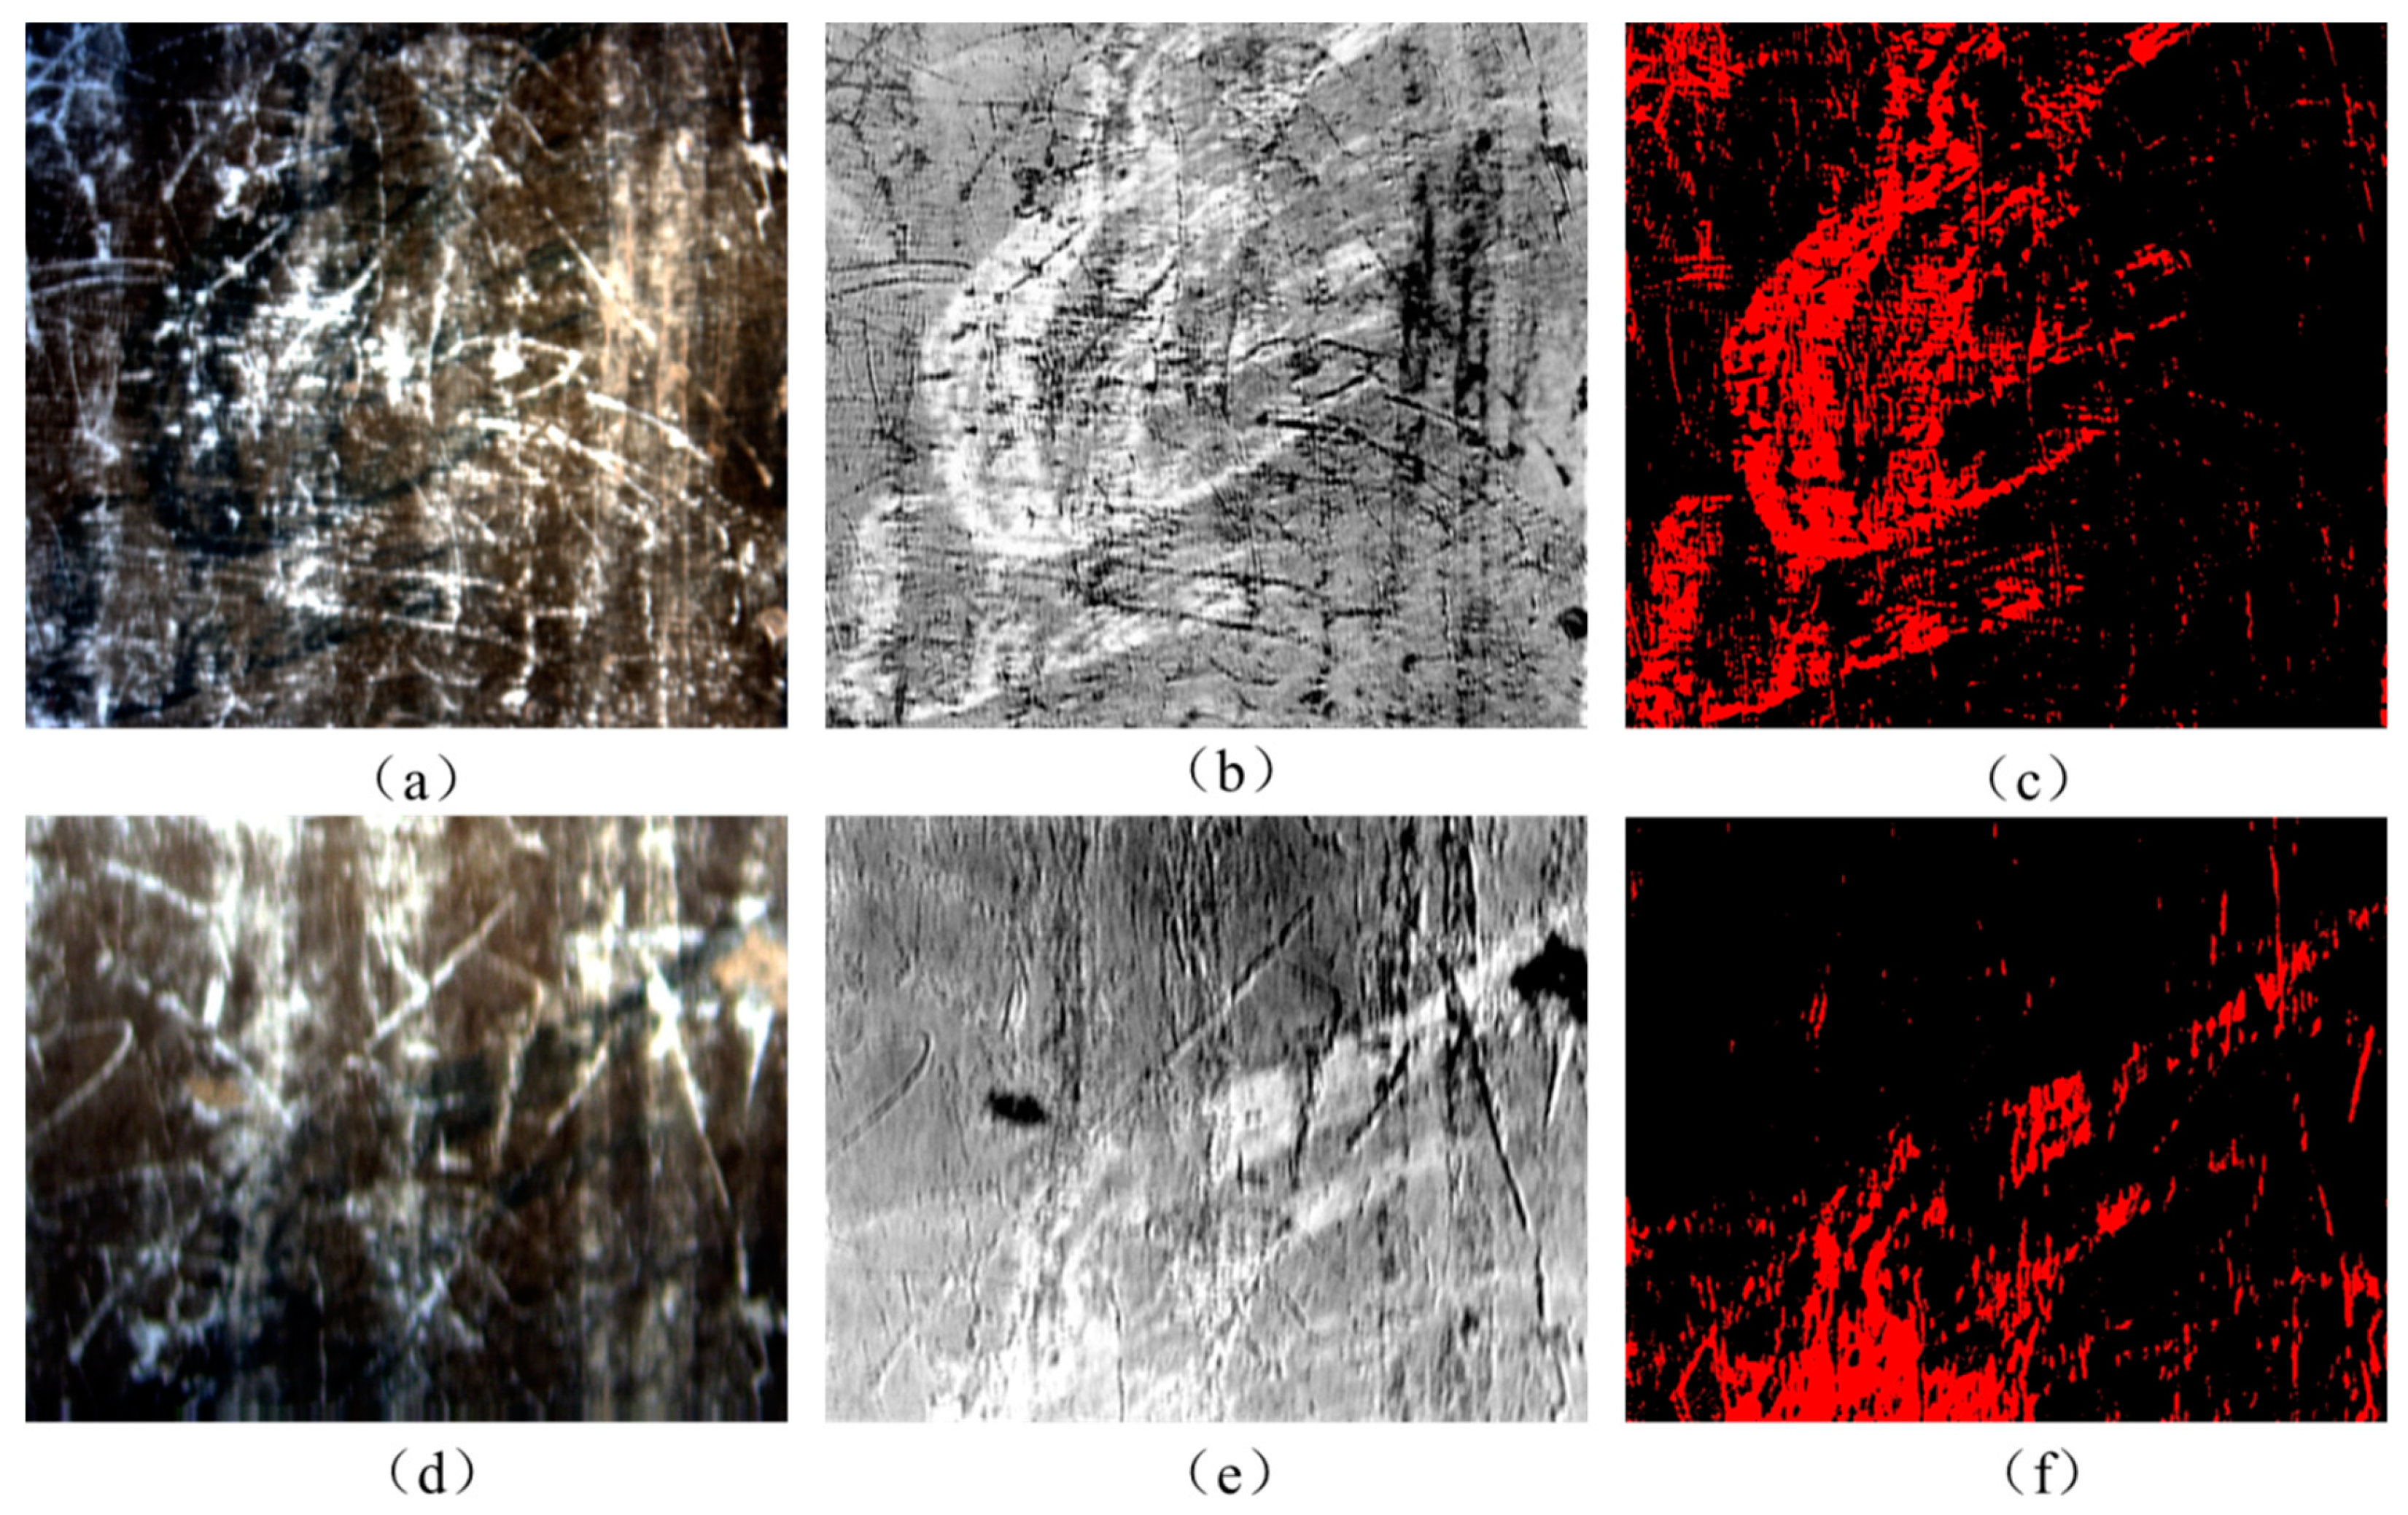
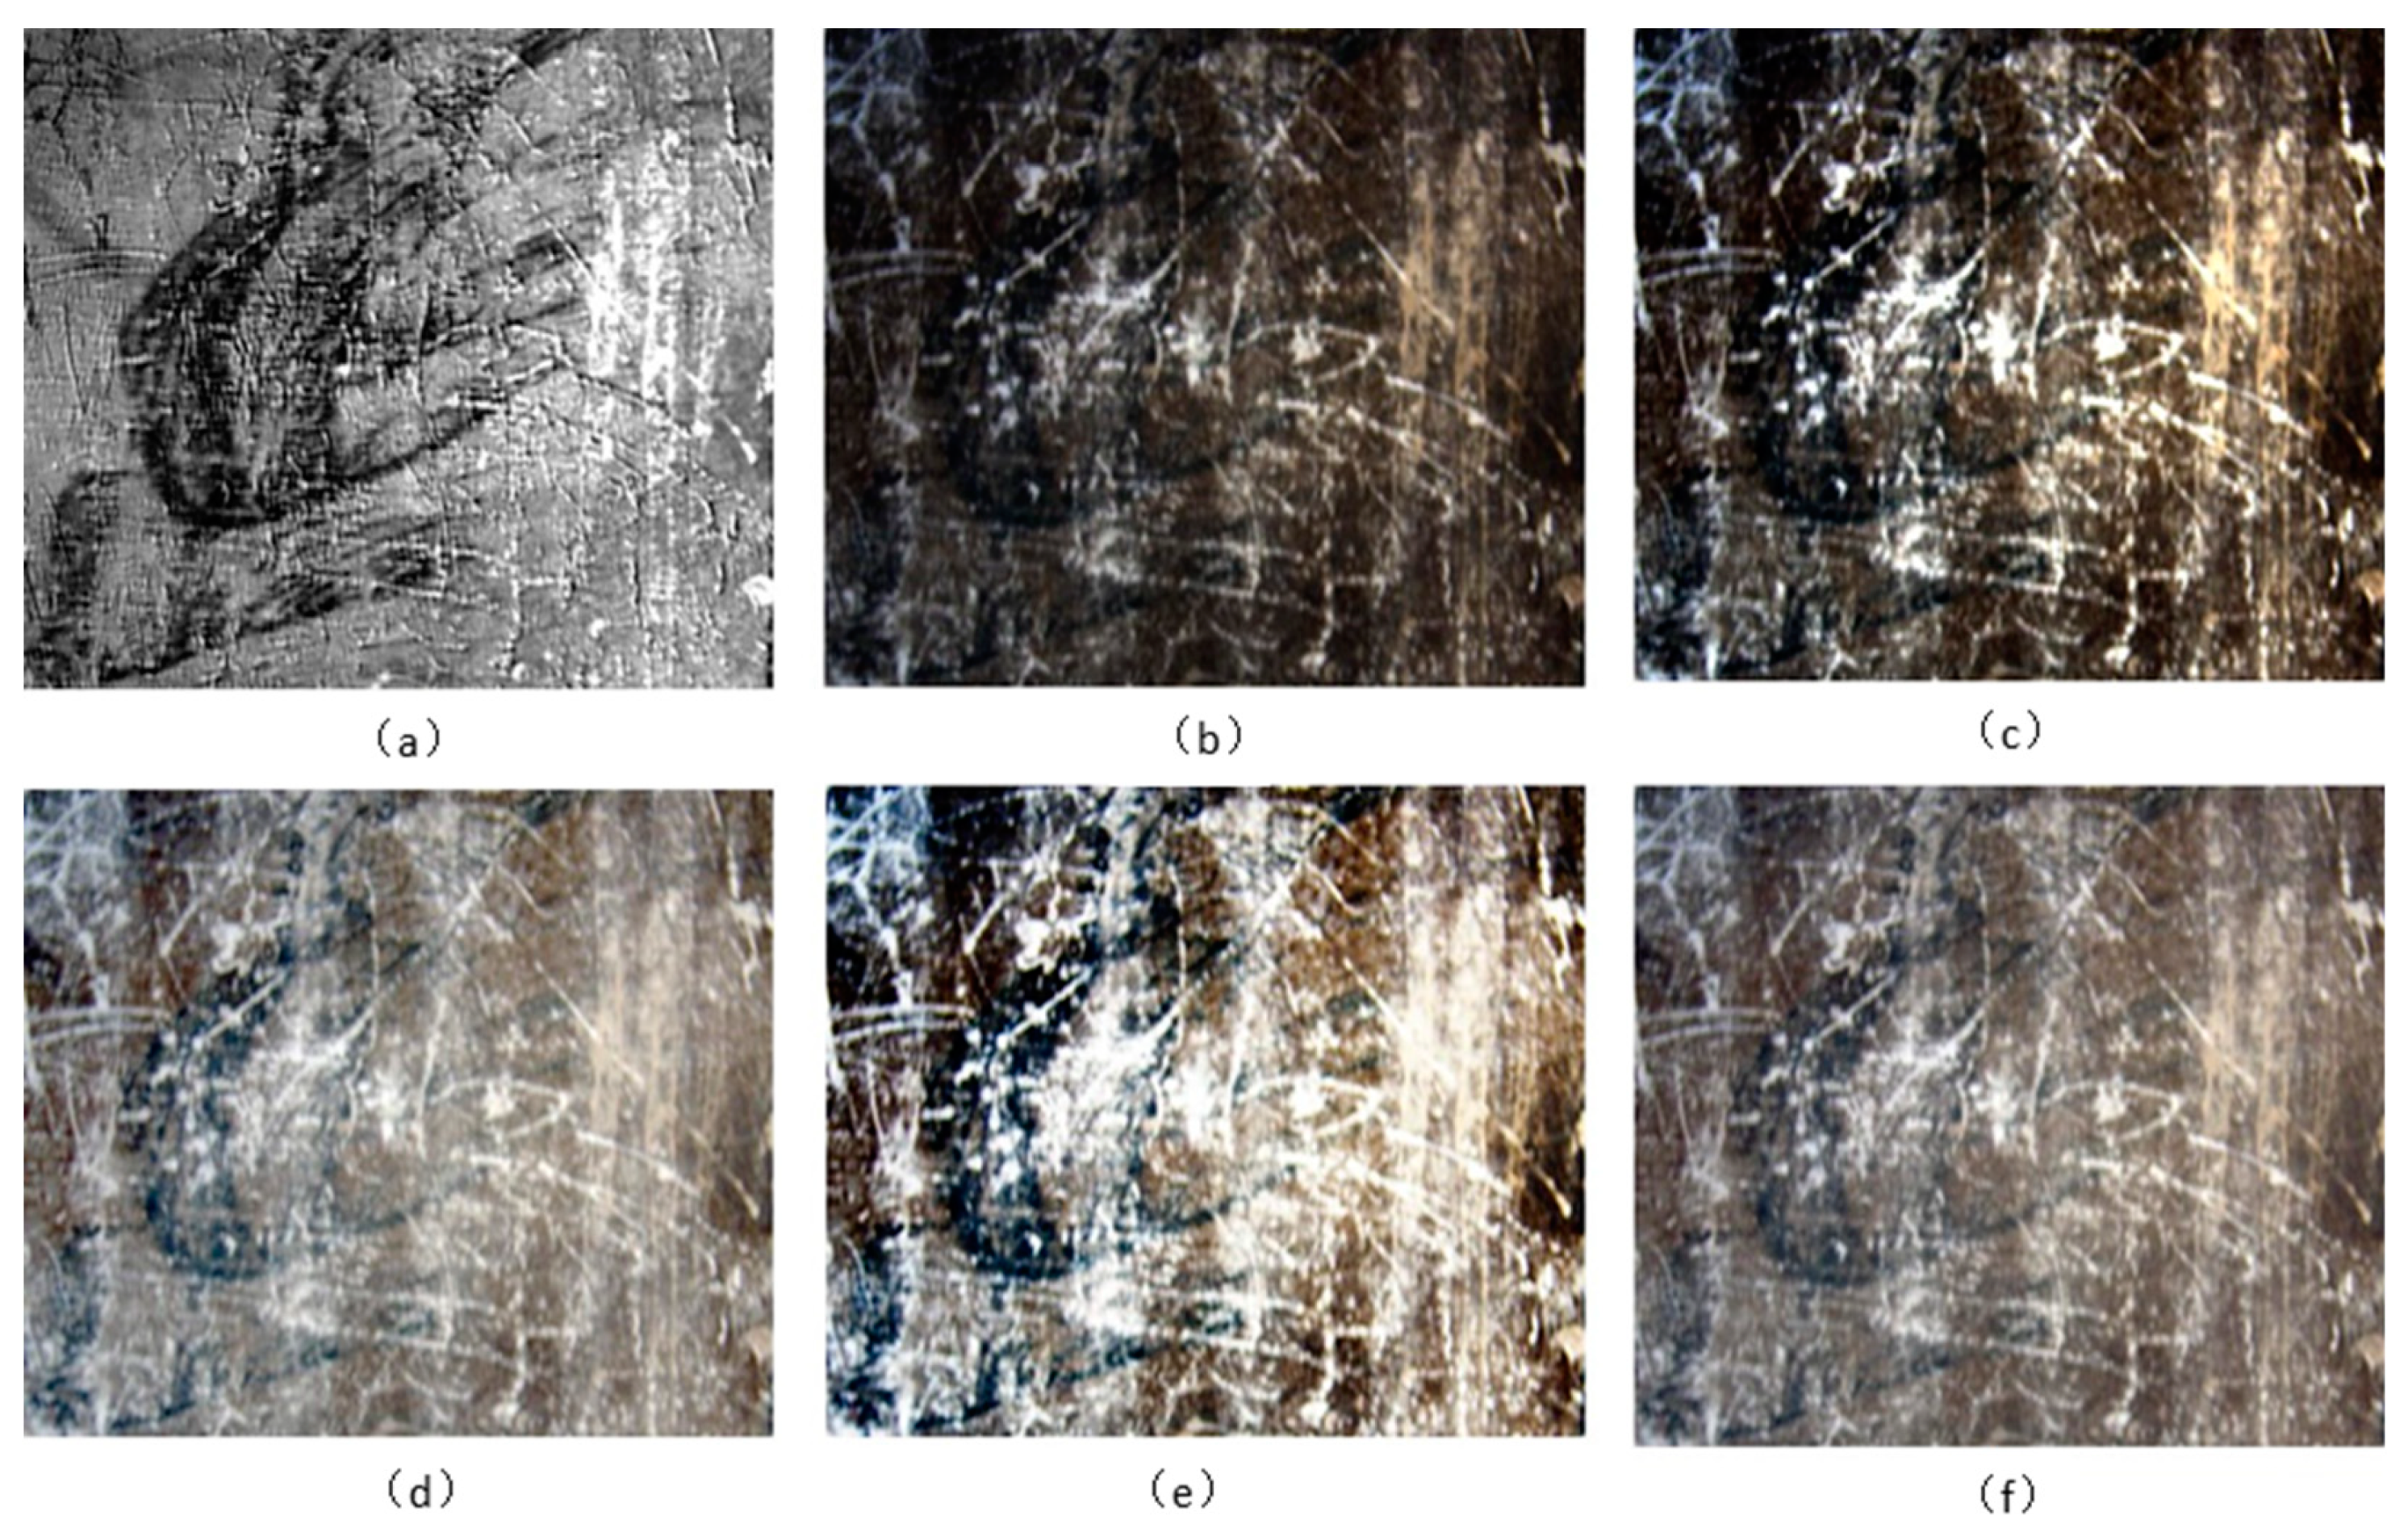
After the image subtraction, the range of DN values for area 1 was −2.97 to 9.90; the range for area 2 was −2.28 to 7.42. After the DN value calculation was performed, the values of the image became 0 to 12.87 and 0 to 9.70 (see Figure 7b,e).
The results were then converted into the classified image by density slicing to extract the information under the sootiness. In order to do this, an analysis was performed to determine the suitable threshold values for area 1 and area 2, which were used to separate value ranges into two categories, i.e., the mural pattern and the background. According to this analysis, when the threshold of area 1 was 7.95 and the threshold of area 2 was 6.55, the pattern and the background could be separated well. The extraction results are shown in Figure 7c,f, with the pattern and background shown in red and black, respectively.
Visually, as shown in Figure 7c,f, the highlights were extracted with a relatively lower number of misclassified pixels. This result also showed that the proposed method could be used in hidden information extraction of the sootiness. Using this process, faint mural images can be highlighted to increase their readability, and patterns under the sootiness can be efficiently extracted.
3.3. Accuracy Evaluation
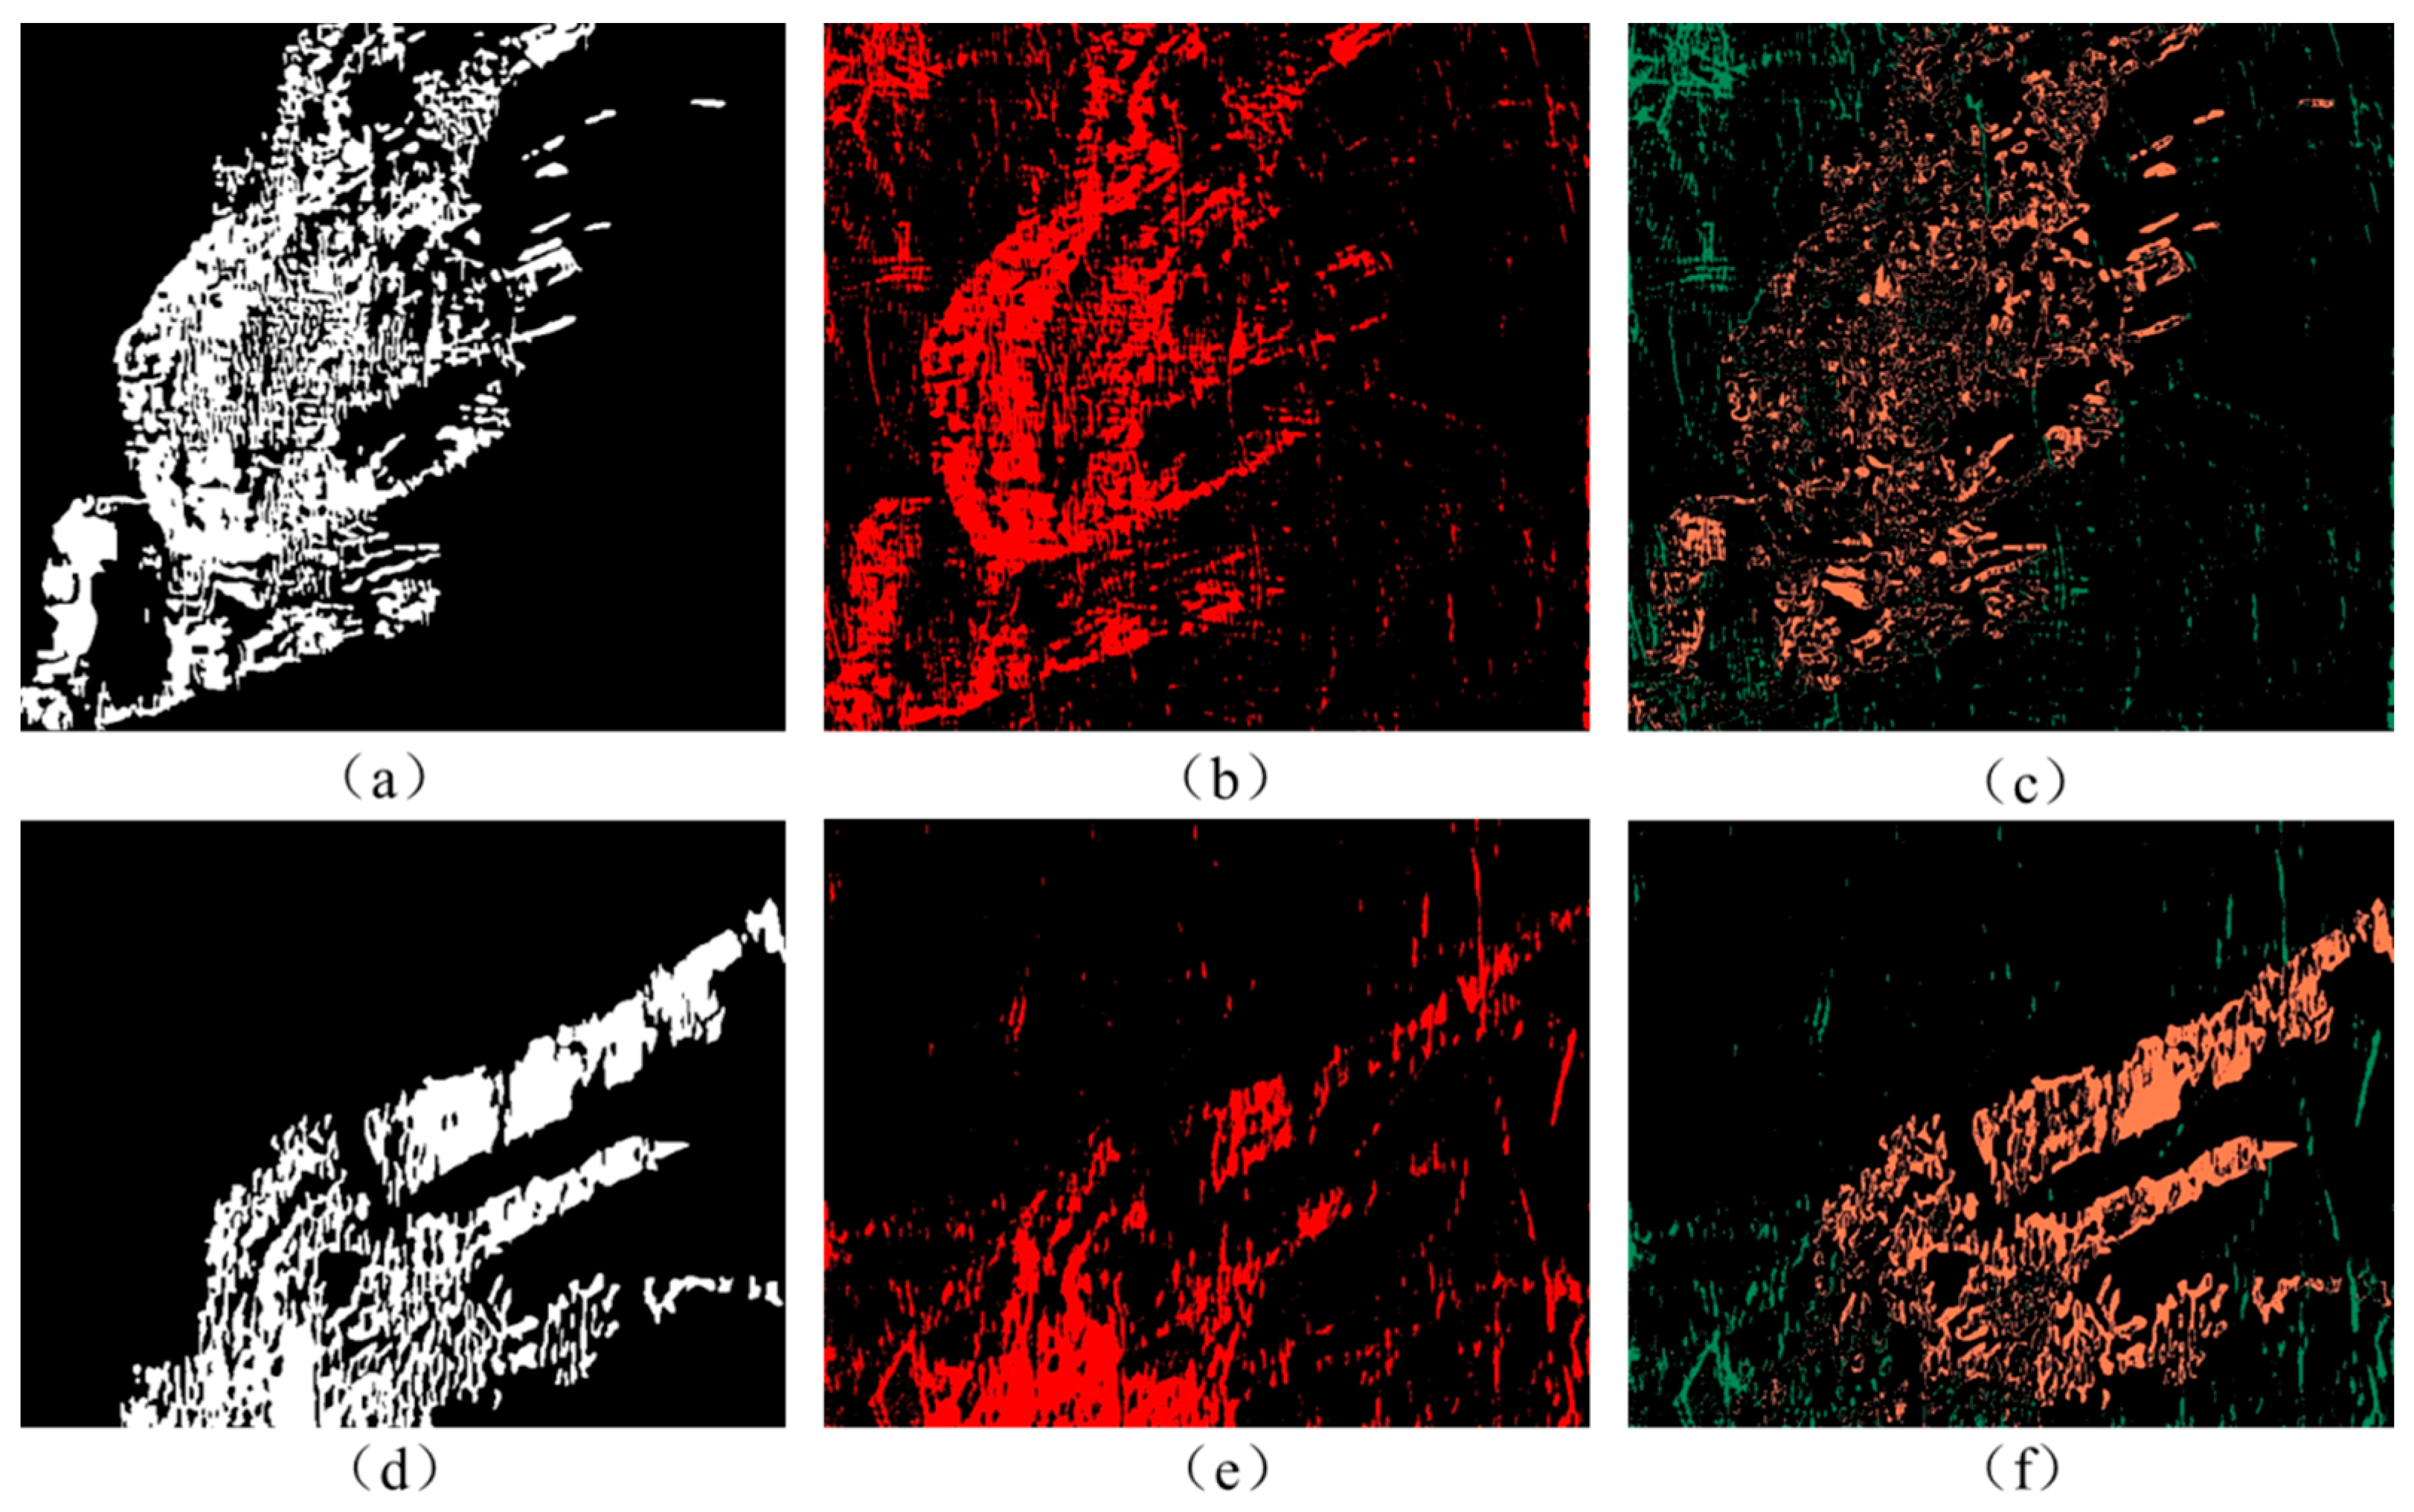
The image subtraction was used again to evaluate the accuracy of the extraction results. The difference images of the two areas in Figure 8c,f were obtained by subtracting the density slicing image (shown in Figure 8b,e) with the test images (shown in Figure 8a,d). The pattern was determined after the image enhancement, and the test images were drawn manually on the enhanced images (Figure 5c) with ROI using ENVI software. As shown in Table 1, in the difference image of area 1 with a threshold of 7.95, the black area shows the correctly extracted pixels, and the overall accuracy reached 88.97%. The omission error shown in orange accounted for 6.68%, while the commission error shown in green accounted for 4.35%. In the difference image of area 2 with a threshold of 6.55, the overall accuracy was 87.50%. The omission error accounted for 9.54%, while the commission error accounted for 2.96%.
During the experiments, it was found that the setting of the value range affected the extraction results greatly. An analysis test was done to set the threshold to achieve the best effect of pattern extraction. The comparison of accuracy of area 1 with different thresholds is shown in Table 2. From 7.75 to 8.25, the omission error was gradually increased and the commission error was gradually reduced. The overall accuracy reached the maximum of 88.97% at 7.95.
The accuracy of area 2 with different thresholds is shown in Table 3. Similarly, from 6.30 to 6.80, the omission error was gradually increased and the commission error was gradually reduced. When the threshold was 6.55, the overall accuracy was at its highest, reaching 87.50%.
4. Comparison with Other Methods
Interactive histogram stretching is a commonly used image enhancement method. The main stretching methods are linear, equalization, Gaussian, and square root. In order to compare the image enhancement effects of the method in this paper and the histogram stretching, all of these methods were applied to the original hyperspectral image of area 1 respectively. By adjusting the stretching range, the enhanced image with the best visual effect was obtained; the results are shown in Figure 9.
The original hyperspectral image without MNF transform was directly subjected to image subtraction, and the result is shown in Figure 10. It can be seen that the significant scratch and noise band removal by MNF transform had a significant effect on image enhancement.
In addition, blind separation technologies, such as principal component analysis (PCA) and independent component analysis (ICA), also proved to improve the readability of degraded images and reveal hidden information [23]. In order to compare the image enhancement effects of the method in this paper with that of PCA and ICA, these methods were applied to the original hyperspectral image of area 1. The bands with the most enhanced visual effects after PCA and ICA transform were given, and the results are shown in Figure 11.
The results show that the method mentioned in this paper achieved better image enhancement effects.
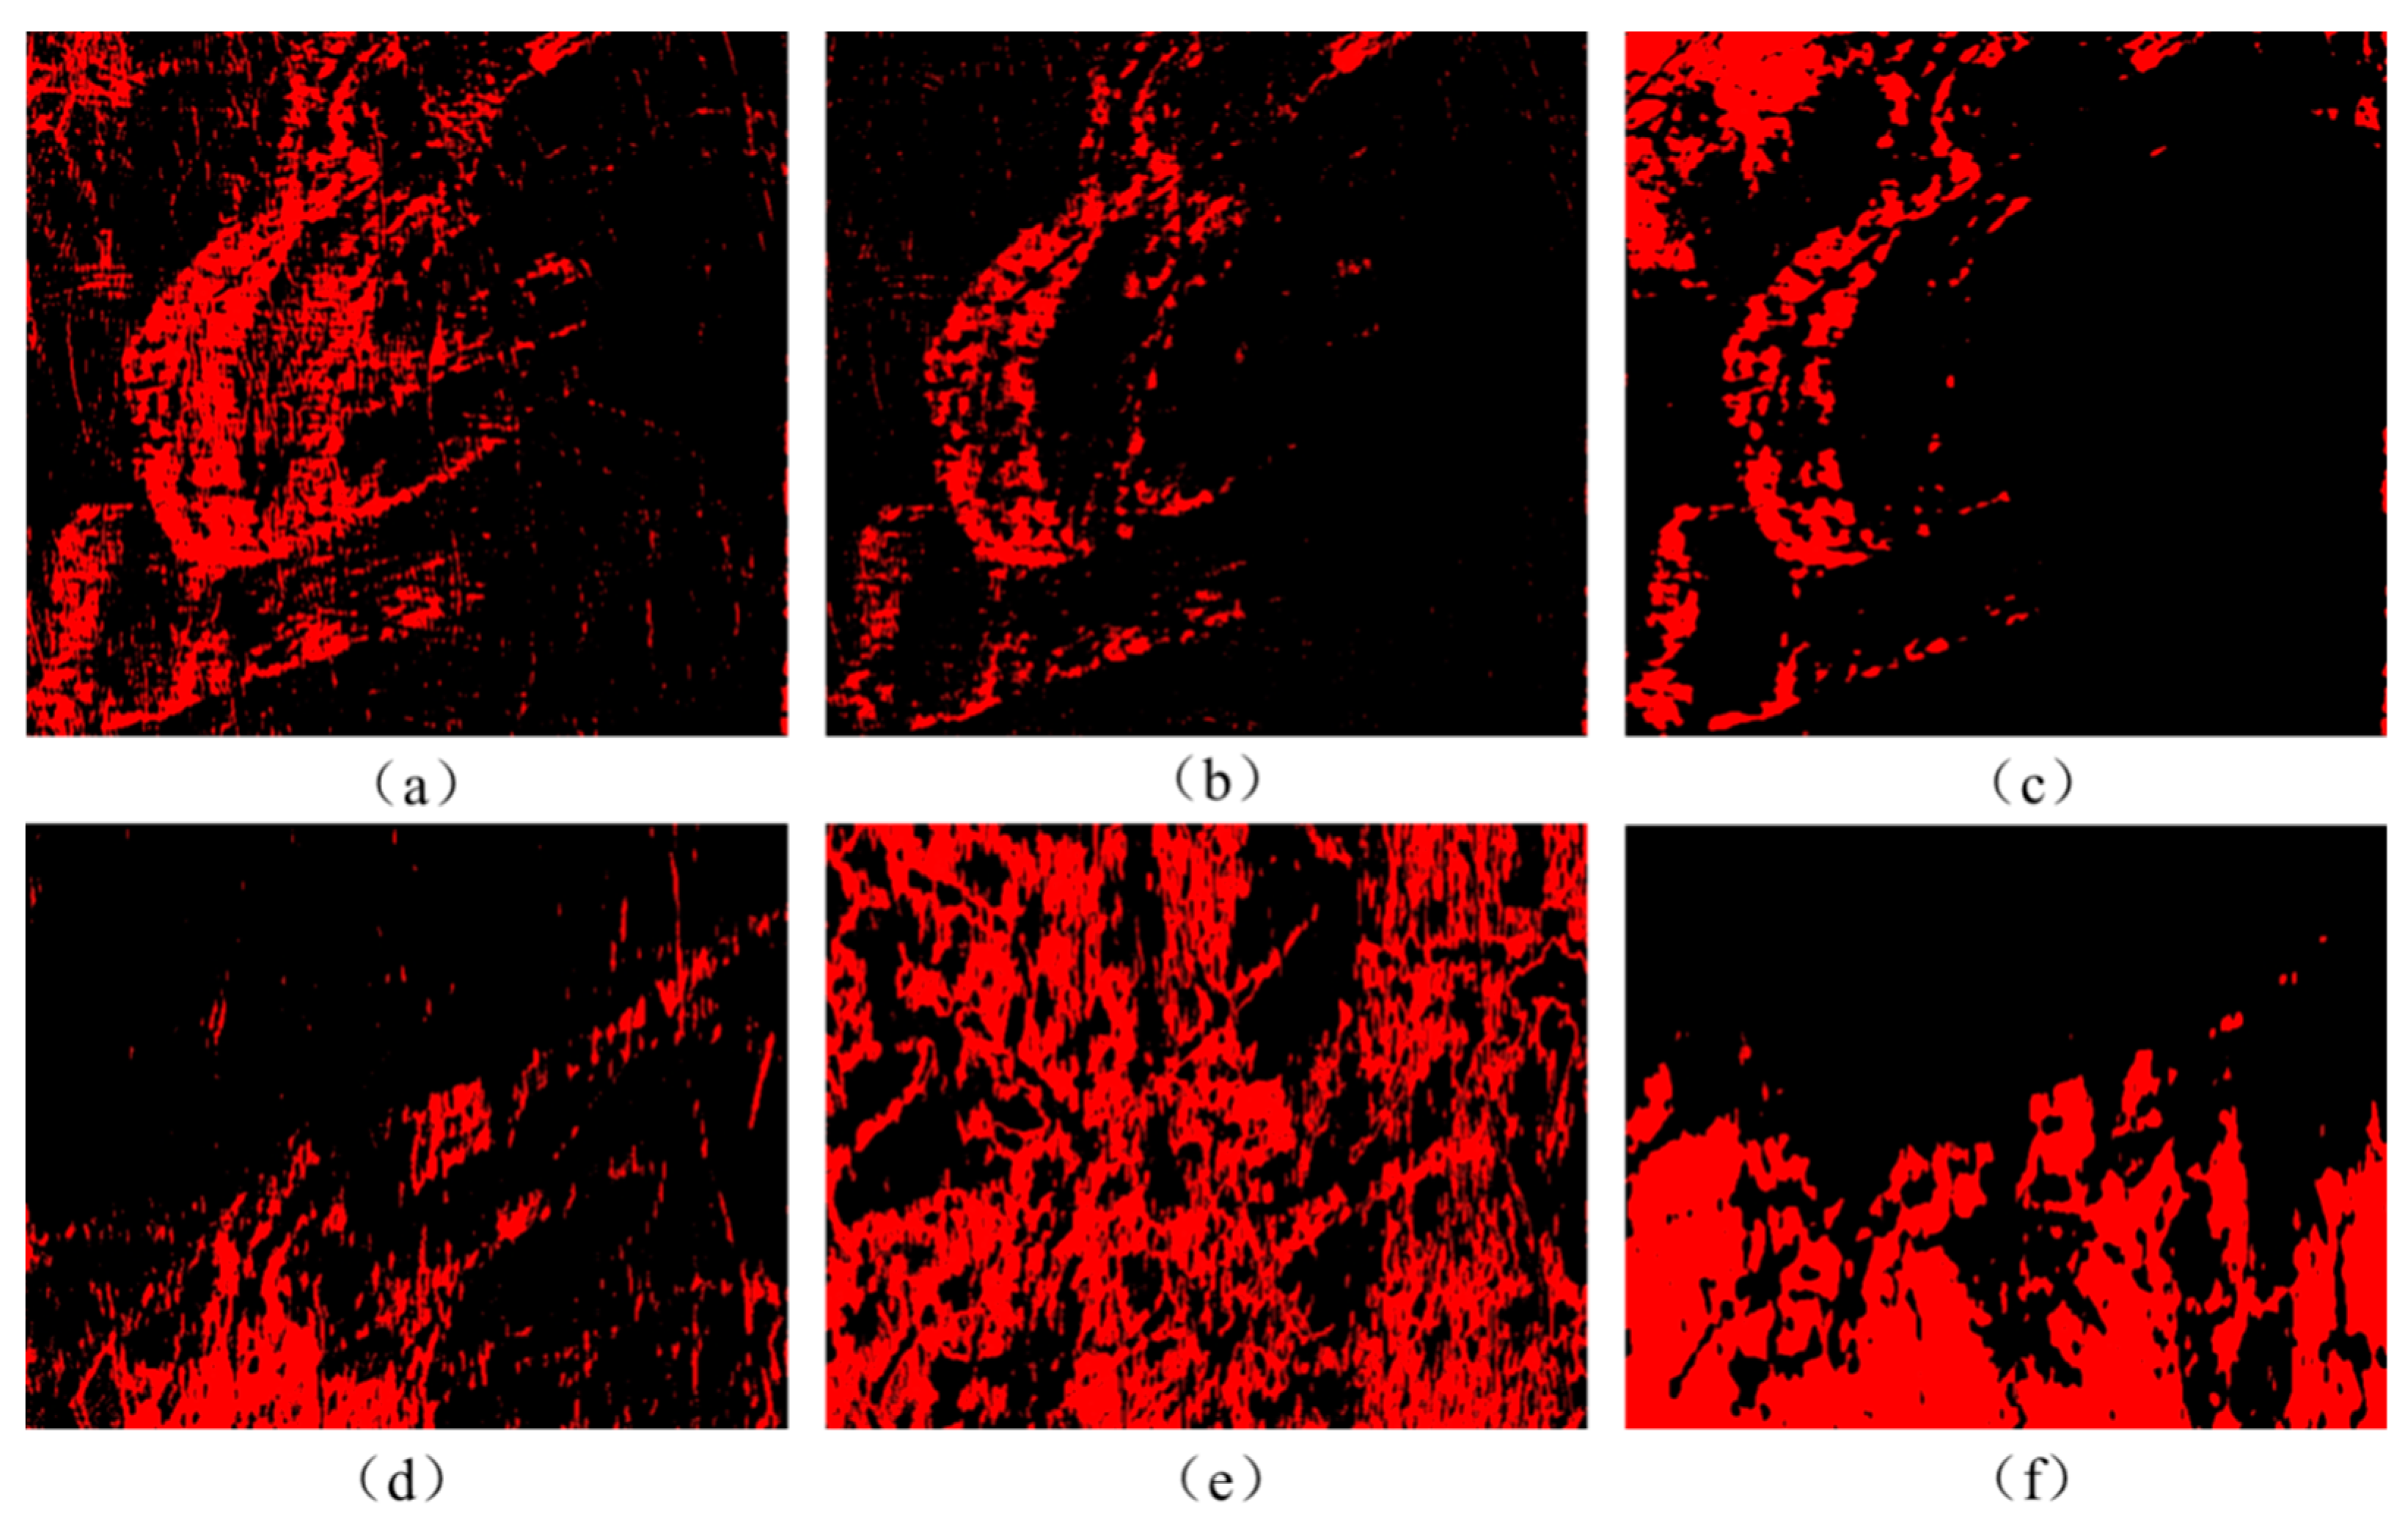
Image classification is a common method for feature extraction and recognition. For hyperspectral images, Spectral Angle Mapper (SAM) and Support Vector Machine (SVM) are two commonly used classification methods. To compare the results obtained by the proposed method with those of SAM and SVM, both SAM and SVM were applied to the data. For SAM classification, the spectral curves of each area needed to be calculated first. The similarity between the two spectral curves was determined by calculating the generalized angel between the two curves; the smaller the angle, the more similar the two curves. The threshold was adjusted by multiple trials, and the visual effect was best when the thresholds were 0.025 for area 1 and 0.012 for area 2, respectively. The result of SAM is shown in Figure 12b,e. As for SVM, a very efficient machine learning algorithm, the basic idea was to find an optimal classification hyperplane that maximized the separation between the two types of areas. The result of SVM is shown in Figure 12c,f.
Compared to the two methods above, the proposed method in this paper provides better visual effects with higher accuracy. As shown in Table 4, for Area 1, the extraction accuracy of the SAM classification was 84.72%, and the accuracy of the SVM classification method was 80.01%. For Area 2, the accuracies of the SAM and SVM methods were 57.46% and 71.74%, respectively, which is a good demonstration of the effectiveness of the proposed method. In order to perform more accurate classification, in this study, the target area was enhanced first and then the sootiness pattern was extracted, which effectively improved the accuracy of the extraction. Therefore, there were some advantages of the proposed method to some extent.
5. Conclusions
Extracting hidden information from damaged murals is a challenging task in cultural conservation. The objective of this study was to develop a new method of hidden information detection using hyperspectral imaging techniques. Hyperspectral images of a Guanyin Temple mural was used as the study case. A series of spectral analysis approaches was integrated and applied to enhance the visual expression of the hidden information, and the pattern under the sootiness was extracted from hyperspectral images effectively. This was done by applying MNF transformation to reduce the features of the scratches and sootiness in the mural background, and by spectral feature analysis and image subtraction to enhance the characteristics of ancient murals, which highlighted the blurred image of the mural under the sootiness and increased the readability and artistic expressiveness of the ancient murals. Finally, the pattern covered by the sootiness was extracted by density slicing. By adjusting the threshold, the overall accuracy reached 88.97%.
However, as mentioned above, there are many kinds of hidden information, such as hidden patterns and text, underdrawings and manuscript, smeared information, and restoration marks. The proposed method is not suitable to all situations, because the spectral curves of different substances are also different from each other; to enhance the target information, a certain difference in the reflectance of the objective and other substances is required. Furthermore, the input of image subtraction needs to be analyzed according to the specific extraction object. Therefore, further studies are needed to deal with different types of occlusion and to adapt the method to different extraction targets.
Author Contributions
Conceptualization, M.H.; Data curation, C.X.; Methodology, M.H., N.C., L.T. and S.L.; Supervision, P.Z.; Writing—original draft, N.C. and L.T.; Writing—review & editing, N.C. and S.L.
Funding
This work was supported by the Research Fund of the National key research and development program (No. 2017YFB1402105), the Fundamental Research Funds for Beijing University of Civil Engineering and Architecture (No. X18024), and the Great Wall Scholars Training Program Project of Beijing Municipality Universities (CIT&TCD20180322).
Conflicts of Interest
The authors declare no conflict of interest.
References
- Hou, M.; Pan, N.; Ma, Q. Review of hyperspectral imaging technology in analyzing painted artifacts. Spectrosc. Spectr. Anal. 2017, 37, 1852–1860. [Google Scholar]
- Fragasso, L.; Masini, N. Postprocessing of infrared reflectography to support the study of a painting: The case of Vivarini’s Polyptych. Int. J. Geophys. 2011, 2011, 150–161. [Google Scholar] [CrossRef]
- Padoan, R.; Steemers, T.A.G.; Klein, M.E.; Aalderink, B.; De Bruin, G. Quantitative hyperspectral imaging of historical documents: Technique and applications. In Proceedings of the 9th International Conference on NDT of Art, Jerusalem, Israel, 25–30 May 2008; pp. 25–30. [Google Scholar]
- Salerno, E.; Tonazzini, A.; Bedini, L. Digital image analysis to enhance underwritten text in the Archimedes palimpsest. Int. J. Doc. Anal. Recognit. 2007, 9, 79–87. [Google Scholar] [CrossRef]
- Bomford, D.; Billinge, R. Underdrawings in Renaissance paintings: Art in the making. In National Gallery; Yale University Press: New Haven, CT, USA, 2012. [Google Scholar]
- Daffara, C.; Fontana, R. Multispectral infrared reflectography to differentiate features in paintings. Microsc. Microanal. 2011, 17, 691–695. [Google Scholar] [CrossRef]
- Mansfield, J.R.; Attas, M.; Majzels, C.; Cloutis, E.; Collins, C.; Mantsch, H.H. Near infrared spectroscopic reflectance imaging: A new tool in art conservation. Vib. Spectrosc. 2002, 28, 59–66. [Google Scholar] [CrossRef]
- Jackson, J.B.; Mourou, M.R.; Whitaker, J.F.; Duling, I.N.; Williamson, S.L.; Menu, M.; Mourou, G.A. Terahertz time-domain reflectometry applied to the investigation of hidden mural paintings. In Proceedings of the 2008 Conference on Lasers and Electro-Optics and 2008 Conference on Quantum Electronics and Laser Science, San Jose, CA, USA, 4–9 May 2008; pp. 1–2. [Google Scholar]
- Wu, T.; Li, G.; Yang, Z.; Zhang, H.; Lei, Y.; Wang, N.; Zhang, L. Shortwave Infrared Imaging Spectroscopy for Analysis of Ancient Paintings. Appl. Spectrosc. 2017, 71, 977–987. [Google Scholar] [CrossRef]
- Shi, N.; Wang, X.; Zhang, C. The application of infrared thermal wave imaging technology in conservation. J. Natl. Mus. China 2017, 5, 149–157. [Google Scholar]
- Zhang, Q. The application of UVF photography techniques in research of conservation of wall paintings. WENBO 2009, 6, 222–228. [Google Scholar]
- Rencz, A.N.; Ryerson, R.A. Manual of Remote Sensing. Remote Sensing for the Earth Sciences, 3rd ed.; Wiley: Hoboken, NJ, USA, 1999; Volume 3. [Google Scholar]
- Kruse, F.A.; Perry, S.L.; Caballero, A. District-level mineral survey using airborne hyperspectral data, Los Menucos, Argentina. Ann. Geophys. 2006, 49, 83–92. [Google Scholar]
- Goetz, A.F.H. Spectroscopic remote sensing for geological applications. Imaging Spectrosc. 1981, 268, 17–21. [Google Scholar]
- Atzberger, C. Advances in remote sensing of agriculture: Context Description, Existing Operational Monitoring Systems and Major Information Needs. Remote Sens. 2013, 5, 949–981. [Google Scholar] [CrossRef]
- Huang, W.; Chen, L.; Li, J.; Zhang, C. Effective wavelengths determination for detection of slight bruises on apples based on hyperspectral imaging. Trans. Chin. Soc. Agric. Eng. 2013, 29, 272–277. [Google Scholar]
- Tong, Q.; Bing, Z.; Zhang, L. Current progress of hyperspectral remote sensing in China. J. Remote Sens. 2016, 20, 689–707. [Google Scholar]
- Zhang, B. Advancement of hyperspectral image processing and information extraction. J. Remote Sens. 2016, 20, 1062–1090. [Google Scholar] [CrossRef]
- Fischer, C.; Kakoulli, I. Multispectral and hyperspectral imaging technologies in conservation: Current research and potential applications. Stud. Conserv. 2013, 51, 3–16. [Google Scholar] [CrossRef]
- Attas, M.; Cloutis, E.; Collins, C.; Goltz, D.; Majzels, C.; Mansfield, J.R.; Mantsch, H.H. Near-infrared spectroscopic imaging in art conservation: Investigation of drawing constituents. J. Cult. Herit. 2003, 4, 127–136. [Google Scholar] [CrossRef]
- Cavalli, R.M.; Colosi, F.; Palombo, A.; Pignatti, S.; Poscolieri, M. Remote hyperspectral imagery as a support to archaeological prospection. J. Cult. Herit. 2007, 8, 272–283. [Google Scholar] [CrossRef]
- Tonazzini, A.; Salerno, E.; Abdel-Salam, Z.A.; Harith, M.A.; Marras, L.; Botto, A.; Campanella, B.; Legnaioli, S.; Pagnotta, S.; Poggialini, F.; et al. Analytical and mathematical methods for revealing hidden details in ancient manuscripts and paintings: A review. J. Adv. Res. 2019, 17, 31–42. [Google Scholar] [CrossRef] [PubMed]
- Kim, S.J.; Deng, F.; Brown, M.S. Visual enhancement of old documents with hyperspectral imaging. Pattern Recognit. 2011, 44, 1461–1469. [Google Scholar] [CrossRef]
- Goltz, D.; Attas, M.; Young, G.; Cloutis, E.; Bedynski, M. Assessing stains on historical documents using hyperspectral imaging. J. Cult. Herit. 2010, 11, 19–26. [Google Scholar] [CrossRef]
- Guo, X.; Zhang, L.; Wu, T. Hidden information extraction from the ancient painting using hyperspectral imaging technology. J. Image Graph. 2017, 22, 1428–1435. [Google Scholar]
- Balas, C.; Papadakis, V.; Papadakis, N.; Papadakis, A.; Vazgiouraki, E.; Themelis, G. A novel hyper-spectral imaging apparatus for the non-destructive analysis of objects of artistic and historic value. J. Cult. Herit. 2003, 4, 330–337. [Google Scholar] [CrossRef]
- Pan, N.; Hou, M.; Lv, S.; Hu, Y.; Zhao, X.; Ma, Q.; Li, S.; Shaker, A. Extracting faded mural patterns based on the combination of spatial-spectral feature of hyperspectral image. J. Cult. Herit. 2017, 27, 80–87. [Google Scholar] [CrossRef]
Figure 1.
The image of the mural and the two study areas. (a) The complete image of the mural; (b) the image of the first study area; (c) the image of the second study area.
Figure 1.
The image of the mural and the two study areas. (a) The complete image of the mural; (b) the image of the first study area; (c) the image of the second study area.

Figure 2.
The overall workflow of the proposed method.

Figure 3.
The first 8 bands of area 1 obtained by MNF transform. (a) MNF band 1; (b) MNF band 2; (c) MNF band 3; (d) MNF band 4; (e) MNF band 5; (f) MNF band 6; (g) MNF band 7; (h) MNF band 8.
Figure 3.
The first 8 bands of area 1 obtained by MNF transform. (a) MNF band 1; (b) MNF band 2; (c) MNF band 3; (d) MNF band 4; (e) MNF band 5; (f) MNF band 6; (g) MNF band 7; (h) MNF band 8.

Figure 4.
(a) Extracting the region of interest (ROI) from area 1; (b) average spectral curves of the mural pattern (purple) and sootiness (green).
Figure 4.
(a) Extracting the region of interest (ROI) from area 1; (b) average spectral curves of the mural pattern (purple) and sootiness (green).

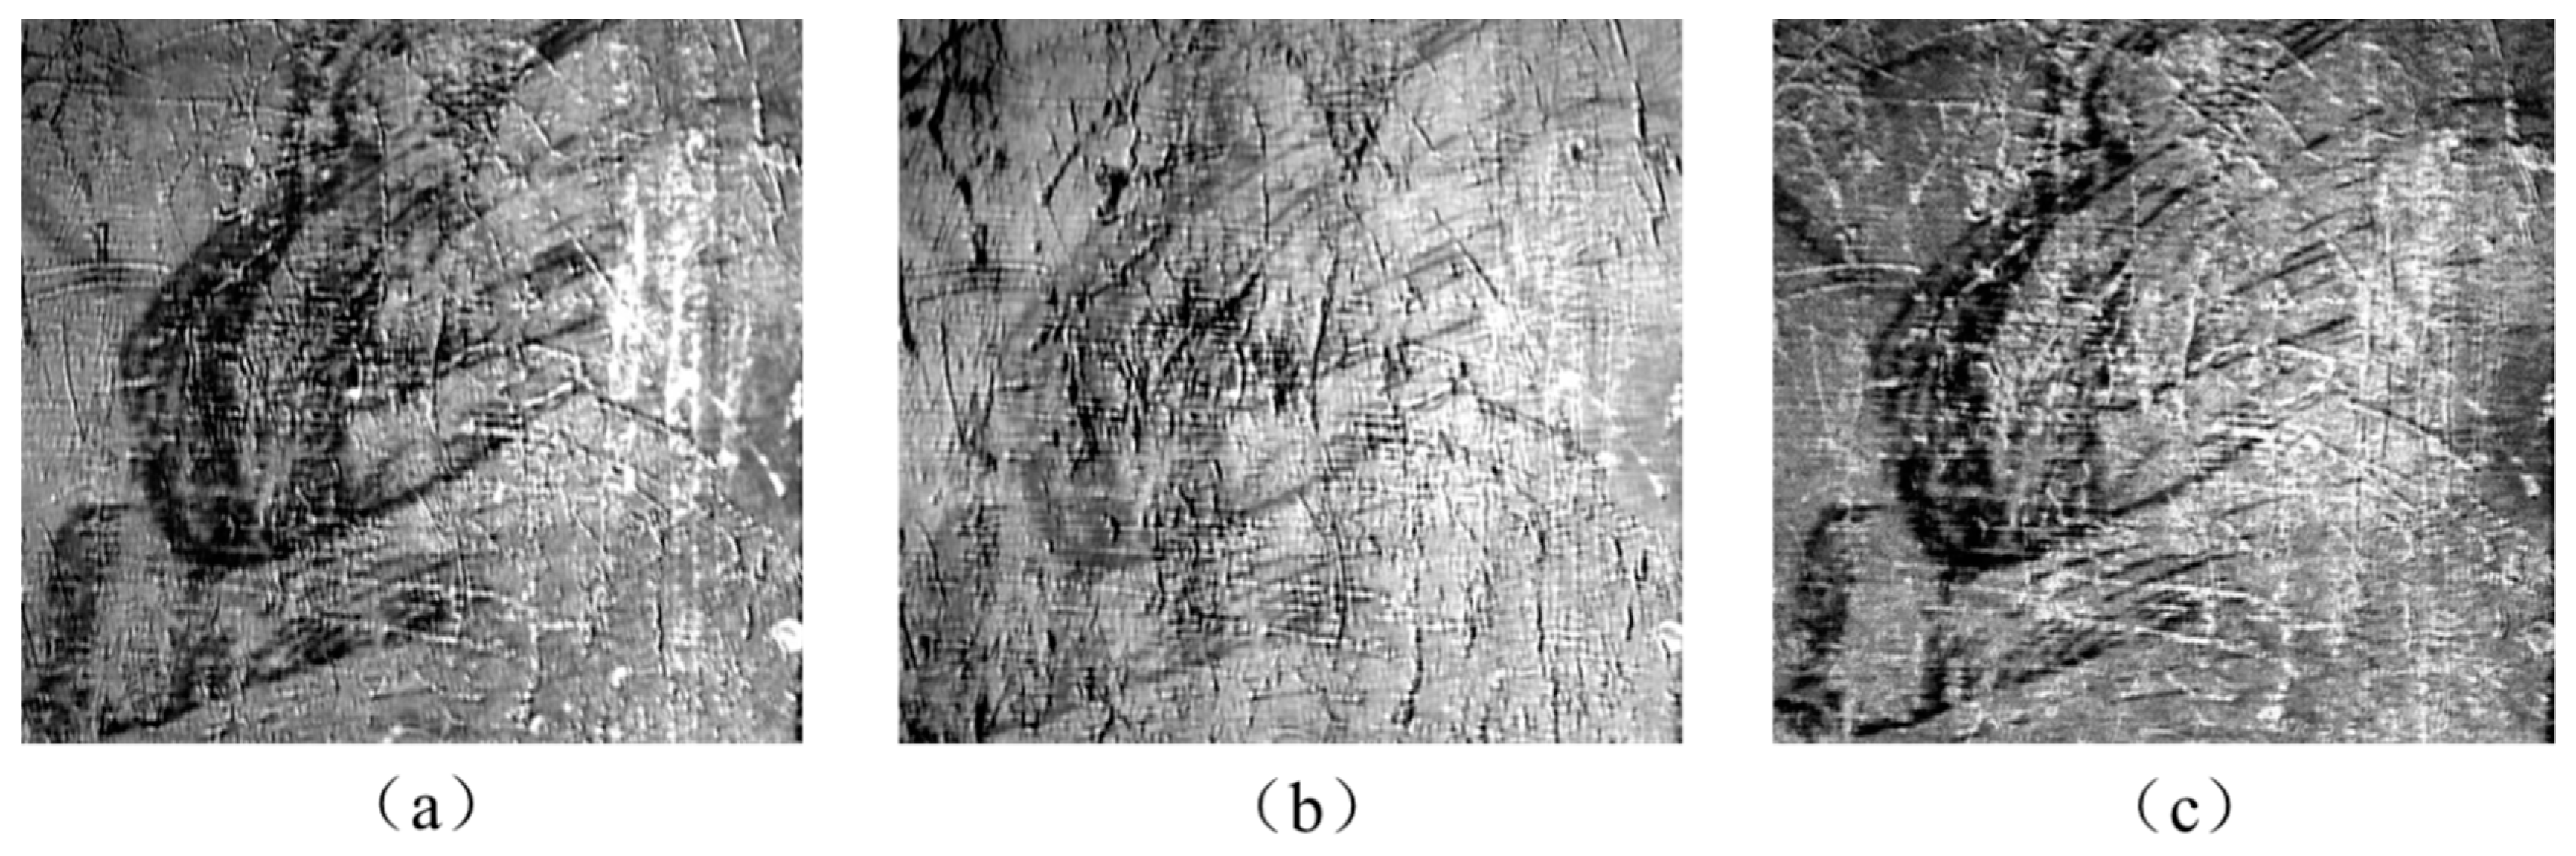
Figure 5.
The experimental results of area 1. (a) Color image (synthesized from the images after MNF inverse transform); (b) NIR image at 790 nm; (c) image after image subtraction.
Figure 5.
The experimental results of area 1. (a) Color image (synthesized from the images after MNF inverse transform); (b) NIR image at 790 nm; (c) image after image subtraction.

Figure 6.
The experimental results of area 2. (a) Color image (synthesized from the images after MNF inverse transform); (b) image after image subtraction.
Figure 6.
The experimental results of area 2. (a) Color image (synthesized from the images after MNF inverse transform); (b) image after image subtraction.

Figure 7.
The extraction of the hidden information using density slicing: (a) Color image of area 1 (synthesized from original hyperspectral images); (b) the DN value of area 1 is transformed to start from 0 and the pattern is highlighted in white; (c) the pattern of area 1 is extracted by density slicing with threshold of 7.95; (d) color image of area 2; (e) the DN value of area 2 is transformed to start from 0 and the pattern is highlighted in white; (f) the pattern of area 2 is extracted by density slicing, with a threshold of 6.55.

Figure 8.
The extraction results of the hidden information of (a–c) area 1 and (d–f) area 2 using classification methods. (a,d) Test image drawn manually; (b,e) extraction results of density slicing; (c,f) difference image generated by subtracting the density slicing image from the test image.
Figure 8.
The extraction results of the hidden information of (a–c) area 1 and (d–f) area 2 using classification methods. (a,d) Test image drawn manually; (b,e) extraction results of density slicing; (c,f) difference image generated by subtracting the density slicing image from the test image.

Figure 9.
The enhancement results of area 1 with different methods. (a) Enhancement results of the method in this paper; (b) results using the linear method; (c) results using linear 2%; (d) results using the Gaussian method; (e) results using the equalization method; (f) results using the square root method.

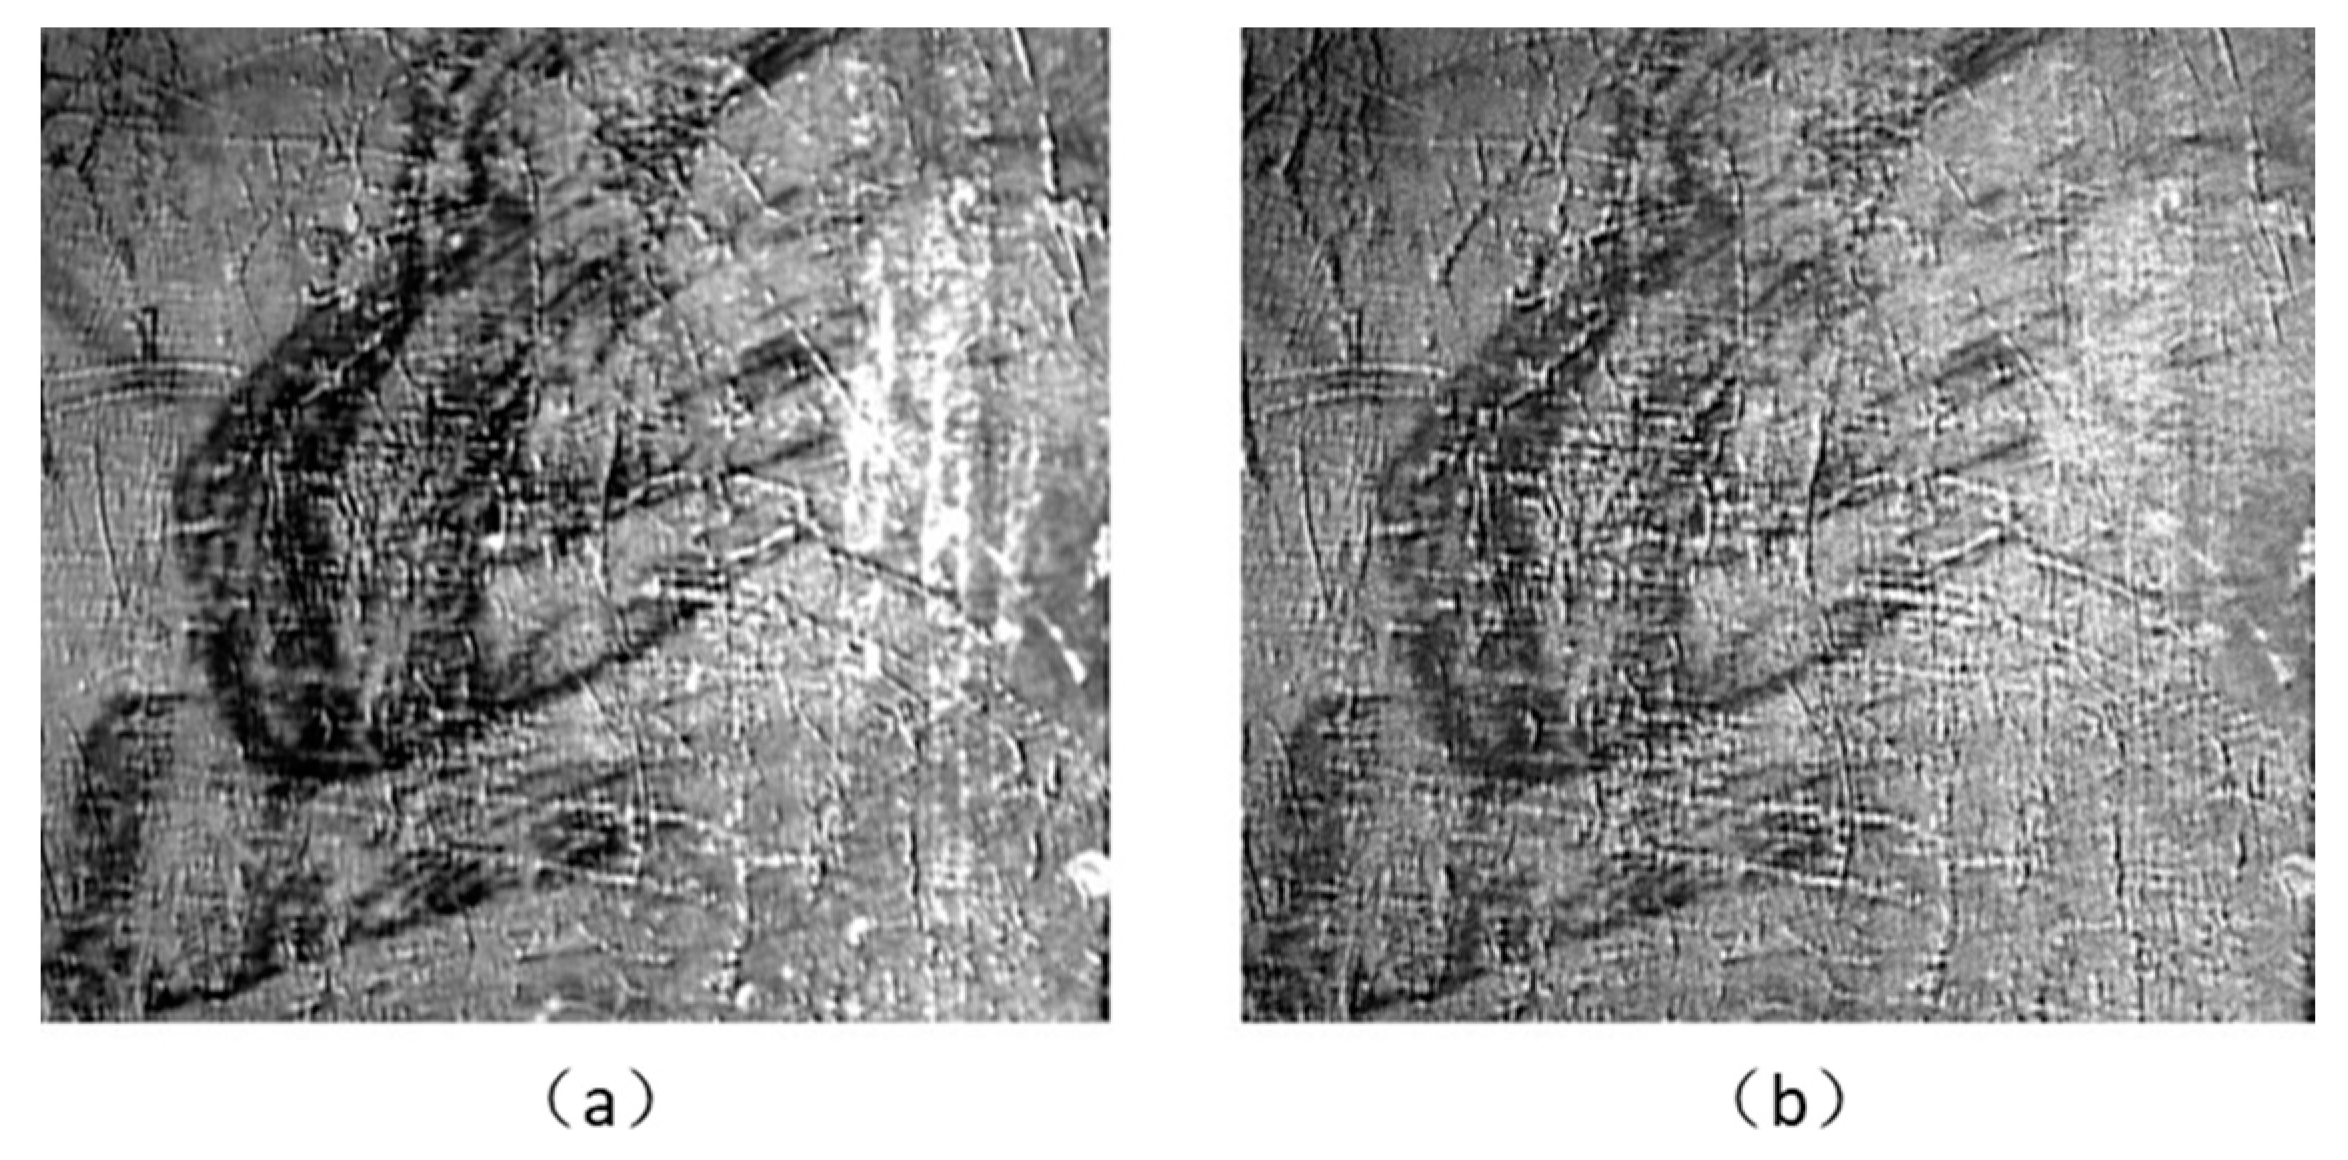
Figure 10.
The enhancement results of area 1. (a) Subtraction of images transformed by MNF (in the spectral bands of 715–600 nm); (b) subtraction of original hyperspectral images without MNF (in the spectral bands of 715–600 nm).
Figure 10.
The enhancement results of area 1. (a) Subtraction of images transformed by MNF (in the spectral bands of 715–600 nm); (b) subtraction of original hyperspectral images without MNF (in the spectral bands of 715–600 nm).

Figure 11.
The enhancement results of area 1 with different methods. (a) Enhancement results of the method in this paper; (b) the second band of principal component analysis (PCA) transform; (c) the fifth band of independent component analysis (ICA) transform.
Figure 11.
The enhancement results of area 1 with different methods. (a) Enhancement results of the method in this paper; (b) the second band of principal component analysis (PCA) transform; (c) the fifth band of independent component analysis (ICA) transform.

Figure 12.
The extraction results of the hidden information of area 1 with different methods. (a) Result of the proposed method; (b) result of the Spectral Angle Mapper (SAM); (c) result of the Support Vector Machine (SVM); extraction results of the hidden information of area 2 with different methods; (d) result of the proposed method; (e) result of the SAM; (f) result of the SVM.


Table 1.
The overall accuracy of the two areas.
| Area | Overall Accuracy (%) | Omission Error (%) | Commission Error (%) |
|---|---|---|---|
| Area 1 | 88.97 | 6.68 | 4.35 |
| Area 2 | 87.50 | 9.54 | 2.96 |
Table 2.
The accuracy of area 1 with different thresholds.
| Threshold | Overall Accuracy (%) | Omission Error (%) | Commission Error (%) |
|---|---|---|---|
| 7.75 | 88.26 | 4.90 | 6.84 |
| 7.80 | 88.59 | 5.29 | 6.12 |
| 7.85 | 88.8 | 5.74 | 5.46 |
| 7.90 | 88.94 | 6.18 | 4.88 |
| 7.95 | 88.97 | 6.68 | 4.35 |
| 8.00 | 88.94 | 7.19 | 3.87 |
| 8.05 | 88.86 | 7.68 | 3.46 |
| 8.10 | 88.68 | 8.22 | 3.10 |
| 8.15 | 88.47 | 8.76 | 2.77 |
| 8.20 | 88.22 | 9.30 | 2.48 |
| 8.25 | 87.92 | 9.85 | 2.23 |
Table 3.
The accuracy of area 2 with different thresholds.
| Threshold | Overall Accuracy (%) | Omission Error (%) | Commission Error (%) |
|---|---|---|---|
| 6.30 | 85.72 | 6.36 | 7.92 |
| 6.35 | 86.36 | 6.99 | 6.65 |
| 6.40 | 86.87 | 7.64 | 5.49 |
| 6.45 | 87.24 | 8.25 | 4.51 |
| 6.50 | 87.44 | 8.91 | 3.65 |
| 6.55 | 87.50 | 9.54 | 2.96 |
| 6.60 | 87.41 | 10.18 | 2.41 |
| 6.65 | 87.27 | 10.81 | 1.97 |
| 6.70 | 86.97 | 11.41 | 1.62 |
| 6.75 | 86.67 | 11.99 | 1.34 |
| 6.80 | 86.37 | 12.52 | 1.11 |
Table 4.
Comparison of the different methods.
| Area | Method | Overall Accuracy (%) | Omission Error (%) | Commission Error (%) |
|---|---|---|---|---|
| Area 1 | Proposed Method | 88.97 | 6.68 | 4.35 |
| SAM | 84.72 | 13.83 | 1.45 | |
| SVM | 80.01 | 14.79 | 5.20 | |
| Area 2 | Proposed Method | 87.50 | 9.54 | 2.96 |
| SAM | 57.46 | 8.85 | 33.69 | |
| SVM | 71.74 | 7.73 | 20.53 |
© 2019 by the authors. Licensee MDPI, Basel, Switzerland. This article is an open access article distributed under the terms and conditions of the Creative Commons Attribution (CC BY) license (http://creativecommons.org/licenses/by/4.0/).
Share and Cite
MDPI and ACS Style
Hou, M.; Cao, N.; Tan, L.; Lyu, S.; Zhou, P.; Xu, C. Extraction of Hidden Information under Sootiness on Murals Based on Hyperspectral Image Enhancement. Appl. Sci. 2019, 9, 3591. https://doi.org/10.3390/app9173591
AMA Style
Hou M, Cao N, Tan L, Lyu S, Zhou P, Xu C. Extraction of Hidden Information under Sootiness on Murals Based on Hyperspectral Image Enhancement. Applied Sciences. 2019; 9(17):3591. https://doi.org/10.3390/app9173591
Chicago/Turabian StyleHou, Miaole, Ning Cao, Li Tan, Shuqiang Lyu, Pingping Zhou, and Chenqi Xu. 2019. "Extraction of Hidden Information under Sootiness on Murals Based on Hyperspectral Image Enhancement" Applied Sciences 9, no. 17: 3591. https://doi.org/10.3390/app9173591
Note that from the first issue of 2016, this journal uses article numbers instead of page numbers. See further details here.