Article

Association between Gingival Biotype and Facial Typology through Cephalometric Evaluation and Three-Dimensional Facial Scanning

1
Department of Neurosciences, Reproductive Sciences and Oral Sciences, Section of Orthodontics, University of Naples “Federico II”, 80131 Naples, Italy
2
Department of Mental Health and Preventive Medicine, Medical Statistics Unit, University of Campania “Luigi Vanvitelli”, 80138 Napoli, Italy
*
Author to whom correspondence should be addressed.
Appl. Sci. 2019, 9(23), 5057; https://doi.org/10.3390/app9235057
Submission received: 21 October 2019 / Revised: 11 November 2019 / Accepted: 21 November 2019 / Published: 23 November 2019

Abstract

:

Featured Application

Patients with a reduced inferior facial height present, with lower frequency, a thin gingival biotype, and might be less susceptible to periodontal damage due to orthodontic treatment.

Abstract

In dentistry, the assessment of periodontal biotype is considered one of the most important parameters with which to plan treatment, and craniofacial morphology might affect it. The aim of this study was to investigate the association between facial typology and gingival biotype in patients by means of two-dimensional and three-dimensional evaluations of facial typology. This study included 121 participants searching for orthodontic treatment (43 M, 78 F; 20.4 ± 10.4). Gingival biotype was evaluated based on the transparency of the periodontal probe through the gingival margin of the mid-buccal sulcus for both upper (UGB) and lower (LGB) anterior teeth. SellionNasion^GonionGnation (SN^GoGn) and CondylionGonionMenton (CoGoMe^) angles were measured on two-dimensional cephalograms. Three-dimensional face scans were acquired by means of a three-dimensional facial scanner (3dMD system) and successively analyzed to assess the facial typology using the ratio between lower facial height (SNMe) and total facial height (NMe). A chi-squared test and regression analysis were used to evaluate the associations between gingival biotype and facial morphology (p < 0.05). The chi-squared test showed that there was no statistically significant association between facial typology and gingival biotype (UGB p = 0.83; LGB p = 0.75). The logistic regression showed an association between SNMe/NMe and the UGB (p = 0.036), and SNMe/NMe and LGB (p = 0.049). The decreased ratio of SNMe/NMe might be a protective factor for a thin gingival biotype.

1. Introduction

Gingivitis develops more frequently in patients undergoing orthodontic treatment mainly due to an inflammatory reaction following the accumulation of bacterial plaque [1,2,3].
Many authors have shown that gingival recessions can develop during or after orthodontic treatment [4,5]. Indeed, at the end of orthodontic therapy, the reported prevalence of gingival recessions ranges from 5% to 12% and in long-term follow-up (5 years) has been observed an increase to 47% [4,5,6].
A recent systematic review has established that the direction of dental movements and the buccal-lingual thickness of the gingiva can play an important role in altering soft tissues during orthodontic treatment. There is a high probability of recession during tooth movement in areas with less than 2 mm of gingival thickness [7]. This could affect the integrity of periodontal tissues and represent a risk factor when orthodontic treatments [8], implants [9], and restorative treatments are performed [10]. Gingival biotype is defined as the thickness of the gingiva in the labiolingual direction [9]. Studies have reported that gingival biotype is an important parameter that must be evaluated to reduce the risk of gingival recession [11].
Hence, the assessment of periodontal biotype is considered one of the most important parameters for outcomes focused on dental planning according to the classification of periodontal and peri-implant diseases and conditions [12].
Many features of the gingival phenotype are genetically determined; others seem to be influenced by age, sex, growth, tooth shape, and tooth position [13]. Moreover, it has been shown that among individuals and intra-individual there is variation in the width [14] and thickness of the vestibular gingiva [15].
Facial typology is classified as dolichofacial, mesofacial, or brachyfacial. A dolichofacial typology has excessive vertical facial growth and is usually associated with an increased SellaNasion^GonionGnathion (SN^GoGN) angle and increased vertical jaw relation (AnsPns^GoGn) [16,17]. A brachyfacial typology has reduced vertical growth and is usually accompanied by reduced SN^GoGn, reduced AnsPns^GoGn, and a decreased lower facial height (SNMe) total facial height (NMe) ratio [18].
The cephalometric evaluation of facial type is essential for orthodontic diagnosis because the amount and direction of jaw growth will significantly alter the need for orthodontic biomechanics [19].
Craniofacial morphology may also affect the gingival phenotype [13,20]. Some studies have evaluated the relationship of bone morphology to facial typology [21,22,23] and a correlation between facial and alveolar bone has already been demonstrated [24]. Indeed, in dolichofacial patients, the mandibular symphysis is high and thin, while in brachyfacial patients, the symphysis is low and thick [25]. As a consequence, before starting orthodontic treatment, it is important to evaluate and to diagnose both the gingival biotype and facial typology with the objective of decreasing the risk of periodontal destruction [26]. Only a few studies have instead evaluated the association between gingival thickness and craniofacial morphology [26].
Facial soft tissue is evaluated using several methodologies; two of the most representative methods, used to obtain three-dimensional (3D) scans, are laser scanners and 3D stereophotogrammetry [27,28,29,30]. The analysis of the face using 3D stereophotogrammetry is consistent and valid [31,32,33,34]. Hence, this is a reliable method with which to analyze facial soft tissues and avoid any X-ray exposure to the patient [34,35].
Including only patients seeking orthodontic treatment, the aim of this study was to investigate the association between gingival biotype and facial typology evaluated by means of a cephalometric and 3D facial analysis.
The null hypothesis was that there is no association between gingival biotype and facial typology.

2. Materials and Methods

2.1. Subjects

The study sample comprised 121 patients (43 males, 78 females; from 10 to 56 years old, median age 17.04, and interquartile range (IQR) 13.7–22.1) recruited among patients who had to start orthodontic treatment at the Section of Orthodontics and Temporomandibular Disorders of the University of Naples “Federico II”.
All patients were fully informed about the nature of the study and signed their informed consent. The research protocol was approved by the Ethics Committee of the University of Naples Federico II (58/19).
The following selection criteria were applied: (1) patients > 8 years, (2) patients had had pre-orthodontic treatment, (3) patients had upper and lower permanent anterior teeth, and (4) patients had good oral hygiene.
Exclusion criteria included diseases requiring premedication to perform periodontal probing, systemic diseases that can influence the activity of periodontal disease, individuals taking drugs that affect periodontal status, patients with removable prostheses, and pregnant or breastfeeding women.

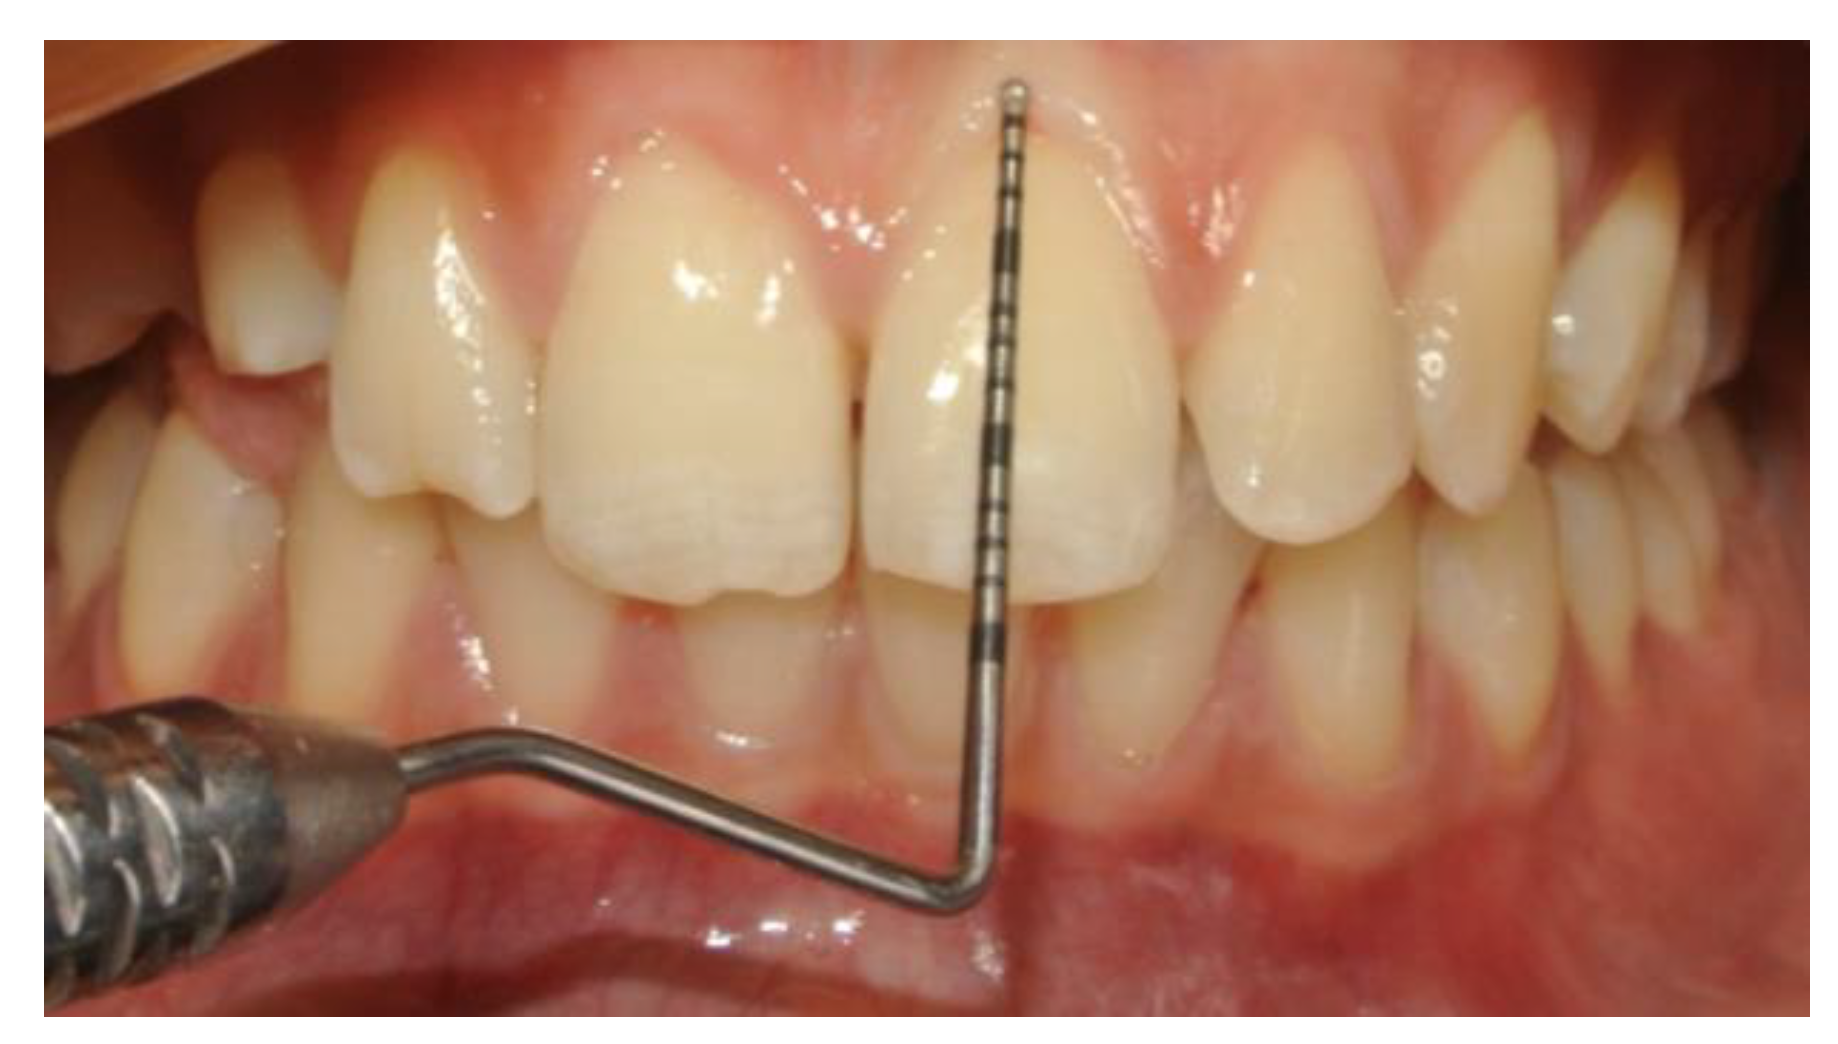
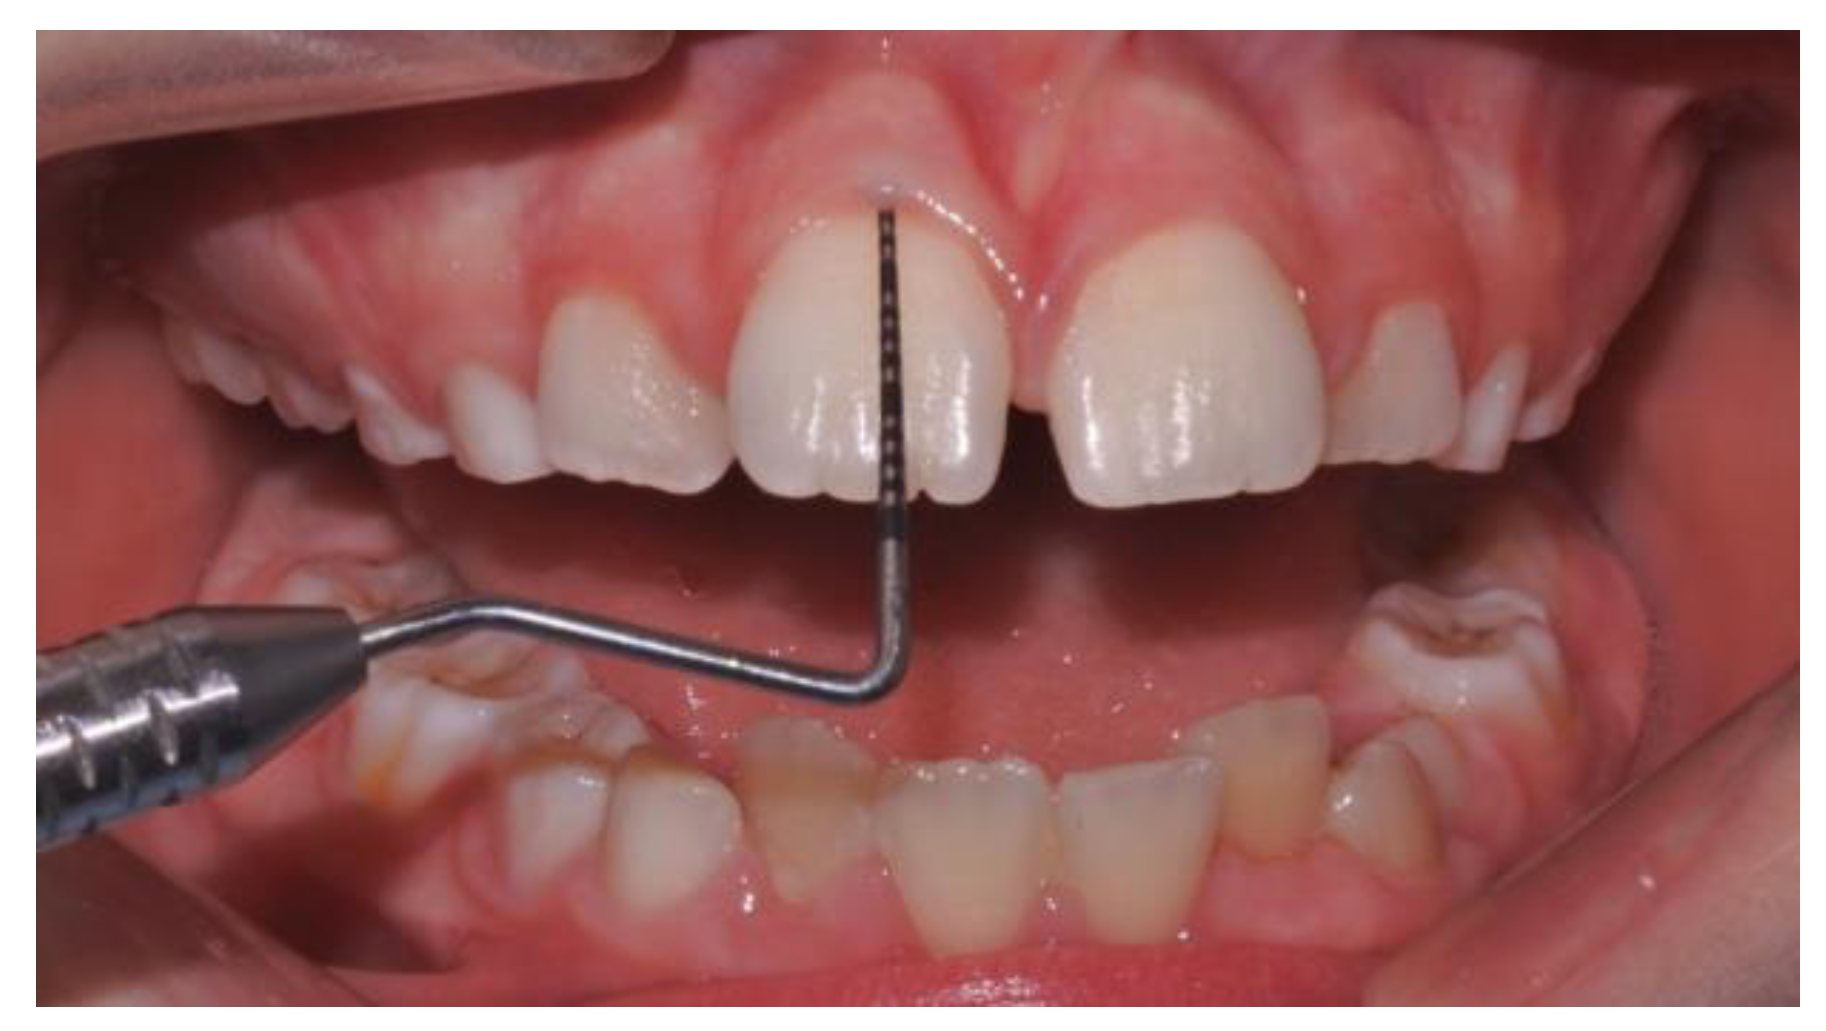
2.2. Periodontal Assessment and Clinical Procedure

Gingival biotype was evaluated based on the transparency of the periodontal probe through the gingival margin of the mid-buccal sulcus of both central and lateral incisors and canines, both maxillary and mandibular. If the outline of the probe could be seen through the gingival margin, it was categorized as “thin” (Figure 1); if not, it was categorized as “thick” (Figure 2) [36].
All the variables were recorded by one expert operator (periodontist) using a millimeter periodontal probe (15 mm North Carolina probe) inserted in the gingival sulcus with a force of about 0.25 Newton.

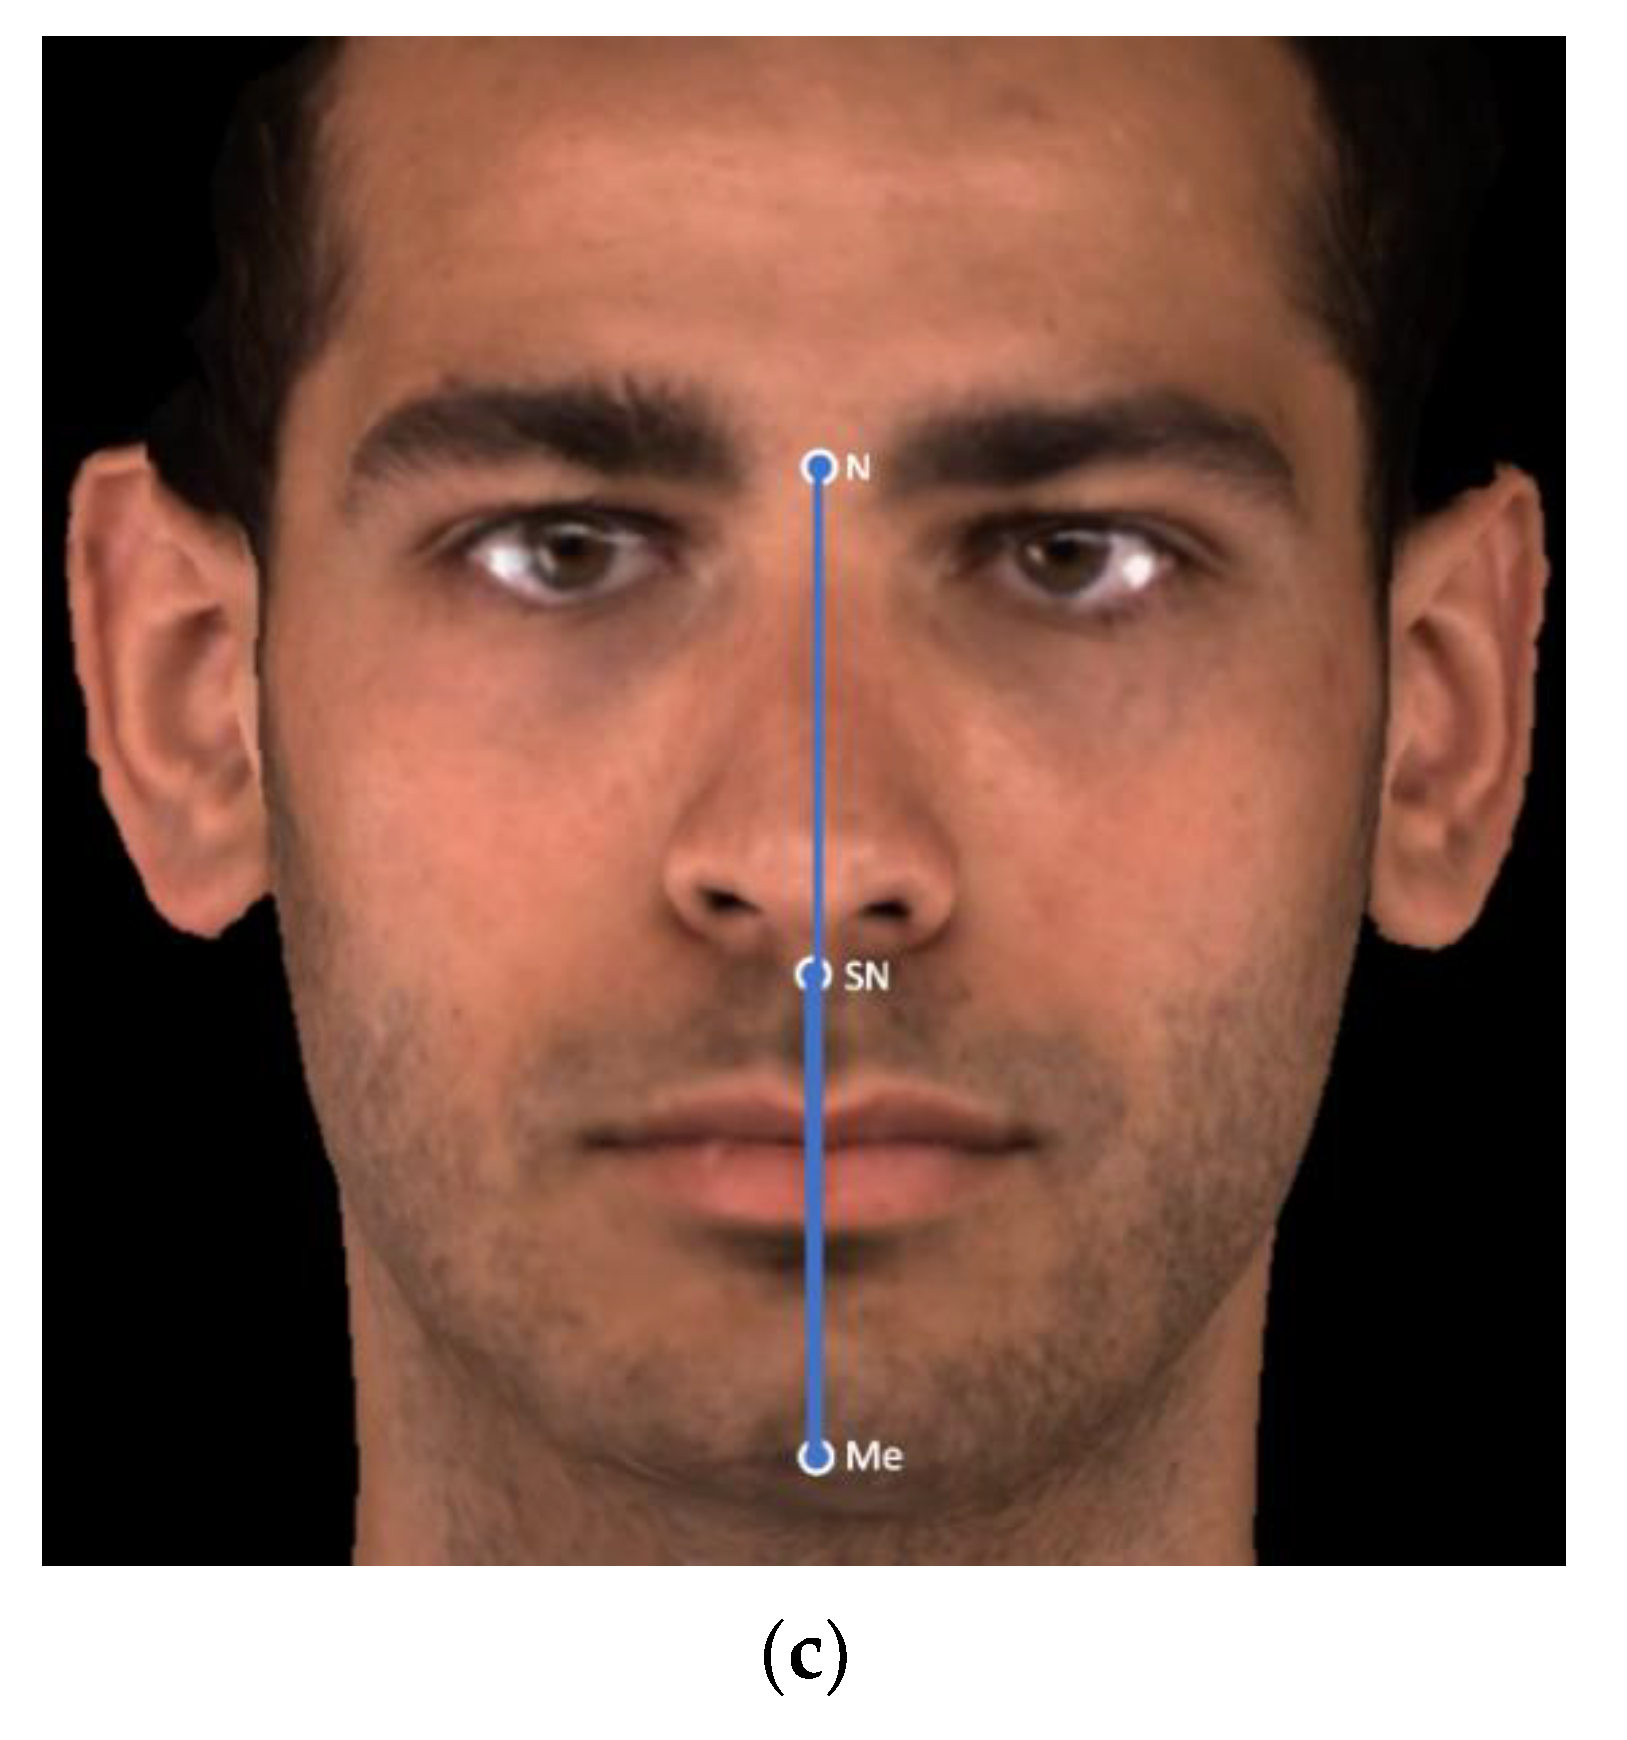
2.3. D Facial Scans Acquisition Process

The facial scanner 3dMD (3dMD LLC, Atlanta, GA, USA) was used in this study. The scanner was installed in a specific setting, with no lighting (neither natural nor artificial lighting) used during the acquisition.
The scanner configuration consisted of three pairs of stereo-cameras, two texture cameras, and four geometric cameras with lenses slightly convergent, as well as two projectors and three led panels positioned on the right and on the left.
The calibration of the system was the first step of the protocol acquisition. The operator invited the patient to look straight ahead with their head in a natural head position (NHP) for the total scanning time. The teeth were taken together with the eyes opened. After the participant had been properly positioned 90 cm away from the scanner, a video with the six cameras was recorded.
Successively, the scans were exported from the video as .obj images and analyzed using a 3dMDVultus (3dMD LLC, Atlanta, GA, USA). All images were stored on a secure computer in the School of Dentistry at the University of Naples.

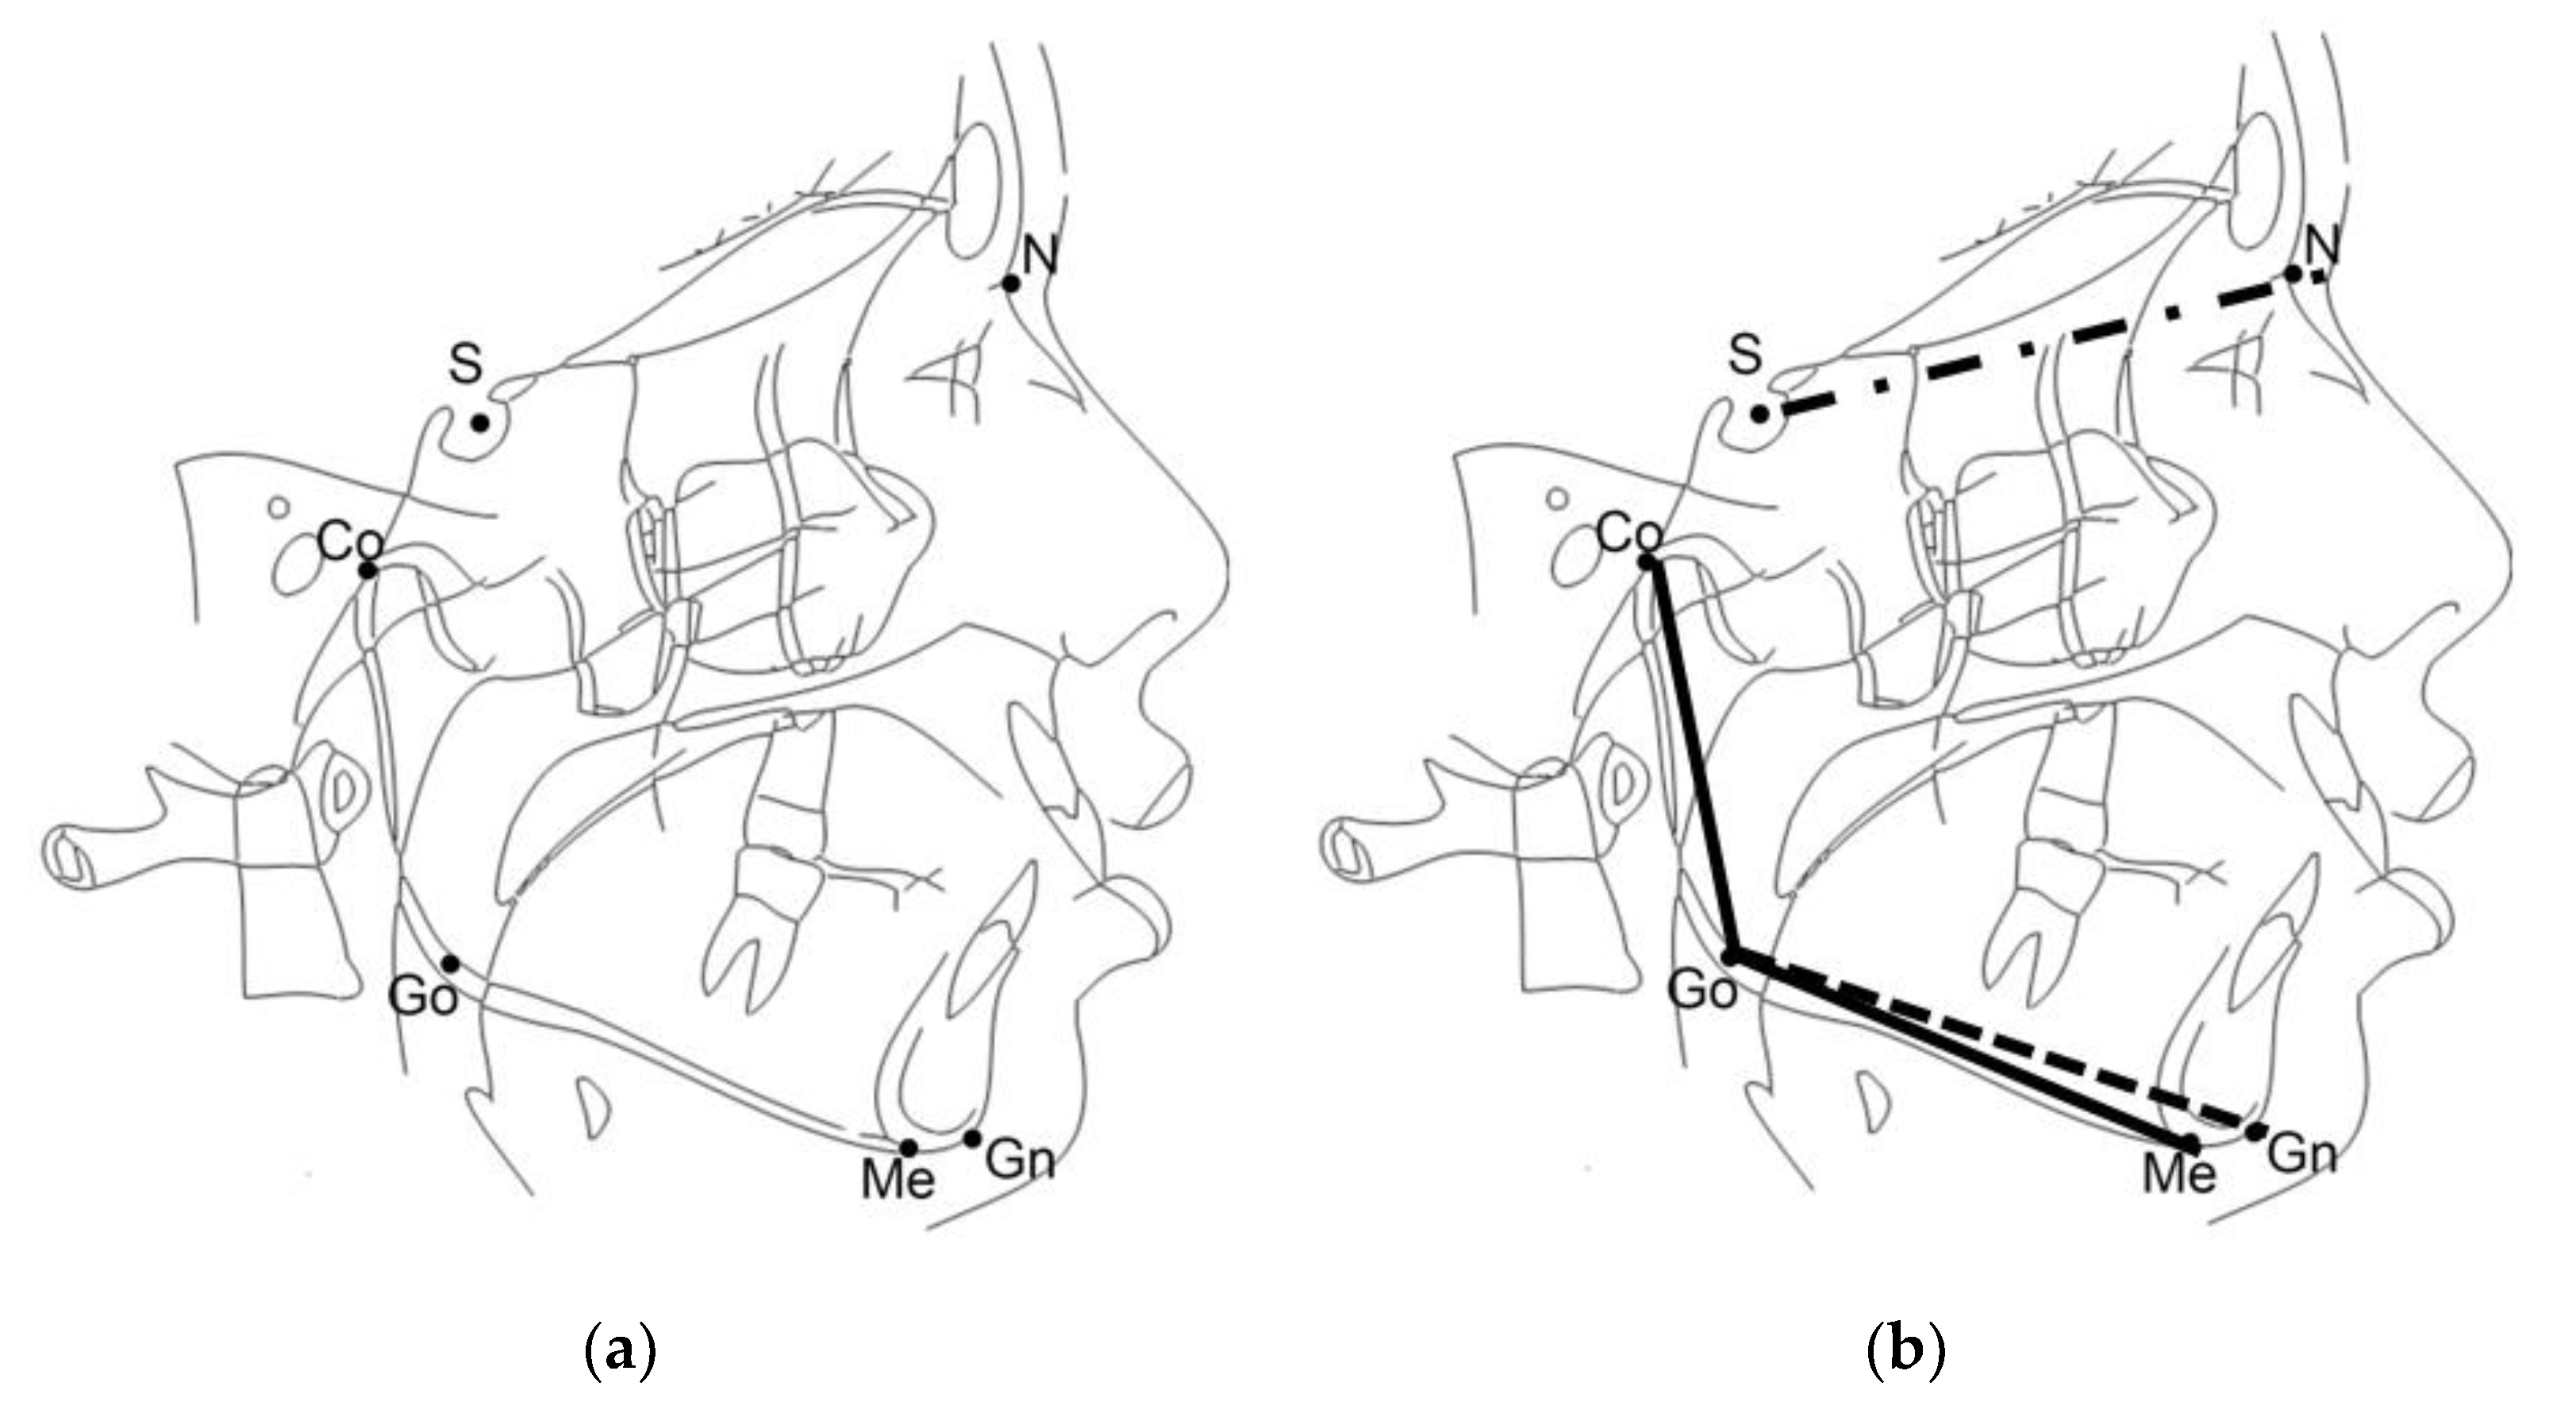
2.4. Facial Typology Assessment with Two-Dimensional and Three-Dimensional Cephalometric Evaluation

Delta-Dent software (Outside Format, Spino D’Adda, Italy) was used to perform two-dimensional cephalometric tracings to evaluate facial typology.
For this study, cephalometric analysis was performed as shown in Figure 3a,b. Briefly, two cephalometric variables were assessed: the SN^GoGn (average value ± SD = 33° ± 2.5°) determined jaw divergence, which is the angle between the anterior cranial base (Sella-Nasion) and the mandibular plane (Gonion-Gnathion), and the CoGoMe^ angle (average value ± SD = 132° ± 6.0°) that measures the mandibular structure and is formed by the condylar axis (Condylion-Gonion) and the mandibular base (Gonion-Menton).
The sample was divided into three types of craniofacial morphology: brachyfacial, with a SN^GoGn equal to or lower than 27°, mesofacial, with a SN^GoGn between 27° and 37°, and dolichofacial, with a SN^GoGn equal to or greater than 37°.
In order to evaluate facial typology, six points (Figure 3a) were identified and traced on a lateral cephalogram: ‘Sella’ (S, the center of the sella turcica), ‘Nasion’ (N, the external point of the junction between the nasal and frontal bones), ‘Gonion’ (Go, the most inferior posterior point of the mandibular angle), ‘Gnathion’ (Gn, the point of the mandibular symphysis on the facial axis) ‘Menton’ (Me, the most inferior point of the mandibular symphysis), and ‘Condylion’ (Co, the highest and most posterior point on the contour of the mandibular condyle).
The facial scans were acquired and then analyzed using 3dMDVultus Software. On the facial scans, three landmarks were identified: N (‘Soft Tissue Nasion’, the midpoint on the soft tissue contour of the base of the nasal root at the level of the frontonasal suture), SN (‘SubNasion’, the midpoint on the nasolabial soft tissue contour between the columella crest and the upper lip), and Me (‘Soft Tissue Menton’, the most inferior midpoint on the soft tissue contour of the chin). Among these three points, two linear measurements were constructed for the analysis, namely, NMe (total facial height) and SNMe (inferior facial height), as shown in Figure 3c, and the ratio between them was calculated (SNMe/NMe).

2.5. Sample Size

The sample size was established based on the fact that a sample size of 100 patients reaches 80% of power (1-beta) to detect an effect size (W) of 0.31 (medium-large effect size) using a Chi-squared test with two degrees of freedom and a significance level (alpha) of 0.05.

2.6. Statistical Analysis

Descriptive statistics on age, gender, gingival biotype, and baseline characteristics were performed (Table 1). Continuous variables were reported as mean and SD or median and IQR, according to Shapiro-Wilk test, which was performed to evaluate variable distribution. Categorical variables were reported as count and percentage and were compared using the Chi-squared test (gingival biotype versus facial typology). Logistic regression analysis was used to assess the association between continuous variables (CoGoMe^ and SNMe/NMe) and dichotomous variables (thin or thick biotype) used as dependent variables, including age as a covariate. The level of statistical significance was set at p < 0.05. Statistical analysis was performed using STATA version 14.0 (StataCorp. 2015. Stata Statistical Software: Release 14. StataCorp LP: College Station, TX, USA).

3. Results

The total sample consisted of 121 pre-orthodontic patients, comprising 43 males and 78 females which a median age of 17.04 (IQR = 13.7–22.1). Table 1 shows a description of the sample regarding age, sex, gingival biotype, and facial typology. Two-dimensional and 3D cephalometric data are reported in Table 2, and all were normally distributed.
The sample was divided into three groups according to SN^GoGn, and there were 33 (27.27%) brachyfacial patients, 59 (48.76%) mesofacial patients, and 29 (23.97%) dolichofacial patients, as shown in Table 1.
Regarding gingival biotype, most patients presented a thick gingival biotype (upper anterior teeth (UGB) 86.78%; lower anterior teeth (LGB) 52.07%), as seen in Table 1.
The Chi-squared test showed that there was no statistically significant association between SN^GoGn and gingival biotype (UGB p = 0.83; LGB p = 0.75; and gingival biotype p = 0.77, Table 3).
Similarly, the logistic regression analysis showed that CoGoMe^ was not associated with any variables of gingival biotype (UGB, p = 0.340; LGB, p = 0.065).
Finally, logistic regression analysis showed a statistically significant association of SNMe/NMe with the UGB (odds ratio = 0.843; 95% CI 0.719–0.989; p = 0.036) and of SNMe/NMe with LGB (odds ratio = 0.904; 95% CI 0.818–1.000; p = 0.049), showing that when the ratio of SNMe/NMe decreases, there is a minor risk of finding a thin biotype (Table 4).

4. Discussion

The aim of this study was to investigate the association between facial typology and gingival biotype in pre-orthodontic patients in order to guarantee a better diagnosis and planning of orthodontic treatment.
We tested whether the facial typology measured on two-dimensional cephalograms (SN^GoGn and CoGoMe^) or on three-dimensional facial scans (SNMe/NMe) could affect gingival biotype. No association was found between facial typology assessed using the two-dimensional angles SN^GoGn or CoGoMe^ and maxillary and mandibular gingival biotype of the anterior regions. There is one study that correlates craniofacial morphology using magnetic resonance imaging (MRI) with tooth root exposure and periodontal attachment loss. The study used the ratio of facial width and length (facial index) to describe craniofacial morphology and showed that patients with long narrow faces were associated with higher loss of attachment [37].
A recent study performed by Kaya et al. has investigated the relationship between gingival phenotype and craniofacial morphology in the sagittal and vertical directions. In contrast to this research, an endodontic file, namely, transgingival probing, was used to assess gingival phenotype (<1 mm and >1 mm, thin and thick phenotype, respectively). These results demonstrated that there is no association between gingival thickness and craniofacial typology [26].
In this study, facial typology was also evaluated with three-dimensional facial scans to assess the association between SNMe/NMe and gingival thickness. Our analysis showed that facial proportions have a statistically significant association with gingival biotype. In particular, when the ratio of SNMe/NMe is decreased, there is a minor risk of finding a thin gingival biotype either in the upper or lower anterior regions.
This is the first study that has evaluated gingival thickness through the periodontal probe’s translucency (thin and adequate biotype) with different vertical facial heights, and these findings support the hypothesis that there is no correlation between facial morphology and gingival thickness on lateral cephalograms [24]. Gingival thickness can be assessed by transgingival probing [38], ultrasonic measurement [39], or through the visibility of the probe [40,41]. Transgingival probing was not used because of the need for local anesthesia, which could induce a local volume increase and discomfort for patients [38]. Additionally, ultrasonic measurement was not preferred because of its repeatability with a coefficient of 1.20 mm [42]. Instead, the transparency of the probe through the gingival margin has been found to have a high reproducibility by De Rouck et al., showing 85% inter-examiner repeatability (k value = 0.7, p value = 0.002) [40]. Thus, this study used the periodontal probe visible through the gingiva after its placement in the facial sulcus of the anterior teeth [40].
The prevalence of malocclusion can vary between children and adolescents. However, the demand for orthodontic treatment is increasing [43,44,45], and greater attention has to be paid to periodontal aspects; indeed, orthodontic treatment can play an important role in periodontal changes [46]. The thickness of the gingiva is supposed to represent an indicator for reducing the risk of bone loss and gingival recession [47]. In fact, there are two studies which have indicated a statistically significant relationship between facial biotype and alveolar height and thickness with a greater risk of moving incisors beyond the anatomic limits of the alveolar bone by application of uncontrolled forces [6,48]. This uncontrolled movement can bring to: alveolar bone fenestrations, increasing susceptibility to gingival recession [49,50] and recession in the case of less than 2 mm of gingival thickness [7].
The current study presents several strengths. First, the periodontal assessments were performed in all of patients at the beginning of orthodontic treatment. This allows for an accurate diagnosis and treatment planning. In order to avoid bias due to differences in operator performance, only two trained clinicians performed the periodontal evaluations. Moreover, a new method to evaluate craniofacial morphology was introduced without exposure to the patients of further radiation. The study also has some limitations. Firstly, the sample size was relatively small to achieve a more reliable result. Secondly, only a few patients presented a thin UGB; however, this was in accordance with the normal prevalence of this biotype [26]. Further longitudinal studies are necessary to monitor the long-term effects of orthodontic treatment on gingival biotype in different facial typologies.

5. Conclusions

  • There is no association between facial typology (evaluated with SN^GoGn and CoGoMe) and gingival biotype.
  • When the ratio of SNMe/NMe is decreased, it represents a protective factor and a minor risk of finding a thin gingival biotype.

Author Contributions

Conceptualization, V.D., R.R. and R.V.; Methodology, A.P., R.R., V.S. and V.D.; Validation, A.P., G.S., G.T., and R.V.; Formal Analysis, A.P., G.T., R.R., and V.S.; Investigation, A.P., G.T. and R.R.; Resources, V.D. and R.V.; Data Curation, A.P., G.T., R.R. and V.S.; Writing–Original Draft Preparation, A.P., R.R. and V.D.; Writing–Review & Editing, G.T., V.S., G.S. and R.V.; Visualization, A.P., G.T., and R.R.; Supervision, G.S., V.D. and R.V.; Project Administration, A.P., V.D. and R.R.

Funding

This research received no external funding.

Conflicts of Interest

The authors declare no conflict of interest.

References

  1. Liu, P.; Liu, Y.; Wang, J.; Guo, Y.; Zhang, Y.; Xiao, S. Detection of fusobacterium nucleatum and fada adhesin gene in patients with orthodontic gingivitis and non-orthodontic periodontal inflammation. PLoS ONE 2014, 9, e85280. [Google Scholar] [CrossRef] [PubMed]
  2. Bollen, A.; Cunha-cruz, J.; Bakko, W.; Huang, G.J.; Hujoel, P.P. The Effects of Orthodontic Therapy on Periodontal Health: A Systematic Review of Controlled Evidence. J. Am. Dent. Assoc. 2008, 139, 413–422. [Google Scholar] [CrossRef] [PubMed]
  3. Tanner, A.C.R.; Sonis, A.L.; Lif Holgerson, P.; Starr, J.R.; Nunez, Y.; Kressirer, C.A.; Paster, B.J.; Johansson, I. White-spot lesions and gingivitis microbiotas in orthodontic patients. J. Dent. Res. 2012, 91, 853–858. [Google Scholar] [CrossRef] [PubMed]
  4. Renkema, A.M.; Navratilova, Z.; Mazurova, K.; Katsaros, C.; Fudalej, P.S. Gingival labial recessions and the post-treatment proclination of mandibular incisors. Eur. J. Orthod. 2015, 37, 508–513. [Google Scholar] [CrossRef]
  5. Renkema, A.M.; Fudalej, P.S.; Renkema, A.A.P.; Abbas, F.; Bronkhorst, E.; Katsaros, C. Gingival labial recessions in orthodontically treated and untreated individuals: A case-Control study. J. Clin. Periodontol. 2013, 40, 631–637. [Google Scholar] [CrossRef]
  6. Morris, J.W.; Campbell, P.M.; Tadlock, L.P.; Boley, J.; Buschang, P.H. Prevalence of gingival recession after orthodontic tooth movements. Am. J. Orthod. Dentofac. Orthop. 2017, 151, 851–859. [Google Scholar] [CrossRef]
  7. Kim, D.M.; Neiva, R. Periodontal Soft Tissue Non–Root Coverage Procedures: A Systematic Review From the AAP Regeneration Workshop. J. Periodontol. 2015, 86, S56–S72. [Google Scholar] [CrossRef]
  8. Joss-Vassalli, I.; Grebenstein, C.; Topouzelis, N.; Sculean, A.; Katsaros, C. Orthodontic therapy and gingival recession: A systematic review. Orthod. C. Res. 2010, 13, 127–141. [Google Scholar] [CrossRef]
  9. Kois, J.C. Predictable single-tooth peri-implant esthetics: Five diagnostic keys. Compend. Contin. Educ. Dent. 2004, 25, 895–896. [Google Scholar]
  10. Ahmad, I. Anterior dental aesthetics: Gingival perspective. Br. Dent. J. 2005, 199, 195–202. [Google Scholar] [CrossRef]
  11. Grover, V.; Bhardwaj, A.; Mohindra, K.; Malhotra, R. Analysis of the gingival biotype based on the measurement of the dentopapillary complex. J. Indian Soc. Periodontol. 2014, 18, 43. [Google Scholar] [CrossRef] [PubMed]
  12. Papapanou, P.N.; Sanz, M.; Buduneli, N.; Dietrich, T.; Feres, M.; Fine, D.H.; Flemmig, T.F.; Garcia, R.; Giannobile, W.V.; Graziani, F.; et al. Periodontitis: Consensus report of workgroup 2 of the 2017 World Workshop on the Classification of Periodontal and Peri-Implant Diseases and Conditions. J. Clin. Periodontol. 2018, 89, S173–S182. [Google Scholar] [CrossRef] [PubMed]
  13. Vandana, K.L.; Savitha, B. Thickness of gingiva in association with age, gender and dental arch location. J. Clin. Periodontol. 2005, 32, 828–830. [Google Scholar] [CrossRef] [PubMed]
  14. Seibert, J.; Lindhe, J. Aestetics and periodontal therapy. In Textbook of Clinical Periodontology, 2nd ed.; Munksgaard: Copenhagen, Denmark, 1989; pp. 477–514. [Google Scholar]
  15. Olsson, M.; Lindhe, J. Periodontal characteristics in individuals with varying form of the upper central incisors. J. Clin. Periodontol. 1991, 18, 78–82. [Google Scholar] [CrossRef]
  16. Fields, H.; Proffit, W.; Nixon, W.; Phillips, C.; Stanek, E. Facial pattern differences in long-faced children and adults. Am. J. Orthod. 1984, 85, 217–223. [Google Scholar] [CrossRef]
  17. Cangialosi, T.J. Additional criteria for sample division suggested. Am. J. Orthod. Dentofac. Orthop. 1989, 96, A24. [Google Scholar] [CrossRef]
  18. Opdebeeck, H.; Bell, W. The short face syndrome. Am. J. Orthod. 1978, 73, 499–511. [Google Scholar] [CrossRef]
  19. Schudy, F.F. The Rotation of The Mandible Resulting From Growth: Its Implications In Orthodontic Treatment. Angle Orthod. 1964, 34, 75–93. [Google Scholar]
  20. Matarese, G.; Isola, G.; Ramaglia, L.; Dalessandri, D.; Lucchese, A.; Alibrandi, A.; Fabiano, F.; Cordasco, G. Periodontal biotype: Characteristc, prevalence and dimension related to dental malocclusion. Minerva Stomatol. 2016, 65, 231–238. [Google Scholar]
  21. Al-Zo’ubia, I.A.; Hammadb, M.M.; Abu Alhaijac, E.S.J. Periodontal parameters in different dentofacial vertical patterns. Angle Orthod. 2008, 78, 1006–1014. [Google Scholar] [CrossRef]
  22. Hornera, K.A.; Behrents, R.G.; Beom Kim, K.; Buschangd, P.H. Cortical bone and ridge thickness of hyperdivergent and hypodivergent adults. Am. J. Orthod. Dentofac. Orthop. 2012, 142, 170–178. [Google Scholar] [CrossRef] [PubMed]
  23. Esfahanizadeh, N.; Daneshparvar, N.; Askarpour, F.; Akhoundi, N.; Panjnoush, M. Correlation Between Bone and Soft Tissue Thickness in Maxillary Anterior Teeth. J. Dent. (Tehran) 2016, 13, 302–308. [Google Scholar]
  24. Sadek, M.M.; Sabet, N.E.; Hassan, I.T. Alveolar bone mapping in subjects with different vertical facial dimensions. Eur. J. Orthod. 2014, 37, 194–201. [Google Scholar] [CrossRef] [PubMed]
  25. Björk, A. Prediction of mandibular growth rotation. Am. J. Orthod. 1969, 55, 585–599. [Google Scholar] [CrossRef]
  26. Kaya, Y.; Alkan, Ö.; Alkan, E.A.; Keskin, S. Gingival thicknesses of maxillary and mandibular anterior regions in subjects with different craniofacial morphologies. Am. J. Orthod. Dentofac. Orthop. 2018, 154, 356–364. [Google Scholar] [CrossRef] [PubMed]
  27. Baik, H.S.; Kim, S.Y. Facial soft-tissue changes in skeletal Class III orthognathic surgery patients analyzed with 3-dimensional laser scanning. Am. J. Orthod. Dentofac. Orthop. 2010, 138, 167–178. [Google Scholar] [CrossRef] [PubMed]
  28. Kau, C.H.; Richmond, S.; Incrapera, A.; English, J.; Xia, J.J. Three-dimensional surface acquisition systems for the study of facial morphology and their application to maxillofacial surgery. Int. J. Med. Robot. Comput. Assist. Surg. 2007, 3, 97–110. [Google Scholar] [CrossRef]
  29. Staderini, E.; Patini, R.; De Luca, M.; Gallenzi, P. Three-dimensional stereophotogrammetric analysis of nasolabial soft tissue effects of rapid maxillary expansion: A systematic review of clinical trials. Acta Otorhinolaryngol. Ital. 2018, 38, 399–408. [Google Scholar]
  30. Antoun, J.S.; Lawrence, C.; Leow, A.; Rongo, R.; Dias, G.; Farella, M. A three-dimensional evaluation of Māori and New Zealand European faces. Aust. Orthod. J. 2014, 30, 169. [Google Scholar]
  31. Aynechi, N.; Larson, B.E.; Leon-Salazar, V.; Beiraghi, S. Accuracy and precision of a 3D anthropometric facial analysis with and without landmark labeling before image acquisition. Angle Orthod. 2011, 81, 245–252. [Google Scholar] [CrossRef]
  32. Plooij, J.M.; Swennen, G.R.J.; Rangel, F.A.; Maal, T.J.J.; Schutyser, F.A.C.; Bronkhorst, E.M.; Kuijpers-Jagtman, A.M.; Bergé, S.J. Evaluation of reproducibility and reliability of 3D soft tissue analysis using 3D stereophotogrammetry. Int. J. Oral Maxillofac. Surg. 2009, 38, 267–273. [Google Scholar] [CrossRef] [PubMed]
  33. Toma, A.M.; Zhurov, A.; Playle, R.; Ong, E.; Richmond, S. Reproducibility of facial soft tissue landmarks on 3D laser-scanned facial images. Orthod. Craniofac. Res. 2009, 12, 33–42. [Google Scholar] [CrossRef] [PubMed]
  34. Rongo, R.; Antoun, J.S.; Lim, Y.X.; Dias, G.; Valletta, R.; Farella, M. Three-dimensional evaluation of the relationship between jaw divergence and facial soft tissue dimensions. Angle Orthod. 2014, 84, 788–794. [Google Scholar] [CrossRef] [PubMed]
  35. Young, N.M.; Sherathiya, K.; Gutierrez, L.; Nguyen, E.; Bekmezian, S.; Huang, J.C.; Hallgrimsson, B.; Lee, J.S.; Marcucio, R.S. Facial surface morphology predicts variation in internal skeletal shape. Am. J. Orthod. Dentofac. Orthop. 2016, 149, 501–508. [Google Scholar] [CrossRef]
  36. Kan, J.Y.K.; Rungcharassaeng, K.; Umezu, K.; Kois, J.C. Dimensions of Peri-Implant Mucosa: An Evaluation of Maxillary Anterior Single Implants in Humans. J. Periodontol. 2003, 74, 557–562. [Google Scholar] [CrossRef]
  37. Salti, L.; Holtfreter, B.; Pink, C.; Habes, M.; Biffar, R.; Kiliaridis, S.; Krey, K.F.; Bülow, R.; Völzke, H.; Kocher, T.; et al. Estimating effects of craniofacial morphology on gingival recession and clinical attachment loss. J. Clin. Periodontol. 2017, 44, 363–371. [Google Scholar] [CrossRef]
  38. Ronay, V.; Sahrmann, P.; Bindl, A.; Attin, T.; Schmidlin, P.R. Current status and perspectives of mucogingival soft tissue measurement methods. J. Esthet. Restor. Dent. 2011, 23, 146–156. [Google Scholar] [CrossRef]
  39. Eger, T.; Muller, H.-P.; Heinecke, A. Ultrasonic determination of gingival thickness subject variation and influence of tooth type and clinical features. J. Clin. Periodontol. 1996, 23, 839–845. [Google Scholar] [CrossRef]
  40. De Rouck, T.; Eghbali, R.; Collys, K.; De Bruyn, H.; Cosyn, J. The gingival biotype revisited: Transparency of the periodontal probe through the gingival margin as a method to discriminate thin from thick gingiva. J. Clin. Periodontol. 2009, 36, 428–433. [Google Scholar] [CrossRef]
  41. Cortellini, P.; Bissada, N.F. Mucogingival conditions in the natural dentition: Narrative review, case definitions, and diagnostic considerations. J. Clin. Periodontol. 2018, 45, S190–S198. [Google Scholar] [CrossRef] [Green Version]
  42. Müller, H.P.; Könönen, E. Variance components of gingival thickness. J. Periodontal Res. 2005, 40, 239–244. [Google Scholar] [CrossRef] [PubMed]
  43. Paduano, S.; Rongo, R.; Bucci, R.; Aiello, D.; Carvelli, G.; Ingenito, A.; Cantile, T.; Ferrazzano, G.F. Is there an association between various aspects of oral health in Southern Italy children? An epidemiological study assessing dental decays, periodontal status, malocclusions and temporomandibular joint function. Eur. J. Paediatr. Dent. 2018, 19, 176–180. [Google Scholar] [PubMed]
  44. Asiri, S.N.; Tadlock, L.P.; Buschang, P.H. The prevalence of clinically meaningful malocclusion among US adults. Orthod. Craniofac. Res. 2019, 22, 321–328. [Google Scholar] [CrossRef]
  45. Jawad, Z.; Bates, C.; Hodge, T. Who needs orthodontic treatment? Who gets it? And who wants it? Br. Dent. J. 2015, 218, 99–103. [Google Scholar] [CrossRef]
  46. Alfuriji, S.; Alhazmi, N.; Alhamlan, N.; Al-Ehaideb, A.; Alruwaithi, M.; Alkatheeri, N.; Geevarghese, A. The effect of orthodontic therapy on periodontal health: A review of the literature. Int. J. Dent. 2014, 2014, 585048. [Google Scholar] [CrossRef]
  47. Maynard, J.G. The rationale for mucogingival therapy in the child and adolescent. Int. J. Periodontics Restor. Dent. 1987, 7, 36–51. [Google Scholar]
  48. Renkema, A.M.; Fudalej, P.S.; Renkema, A.; Kiekens, R.; Katsaros, C. Development of labial gingival recessions in orthodontically treated patients. Am. J. Orthod. Dentofac. Orthop. 2013, 143, 206–212. [Google Scholar] [CrossRef]
  49. Holmesa, H.D.; Tennantb, M.; Goonewardenec, M.S. Augmentation of faciolingual gingival dimensions with free connective tissue grafts before labial orthodontic tooth movement: An experimental study with a canine model. Am. J. Orthod. Dentofac. Orthop. 2005, 127, 562–572. [Google Scholar] [CrossRef]
  50. Wennström, J.L.; Lindhe, J.; Sinclair, F.; Thilander, B. Some periodontal tissue reactions to orthodontic tooth movement in monkeys. J. Clin. Periodontol. 1987, 14, 121–129. [Google Scholar] [CrossRef]
Figure 1. Thin biotype with North Carolina probe.
Applsci 09 05057 g001
Figure 2. Thick biotype with North Carolina probe.
Applsci 09 05057 g002
Figure 3. (ac) Points, planes, and angles for the assessment of facial typology with cephalometry and facial scanner. (a) ‘Sellion’ (S, the center of the sella turcica), ‘Nasion’ (N, the external point of the junction between the nasal and frontal bones), ‘Gonion’ (Go, the most inferior posterior point of the mandibular angle), ‘Gnathion’ (Gn, the point of the mandibular symphysis on the facial axis) ‘Menton’ (Me, the most inferior point of the mandibular symphysis), ‘Condylion’ (Co, the highest and most posterior point on the contour of the mandibular condyle); (b) SN plane, GoGn plane, and CoGoMe angle; (c) N (‘Soft Tissue Nasion’, the midpoint on the soft tissue contour of the base of the nasal root at the level of the frontonasal suture), SN (‘SubNasion’, the midpoint on the nasolabial soft tissue contour between the columella crest and the upper lip), and Me (‘Soft Tissue Menton’, the most inferior midpoint on the soft tissue contour of the chin). NMe indicates total facial height and SNMe indicates inferior facial height.
Applsci 09 05057 g003aApplsci 09 05057 g003b
Table 1. Characteristics of study subjects according to age, gender, gingival biotype, and facial typology.
VariablesNMedian (IQR)
Age12117.04 (13.7–22.1)
FrequencyPercentage (%)
Gender
 Male4335.54
 Female7863.64
Upper Gingival Biotype
 Thick10586.78
 Thin1613.22
Lower Gingival Biotype
 Thick6352.07
 Thin5847.93
Facial Typology SN^GoGn
 Brachyfacial3327.27
 Mesofacial5948.76
 Dolichofacial2923.97
Data are presented as median and interquartile range (IQR) or frequencies and percentages.
Table 2. Descriptive variables of the sample size.
VariablesMean ± SDP50P25P75
SN^Go-Gn32.7° ± 8°32.7°28.1°36.3°
CoGoMe^123.2° ± 6.6°122.8°118.7°127.4°
SNMe/SMe0.514 ± 0.0420.510.4970.530
Data are presented as mean ± SD and IQR. SN^GoGn (mean ± SD = 33° ± 2.5°) is the angle between the anterior cranial base (Sella-Nasion) and the mandibular plane (Gonion-Gnathion). CoGoMe^ (average value ± SD = 132° ± 6.0°) is the angle between the condylar axis (Condylion-Gonion) and the mandibular base (Gonion-Menton). SNMe/NMe is the ratio between SNMe (inferior facial height) and NMe (total facial height).
Table 3. Classification of gingival biotype in patients with different facial typologies (classified according to SN^GoGn) using a 15 mm North Carolina probe.
Facial Typology (N)Upper Gingival Biotype
ThickThin p value
Brachyfacial (33)29 (27.62%)4 (25.00%) 0.83
Mesofacial (59)50 (47.62%)9 (56.25%)
Dolichofacial (29)26 (24.76%)3 (18.75%)
Total (121)105 (100%)16 (100%)
Lower Gingival Biotype
ThickThin p value
Brachyfacial (33)16 (25.40%)17 (29.31%) 0.75
Mesofacial (59)33 (52.38%)26 (44.83%)
Dolichofacial (29)14 (22.22%)15 (25.86%)
Total (121)63 (100%)58 (100%)
Gingival Biotype
Thick/ThickThick/ThinThin/Thinp value
Brachyfacial (33)16 (25.40%)13 (30.95%)4 (25%)0.77
Mesofacial (59)33 (52.38%)17 (40.48%)9 (56.25%)
Dolichofacial (29)14 (22.22%)12 (28.57%)3 (18.75%)
Total (121)63 (100%)42 (100%)16 (100%)
Data are presented as numbers, percentages, and p values.
Table 4. Logistic regression model for SNMe/NMe ratio × 100 with and without including age as a coviariate.
ModelVariablep ValueOdds Ratio (OR)95% IC
Upper biotype (SNMe/NMe)SNMe/NMe0.036 *0.8430.719–0.989
Lower biotype (SNMe/NMe)SNMe/NMe0.049 *0.9040.818–0.999
Upper biotype (SNMe/NMe × Age)SNMe/NMe0.034 *0.8390.714–0.987
Age0.6200.9850.927–1.046
Lower biotype (SNMe/NMe × Age)SNMe/NMe0.048 *0.9030.815–0.999
Age0.2070.9760.939–1.014
Data are presented as OR and IQR. * and bold text indicate statistically significant values (p < 0.05).

