
Body Composition According to Spinal Cord Injury Level: A Systematic Review and Meta-Analysis

 , ,
, ,  , ,
, , 
Abstract
:
1. Introduction
2. Materials and Methods
2.1. Data Sources and Search Strategy
2.2. Study Selection and Eligibility Criteria
2.3. Data Extraction
2.4. Risk of Bias Assessment
2.5. Data Synthesis and Analysis
3. Results
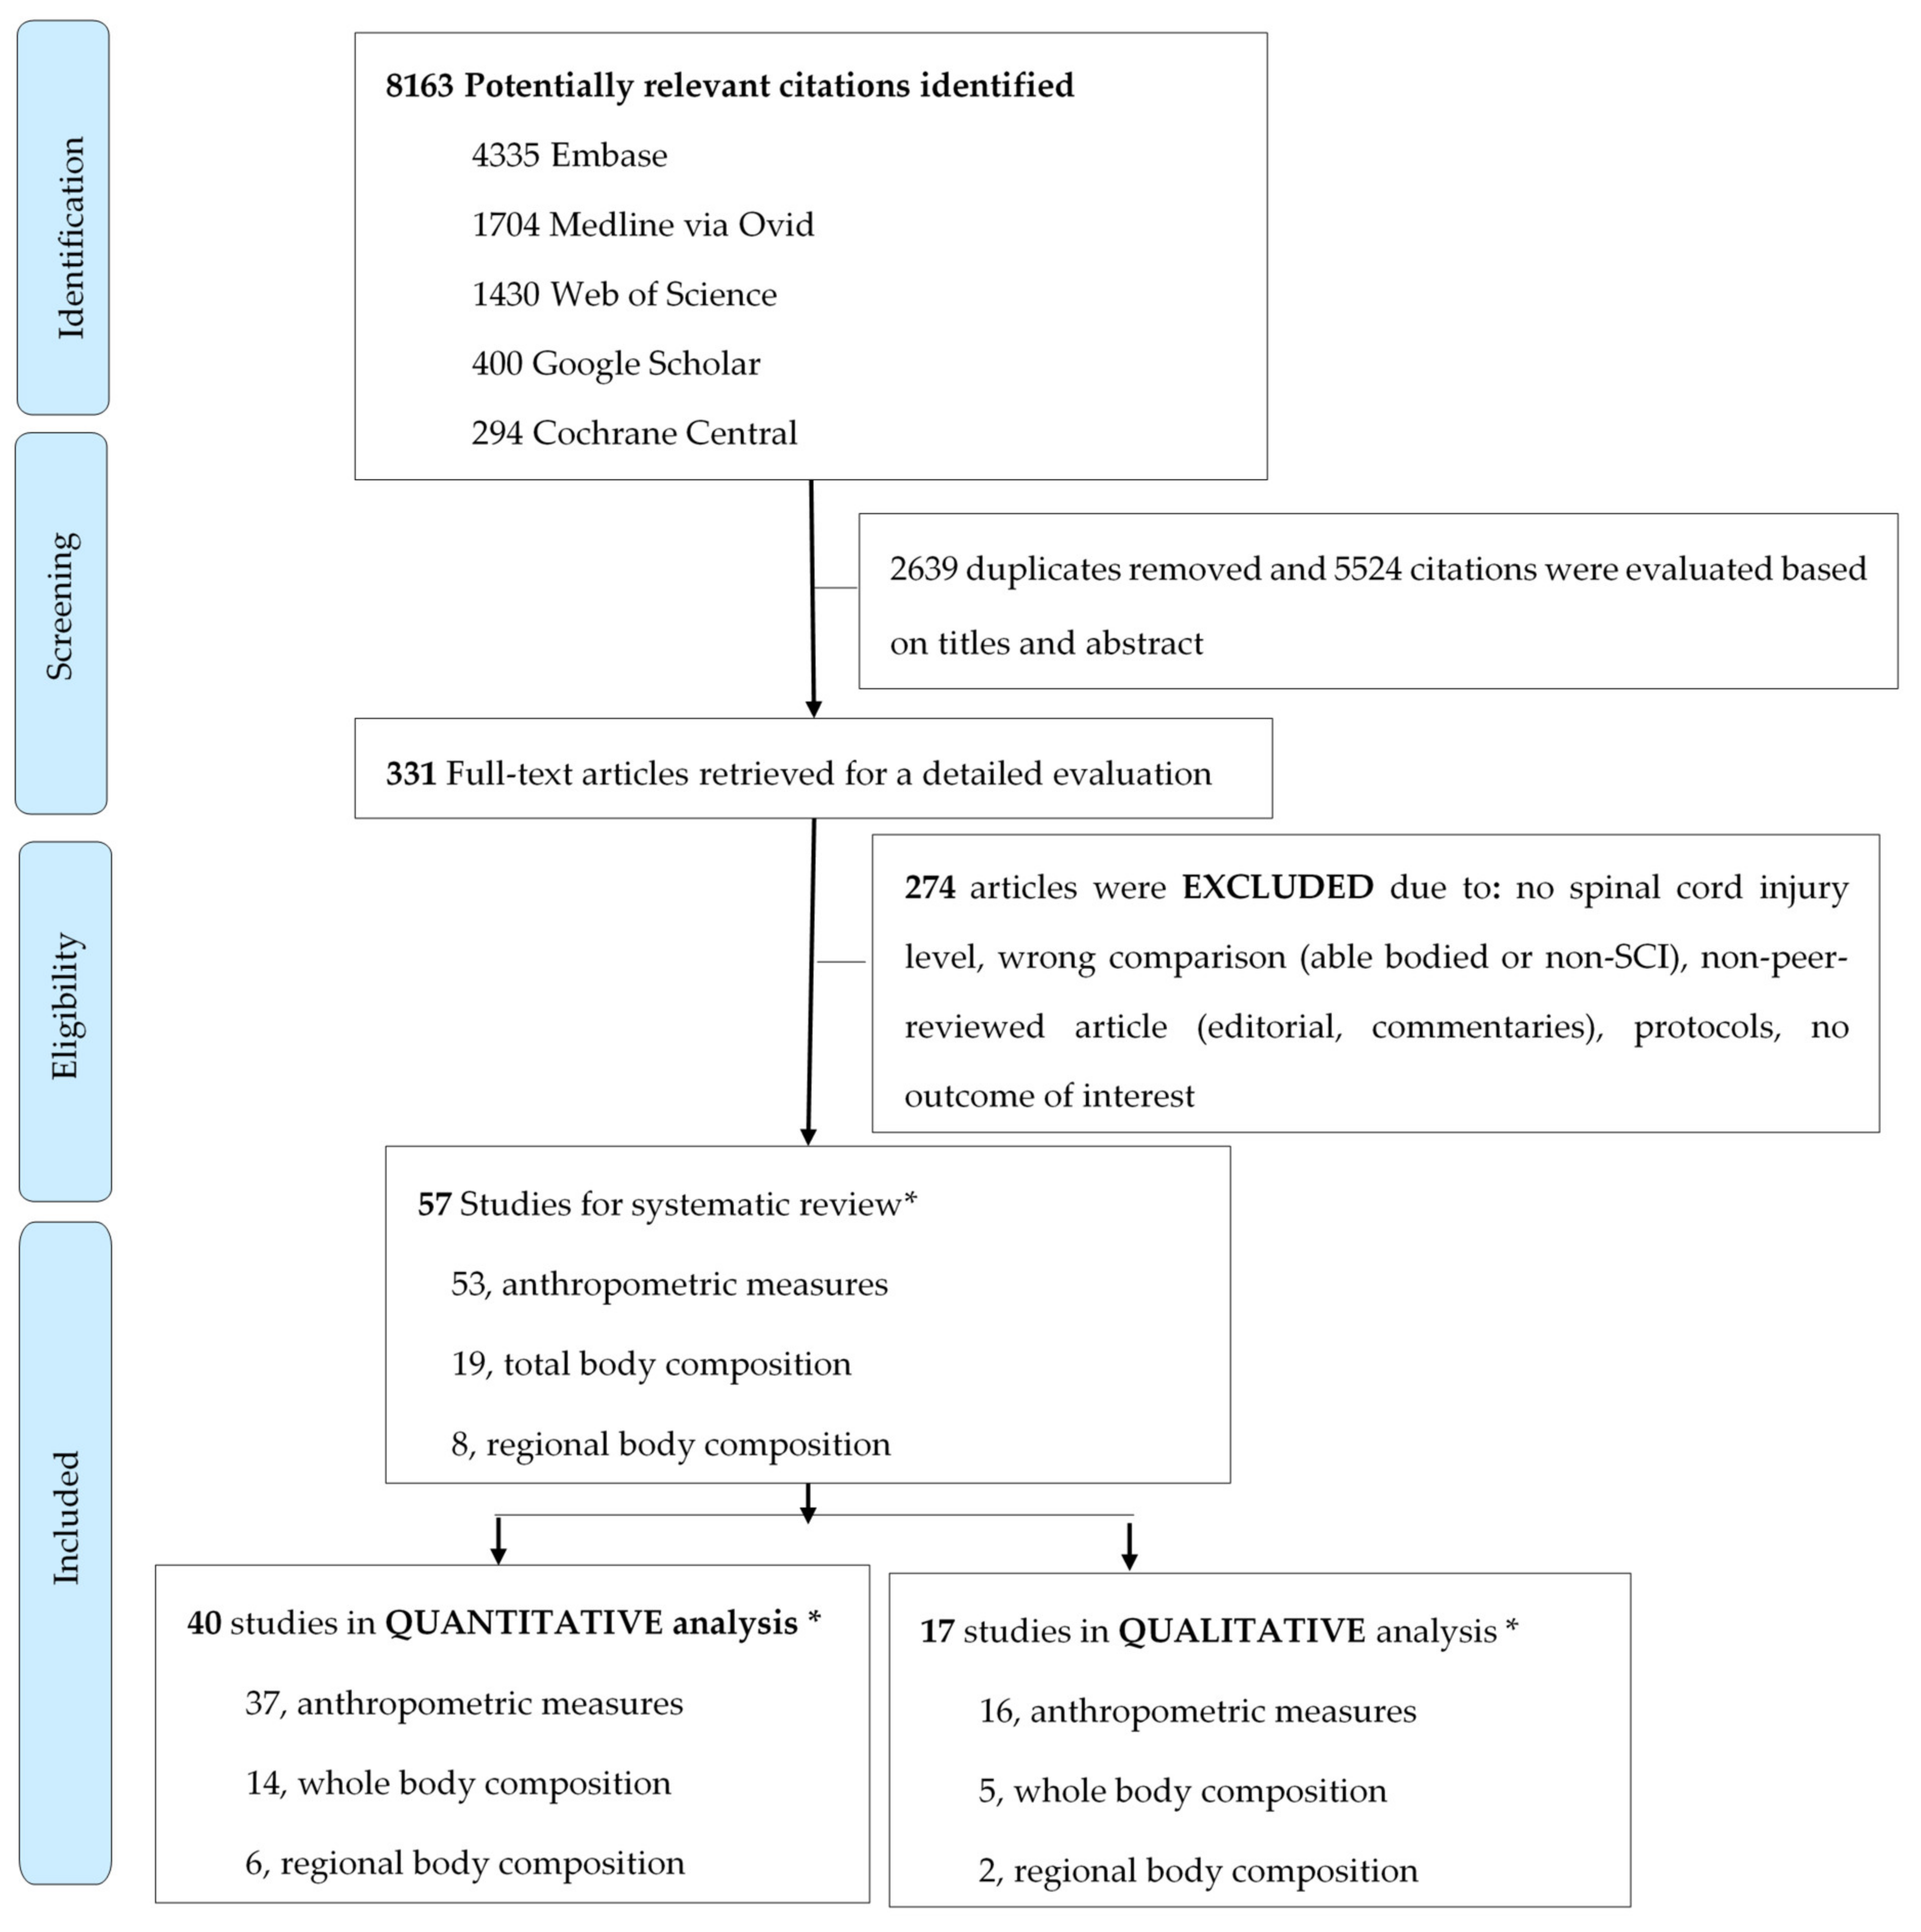
3.1. Search Results
3.2. Anthropometric Measures
3.3. Total Body Composition
3.4. Regional Body Composition
3.5. Heterogeneity and Subgroup Analyses
3.6. Meta-Regression
3.7. Leave-One-Out Analysis and Publication Bias
4. Discussion
4.1. Factors Underlying Differences in Body Composition According to Injury Level
4.2. Clinical and Scientific Implication of Our Findings
4.3. Strengths and Weaknesses
4.4. Knowledge Gaps and Future Research
5. Conclusions
Supplementary Materials
Author Contributions
Funding
Institutional Review Board Statement
Informed Consent Statement
Data Availability Statement
Acknowledgments
Conflicts of Interest
References
- Gorgey, A.S.; Mather, K.J.; Gater, D.R. Central adiposity associations to carbohydrate and lipid metabolism in individuals with complete motor spinal cord injury. Metabolism 2011, 60, 843–851. [Google Scholar] [CrossRef] [PubMed]
- Hughes-Austin, J.M.; Larsen, B.A.; Allison, M.A. Visceral adipose tissue and cardiovascular disease risk. Curr. Cardiovasc. Risk Rep. 2013, 7, 95–101. [Google Scholar] [CrossRef]
- Sarma, S.; Sockalingam, S.; Dash, S. Obesity as a multisystem disease: Trends in obesity rates and obesity-related complications. Diabetes Obes. Metab. 2021, 23, 3–16. [Google Scholar] [CrossRef]
- Gupta, N.; White, K.T.; Sandford, P.R. Body mass index in spinal cord injury—A retrospective study. Spinal Cord 2006, 44, 92–94. [Google Scholar] [CrossRef]
- Gorgey, A.S.; Dudley, G.A. Skeletal muscle atrophy and increased intramuscular fat after incomplete spinal cord injury. Spinal Cord 2007, 45, 304–309. [Google Scholar] [CrossRef] [PubMed]
- Buchholz, A.C.; Pencharz, P.B. Energy expenditure in chronic spinal cord injury. Curr. Opin. Clin. Nutr. Metab. Care 2004, 7, 635–639. [Google Scholar] [CrossRef] [PubMed]
- Gordon, P.S.; Farkas, G.J.; Gater, D.R., Jr. Neurogenic obesity-induced insulin resistance and type 2 diabetes mellitus in chronic spinal cord injury. Top. Spinal Cord Inj. Rehabil. 2021, 27, 36–56. [Google Scholar] [CrossRef]
- Maki, K.C.; Briones, E.R.; Langbein, W.E.; Inman-Felton, A.; Nemchausky, B.; Welch, M.; Burton, J. Associations between serum lipids and indicators of adiposity in men with spinal cord injury. Spinal Cord 1995, 33, 102–109. [Google Scholar] [CrossRef] [Green Version]
- Farkas, G.J.; Pitot, M.A.; Berg, A.S.; Gater, D.R. Nutritional status in chronic spinal cord injury: A systematic review and meta-analysis. Spinal Cord 2019, 57, 3–17. [Google Scholar] [CrossRef]
- Farkas, G.J.; Gorgey, A.S.; Dolbow, D.R.; Berg, A.S.; Gater, D.R. Caloric intake relative to total daily energy expenditure using a spinal cord injury-specific correction factor: An analysis by level of injury. Am. J. Phys. Med. Rehabil. 2019, 98, 947–952. [Google Scholar] [CrossRef]
- Farkas, G.J.; Gater, D.R. Neurogenic obesity and systemic inflammation following spinal cord injury: A review. J. Spinal Cord Med. 2018, 41, 378–387. [Google Scholar] [CrossRef]
- Sabour, H.; Javidan, A.N.; Vafa, M.R.; Shidfar, F.; Nazari, M.; Saberi, H.; Rahimi, A.; Razavi, H.E. Obesity predictors in people with chronic spinal cord injury: An analysis by injury related variables. J. Res. Med. Sci. 2011, 16, 335–339. [Google Scholar] [PubMed]
- Gorgey, A.S.; Gater, D.R. Regional and relative adiposity patterns in relation to carbohydrate and lipid metabolism in men with spinal cord injury. Appl. Physiol. Nutr. Metab. 2011, 36, 107–114. [Google Scholar] [CrossRef]
- Li, J.; Hunter, G.R.; Chen, Y.; McLain, A.; Smith, D.L.; Yarar-Fisher, C. Differences in glucose metabolism among women with spinal cord injury may not be fully explained by variations in body composition. Arch. Phys. Med. Rehabil. 2019, 100, 1061–1067. [Google Scholar] [CrossRef] [PubMed]
- Pelletier, C.A.; Miyatani, M.; Giangregorio, L.; Craven, B.C. Sarcopenic obesity in adults with spinal cord injury: A cross-sectional study. Arch. Phys. Med. Rehabil. 2016, 97, 1931–1937. [Google Scholar] [CrossRef] [PubMed]
- Spungen, A.M.; Adkins, R.H.; Stewart, C.A.; Wang, J.; Pierson, R.N., Jr.; Waters, R.L.; Bauman, W.A. Factors influencing body composition in persons with spinal cord injury: A cross-sectional study. J. Appl. Physiol. 2003, 95, 2398–2407. [Google Scholar] [CrossRef] [PubMed]
- Bernardi, M.; Fedullo, A.L.; Di Giacinto, B.; Squeo, M.R.; Aiello, P.; Dante, D.; Romano, S.; Magaudda, L.; Peluso, I.; Palmery, M.; et al. Cardiovascular risk factors and haematological indexes of inflammation in paralympic athletes with different motor impairments. Oxidative Med. Cell. Longev. 2019, 2019, 6798140. [Google Scholar] [CrossRef] [Green Version]
- Dionyssiotis, Y.; Lyritis, G.P.; Papaioannou, N.; Papagelopoulos, P.; Thomaides, T. Influence of neurological level of injury in bones, muscles, and fat in paraplegia. J. Rehabil. Res. Dev. 2009, 46, 1037–1044. [Google Scholar] [CrossRef]
- Buchholz, A.C.; Bugaresti, J.M. A review of body mass index and waist circumference as markers of obesity and coronary heart disease risk in persons with chronic spinal cord injury. Spinal Cord 2005, 43, 513–518. [Google Scholar] [CrossRef]
- Silveira, S.L.; Ledoux, T.A.; Robinson-Whelen, S.; Stough, R.; Nosek, M.A. Methods for classifying obesity in spinal cord injury: A review. Spinal Cord 2017, 55, 812–817. [Google Scholar] [CrossRef]
- Gorgey, A.S.; Gater, D.R., Jr. Prevalence of obesity after spinal cord injury. Top. Spinal Cord Inj. Rehabil. 2007, 12, 1–7. [Google Scholar] [CrossRef] [PubMed] [Green Version]
- Muka, T.; Glisic, M.; Milic, J.; Verhoog, S.; Bohlius, J.; Bramer, W.; Chowdhury, R.; Franco, O.H. A 24-step guide on how to design, conduct, and successfully publish a systematic review and meta-analysis in medical research. Eur. J. Epidemiol. 2020, 35, 49–60. [Google Scholar] [CrossRef]
- Moher, D.; Liberati, A.; Tetzlaff, J.; Altman, D.G. Preferred reporting items for systematic reviews and meta-analyses: The PRISMA Statement. PLoS Med. 2009, 6, e1000097. [Google Scholar] [CrossRef] [Green Version]
- Wan, X.; Wang, W.; Liu, J.; Tong, T. Estimating the sample mean and standard deviation from the sample size, median, range and/or interquartile range. BMC Med. Res. Methodol. 2014, 14, 135. [Google Scholar] [CrossRef] [Green Version]
- Dijkers, M. Duplicate publications and systematic reviews: Problems and proposals. KT Update 2018, 6, 1–12. [Google Scholar]
- Wells, G.; Shea, B.; O’Connell, D.; Peterson, J.; Welch, V.; Losos, M.; Tugwell, P. The Newcastle-Ottawa Scale (NOS) for Assessing the Quality of Nonrandomised Studies in Meta-Analyses. Available online: http://www.ohri.ca/programs/clinical_epidemiology/oxford.asp (accessed on 27 February 2021).
- DerSimonian, R.; Laird, N. Meta-analysis in clinical trials. Control. Clin. Trials 1986, 7, 177–188. [Google Scholar] [CrossRef]
- Higgins, J.P.; Thomas, J.; Chandler, J.; Cumpston, M.; Li, T.; Page, M.J.; Welch, V.A. Cochrane Handbook for Systematic Reviews of Interventions; John Wiley & Sons: Chichester, UK, 2019. [Google Scholar]
- Thompson, S.G.; Smith, T.C.; Sharp, S.J. Investigating underlying risk as a source of heterogeneity in meta-analysis. Stat. Med. 1997, 16, 2741–2758. [Google Scholar] [CrossRef]
- Harris, R.; Bradburn, M.; Deeks, J.; Harbord, R.; Altman, D.; Sterne, J. Metan: Fixed- and random-effects meta-analysis. Stata J. 2008, 8, 3–28. [Google Scholar] [CrossRef] [Green Version]
- Akbal, A.; Kurtaran, A.; Selcuk, B.; Akyuz, M. H-FABP, cardiovascular risk factors, and functional status in asymptomatic spinal cord injury patients. Herz 2013, 38, 629–635. [Google Scholar] [CrossRef]
- Azevedo, E.R.; Alonso, K.; Cliquet, A. Body composition assessment by bioelectrical impedance analysis and body mass index in individuals with chronic spinal cord injury. J. Electr. Bioimpediance 2016, 7, 2–5. [Google Scholar] [CrossRef]
- Bauman, W.A.; Adkins, R.H.; Spungen, A.M.; Waters, R.L. The effect of residual neurological deficit on oral glucose tolerance in persons with chronic spinal cord injury. Spinal Cord 1999, 37, 765–771. [Google Scholar] [CrossRef] [Green Version]
- Bauman, W.A.; Spungen, A.M.; Zhong, Y.G.; Rothstein, J.L.; Petry, C.; Gordon, S.K. Depressed serum high density lipoprotein cholesterol levels in veterans with spinal cord injury. Paraplegia 1992, 30, 697–703. [Google Scholar] [CrossRef] [PubMed] [Green Version]
- Buchholz, A.C.; Martin Ginis, K.A.; Bray, S.R.; Craven, B.C.; Hicks, A.L.; Hayes, K.C.; Latimer, A.E.; McColl, M.A.; Potter, P.J.; Wolfe, D.L. Greater daily leisure time physical activity is associated with lower chronic disease risk in adults with spinal cord injury. Appl. Physiol. Nutr. Metab. 2009, 34, 640–647. [Google Scholar] [CrossRef] [PubMed]
- Chun, S.M.; Kim, H.R.; Shin, H.I. Estimating the Basal metabolic rate from fat free mass in individuals with motor complete spinal cord injury. Spinal Cord 2017, 55, 844–847. [Google Scholar] [CrossRef] [PubMed] [Green Version]
- De Groot, S.; Dallmeijer, A.J.; Post, M.W.; Angenot, E.L.; van der Woude, L.H. The longitudinal relationship between lipid profile and physical capacity in persons with a recent spinal cord injury. Spinal Cord 2008, 46, 344–351. [Google Scholar] [CrossRef] [PubMed] [Green Version]
- Dionyssiotis, Y.; Petropoulou, K.; Rapidi, C.A.; Papagelopoulos, P.; Papaioannou, N.; Galanos, A.; Papadaki, P.; Lyritis, G.P. Body composition in paraplegic men. J. Clin. Densitom. 2008, 11, 437–443. [Google Scholar] [CrossRef] [PubMed]
- Flueck, J.L. Body composition in swiss elite wheelchair athletes. Front. Nutr. 2020, 7, 1. [Google Scholar] [CrossRef] [PubMed]
- Farkas, G.J.; Gorgey, A.S.; Dolbow, D.R.; Berg, A.S.; Gater, D.R. The influence of level of spinal cord injury on adipose tissue and its relationship to inflammatory adipokines and cardiometabolic profiles. J. Spinal Cord Med. 2018, 41, 407–415. [Google Scholar] [CrossRef]
- Gater, D.R., Jr.; Farkas, G.J.; Dolbow, D.R.; Berg, A.; Gorgey, A.S. Body composition and metabolic assessment after motor complete spinal cord injury: Development of a clinically relevant equation to estimate body fat. Top. Spinal Cord Inj. Rehabil. 2021, 27, 11–22. [Google Scholar] [CrossRef] [PubMed]
- Gorgey, A.S.; Gater, D.R. A preliminary report on the effects of the level of spinal cord injury on the association between central adiposity and metabolic profile. PM&R 2011, 3, 440–446. [Google Scholar] [CrossRef]
- Han, S.H.; Lee, B.S.; Choi, H.S.; Kang, M.S.; Kim, B.R.; Han, Z.A.; Lee, H.J. Comparison of fat mass percentage and body mass index in Koreans with spinal cord injury according to the severity and duration of motor paralysis. Ann. Rehabil. Med. 2015, 39, 384–392. [Google Scholar] [CrossRef] [PubMed] [Green Version]
- Inukai, Y.; Takahashi, K.; Wang, D.H.; Kira, S. Assessment of total and segmental body composition in spinal cord-injured athletes in Okayama prefecture of Japan. Acta Med. Okayama 2006, 60, 99–106. [Google Scholar] [CrossRef]
- Janssen, T.W.; van Oers, C.A.; van Kamp, G.J.; TenVoorde, B.J.; van der Woude, L.H.; Hollander, A.P. Coronary heart disease risk indicators, aerobic power, and physical activity in men with spinal cord injuries. Arch. Phys. Med. Rehabil. 1997, 78, 697–705. [Google Scholar] [CrossRef] [Green Version]
- Katzelnick, C.G.; Weir, J.P.; Chiaravalloti, N.D.; Wylie, G.R.; Dyson-Hudson, T.A.; Bauman, W.A.; Wecht, J.M. Impact of blood pressure, lesion level, and physical activity on aortic augmentation index in persons with spinal cord injury. J. Neurotrauma 2017, 34, 3407–3415. [Google Scholar] [CrossRef] [PubMed]
- Katzelnick, C.G.; Weir, J.P.; Jones, A.; Galea, M.; Dyson-Hudson, T.A.; Kirshblum, S.C.; Wecht, J.M. Blood pressure instability in persons with SCI: Evidence from a 30-day home monitoring observation. Am. J. Hypertens. 2019, 32, 938–944. [Google Scholar] [CrossRef]
- Kemp, B.J.; Spungen, A.M.; Adkins, R.H.; Krause, J.S.; Bauman, W.A. The relationships among serum lipid levels, adiposity, and depressive symptomatology in persons aging with spinal cord injury. J. Spinal Cord Med. 2000, 23, 216–220. [Google Scholar] [CrossRef]
- Kim, J.H.; Trilk, J.L.; Smith, R.; Asif, I.; Maddux, P.T.; Ko, Y.A.; Emery, M.S. Cardiac structure and function in elite para-cyclists with spinal cord injury. Med. Sci. Sports Exerc. 2016, 48, 1431–1437. [Google Scholar] [CrossRef]
- Lee, Y.H.; Lee, J.H.; Kim, S.H.; Yi, D.; Oh, K.J.; Kim, J.H.; Park, T.J.; Kim, H.; Chang, J.S.; Kong, I.D. Hemodynamic adaptations to regular exercise in people with spinal cord injury. Ann. Rehabil. Med. 2017, 41, 25–33. [Google Scholar] [CrossRef] [Green Version]
- Matos-Souza, J.R.; Pithon, K.R.; Ozahata, T.M.; Oliveira, R.T.; Teo, F.H.; Blotta, M.H.; Cliquet, A., Jr.; Nadruz, W., Jr. Subclinical atherosclerosis is related to injury level but not to inflammatory parameters in spinal cord injury subjects. Spinal Cord 2010, 48, 740–744. [Google Scholar] [CrossRef]
- McCauley, L.S.; Sumrell, R.M.; Gorgey, A.S. Anthropometric prediction of visceral adipose tissue in persons with motor complete spinal cord injury. PM&R 2018, 10, 817–825. [Google Scholar] [CrossRef]
- Miyatani, M.; Szeto, M.; Moore, C.; Oh, P.I.; McGillivray, C.F.; Catharine Craven, B. Exploring the associations between arterial stiffness and spinal cord impairment: A cross-sectional study. J. Spinal Cord Med. 2014, 37, 556–564. [Google Scholar] [CrossRef] [Green Version]
- O’Brien, L.C.; Chen, Q.; Savas, J.; Lesnefsky, E.J.; Gorgey, A.S. Skeletal muscle mitochondrial mass is linked to lipid and metabolic profile in individuals with spinal cord injury. Eur. J. Appl. Physiol. 2017, 117, 2137–2147. [Google Scholar] [CrossRef]
- Powell, D.; Affuso, O.; Chen, Y. Weight change after spinal cord injury. J. Spinal Cord Med. 2017, 40, 130–137. [Google Scholar] [CrossRef] [Green Version]
- Rankin, K.C.; O’Brien, L.C.; Segal, L.; Khan, M.R.; Gorgey, A.S. Liver adiposity and metabolic profile in individuals with chronic spinal cord injury. Biomed. Res. Int. 2017, 2017, 1364818. [Google Scholar] [CrossRef] [PubMed]
- Raymond, J.; Harmer, A.R.; Temesi, J.; van Kemenade, C. Glucose tolerance and physical activity level in people with spinal cord injury. Spinal Cord 2010, 48, 591–596. [Google Scholar] [CrossRef] [Green Version]
- Ribeiro Neto, F.; Lopes, G.H.R. Analysis of body composition values in men with different spinal cord injury levels. Fisioter. Em Mov. 2013, 26, 745–751. [Google Scholar]
- Sabour, H.; Javidan, A.N.; Ranjbarnovin, N.; Vafa, M.R.; Khazaeipour, Z.; Ghaderi, F.; Mehrabani, F.K.; Shidfar, F. Cardiometabolic risk factors in Iranians with spinal cord injury: Analysis by injury-related variables. J. Rehabil. Res. Dev. 2013, 50, 635–642. [Google Scholar] [CrossRef]
- Sumrell, R.M.; Nightingale, T.E.; McCauley, L.S.; Gorgey, A.S. Anthropometric cutoffs and associations with visceral adiposity and metabolic biomarkers after spinal cord injury. PLoS ONE 2018, 13, e0203049. [Google Scholar] [CrossRef]
- Wang, T.D.; Wang, Y.H.; Huang, T.S.; Su, T.C.; Pan, S.L.; Chen, S.Y. Circulating levels of markers of inflammation and endothelial activation are increased in men with chronic spinal cord injury. J. Med. Assoc. 2007, 106, 919–928. [Google Scholar] [CrossRef] [Green Version]
- Wang, Y.H.; Huang, T.S.; Liang, H.W.; Su, T.C.; Chen, S.Y.; Wang, T.D. Fasting serum levels of adiponectin, ghrelin, and leptin in men with spinal cord injury. Arch. Phys. Med. Rehabil. 2005, 86, 1964–1968. [Google Scholar] [CrossRef]
- Yahiro, A.; Wingo, B.; Kunwor, S.; Parton, J.; Ellis, A. Classification of obesity, cardiometabolic risk, and metabolic syndrome in adults with spinal cord injury. J. Spinal Cord Med. 2019, 43, 485–496. [Google Scholar] [CrossRef]
- Yilmaz, B.; Yasar, E.; Goktepe, A.S.; Onder, M.E.; Alaca, R.; Yazicioglu, K.; Mohur, H. The relationship between basal metabolic rate and femur bone mineral density in men with traumatic spinal cord injury. Arch. Phys. Med. Rehabil. 2007, 88, 758–761. [Google Scholar] [CrossRef] [PubMed]
- Zhu, C.; Galea, M.; Livote, E.; Signor, D.; Wecht, J.M. A retrospective chart review of heart rate and blood pressure abnormalities in veterans with spinal cord injury. J. Spinal Cord Med. 2013, 36, 463–475. [Google Scholar] [CrossRef] [PubMed] [Green Version]
- Astorino, T.A.; Harness, E.T.; Witzke, K.A. Chronic activity-based therapy does not improve body composition, insulin-like growth factor-I, adiponectin, or myostatin in persons with spinal cord injury. J. Spinal Cord Med. 2015, 38, 615–625. [Google Scholar] [CrossRef] [Green Version]
- Bauman, W.A.; Spungen, A.M. Disorders of carbohydrate and lipid metabolism in veterans with paraplegia or quadriplegia: A model of premature aging. Metabolism 1994, 43, 749–756. [Google Scholar] [CrossRef]
- Brenes, G.; Dearwater, S.; Shapera, R.; LaPorte, R.E.; Collins, E. High density lipoprotein cholesterol concentrations in physically active and sedentary spinal cord injured patients. Arch. Phys. Med. Rehabil. 1986, 67, 445–450. [Google Scholar] [PubMed]
- Groah, S.L.; Nash, M.S.; Ljungberg, I.H.; Libin, A.; Hamm, L.F.; Ward, E.; Burns, P.A.; Enfield, G. Nutrient intake and body habitus after spinal cord injury: An analysis by sex and level of injury. J. Spinal Cord Med. 2009, 32, 25–33. [Google Scholar] [CrossRef] [Green Version]
- Groah, S.L.; Nash, M.S.; Ward, E.A.; Libin, A.; Mendez, A.J.; Burns, P.; Elrod, M.; Hamm, L.F. Cardiometabolic risk in community-dwelling persons with chronic spinal cord injury. J. Cardiopulm. Rehabil. Prev. 2011, 31, 73–80. [Google Scholar] [CrossRef] [Green Version]
- Gill, S.; Sumrell, R.M.; Sima, A.; Cifu, D.X.; Gorgey, A.S. Waist circumference cutoff identifying risks of obesity, metabolic syndrome, and cardiovascular disease in men with spinal cord injury. PLoS ONE 2020, 15, e0236752. [Google Scholar] [CrossRef]
- Hatchett, P.E.; Mulroy, S.J.; Eberly, V.J.; Haubert, L.L.; Requejo, P.S. Body mass index changes over 3 years and effect of obesity on community mobility for persons with chronic spinal cord injury. J. Spinal Cord Med. 2016, 39, 421–432. [Google Scholar] [CrossRef]
- Maruyama, Y.; Mizuguchi, M.; Yaginuma, T.; Kusaka, M.; Yoshida, H.; Yokoyama, K.; Kasahara, Y.; Hosoya, T. Serum leptin, abdominal obesity and the metabolic syndrome in individuals with chronic spinal cord injury. Spinal Cord 2008, 46, 494–499. [Google Scholar] [CrossRef]
- Singh, R.; Rohilla, R.K.; Saini, G.; Kaur, K. Longitudinal study of body composition in spinal cord injury patients. Indian J. Orthop. 2014, 48, 168–177. [Google Scholar] [CrossRef]
- Steinberg, L.L.; Lauro, F.A.; Sposito, M.M.; Tufik, S.; Mello, M.T.; Naffah-Mazzacoratti, M.G.; Cavalheiro, E.A.; Silva, A.C. Catecholamine response to exercise in individuals with different levels of paraplegia. Braz. J. Med. Biol. Res. 2000, 33, 913–918. [Google Scholar] [CrossRef] [PubMed] [Green Version]
- Gibson, A.E.; Buchholz, A.C.; Martin Ginis, K.A.; Group, S.-S.R. C-Reactive protein in adults with chronic spinal cord injury: Increased chronic inflammation in tetraplegia vs paraplegia. Spinal Cord 2008, 46, 616–621. [Google Scholar] [CrossRef]
- Gomes Costa, R.R.; Carregaro, R.L.; Ribeiro Neto, F. Are body composition, strength, and functional independence similarities between spinal cord injury classifications? A discriminant analysis. J. Sport Rehabil. 2020, 29, 277–281. [Google Scholar] [CrossRef]
- Stevens, S.L.; Caputo, J.L.; Fuller, D.K.; Morgan, D.W. Physical activity and quality of life in adults with spinal cord injury. J. Spinal Cord Med. 2008, 31, 373–378. [Google Scholar] [CrossRef] [Green Version]
- Collins, E.G.; Gater, D.; Kiratli, J.; Butler, J.; Hanson, K.; Langbein, W.E. Energy cost of physical activities in persons with spinal cord injury. Med. Sci. Sports Exerc. 2010, 42, 691–700. [Google Scholar] [CrossRef] [PubMed]
- Nevin, A.N.; Steenson, J.; Vivanti, A.; Hickman, I.J. Investigation of measured and predicted resting energy needs in adults after spinal cord injury: A systematic review. Spinal Cord 2016, 54, 248–253. [Google Scholar] [CrossRef] [Green Version]
- Perret, C.; Stoffel-Kurt, N. Comparison of nutritional intake between individuals with acute and chronic spinal cord injury. J. Spinal Cord Med. 2011, 34, 569–575. [Google Scholar] [CrossRef] [Green Version]
- Gorgey, A.S.; Dolbow, D.R.; Dolbow, J.D.; Khalil, R.K.; Castillo, C.; Gater, D.R. Effects of spinal cord injury on body composition and metabolic profile—Part I. J. Spinal Cord Med. 2014, 37, 693–702. [Google Scholar] [CrossRef] [PubMed] [Green Version]
- Jung, I.Y.; Kim, H.R.; Chun, S.M.; Leigh, J.H.; Shin, H.I. Severe spasticity in lower extremities is associated with reduced adiposity and lower fasting plasma glucose level in persons with spinal cord injury. Spinal Cord 2017, 55, 378–382. [Google Scholar] [CrossRef]
- Abilmona, S.M.; Sumrell, R.M.; Gill, R.S.; Adler, R.A.; Gorgey, A.S. Serum testosterone levels may influence body composition and cardiometabolic health in men with spinal cord injury. Spinal Cord 2019, 57, 229–239. [Google Scholar] [CrossRef]
- Gorgey, A.S.; Chiodo, A.E.; Zemper, E.D.; Hornyak, J.E.; Rodriguez, G.M.; Gater, D.R. Relationship of spasticity to soft tissue body composition and the metabolic profile in persons with chronic motor complete spinal cord injury. J. Spinal Cord Med. 2010, 33, 6–15. [Google Scholar] [CrossRef] [Green Version]
- Schorr, M.; Dichtel, L.E.; Gerweck, A.V.; Valera, R.D.; Torriani, M.; Miller, K.K.; Bredella, M.A. Sex differences in body composition and association with cardiometabolic risk. Biol. Sex Differ. 2018, 9, 28. [Google Scholar] [CrossRef] [PubMed]
- Sowers, M.; Zheng, H.; Tomey, K.; Karvonen-Gutierrez, C.; Jannausch, M.; Li, X.; Yosef, M.; Symons, J. Changes in body composition in women over six years at midlife: Ovarian and chronological aging. J. Clin. Endocrinol. Metab. 2007, 92, 895–901. [Google Scholar] [CrossRef] [PubMed] [Green Version]
- Raguindin, P.F.; Fränkl, G.; Itodo, O.A.; Bertolo, A.; Zeh, R.M.; Capossela, S.; Minder, B.; Stoyanov, J.; Stucki, G.; Franco, O.H.; et al. The neurological level of spinal cord injury and cardiovascular risk factors: A systematic review and meta-analysis. Spinal cord 2021. [Google Scholar] [CrossRef]
- Wong, S.; O’Connor, L.; Twist, A.; Moseley, G.; Langan, R.; Smith, E.; Graham, A.; Taylor, C.; Dawson-Macolm, L. Multidisciplinary Association for Spinal Cord Injury Professions (MASCIP) Guidelines for Weight-Management in Individuals with Spinal Cord Injury; National Spinal Injuries Center: Aylesbury, UK, 2019. [Google Scholar]
- Nash, M.S.; Groah, S.L.; Gater, D.R.; Dyson-Hudson, T.A.; Lieberman, J.A.; Myers, J.; Sabharwal, S.; Taylor, A.J. Identification and management of cardiometabolic risk after spinal cord injury: Clinical practice guideline for health care providers. Top. Spinal Cord Inj. Rehabil. 2018, 24, 379–423. [Google Scholar] [CrossRef]
- Fitzgerald, S.; Kelleher, A. Mobility challenges in individuals with a spinal cord injury with increased body weight. Top. Spinal Cord Inj. Rehabil. 2007, 12, 54–63. [Google Scholar] [CrossRef]
- Felix, E.R.; Gater, D.R., Jr. Interrelationship of neurogenic obesity and chronic neuropathic pain in persons with spinal cord injury. Top. Spinal Cord Inj. Rehabil. 2021, 27, 75–83. [Google Scholar] [CrossRef] [PubMed]
- Prado, C.M.; Wells, J.C.; Smith, S.R.; Stephan, B.C.; Siervo, M. Sarcopenic obesity: A Critical appraisal of the current evidence. Clin. Nutr. 2012, 31, 583–601. [Google Scholar] [CrossRef]
- Maggioni, M.; Bertoli, S.; Margonato, V.; Merati, G.; Veicsteinas, A.; Testolin, G. Body composition assessment in spinal cord injury subjects. Acta Diabetol. 2003, 40, S183–S186. [Google Scholar] [CrossRef] [PubMed]
- Mojtahedi, M.C.; Valentine, R.J.; Evans, E.M. Body composition assessment in athletes with spinal cord injury: Comparison of field methods with dual-energy X-ray absorptiometry. Spinal Cord 2009, 47, 698–704. [Google Scholar] [CrossRef]
- Eriks-Hoogland, I.; Hilfiker, R.; Baumberger, M.; Balk, S.; Stucki, G.; Perret, C. Clinical assessment of obesity in persons with spinal cord injury: Validity of waist circumference, body mass index, and anthropometric index. J. Spinal Cord Med. 2011, 34, 416–422. [Google Scholar] [CrossRef] [Green Version]
- Ravensbergen, H.R.; Lear, S.A.; Claydon, V.E. Waist circumference is the best index for obesity-related cardiovascular disease risk in individuals with spinal cord injury. J. Neurotrauma 2014, 31, 292–300. [Google Scholar] [CrossRef] [PubMed]
- Rankin, K.C.; O’Brien, L.C.; Gorgey, A.S. Quantification of trunk and android lean mass using dual energy X-ray absorptiometry compared to magnetic resonance imaging after spinal cord injury. J. Spinal Cord Med. 2019, 42, 508–516. [Google Scholar] [CrossRef] [PubMed]
- Li, G.; Yao, T.; Wu, X.W.; Cao, Z.; Tu, Y.C.; Ma, Y.; Li, B.N.; Peng, Q.Y.; Wu, B.; Hou, J. Novel and traditional anthropometric indices for identifying arterial stiffness in overweight and obese adults. Clin. Nutr. 2020, 39, 893–900. [Google Scholar] [CrossRef] [PubMed]
- Yarar-Fisher, C.; Chen, Y.; Jackson, A.B.; Hunter, G.R. Body mass index underestimates adiposity in women with spinal cord injury. Obesity 2013, 21, 1223–1225. [Google Scholar] [CrossRef] [Green Version]
- Raguindin, P.F.; Muka, T.; Glisic, M. Sex and gender gap in spinal cord injury research: Focus on cardiometabolic diseases. A mini review. Maturitas 2021, 147, 14–18. [Google Scholar] [CrossRef] [PubMed]
- Huxley, R.; Mendis, S.; Zheleznyakov, E.; Reddy, S.; Chan, J. Body mass index, waist circumference and waist:hip ratio as predictors of cardiovascular risk—A review of the literature. Eur. J. Clin. Nutr. 2009, 64, 16–22. [Google Scholar] [CrossRef] [Green Version]
- Vella, A.; Kelly, T.L.; Wilson, K.E.; Heymsfield, S.B. Dual energy X-ray absorptiometry body composition reference values from NHANES. PLoS ONE 2009, 4, e7038. [Google Scholar] [CrossRef] [Green Version]


| Characteristics | No. of Studies | References |
|---|---|---|
| Level of injury 1 | ||
| Tetraplegia vs. Paraplegia | 36 | Akbal 2013 [31], Azevedo 2016 [32], Bauman 1992 [34], Bauman 1999 [33], Buchholz 2009 [35], de Groot 2008 [37], Chun 2017 [36], Farkas 2019 [40], Flueck 2020 [39], Gater 2021 [41], Gibson 2008 [76], Gomes Costa 2019 [77], Gorgey 2011A [13], Han 2015 [43], Janssen 1997 [45], Katzelnick 2019 [47], Kemp 2000 [48], Kim 2016 [49], Li 2019 [14], Matos Souza 2010 [51], McCaulay 2018 [52], Miyatani 2014 [53], O Brien 2017 [54], Pelletier 2016 [15], Powell 2017 [55], Rankin 2017 [56], Raymond 2010 [57], Ribeiro Neto 2013 [58], Sabour 2013 [59], Spungen 2003 [16], Sumrell 2018 [60], Wang 2005 [62], Wang 2007 [61], Yahiro 2019 [63], Yilmaz 2007 [64], Zhu 2013 [65] |
| High Paraplegia vs. Low Paraplegia | 12 | Dionyssiotis 2008 [38], Gomes Costa 2019 [77], Inukai 2006[44], Janssen 1997 [45], Katzelnick 2017 [46], Katzelnick 2019 [47], Kim 2016 [49], Lee 2017 [50], Raymond 2010 [57], Ribeiro Neto 2013 [58], Wang 2007 [61], Zhu 2013 [65] |
| Proportion of Complete Injury 2 | ||
| 100% | 12 | Bauman 1999 [33], Chun 2017 [36], Dionyssiotis 2008 [38], Farkas 2019 [40], Gater 2021 [41], Gomes Costa 2019 [77], Gorgey 2011A [13], Rankin 2017 [56], Sumrell 2018 [60], Wang 2005 [62], Wang 2007 [61], Yilmaz 2007 [64] |
| Mixed | 15 | Akbal 2013 [31], Azevedo 2016 [32], de Groot 2008 [37], Gibson 2008 [76], Janssen 1997 [45], Katzelnick 2017 [46], Katzelnick 2019 [47], Kemp 2000 [48], O Brien 2017 [54], Pelletier 2016 [15], Powell 2017 [55], Raymond 2010 [57], Ribeiro Neto 2013 [58], Sabour 2013 [59], Spungen 2003 [16] |
| Duration of Injury (Years) 3 | ||
| ≤12.3 y (IQR 8.03–14.8) | 19 | Akbal 2013 [31], Azevedo 2016 [32], Bauman 1999 [33], Chun 2017 [36], Dionyssiotis 2008 [38], Gomes Costa 2019 [77], Han 2015 [43], Katzelnick 2017 [46], Lee 2017 [50], Matos Souza 2010 [51], McCaulay 2018 [52], O Brien 2017 [54], Rankin 2017 [56], Raymond 2010 [57], Ribeiro Neto 2013 [58], Sabour 2013 [59], Sumrell 2018 [60], Wang 2005 [62], Wang 2007 [61], Yilmaz 2007 [64] |
| >12.3 y | 18 | Bauman 1992 [34], Buchholz 2009 [35], de Groot 2008 [37], Farkas 2019 [40], Flueck 2020 [39], Gater 2021 [41], Gibson 2008 [76], Inukai 2006 [44], Janssen 1997 [45], Katzelnick 2019 [47], Kemp 2000 [48], Li 2019 [14], Miyatani 2014 [53], Pelletier 2016 [15], Spungen 2003 [16], Yahiro 2019 [63], Zhu 2013 [65] |
| Sex | ||
| Males Only | 19 | Azevedo 2016 [32], Bauman 1992 [34], Bauman 1999 [33], Dionyssiotis 2008 [38], Gomes Costa 2019 [77], Gorgey 2011A [13], Inukai 2006 [44], Janssen 1997 [45], Matos Souza 2010 [51], McCaulay 2018 [52], O Brien 2017 [54], Rankin 2017 [56], Ribeiro Neto 2013 [58], Spungen 2003 [16], Sumrell 2018 [60], Wang 2005 [62], Wang 2007 [61], Yahiro 2019 [63], Yilmaz 2007 [64] |
| Both | 19 | Buchholz 2009 [35], de Groot 2008 [37], Chun 2017 [36], Farkas 2019 [40], Flueck 2020 [39], Gater 2021 [41], Gibson 2008, Han 2015 [43], Katzelnick 2017 [46], Katzelnick 2019 [47], Kemp 2000 [48], Kim 2016 [49], Lee 2017 [50], Miyatani 2014 [53], Pelletier 2016 [15], Powell 2017 [55], Raymond 2010 [57], Sabour 2013 [59], Zhu 2013 [65] |
| Female Only | 1 | Li 2019 [14] |
| Unknown | 1 | Akbal 2013 [31] |
| Study Size | ||
| <50 | 18 | Azevedo 2016 [32], Dionyssiotis 2008 [38], Farkas 2019 [40], Gomes Costa 2019 [77], Gorgey 2011A [13], Inukai 2006 [44], Janssen 1997 [45], Katzelnick 2019 [47], Kim 2016 [49], Lee 2017 [50], Li 2019 [14], Matos Souza 2010 [51], McCaulay 2018 [52], O Brien 2017 [54], Rankin 2017 [56], Raymond 2010 [57], Sumrell 2018 [60], Yilmaz 2007 [64] |
| 50–100 | 9 | Akbal 2013 [31], Buchholz 2009 [35], Chun 2017 [36], Flueck 2020 [39], Gater 2021 [41], Gibson 2008 [76], Miyatani 2014 [53], Ribeiro Neto 2013 [58], Wang 2007 [61] |
| >100 | 13 | Bauman 1992 [34], Bauman 1999 [33], de Groot 2008 [37], Han 2015 [43], Katzelnick 2019 [47], Kemp 2000 [48], Pelletier 2016 [15], Powell 2017 [55], Sabour 2013 [59], Spungen 2003 [16], Wang 2005 [62], Yahiro 2019 [63], Zhu 2013 [65] |
| Age, years | ||
| ≤39.1 y (IQR 36–42.4) | 20 | Akbal 2013 [31], Azevedo 2016 [32], Bauman 1999 [33], Flueck 2020 [39], Gomes Costa 2019 [77], Gorgey 2011A [13], Inukai 2006 [44], Janssen 1997 [45], Katzelnick 2017 [46], Lee 2017 [50], Matos Souza 2010 [51], McCaulay 2018 [52], O Brien 2017 [54], Rankin 2017 [56], Raymond 2010 [57], Ribeiro Neto 2013 [58], Sabour 2013 [59], Spungen 2003 [16], Sumrell 2018 [60], Yilmaz 2007 [64] |
| >39.1 y | 20 | Bauman 1992 [34], Buchholz 2009 [35], Chun 2017 [36], de Groot 2008 [37], Dionyssiotis 2008 [38], Farkas 2019 [40], Gater 2021 [41], Gibson 2008 [76], Han 2015 [43], Katzelnick 2019 [47], Kemp 2000 [48], Kim 2016 [49], Li 2019 [14], Miyatani 2014 [53], Pelletier 2016 [15], Powell 2017 [55], Wang 2005 [62], Wang 2007 [61], Yahiro 2019 [63], Zhu 2013 [65] |
| Location | ||
| Europe | 4 | de Groot 2008 [37], Dionyssiotis 2008 [38], Flueck 2020 [39], Janssen 1997 [45] |
| North America | 23 | Azevedo 2016 [32], Bauman 1992 [34], Bauman 1999 [33], Buchholz 2009 [35], Farkas 2019 [40], Gater 2021 [41], Gibson 2008 [76], Gorgey 2011A [13], Katzelnick 2017 [46], Katzelnick 2019 [47], Kemp 2000 [48], Kim 2016 [49], Li 2019 [14], McCaulay 2018 [52], Miyatani 2014 [53], O Brien 2017 [54], Pelletier 2016 [15], Powell 2017 [55], Rankin 2017 [56], Spungen 2003 [16], Sumrell 2018 [60], Yahiro 2019 [63], Zhu 2013 [65] |
| South America | 3 | Gomes Costa 2019 [77], Matos Souza 2010 [51], Ribeiro Neto 2013 [58] |
| Asia | 10 | Akbal 2013 [31], Chun 2017 [36], Han 2015 [43], Inukai 2006 [44], Lee 2017 [50], Raymond 2010 [57], Sabour 2013 [59], Wang 2005 [62], Wang 2007 [61], Yilmaz 2007 [64] |
| Outcomes | ||
| Anthropometric Measures | ||
| Body Mass Index (kg/m2) 4 | 35 | Akbal 2013 [31], Azevedo 2016 [32], Bauman 1992 [34], Bauman 1999 [33], Buchholz 2009 [35], de Groot 2008 [37], Dionyssiotis 2008 [38], Farkas 2019 [40], Gater 2021 [41], Gibson 2008 [76], Gomes Costa 2019 [77], Gorgey 2011A [13], Han 2015 [43], Janssen 1997 [45], Katzelnick 2017 [46], Katzelnick 2019 [47], Kemp 2000 [48], Kim 2016 [49], Lee 2017 [50], Li 2019 [14], Matos Souza 2010 [51], McCaulay 2018 [52], Miyatani 2014 [53], O Brien 2017 [54], Pelletier 2016 [15], Powell 2017 [55], Raymond 2010 [57], Ribeiro Neto 2013 [58], Sabour 2013 [59], Spungen 2003 [16], Sumrell 2018 [60], Wang 2005 [62], Wang 2007 [61], Yahiro 2019 [63], Zhu 2013 [65] |
| Body Weight 5 | 22 | Azevedo 2016 [32], Bauman 1999 [33], Dionyssiotis 2008 [38], Farkas 2019 [40], Flueck 2020 [39], Gibson 2008 [76], Gomes Costa 2019 [77], Janssen 1997 [45], Katzelnick 2017 [46], Kim 2016 [49], Li 2019 [14], McCaulay 2018 [52], Miyatani 2014 [53], O Brien 2017 [54], Pelletier 2016 [15], Raymond 2010 [57], Ribeiro Neto 2013 [58], Sumrell 2018 [60], Spungen 2003 [16], Wang 2005 [62], Wang 2007 [61], Yahiro 2019 [63] |
| Waist Circumference (cm) | 11 | Akbal 2013 [31], Buchholz 2009 [35], Gater 2021 [41], Gibson 2008 [76], Inukai 2006 [44] (only in paraplegia], McCaulay 2018 [52], Miyatani 2014 [53], Pelletier 2016 [15], Sabour 2013 [59], Sumrell 2018 [60], Yahiro 2019 [63] |
| Total Body Composition | ||
| Body Fat Percentage (%) 6 | 12 | Buchholz 2009 [35], Chun 2017 [36], Farkas 2019 [40], Flueck 2020 [39], Gibson 2008 [76], Gorgey 2011A [13], Han 2015 [43], Inukai 2006 [44] (only in paraplegia), Kemp 2000 [48], Li 2019 [14], Pelletier 2016 [15], Spungen 2003 [16] |
| Body Lean Mass (kg) | 10 | Azevedo 2016 [32], Chun 2017 [36], Farkas 2019 [40], Flueck 2020 [39], Gorgey 2011A [13], Li 2019 [14], Pelletier 2016 [15], Ribeiro Neto 2013 [58], Spungen 2003 [16], Yilmaz 2007 [64] |
| Body Fat Mass (kg) | 6 | Azevedo 2016 [32], Farkas 2019 [40], Gorgey 2011A [13], Li 2019 [14], Pelletier 2016 [15], Spungen 2003 [16] |
| Regional Body Composition | ||
| Trunk Fat Percent (%) | 5 | Farkas 2019 [40], Flueck 2020 [39], Gorgey 2011A [13], Pelletier 2016 [15], Spungen 2003 [16] |
| Trunk Fat Mass (kg) | 4 | Flueck 2020 [39], Gorgey 2011A [13], Pelletier 2016 [15], Spungen 2003 [16] |
| Trunk Lean Mass | 3 | Flueck 2020 [39], Li 2019 [14], Spungen 2003 [16] |
| Leg Fat Percent (%) | 3 | Flueck 2020 [39], Gorgey 2011A [13], Spungen 2003 [16] |
| Leg Fat Mass (kg) | 2 | Gorgey 2011A [13], Spungen 2003 [16] |
| Visceral Adiposity | ||
| Visceral Adipose Tissue (dm2) | 5 | Gorgey 2011 [42], Li 2019 [14], Pelletier 2016 [15], Rankin 2017 [56], Sumrell 2018 [60] |
| Visceral Adipose Volume (L) | 2 | Farkas 2019 [40], Sumrell 2018 [60] |
| Subcutaneous Adipose Tissue (dm2) | 2 | Gorgey 2011 [42], Rankin 2017 [56] |
| VAT/SAT Ratio | 2 | Farkas 2019 [40], Sumrell 2018 [60] |
| Study Quality | ||
| Moderate (5–7) | 7 | Bauman 1992 [34], Flueck 2020 [39], Gomes Costa 2019 [77], Inukai 2006 [44], Rankin 2017 [56], Sumrell 2018 [60], Yilmaz 2007 [64] |
| Good (8–10) | 33 | Akbal 2013 [31], Azevedo 2016 [32], Bauman 1999 [33], Buchholz 2009 [35], Chun 2017 [36], de Groot 2008 [37], Dionyssiotis 2008 [38], Farkas 2019 [40], Gater 2021 [41], Gibson 2008 [76], Gorgey 2011A [13], Han 2015 [43], Janssen 1997 [45], Katzelnick 2017 [46], Katzelnick 2019 [47], Kemp 2000 [48], Kim 2016 [49], Lee 2017 [50], Li 2019 [14], Matos Souza 2010 [51], McCaulay 2018 [52], Miyatani 2014 [53], O Brien 2017 [54], Pelletier 2016 [15], Powell 2017 [55], Raymond 2010 [57], Ribeiro Neto 2013 [58], Sabour 2013 [59], Spungen 2003 [16], Wang 2005 [62], Wang 2007 [61], Yahiro 2019 [63], Zhu 2013 [65] |
| Cardiovascular Diseases and Medication Use | ||
| No Data | 20 | Azevedo 2016 [32], Bauman 1992 [34], Bauman 1999 [33], Chun 2017 [36], de Groot 2008 [37], Dionyssiotis 2008 [38], Flueck 2020 [39], Gater 2021 [41], Gibson 2008 [76], Han 2015 [43], Inukai 2006 [44], Katzelnick 2017 [46], Katzelnick 2019 [47], Kemp 2000 [48], Pelletier 2016 [15], Powell 2017 [55], Spungen 2003 [16], Wang 2005 [62], Wang 2007 [61], Yilmaz 2007 [64] |
| Only Healthy Subjects (Excluded Those with Cardiovascular Disease or Medication Use) | 16 | Akbal 2013 [31], Farkas 2019 [40], Gomes Costa 2019 [77], Gorgey 2011A [13], Kim 2016 [49], Lee 2017 [50], Li 2019 [14], Matos Souza 2010 [51], McCaulay 2018 [52], Miyatani 2014 [53], O Brien 2017 [54], Rankin 2017 [56], Raymond 2010 [57], Ribeiro Neto 2013 [58], Sabour 2013 [59], Sumrell 2018 [60] |
| Included Those With and Without Cardiovascular Comorbidities | 4 | Buchholz 2009 [35], Janssen 1997 [45], Yahiro 2019 [63], Zhu 2013 [65] |
| Primary Outcome | ||
| Body Composition as Primary Outcome | 21 | Azevedo 2016 [32], Bauman 1999 [33], Buchholz 2009 [35], Chun 2017 [36], Dionyssiotis 2008 [38], Farkas 2019 [40], Flueck 2020 [39], Gibson 2008 [76], Gorgey 2011A [13], Han 2015 [43], Inukai 2006 [44], Kemp 2000 [48], Li 2019 [14], McCaulay 2018 [52], Pelletier 2016 [15], Rankin 2017 [56], Ribeiro Neto 2013 [58], Sabour 2013 [59], Spungen 2003 [16], Sumrell 2018 [60], Yilmaz 2007 [64], |
| Body Composition as Secondary Outcome | 19 | Akbal 2013 [31], Bauman 1992 [34], de Groot 2008 [37], Gater 2021 [41], Gomes Costa 2019 [77], Janssen 1997 [45], Katzelnick 2017 [46], Katzelnick 2019 [47], Kim 2016 [49], Lee 2017 [50], Li 2019 [14], Matos Souza 2010 [51], Miyatani 2014 [53], O Brien 2017 [54], Powell 2017 [55], Raymond 2010 [57], Wang 2005 [62], Wang 2007 [61], Yahiro 2019 [63], Zhu 2013 [65] |
| Individuals with Tetraplegia vs. Paraplegia | |||||||||
|---|---|---|---|---|---|---|---|---|---|
| Outcome (Units) | Number of Studies | Study Citations | Tetraplegia, n | Tetraplegia, Pooled Mean (SD) | Paraplegia, n | Paraplegia, Pooled Mean (SD) | Weighted Mean Difference (95% CI) | I2 | p Value for Heterogeneity |
| Anthropometric measurements | |||||||||
| Body mass index (kg/m2) | 32 | [12,13,14,15,16,31,32,33,34,35,37,40,41,43,45,47,48,49,51,52,53,54,55,57,58,60,61,62,65,76,77] | 1739 | 24.6 (4.9) | 2098 | 24.9 (4.5) | −0.9 (−1.4, −0.5) | 86.5% | <0.001 |
| Waist circumference (cm) | 10 | [12,15,31,35,41,52,53,60,63,76] | 347 | 94.5 (14.4) | 405 | 91.5 (13.4) | 1.8 (−0.2, 3.9) | 57.8% | 0.397 |
| Body weight (kg) | 20 | [10,14,15,16,32,33,39,45,49,52,53,54,57,58,60,61,62,63,76,77] | 531 | 75.9 (15.4) | 768 | 73.7 (14.7) | −0.3 (−1.8, 1.2) | 57.8% | 0.001 |
| Total body composition | |||||||||
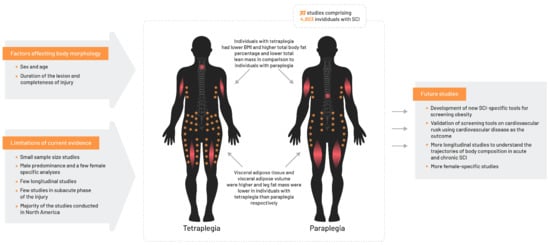
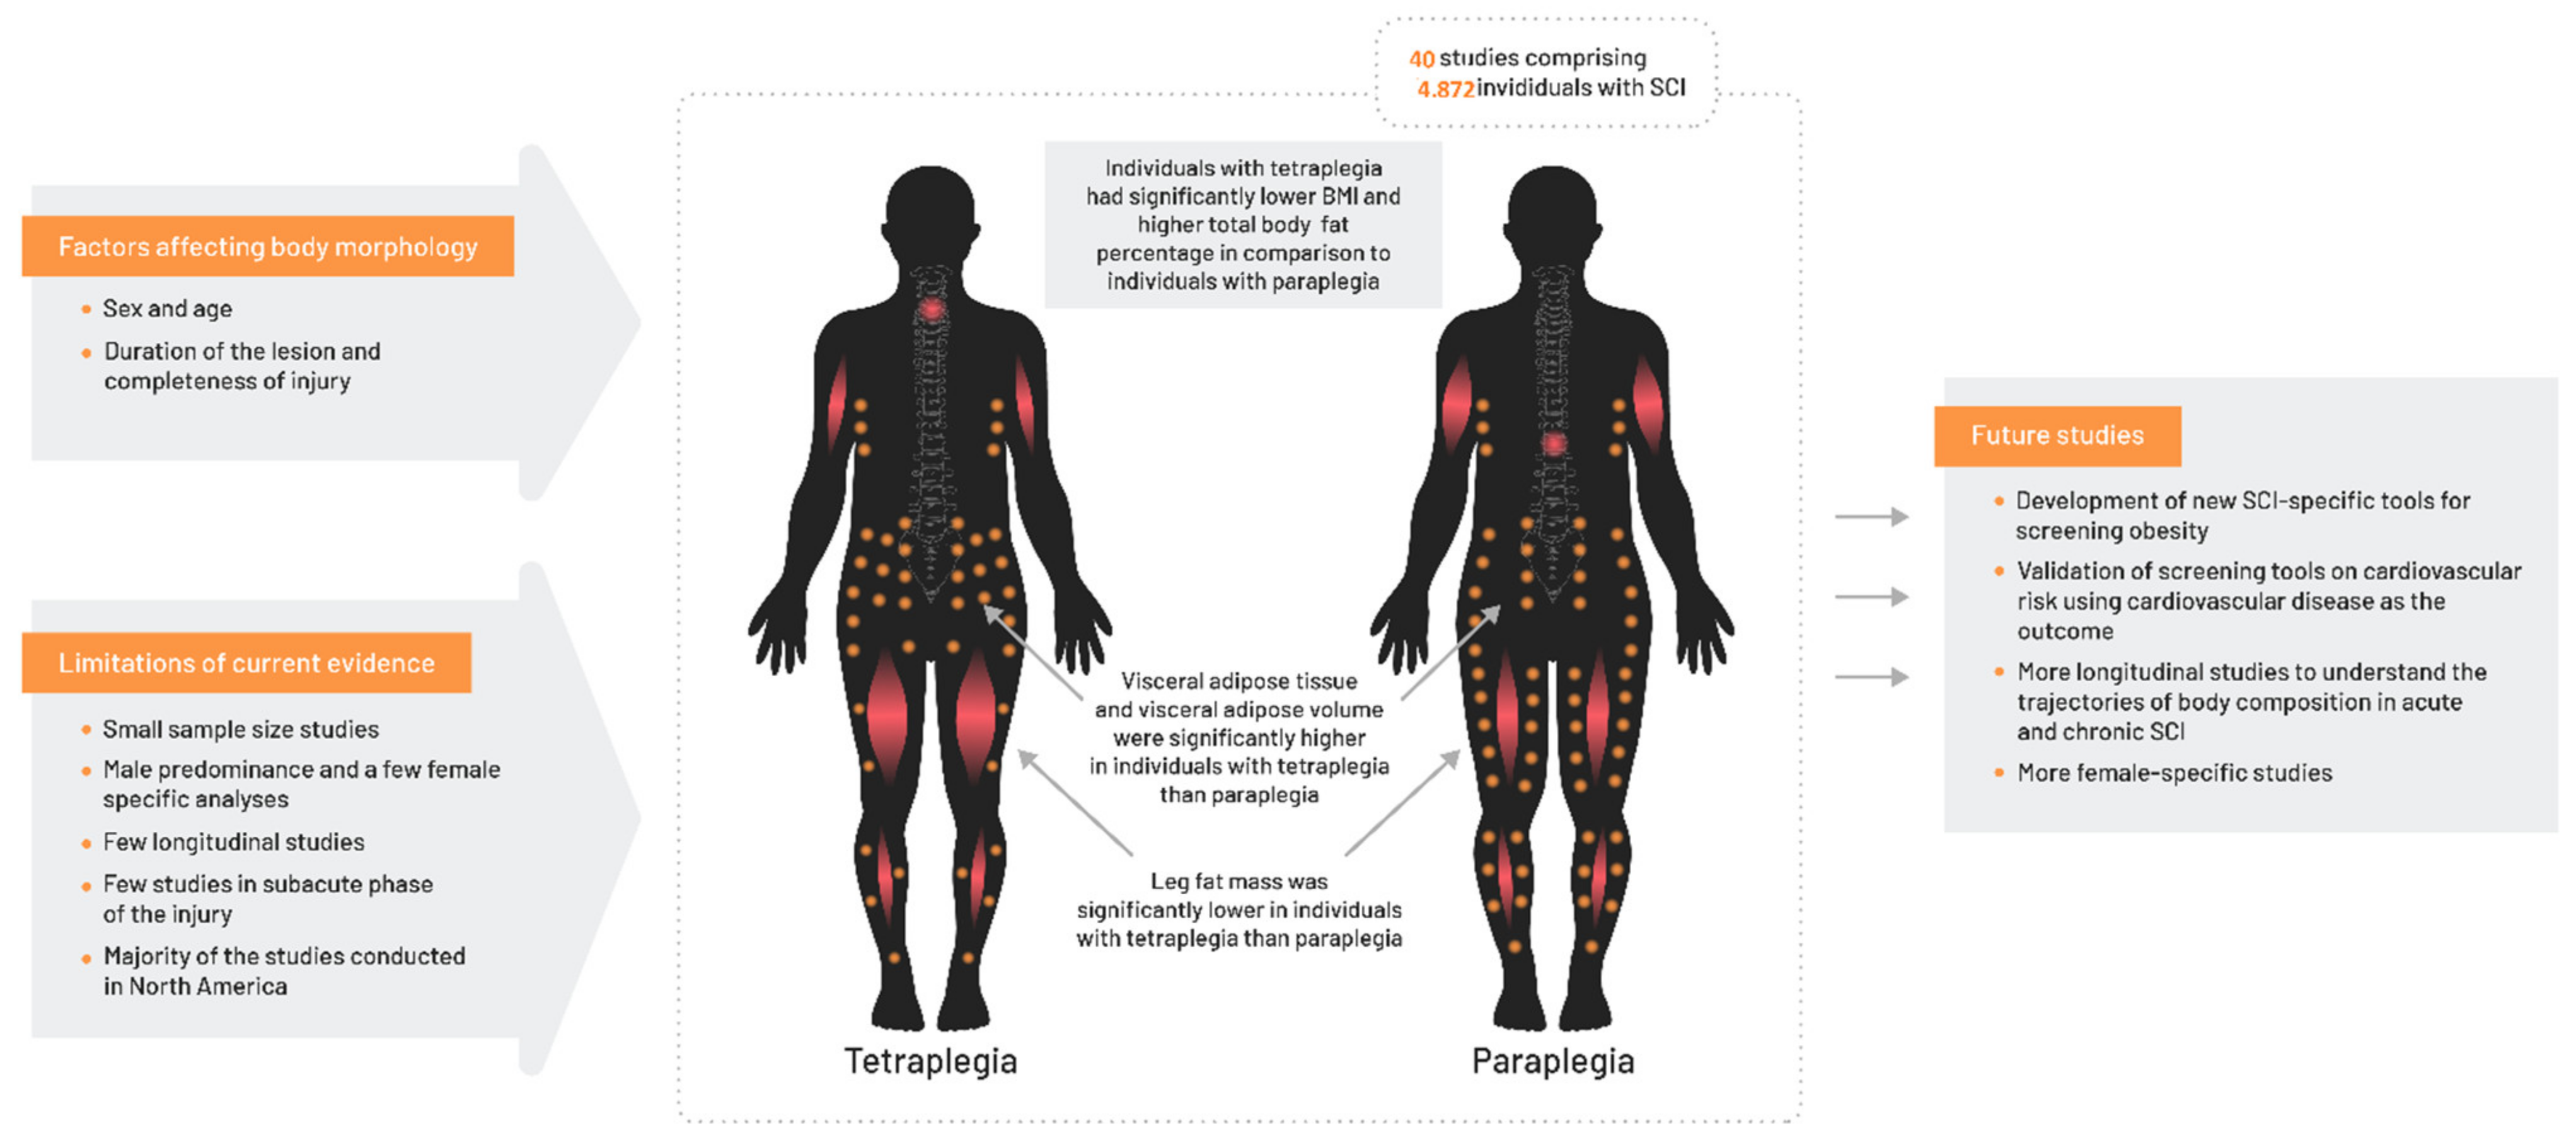
| Total body fat percentage (%) | 11 | [10,13,14,15,16,35,36,39,43,48,76] | 629 | 34.8 (9.1) | 739 | 32.6 (8.9) | 1.9 (0.6, 3.1) | 46.7% | 0.044 |
| Total body fat mass | 6 | [10,13,14,15,16,32] | 177 | 26.8 (8.0) | 226 | 25.1 (8.1) | 1.7 (−0.5, 3.9) | 48.7% | 0.083 |
| Total lean body mass (kg) | 10 | [10,13,14,15,16,32,36,39,58,64] | 266 | 46.7 (7.9) | 346 | 48.5 (8.0) | −3.0 (−5.9, −0.2) | 84.1% | <0.000 |
| Regional body composition | |||||||||
| Trunk fat percentage | 5 | [13,15,16,39,40] | 171 | 30.6 (6.7) | 226 | 30.3 (7.2) | −0.32 (−2.92, 2.82) | 66.6% | 0.017 |
| Trunk fat mass (kg) | 4 | [13,15,16,39] | 158 | 12.8 (4.5) | 197 | 11.5 (3.9) | 0.43 (−1.06, 1.92) | 60.4% | 0.056 |
| Trunk lean mass (kg) | 3 | [14,16,39], | 93 | 24.3 (2.2) | 116 | 24.5 (3.2) | −0.51 (−3.11, 2.10) | 81.4% | 0.005 |
| Leg fat percentage | 3 | [13,16,39] | 92 | 36.0 (4.1) | 128 | 38.6 (9.1) | −3.77 (−12.53, 4.98) | 90.3% | <0.001 |
| Leg fat mass (kg) | 2 | [13,16] | 73 | 8.2 (1.0) | 92 | 7.9 (1.8) | −0.03 (−0.04, −0.02) | 0.0% | 0.390 |
| Visceral adiposity | |||||||||
| Visceral adipose tissue area (dm2) | 5 | [14,15,42,56,60] | 96 | 1.52 (0.72) | 119 | 1.25 (0.66) | 0.24 (0.05, 0.43) | 0.0% | 0.858 |
| Visceral adipose volume (L) | 2 | [40,60] | 20 | 4.4 (2.4) | 49 | 2.7 (2.0) | 1.05 (0.14, 1.95) | 0.0% | 0.532 |
| Subcutaneous adipose tissue (dm2) | 2 | [42,56] | 14 | 1.53 (0.91) | 21 | 1.64 (0.67) | −0.20 (−0.76, 0.35) | 5.9% | 0.303 |
| VAT/SAT ratio | 2 | [40,60] | 20 | 0.82 | 49 | 0.63 (0.42) | 0.18 (−0.03, 0.40) | 0.0% | 0.832 |
| Comparison of individuals with high paraplegia versus low paraplegia (T5–T6 as level of discrimination) | |||||||||
| Outcome | Number of studies | High paraplegia, n | High paraplegia, mean (SD) | Low paraplegia, n | Low paraplegia, mean (SD) | Weighted mean difference (95% CI) | I2 | p value for heterogeneity | |
| Body mass index (kg/m2) | 12 | [38,44,45,46,47,49,50,57,58,61,65,77] | 460 | 25.1 (5.0) | 287 | 24.3 (4.5) | −0.2 (−1.0, 0.5) | 22.7% | 0.221 |
| Body weight (kg) | 8 | [18,45,46,49,57,58,61,77] | 135 | 70.9 (14.4) | 144 | 72.4 (14.8) | −0.4 (−3.7, 2.8) | 0.0% | 0.965 |
| Total body fat percentage | 2 | [44,58] | 30 | 23.5 (6.8) | 37 | 22.5 (5.7) | 1.3 (−1.7, 4.3) | 0.0% | 0.647 |
Publisher’s Note: MDPI stays neutral with regard to jurisdictional claims in published maps and institutional affiliations. |
© 2021 by the authors. Licensee MDPI, Basel, Switzerland. This article is an open access article distributed under the terms and conditions of the Creative Commons Attribution (CC BY) license (https://creativecommons.org/licenses/by/4.0/).
Share and Cite
Raguindin, P.F.; Bertolo, A.; Zeh, R.M.; Fränkl, G.; Itodo, O.A.; Capossela, S.; Bally, L.; Minder, B.; Brach, M.; Eriks-Hoogland, I.; et al. Body Composition According to Spinal Cord Injury Level: A Systematic Review and Meta-Analysis. J. Clin. Med. 2021, 10, 3911. https://doi.org/10.3390/jcm10173911
Raguindin PF, Bertolo A, Zeh RM, Fränkl G, Itodo OA, Capossela S, Bally L, Minder B, Brach M, Eriks-Hoogland I, et al. Body Composition According to Spinal Cord Injury Level: A Systematic Review and Meta-Analysis. Journal of Clinical Medicine. 2021; 10(17):3911. https://doi.org/10.3390/jcm10173911
Chicago/Turabian StyleRaguindin, Peter Francis, Alessandro Bertolo, Ramona Maria Zeh, Gion Fränkl, Oche Adam Itodo, Simona Capossela, Lia Bally, Beatrice Minder, Mirjam Brach, Inge Eriks-Hoogland, and et al. 2021. "Body Composition According to Spinal Cord Injury Level: A Systematic Review and Meta-Analysis" Journal of Clinical Medicine 10, no. 17: 3911. https://doi.org/10.3390/jcm10173911