Size/Age Models for Monitoring of the Pink Sea Fan Eunicella verrucosa (Cnidaria: Alcyonacea) and a Case Study Application


Abstract
:1. Introduction
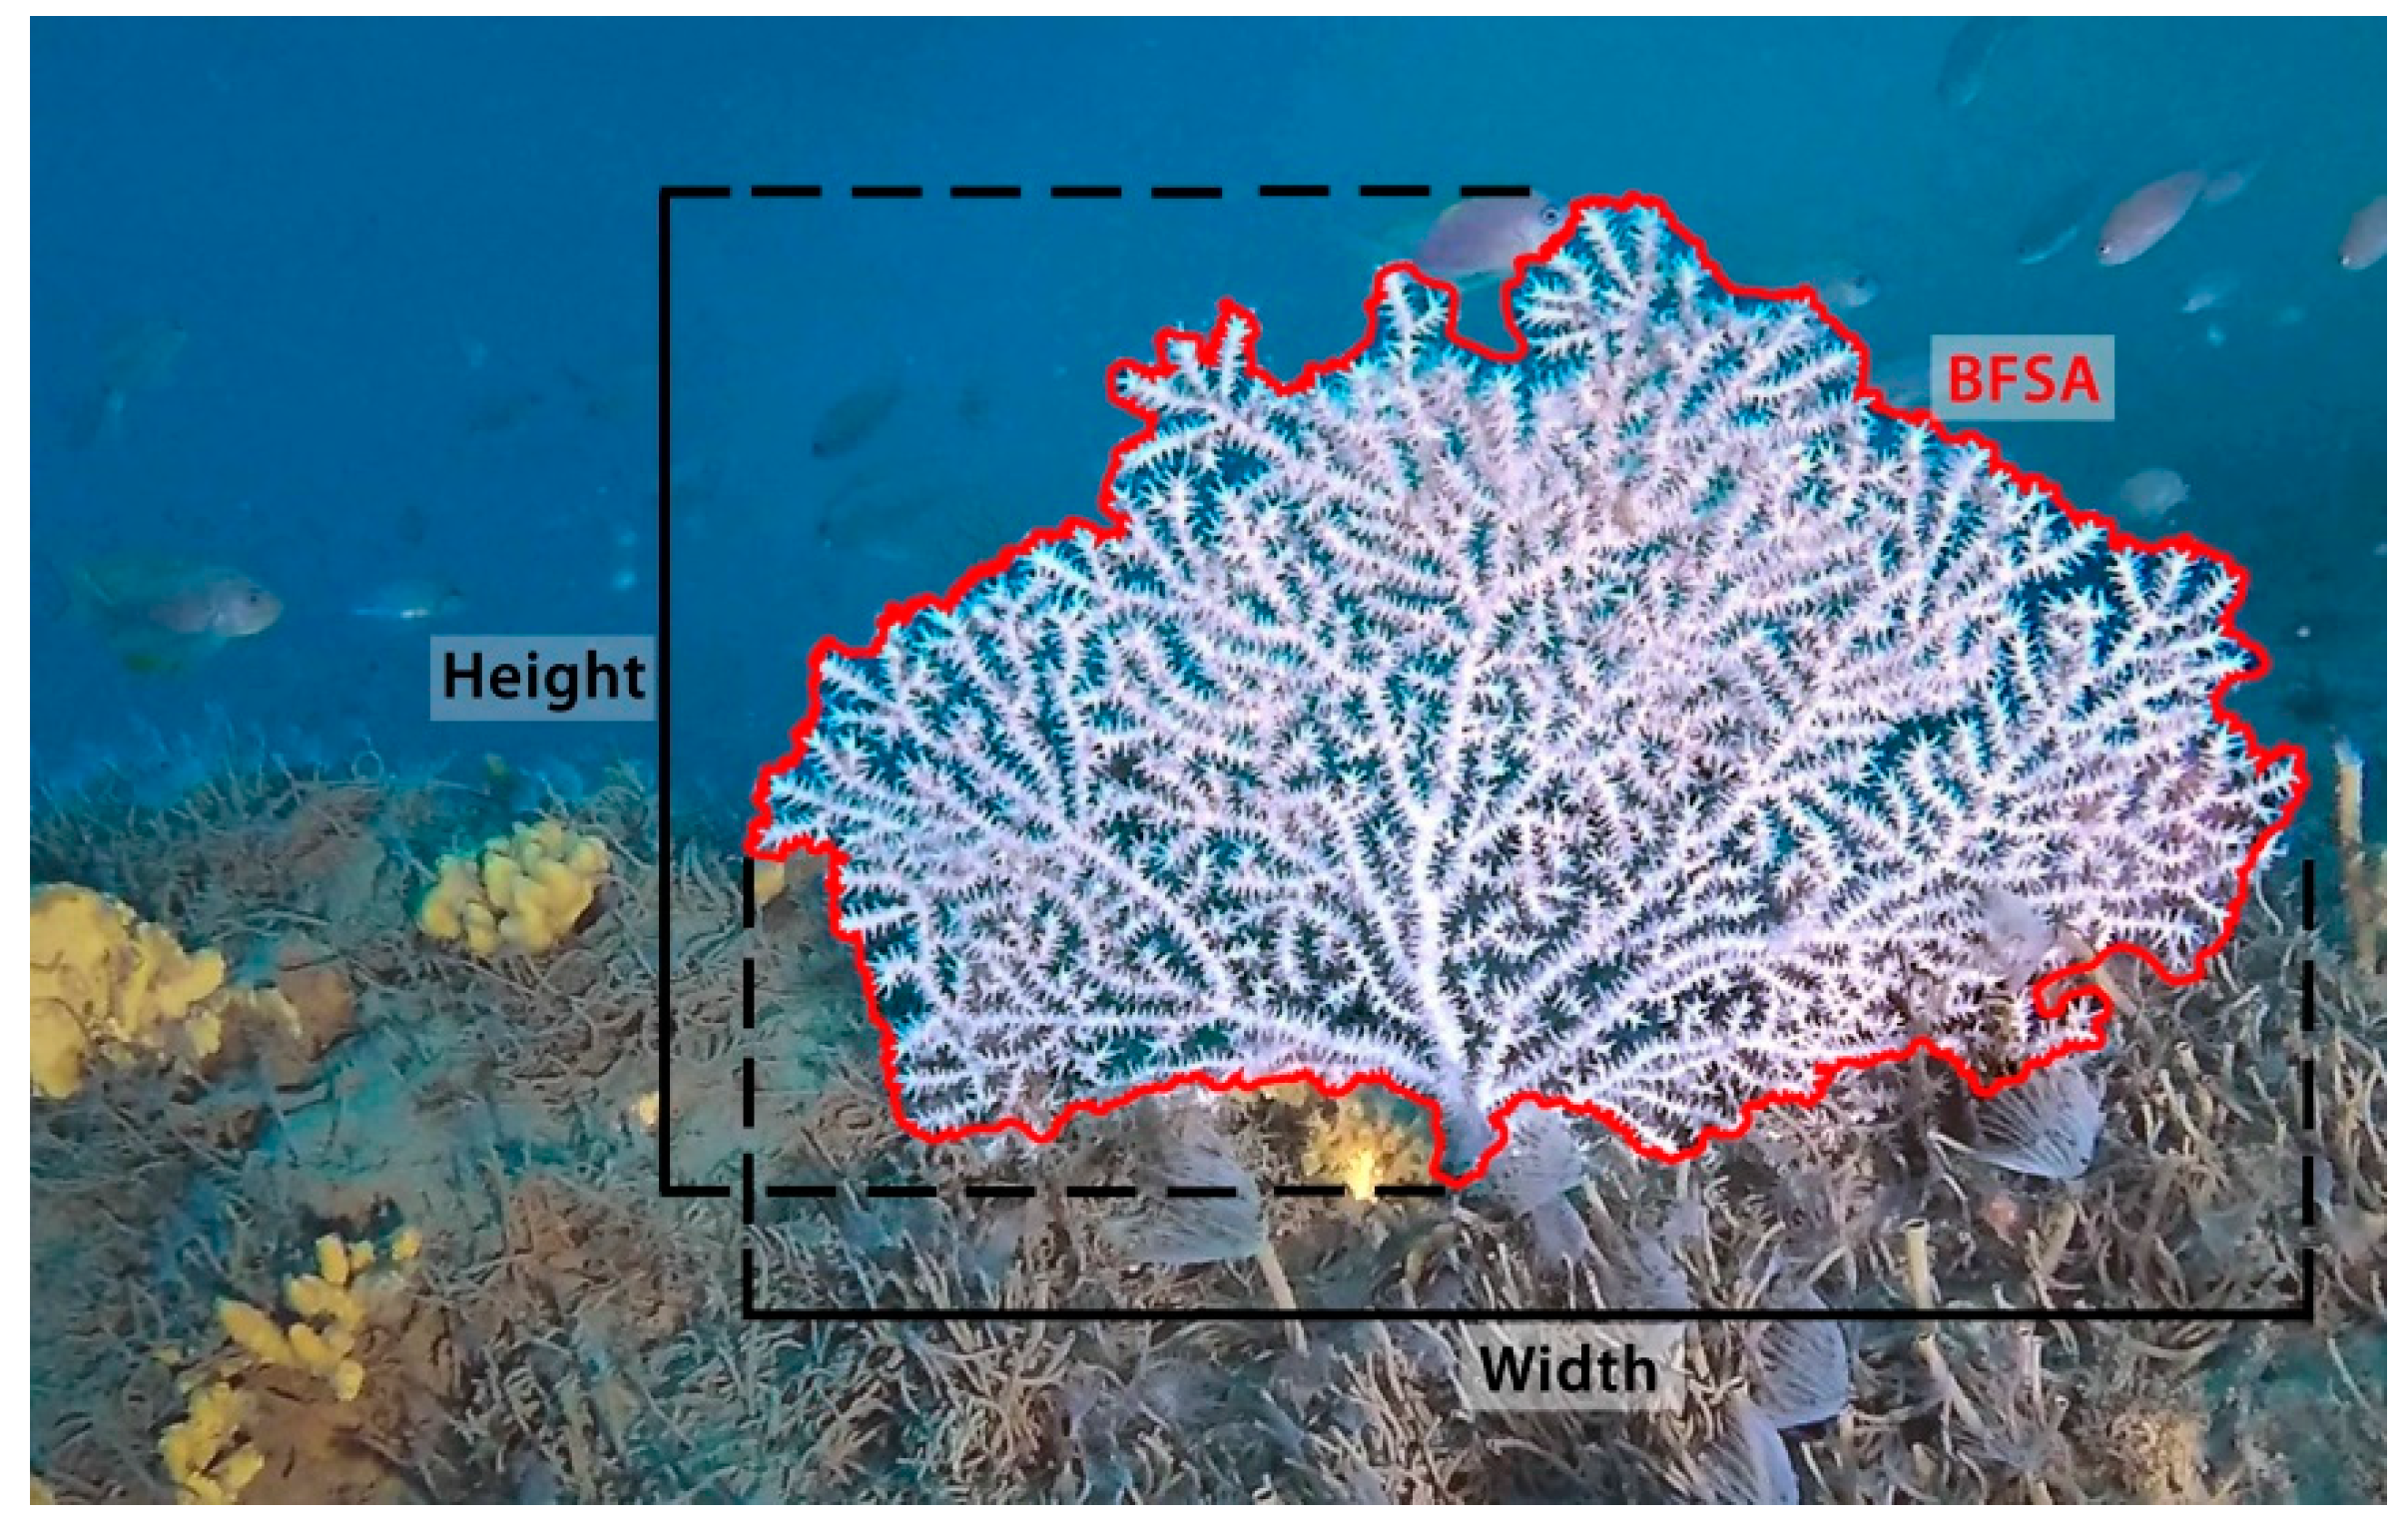
2. Materials and Methods
2.1. Models Considered
2.2. Study Site
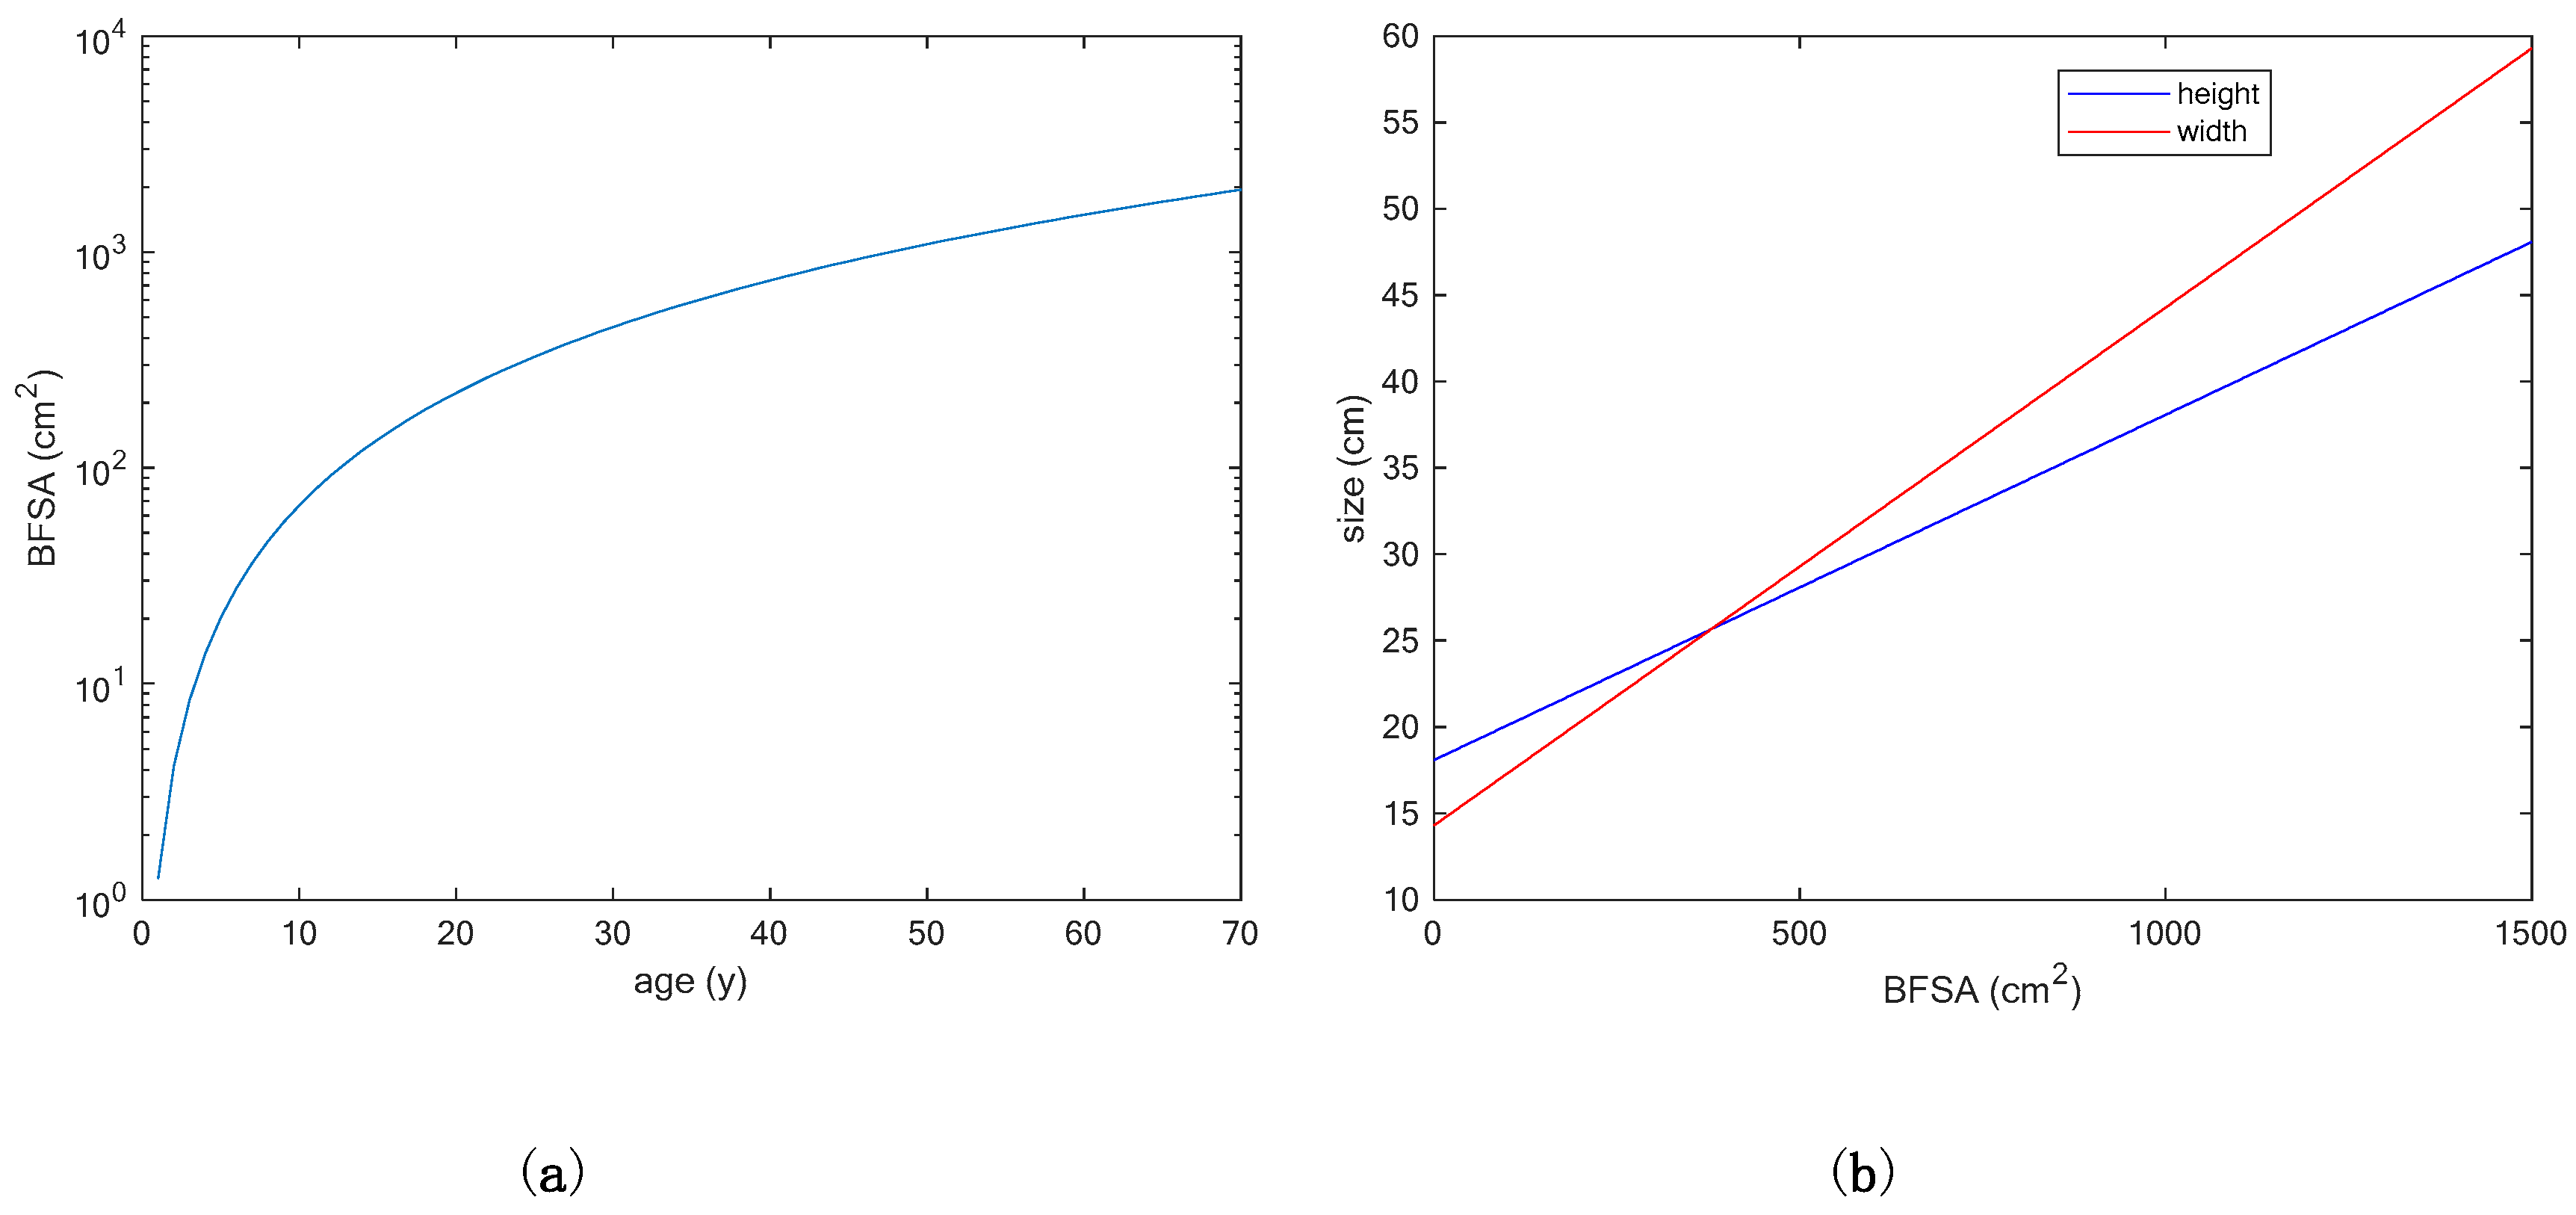
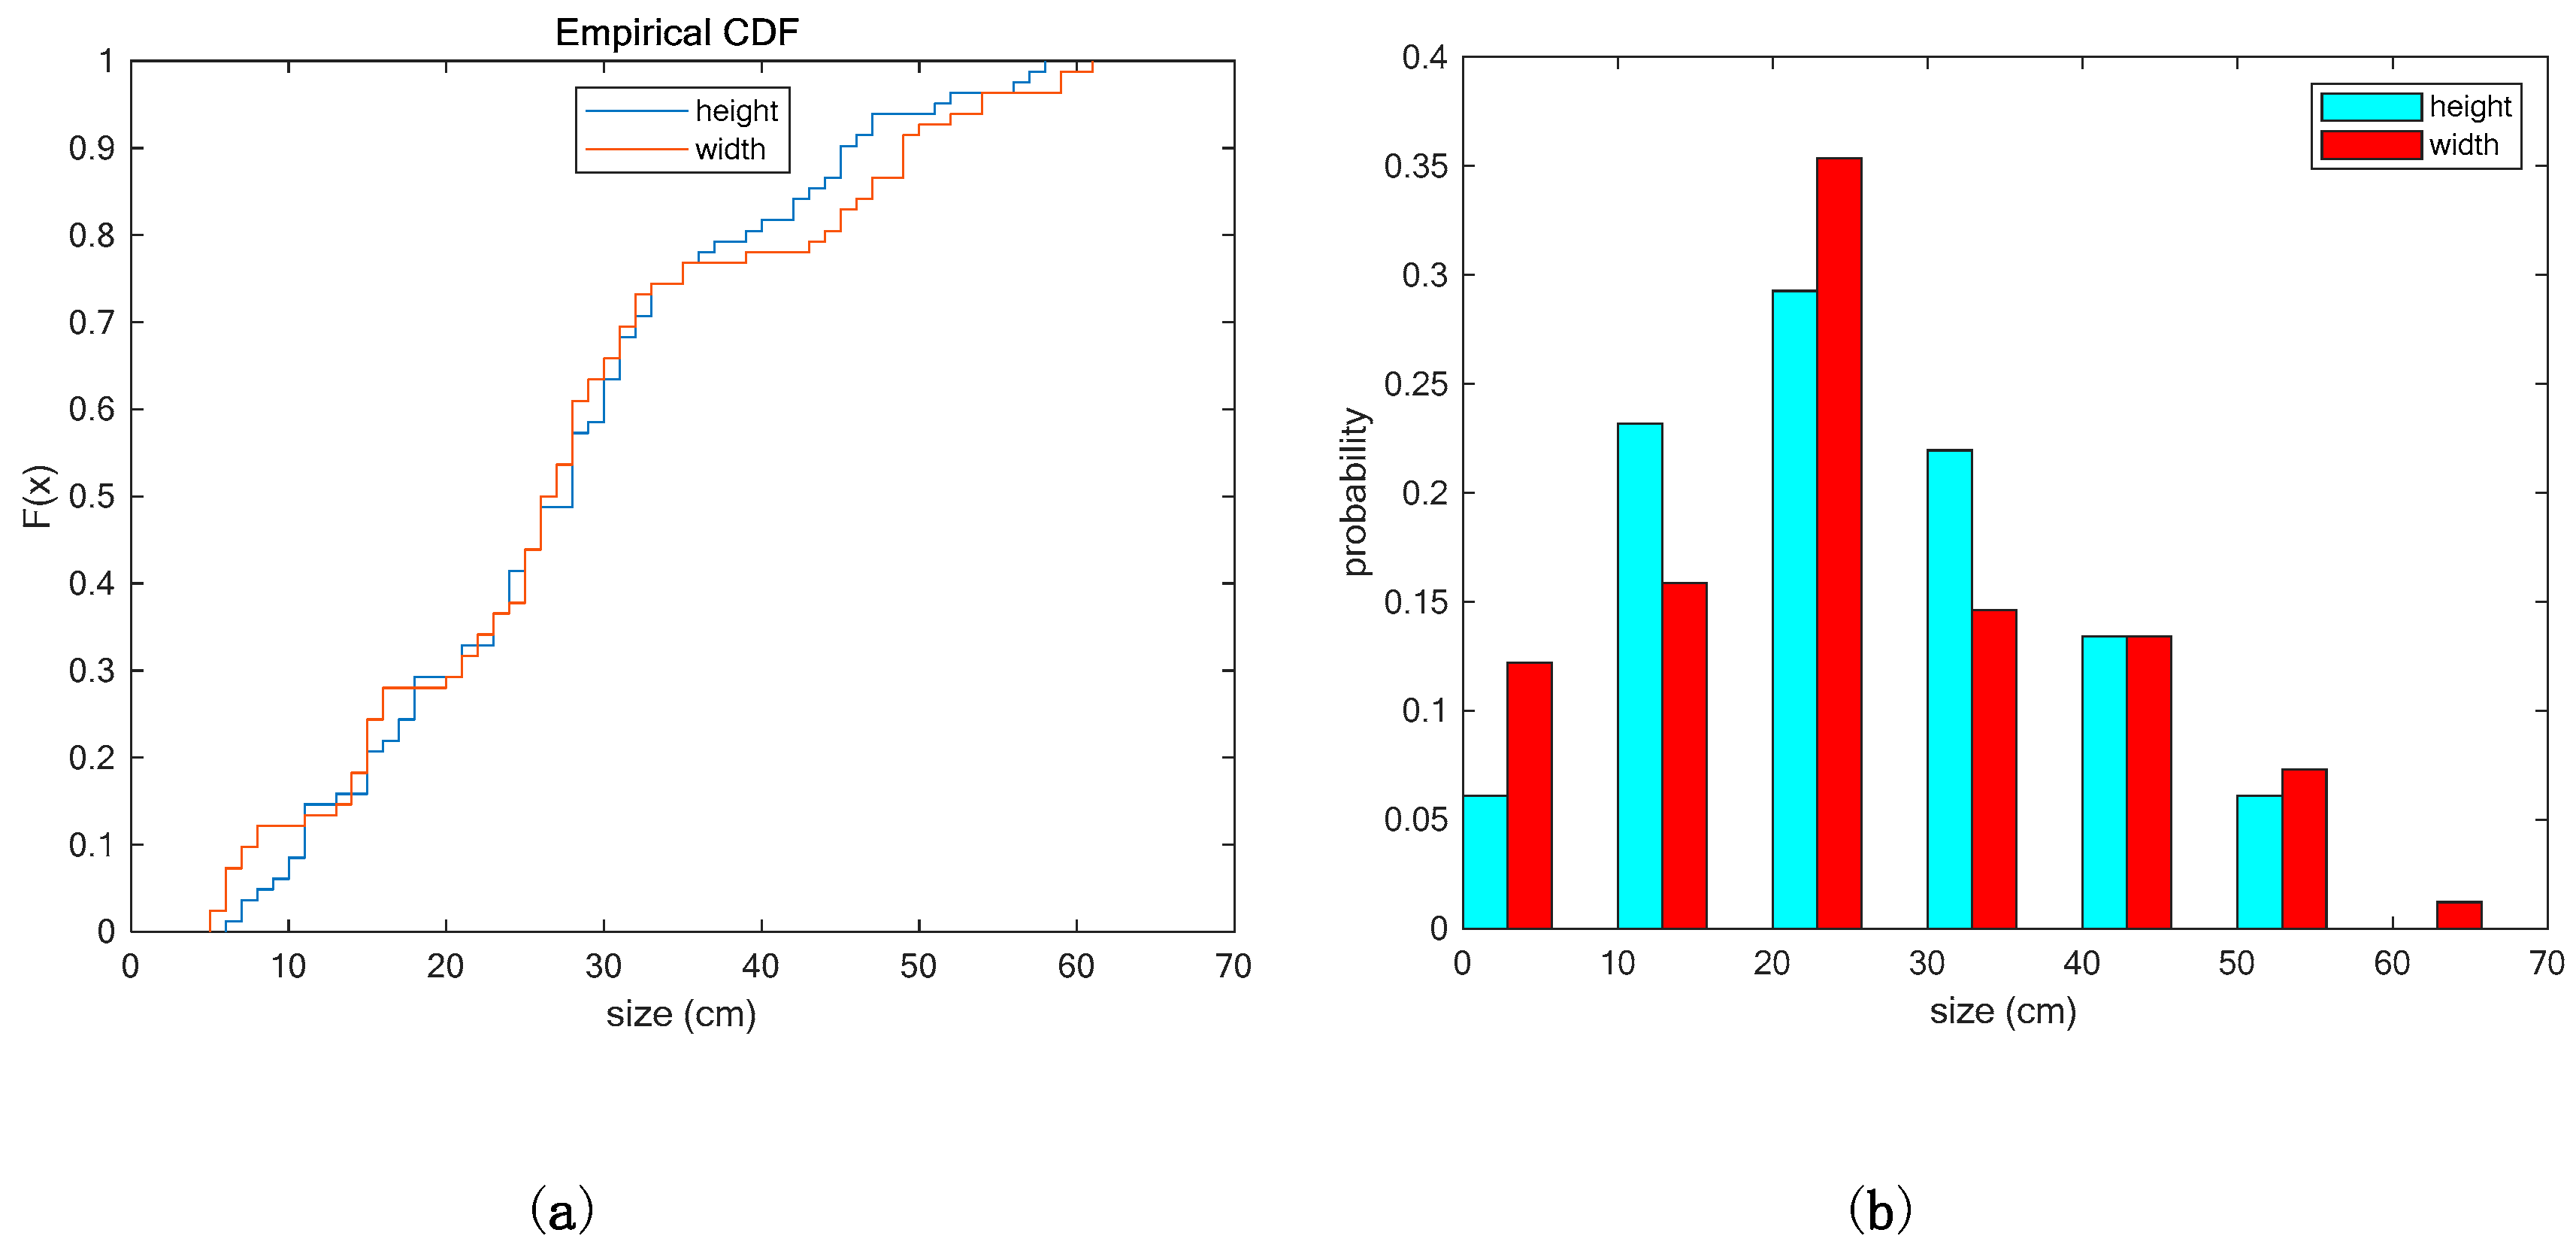
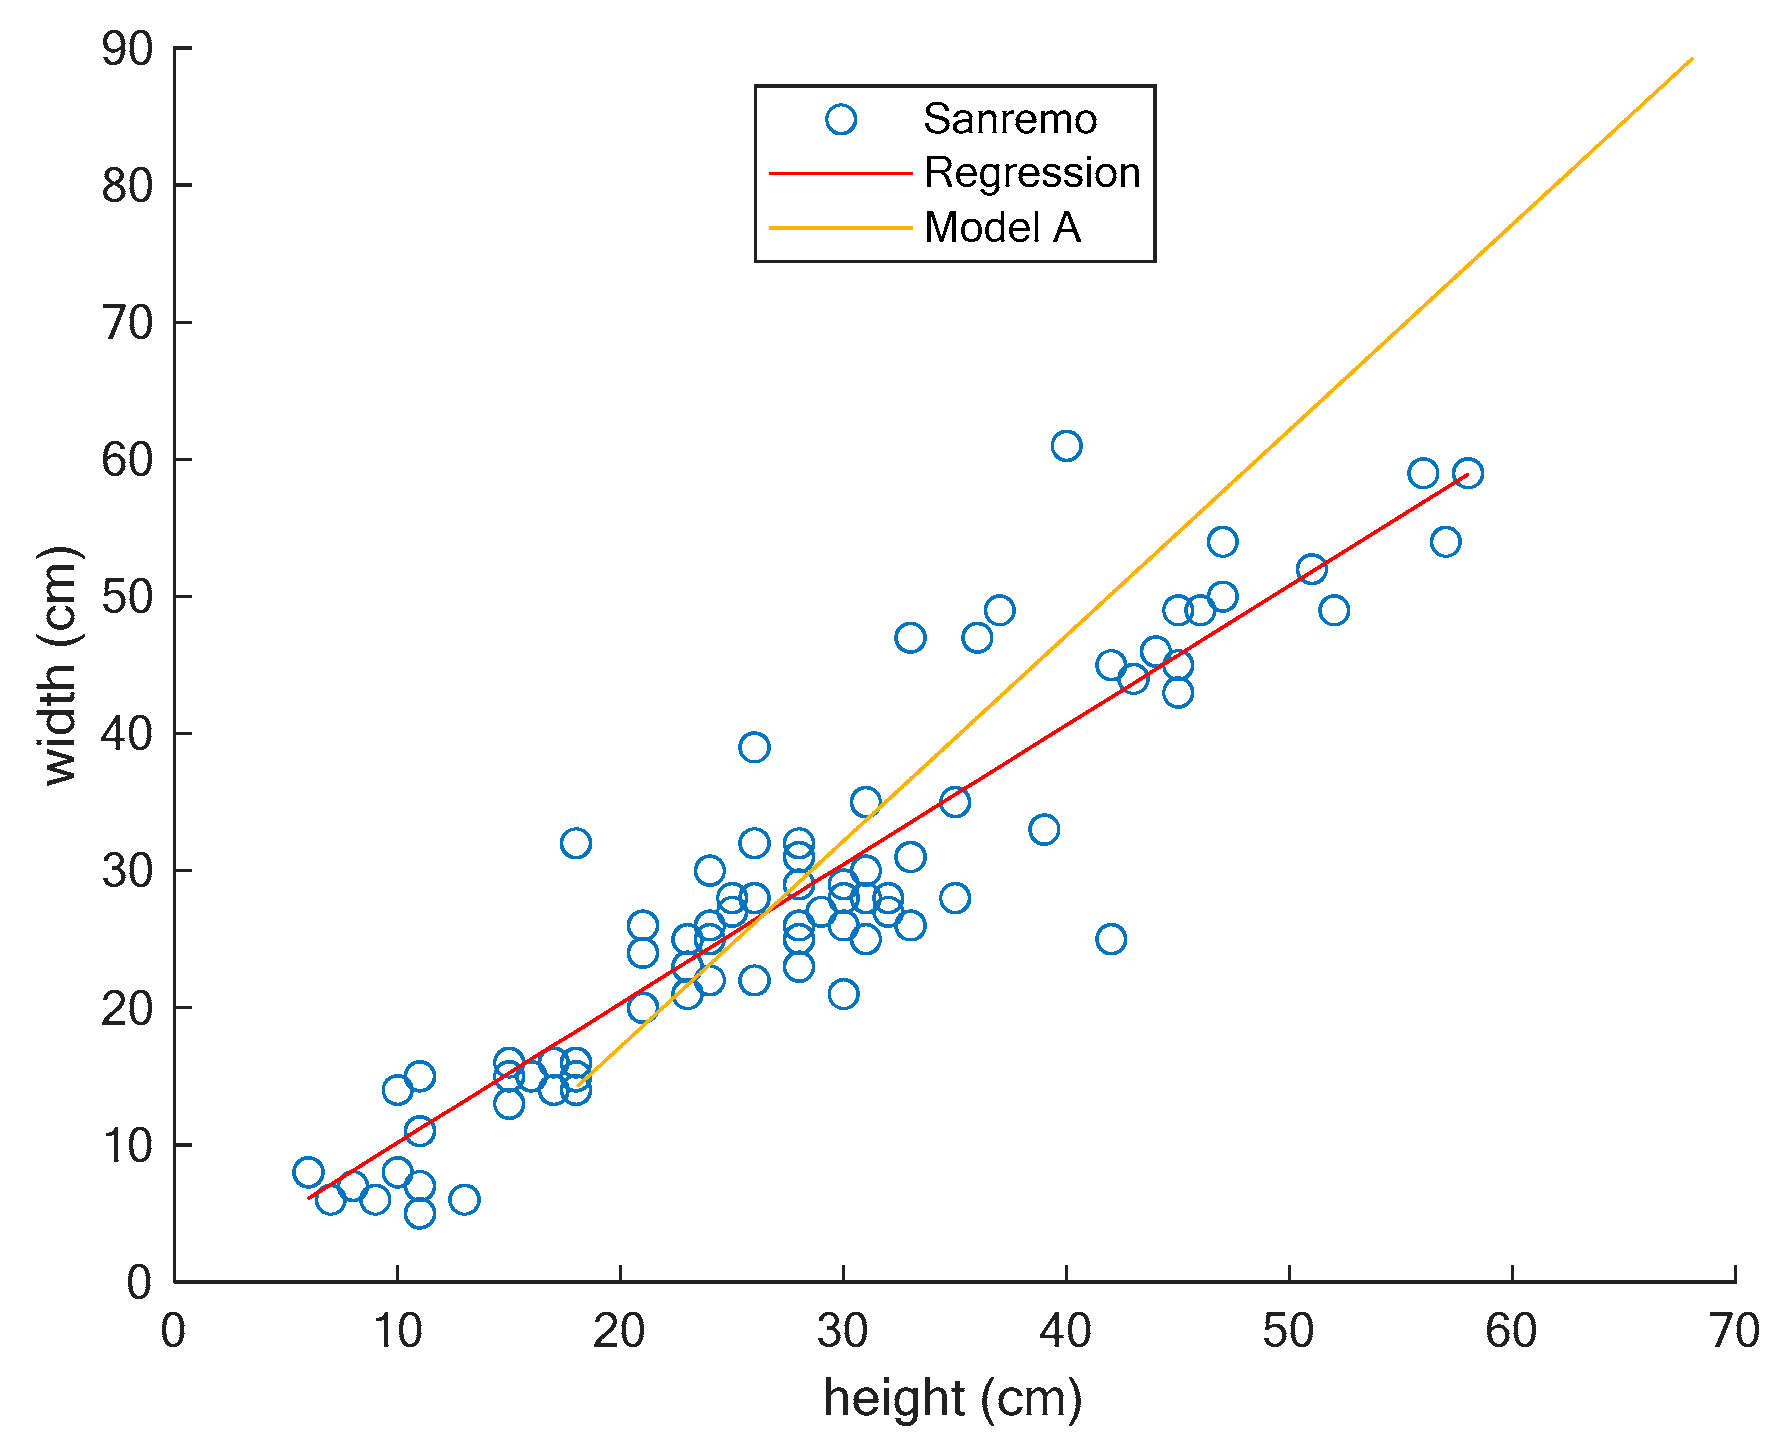
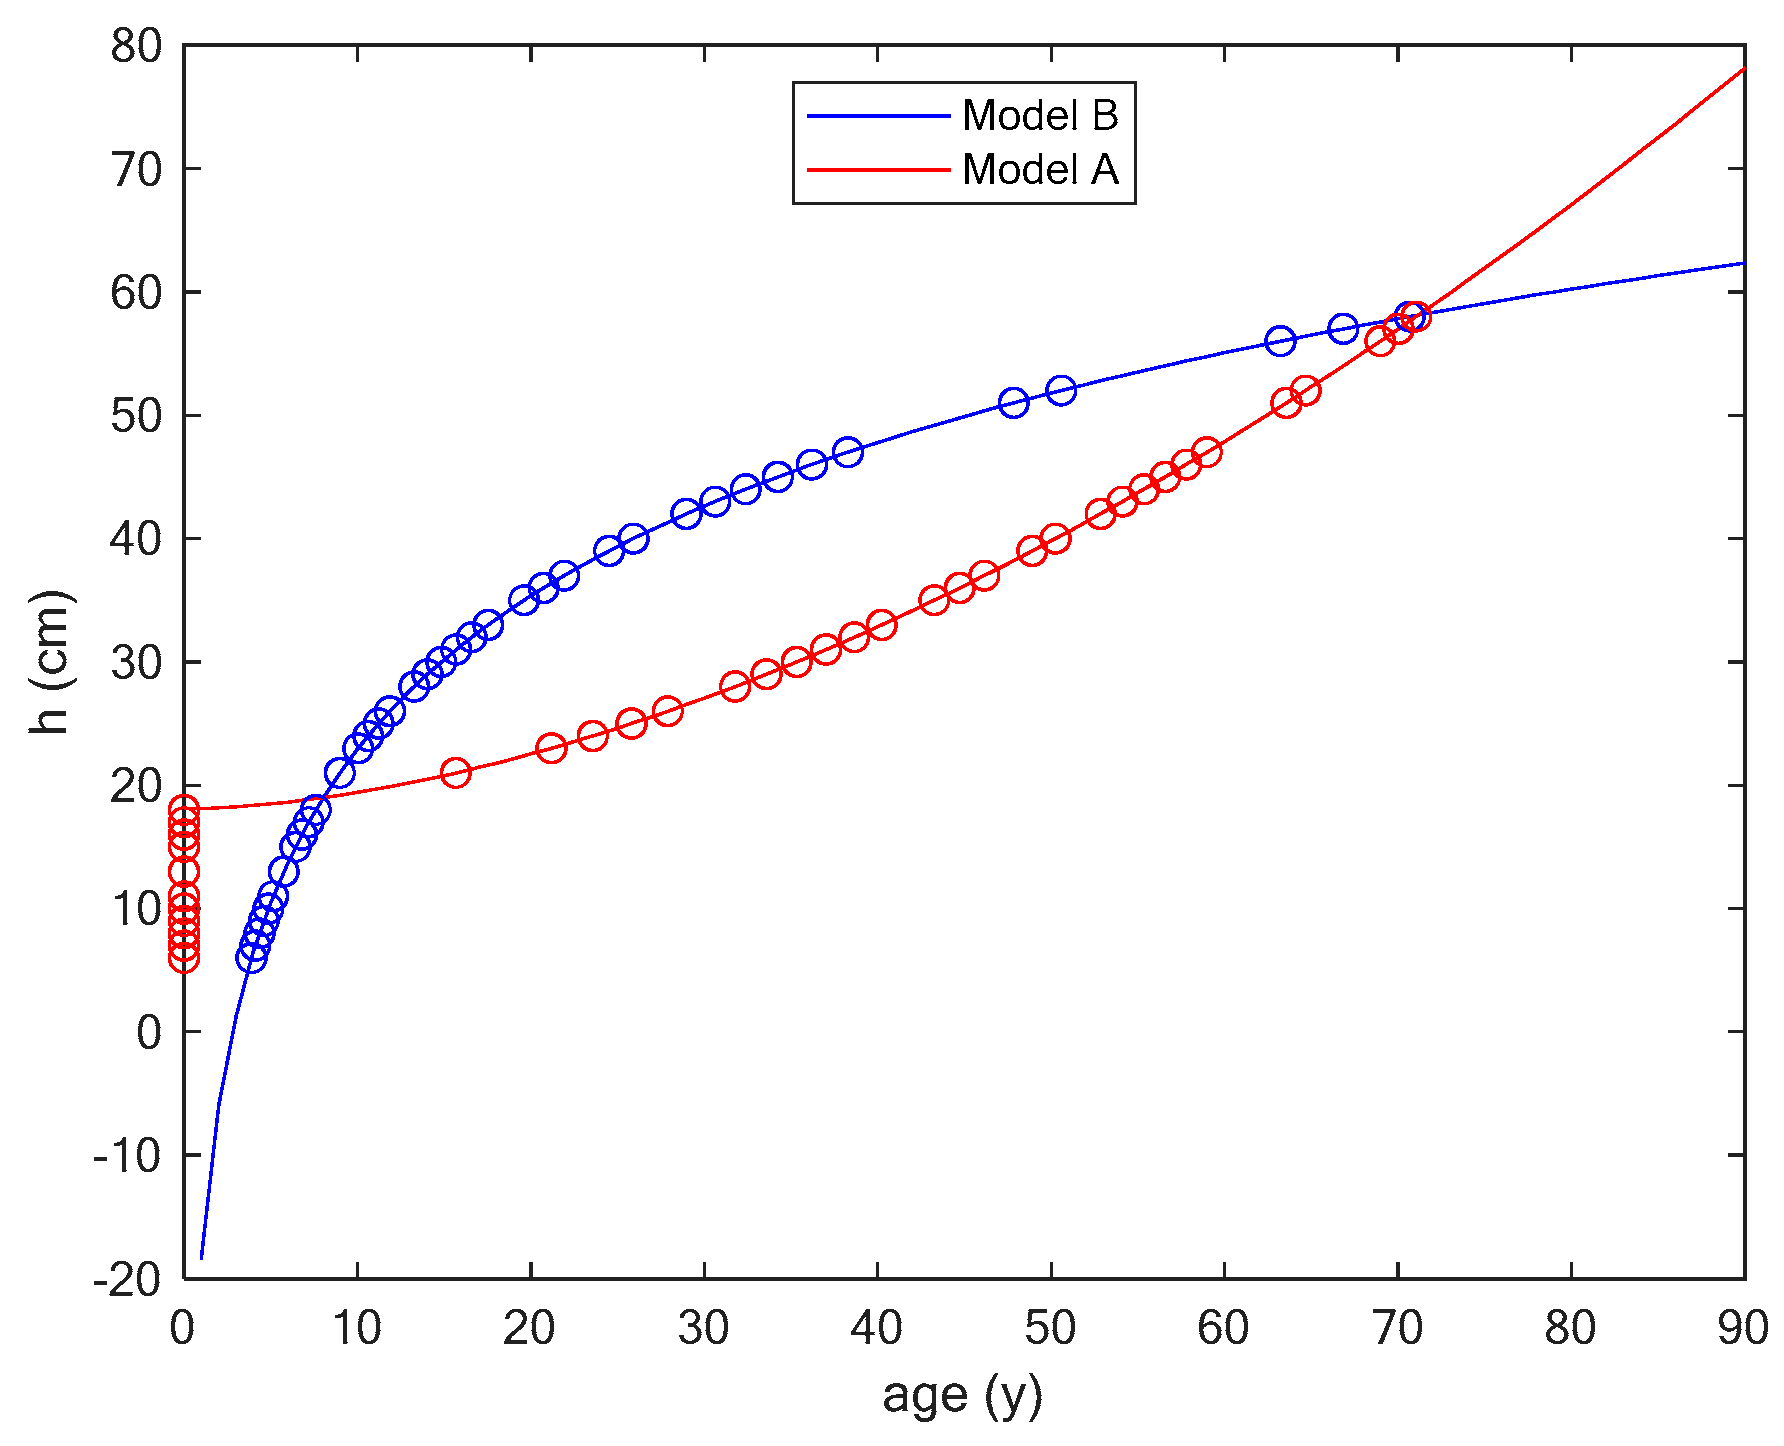
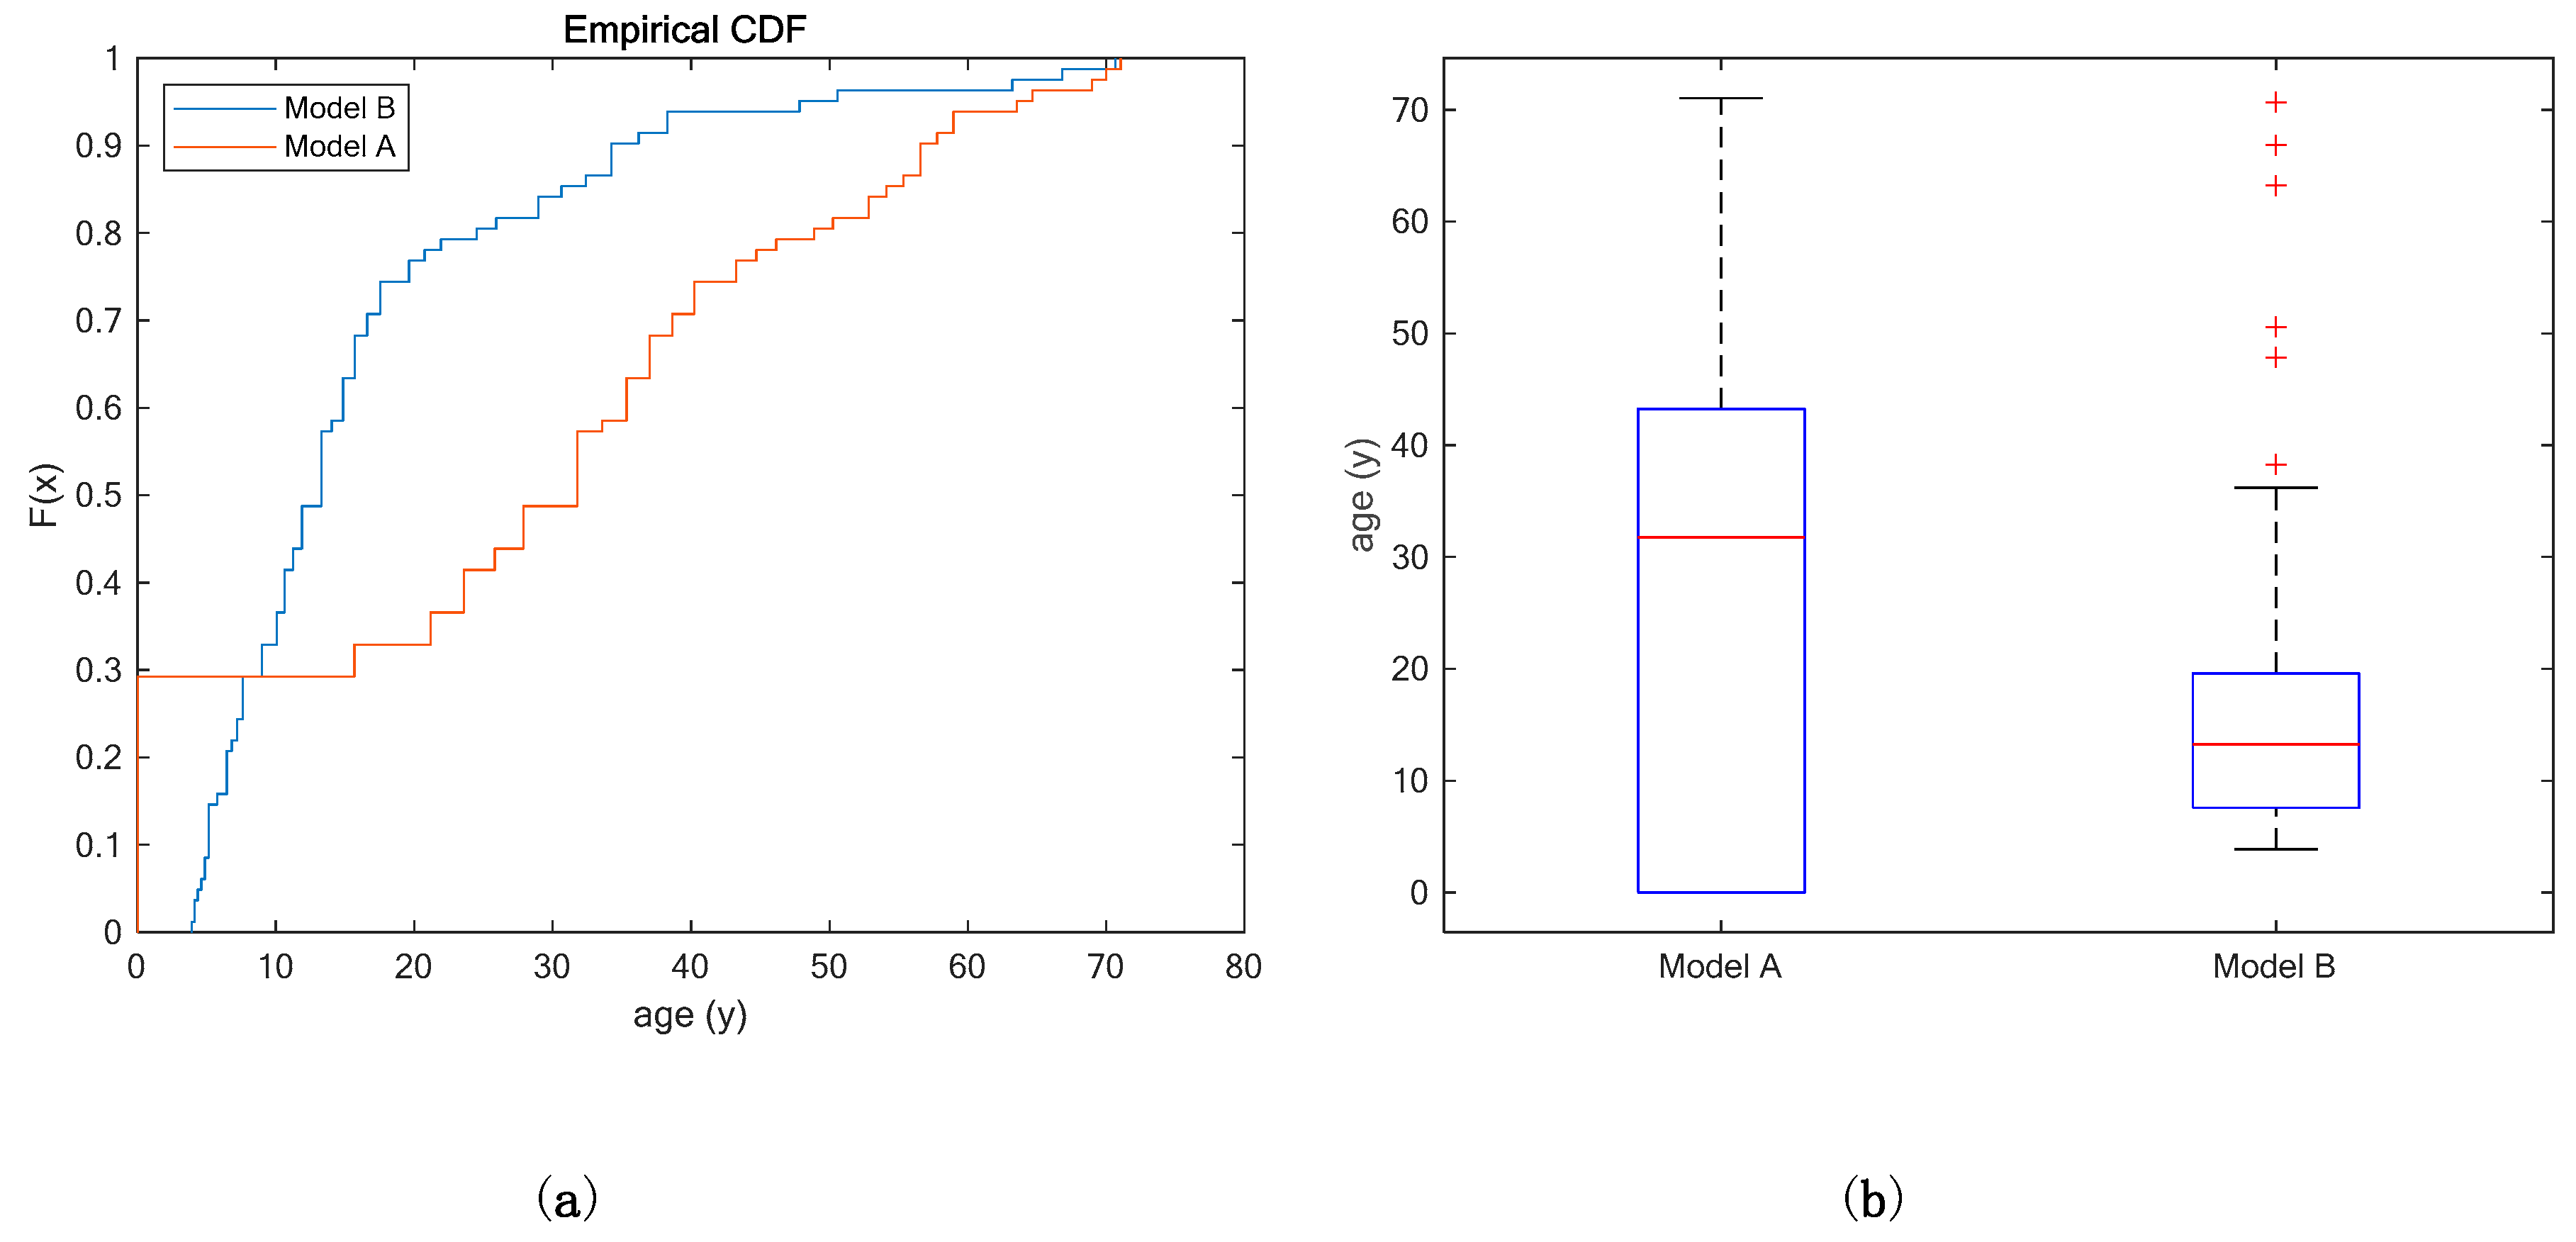
3. Results
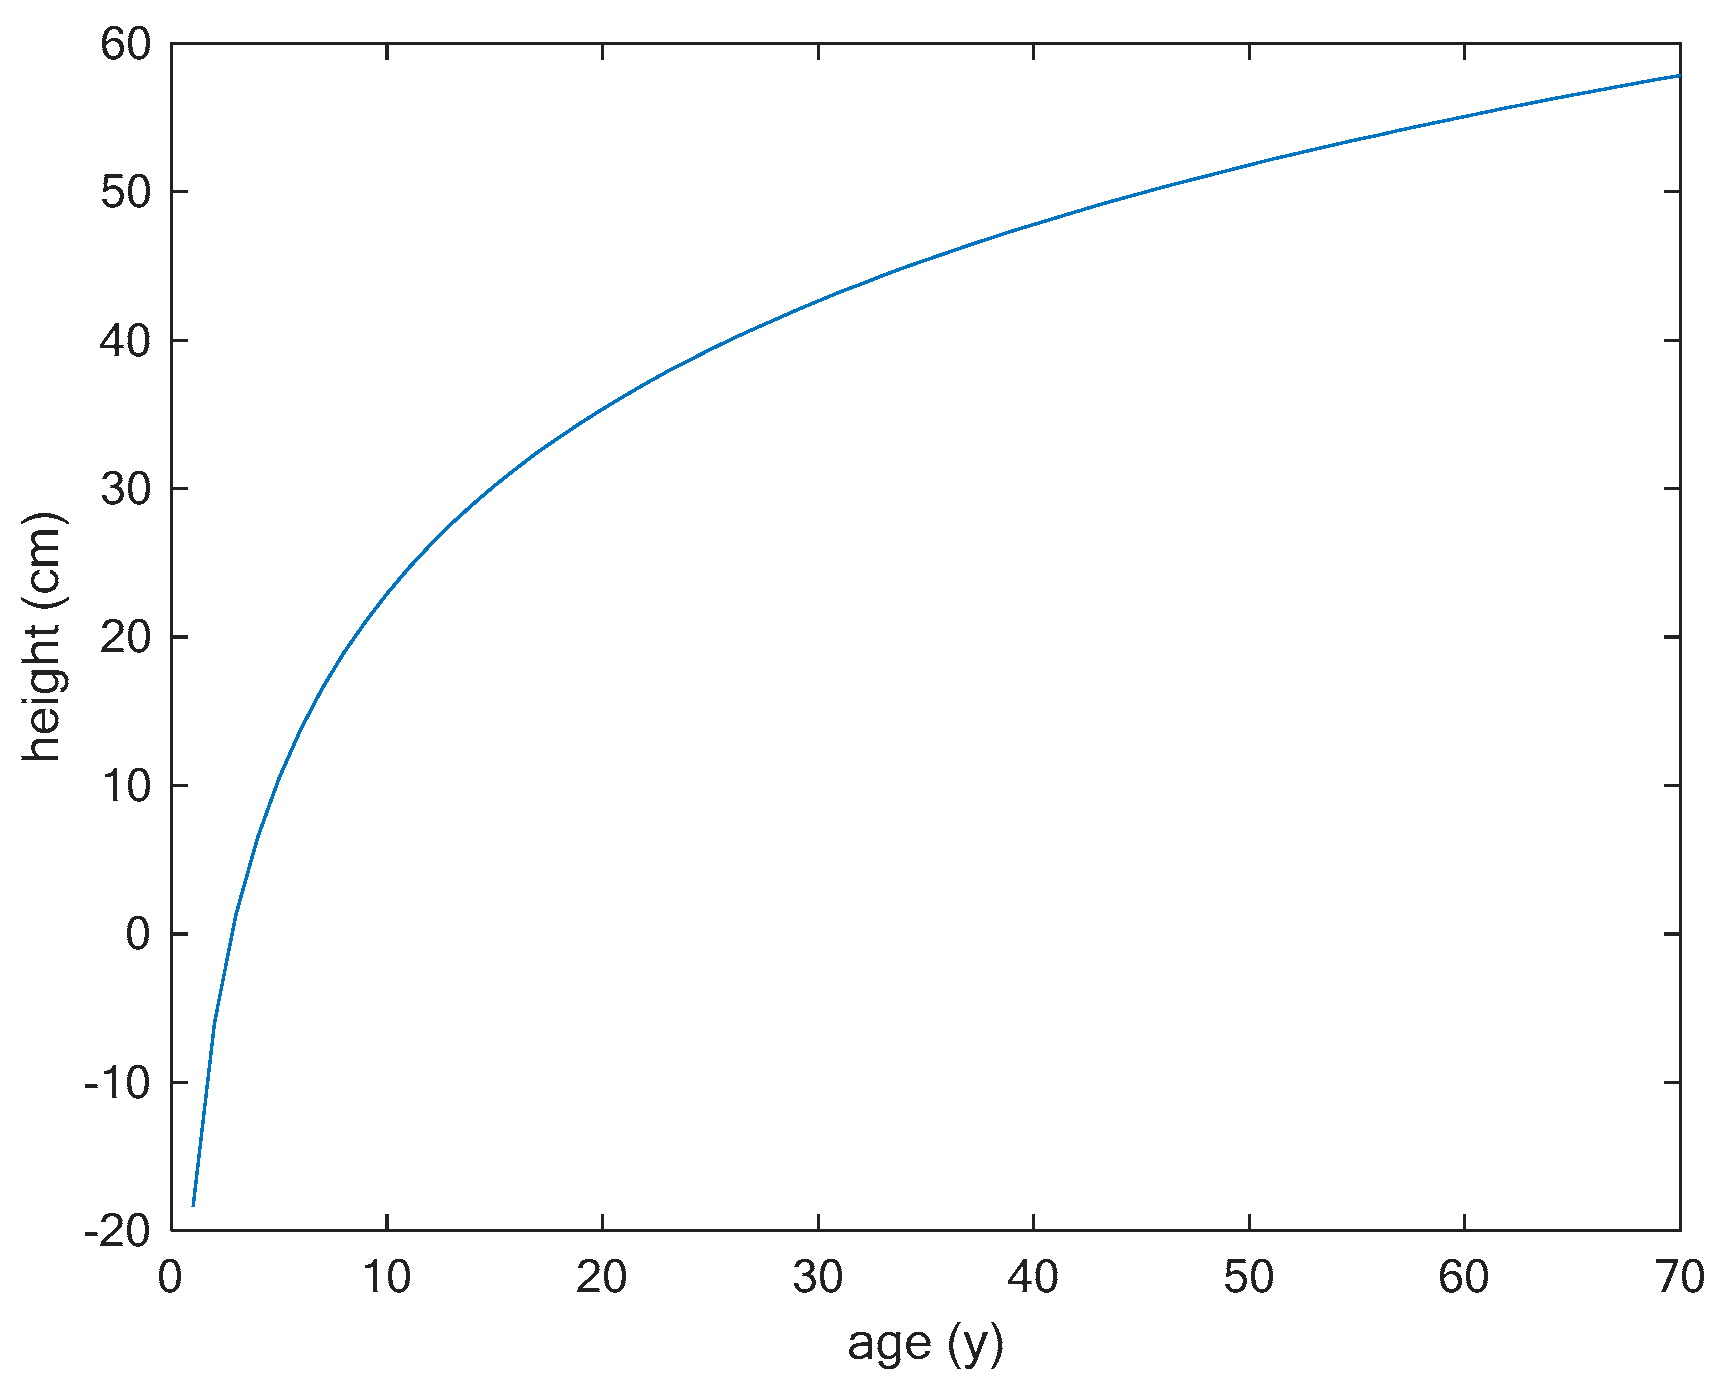
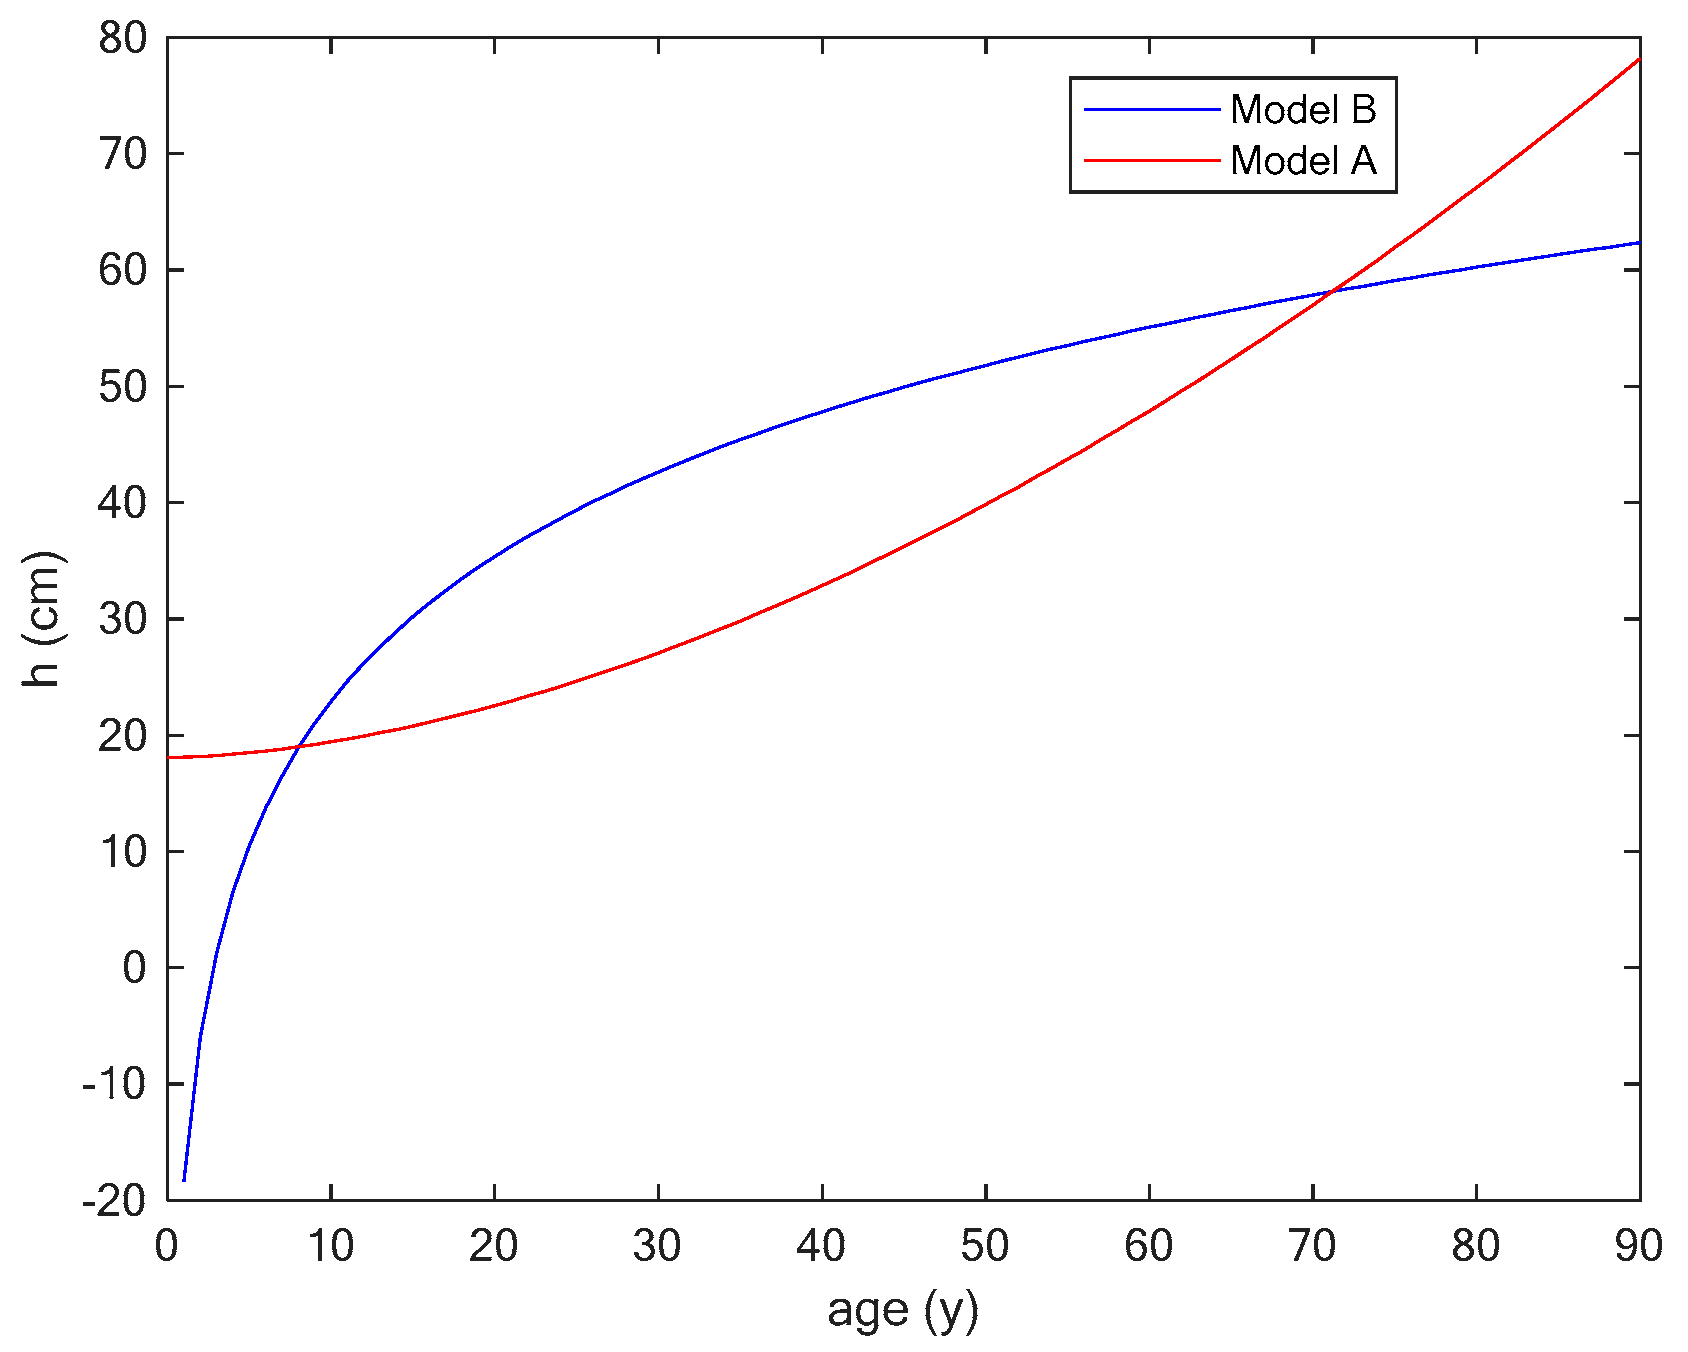
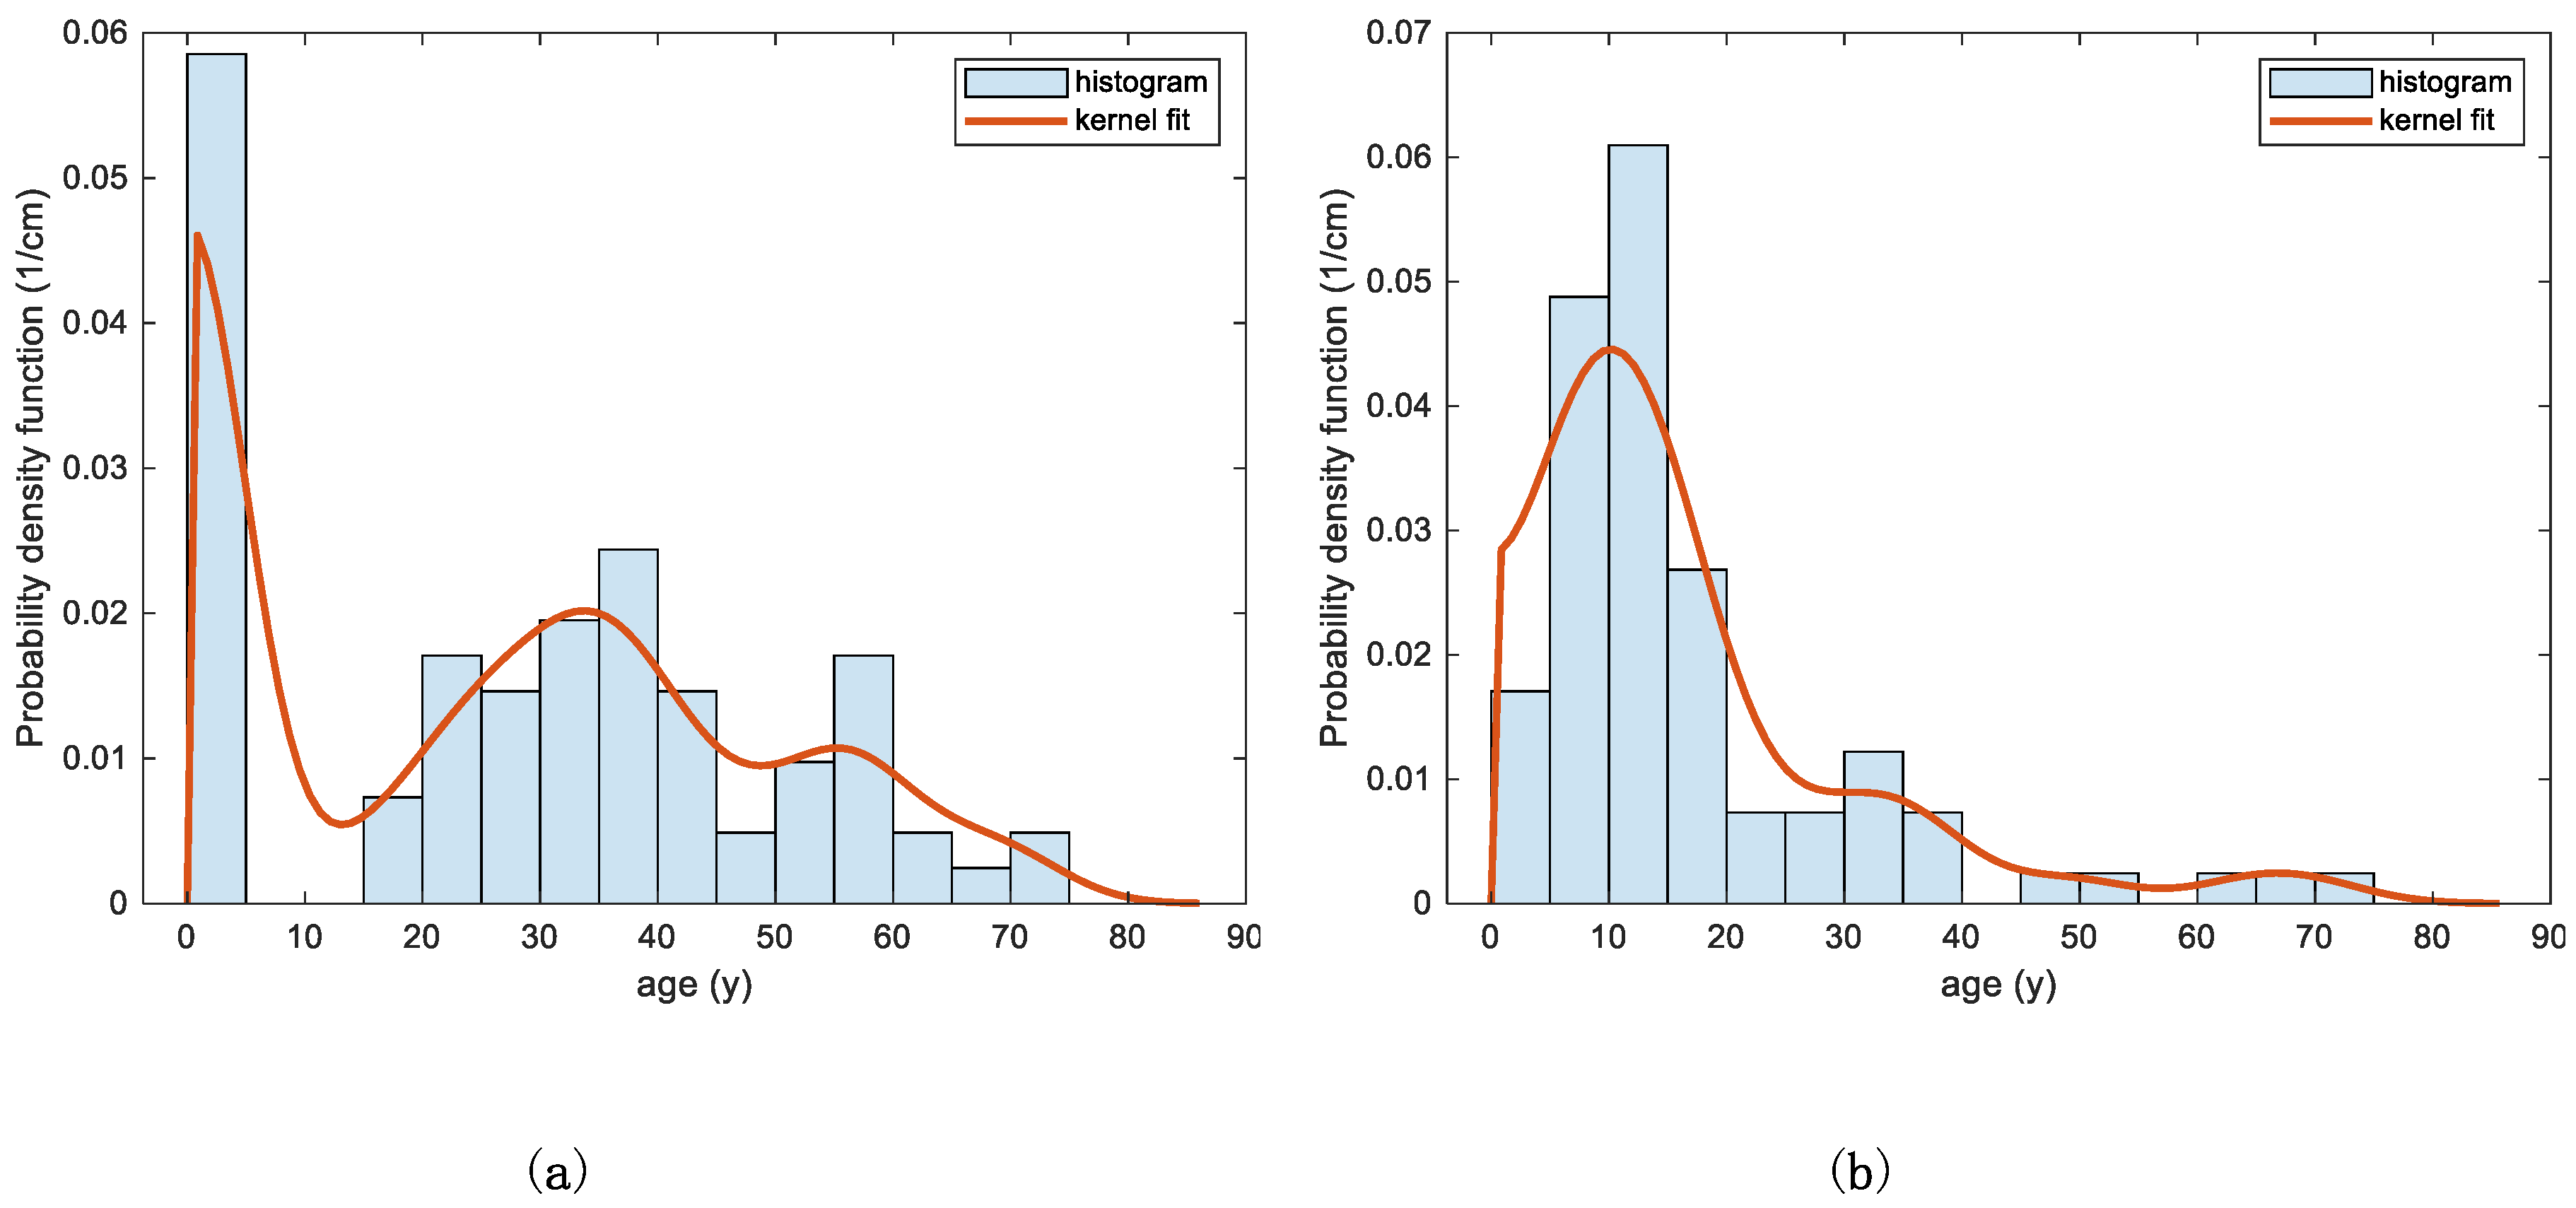
3.1. Comparing Two Different Models
3.2. Case Study
Application of the Two Models
4. Discussion
Author Contributions
Funding
Acknowledgments
Conflicts of Interest
References
- Carpine, C.; Grasshoff, M. Les Gorgonaires de la Mediterranean. Bull. Inst. Océanogr. Monaco 1975, 71, 1–140. [Google Scholar]
- Carpine, C. Contribution à la connaissance des Gorgones Holaxonia de la Mediterranean occidentale. Bull. Inst. Océanogr. Monaco 1963, 60, 1–52. [Google Scholar]
- Weinberg, S. Revision of the common Octocorallia of the Mediterranean circalittoral. I. Gorgonacea. Beaufortia 1976, 24, 63–104. [Google Scholar]
- Grasshoff, M. Die Flachwasser-Gorgonarien von Europa und Westafrika (Cnidaria, Anthozoa); Courier Forschungsinstitut Senckenberg: Berlin, Germany, 1992; pp. 1–135. [Google Scholar]
- Chimienti, G. Vulnerable forests of the pink sea fan Eunicella verrucosa in the Mediterranean Sea. Diversity 2020, 12, 176. [Google Scholar] [CrossRef]
- Sartoretto, S.; Francour, P. Bathymetric distribution and growth rates of Eunicella verrucosa (Cnidaria: Gorgoniidae) populations along the Marseilles coast (France). Sci. Mar. 2012, 76, 349–355. [Google Scholar] [CrossRef] [Green Version]
- Di Camillo, C.G.; Ponti, M.; Bavestrello, G.; Krzelj, M.; Cerrano, C. Building a baseline for habitat-forming corals by a multi-source approach, including Web Ecological Knowledge. Biodivers. Conserv. 2018, 27, 1257–1276. [Google Scholar] [CrossRef]
- Rossi, S.; Bramanti, L.; Gori, A.; Orejas, C. An overview of the animal forests of the world. In Marine Animal Forests; Rossi, S., Ed.; Springer International Publishing: Berlin, Germany, 2017; pp. 1–26. [Google Scholar]
- Gili, J.M.; Coma, R. Benthic suspension feeders: Their paramount role in littoral marine food webs. Trends Ecol. Evol. 1998, 13, 316–321. [Google Scholar] [CrossRef]
- Cerrano, C.; Danovaro, R.; Gambi, C.; Pusceddu, A.; Riva, A.; Schiaparelli, S. Gold coral (Savalia savaglia) and gorgonian forests enhance benthic biodiversity and ecosystem functioning in the mesophotic zone. Biodivers. Conserv. 2010, 19, 153–167. [Google Scholar] [CrossRef] [Green Version]
- Angeletti, L.; Taviani, M.; Canese, S.; Foglini, F.; Mastrototaro, F.; Argnani, A.; Trincardi, F.; Bakran–Petricioli, T.; Ceregato, A.; Chimienti, G.; et al. New deep-water cnidarian sites in the southern Adriatic Sea. Mediterr. Mar. Sci. 2014, 15, 225–238. [Google Scholar]
- Ponti, M.; Perlini, R.A.; Ventra, V.; Grech, D.; Abbiati, M.; Cerrano, C. Ecological shifts in Mediterranean coralligenous assemblages related to gorgonian forest loss. PLoS ONE 2014, 9, e102782. [Google Scholar] [CrossRef] [PubMed]
- Ponti, M.; Turicchia, E.; Ferro, F.; Cerrano, C.; Abbiati, M. The understorey of gorgonian forests in mesophotic temperate reefs. Aquat. Conserv. Mar. Freshw. Ecosyst. 2018, 28, 1153–1166. [Google Scholar] [CrossRef]
- Grinyó, J.; Gori, A.; Ambroso, S.; Purroy, A.; Calatayud, C.; Dominguez-Carrió, C.; Coppari, M.; Iacono, C.L.; López-González, P.J.; Gili, J.M. Diversity, distribution and population size structure of deep Mediterranean gorgonian assemblages (Menorca Channel, Western Mediterranean Sea). Prog. Oceanogr. 2016, 145, 42–56. [Google Scholar] [CrossRef]
- Mastrototaro, F.; Chimienti, G.; Acosta, J.; Blanco, J.; Garcia, S.; Rivera, J.; Aguilar, R. Isidella elongata (Cnidaria: Alcyonacea) facies in the western Mediterranean Sea: Visual surveys and descriptions of its ecological role. Eur. Zool. J. 2017, 84, 209–225. [Google Scholar] [CrossRef] [Green Version]
- Chimienti, G.; De Padova, D.; Mossa, M.; Mastrototaro, F. A mesophotic black coral forest in the Adriatic Sea. Sci. Rep. 2020, 10, 1–15. [Google Scholar] [CrossRef]
- Chimienti, G.; Angeletti, L.; Furfaro, C.; Taviani, M. Habitat, morphology and trophism of Tritonia callogorgiae sp. nov., a large nudibranch inhabiting Callogorgia verticillata forests in the Mediterranean Sea. Deep Sea Res. I Oceanogr. Res. Pap. 2020, 165, 103364. [Google Scholar] [CrossRef]
- Food and Agriculture Organization (FAO). International Guidelines for the Management of Deep-Sea Fisheries in the High Seas; FAO: Rome, Italy, 2009; pp. 1–21. [Google Scholar]
- FAO (Food and Agriculture Organization). Abandoned, lost or otherwise discarded gillnets and trammel nets: Methods to estimate ghost fishing mortality, and the status of regional monitoring and management. In FAO Fisheries and Aquaculture Technical Paper No. 600; Gilman, E., Chopin, F., Suuronen, P., Kuemlangan, B., Eds.; FAO: Rome, Italy, 2016; pp. 1–79. [Google Scholar]
- Watling, L.; Norse, E.A. Disturbance of the seabed by mobile fishing gear: A comparison to forest clearcutting. Conserv. Biol. 1998, 12, 1180–1197. [Google Scholar] [CrossRef] [Green Version]
- Stone, R.P. Coral habitat in the Aleutian Islands of Alaska: Depth distribution, fine-scale species associations, and fisheries interactions. Coral Reefs 2006, 25, 229–238. [Google Scholar] [CrossRef]
- Bo, M.; Bava, S.; Canese, S.; Angiolillo, M.; Cattaneo-Vietti, R.; Bavestrello, G. Fishing impact on deep Mediterranean rocky habitats as revealed by ROV investigation. Biol. Conserv. 2014, 171, 167–176. [Google Scholar] [CrossRef]
- Sheehan, E.V.; Rees, A.; Bridger, D.; Williams, T.; Hall-Spences, J.M. Strandings of NE Atlantic gorgonians. Biol. Conserv. 2017, 209, 482–487. [Google Scholar] [CrossRef]
- Chimienti, G.; Mastrototaro, F.; D’Onghia, G. Mesophotic and Deep-Sea Vulnerable Coral Habitats of the Mediterranean Sea: Overview and Conservation Perspectives. In Advances in the Studies of the Benthic Zone; Soto, L.A., Ed.; IntechOpen: London, UK, 2019; pp. 1–20. [Google Scholar]
- Enrichetti, F.; Dominguez-Carrió, C.; Toma, M.; Bavestrello, G.; Betti, F.; Canese, S.; Bo, M. Megabenthic communities of the Ligurian deep continental shelf and shelf break (NW Mediterranean Sea). PLoS ONE 2019, 14, e0223949. [Google Scholar] [CrossRef] [PubMed] [Green Version]
- Morato, T.; González-Irusta, J.M.; Dominguez-Carrió, C.; Wei, C.L.; Davies, A.; Sweetman, A.K.; Taranto, G.H.; Beazley, L.; García-Alegre, A.; Grehan, A.; et al. Climate-induced changes in the suitable habitat of cold-water corals and commercially important deep-sea fishes in the North Atlantic. Glob. Chang. Biol. 2020, 26, 2181–2202. [Google Scholar] [CrossRef] [PubMed]
- HMSO Wildlife and Countryside Act. 1981 (London). Available online: www.legislation.gov.uk/ukpga/1981/69/section/28P (accessed on 29 September 2020).
- Hiscock, K. Where have all the corals gone? Mar. Conserv. 2003, 6, 8–9. [Google Scholar]
- Pikesley, S.K.; Godley, B.J.; Latham, H.; Richardson, P.B.; Robson, L.M.; Solandt, J.L.; Trundle, C.; Wood, C.; Witt, M.J. Pink sea fans (Eunicella verrucosa) as indicators of the spatial efficacy of Marine Protected Areas in southwest UK coastal waters. Mar. Policy 2016, 64, 38–45. [Google Scholar] [CrossRef]
- The IUCN Red List of Threatened Species. Version 2020-2. Available online: www.iucnredlist.org (accessed on 29 September 2020).
- Otero, M.M.; Numa, C.; Bo, M.; Orejas, C.; Garrabou, J.; Cerrano, C.; Kružić, P.; Antoniadou, C.; Aguilar, R.; Kipson, S.; et al. Overview of the Conservation Status of Mediterranean Anthozoans; IUCN: Málaga, Spain, 2017; pp. 1–73. [Google Scholar]
- Chimienti, G.; Bo, M.; Mastrototaro, F. Know the distribution to assess the changes: Mediterranean cold-water coral bioconstructions. Rend. Lincei Sci. Fis. Nat. 2018, 29, 583–588. [Google Scholar] [CrossRef]
- Coz, R.; Ouisse, V.; Artero, C.; Carpentier, A.; Crave, A.; Feunteun, E.; Olivier, J.M.; Perrin, B.; Ysnel, F. Development of a new standardised method for sustainable monitoring of the vulnerable pink sea fan Eunicella verrucosa. Mar. Biol. 2012, 159, 1375–1388. [Google Scholar] [CrossRef]
- Mistri, M.; Ceccherelli, V.U. Growth of the Mediterranean gorgonian Lophogorgia ceratophyta (L., 1758). Mar. Ecol. 1993, 14, 329–340. [Google Scholar] [CrossRef]
- Coma, R.; Ribes, M.; Zabala, M.; Gili, J.M. Growth in a modular colonial marine invertebrates. Estuar. Coast. Shelf Sci. 1998, 47, 459–470. [Google Scholar] [CrossRef] [Green Version]
- Andrews, A.H.; Cordes, E.E.; Mahoney, M.M.; Munk, K.; Coale, K.H.; Caillet, G.M.; Heifetz, J. Age, growth and radiometric age validation of a deep-sea, habitat-forming gorgonian (Primnoa resedaeformis) from the Gulf of Alaska. Hydrobiologia 2002, 471, 101–110. [Google Scholar] [CrossRef]
- Skoufas, G.; Poulicek, M.; Chintiroglou, C.C. Growth variation of Eunicella singularis (Esper, 1794) (Gorgonacea, Anthozoa). Belg. J. Zool. 2000, 130, 125–128. [Google Scholar]
- Weinbauer, M.; Velimirov, B. Population dynamics and overgrowth of the sea fan Eunicella cavolinii (Coelenterata: Octocorallia). Estuar. Coast. Shelf. Sci. 1996, 42, 583–595. [Google Scholar] [CrossRef]
- Roark, E.; Guilderson, T.P.; Dunbar, R.B.; Ingram, B. Radiocarbon-based ages and growth rates of Hawaiian deep-sea corals. Mar. Ecol. Prog. Ser. 2006, 327, 1–14. [Google Scholar] [CrossRef] [Green Version]
- Bo, M.; Bavestrello, G.; Angiolillo, M.; Calcagnile, L.; Canese, S.; Cannas, R.; Cau, A.; D’Elia, M.; D’Oriano, F.; Follesa, M.C.; et al. Persistence of Pristine Deep-Sea Coral Gardens in the Mediterranean Sea (SW Sardinia). PLoS ONE 2015, 10, e0119393. [Google Scholar] [CrossRef] [PubMed] [Green Version]
- Lartaud, F.; Mouchi, V.; Chapron, L.; Meistertzheim, A.L.; Le Bris, N. Growth patterns of Mediterranean calcifying cold-water corals. In Mediterranean Cold-Water Corals: Past, Present and Future; Orejas, C., Jimennez, C., Eds.; Springer International Publishing: Berlin, Germany, 2019; pp. 405–422. [Google Scholar]
- Grigg, R.W. Growth rings: Annual periodicity in two gorgonians corals. Ecology 1974, 55, 876–881. [Google Scholar] [CrossRef]
- Goffredo, S.; Lasker, H.R. Modular growth of a gorgonian coral can generate predictable patterns of colony growth. J. Exp. Mar. Biol. Ecol. 2006, 336, 221–229. [Google Scholar] [CrossRef]
- Sheehan, E.V.; Stevens, T.F.; Gall, S.C.; Cousens, S.L.; Attrill, M.J. Recovery of a temperate reef assemblage in a Marine Protected Area following the exclusion of towed demersal fishing. PLoS ONE 2013, 8, e83883. [Google Scholar] [CrossRef]
- Sampaio, I.; Braga-Henriques, A.; Pham, C.; Ocaña, O.; De Matos, V.; Morato, T.; Porteiro, F.M. Cold-water corals landed by bottom longline fisheries in the Azores (north-eastern Atlantic). J. Mar. Biol. Assoc. UK 2012, 92, 1547–1555. [Google Scholar] [CrossRef]
- Mytilineou, C.; Smith, C.J.; Anastasopoulou, A.; Papadopoulou, K.N.; Christidis, G.; Bekas, P.; Kavadas, S.; Dokos, J. New cold-water coral occurrences in the eastern Ionian Sea: Results from experimental long line fishing. Deep Sea Res. Part. II Top. Stud. Oceanogr. 2014, 99, 146–157. [Google Scholar] [CrossRef]
- Kenchington, E.; Murillo, F.J.; Lirette, C.; Sacau, M.; Koen-Alonso, M.; Kenny, A.; Ollerhead, N.; Wareham, V.; Beazley, L. Kernel density surface modelling as a means to identify significant concentrations of vulnerable marine ecosystem indicators. PLoS ONE 2014, 9, e109365. [Google Scholar] [CrossRef]
- Terribile, K.; Evans, J.; Knittweis, L.; Schembri, P.J. Maximising MEDITS: Using data collected from trawl surveys to characterise the benthic and demersal assemblages of the circalittoral and deeper waters around the Maltese Islands (Central Mediterranean). Reg. Stud. Mar. Sci. 2016, 3, 163–175. [Google Scholar] [CrossRef]
- Chimienti, G.; Angeletti, L.; Rizzo, L.; Tursi, A.; Mastrototaro, F. ROV vs. trawling approaches in the study of benthic communities: The case of Pennatula rubra (Cnidaria: Cennatulacea). J. Mar. Biol. Assoc. UK 2018, 98, 1859–1869. [Google Scholar] [CrossRef]
- Bastari, A.; Pica, D.; Ferretti, F.; Micheli, F.; Cerrano, C. Sea pens in the Mediterranean Sea: Habitat suitability and opportunities for ecosystem recovery. ICES J. Mar. Sci. 2018, 75, 1722–1732. [Google Scholar] [CrossRef]
- Chimienti, G.; Di Nisio, A.; Lanzolla, A.M.L.; Andria, G.; Tursi, A.; Mastrototaro, F. Towards non-invasive methods to assess population structure and biomass in vulnerable sea pen fields. Sensors 2019, 19, 2255. [Google Scholar] [CrossRef] [PubMed] [Green Version]
- Gleason, A.C.R.; Reid, R.P.; Voss, K.J. Automated classification of underwater multispectral imagery for coral reef monitoring. In Proceedings of the OCEANS 2007, Vancouver, BC, Canada, 29 September–4 October 2007; pp. 1–8. [Google Scholar]
- Phinn, S.R.; Roelfsema, C.M.; Mumby, P.J. Multi-scale, object-based image analysis for mapping geomorphic and ecological zones on coral reefs. Int. J. Remote Sens. 2012, 33, 3768–3797. [Google Scholar] [CrossRef]
- Foglini, F.; Grande, V.; Marchese, F.; Bracchi, V.A.; Prampolini, M.; Angeletti, L.; Castellan, G.; Chimienti, G.; Hansen, I.M.; Gudmundsen, M.; et al. Underwater Hyperspectral Imaging for seafloor and benthic habitat mapping in the southern Adriatic Sea (Italy). In Proceedings of the 2018 IEEE International Workshop on Metrology for the Sea, Learning to Measure Sea Health Parameters (MetroSea), Bari, Italy, 8–10 October 2018; pp. 201–205. [Google Scholar]
- Foglini, F.; Grande, V.; Marchese, F.; Bracchi, V.A.; Prampolini, M.; Angeletti, L.; Castellan, G.; Chimienti, G.; Hansen, I.M.; Gudmundsen, M.; et al. Application of Hyperspectral Imaging to Underwater Habitat Mapping, Southern Adriatic Sea. Sensors 2019, 19, 2261. [Google Scholar] [CrossRef] [Green Version]
- Dumke, I.; Purser, A.; Marcon, Y.; Nornes, S.M.; Johnsen, G.; Ludvigsen, M.; Søreide, F. Underwater hyperspectral imaging as an in situ taxonomic tool for deep-sea megafauna. Sci. Rep. 2018, 8, 12860. [Google Scholar] [CrossRef] [Green Version]
- Di Nisio, A.; Adamo, F.; Acciani, G.; Attivissimo, F. Fast Detection of Olive Trees Affected by Xylella fastidiosa from UAVs Using Multispectral Imaging. Sensors 2020, 20, 4915. [Google Scholar] [CrossRef]
- Volent, Z.; Johnsen, G.; Sigernes, F. Kelp forest mapping by use of airborne hyperspectral imager. J. Appl. Remote Sens. 2007, 1, 011505. [Google Scholar]
- Johnsen, G.; Volent, Z.; Dierssen, H.; Pettersen, R.; Ardelan, M.V.; Søreide, F.; Fearns, P.; Ludvigsen, M.; Moline, M. Underwater hyperspectral imagery to create biogeochemical maps of seafloor properties. In Subsea Optics and Imaging, 1st ed.; Watson, J., Zielinski, O., Eds.; Elsevier: Amsterdam, The Netherlands, 2013; pp. 508–540. [Google Scholar]


| Mean (cm) | Median (cm) | Standard Deviation (cm2) | Skewness (cm3/cm3) | Kurtosis (cm4/cm4) | |
|---|---|---|---|---|---|
| Height | 27.6 | 28.0 | 12.8 | 0.4 | 2.6 1 |
| Width | 27.9 | 26.5 | 14.6 | 0.4 | 2.4 |
| Mean (y) | Median (y) | Standard Deviation (y2) | Skewness (y3/y3) | Kurtosis (y4/y4) | |
|---|---|---|---|---|---|
| Model A | 27.9 | 31.8 | 21.9 | 0.1 | 1.9 |
| Model B | 17.0 | 13.3 | 14.3 | 2.0 | 6.8 1 |
Publisher’s Note: MDPI stays neutral with regard to jurisdictional claims in published maps and institutional affiliations. |
© 2020 by the authors. Licensee MDPI, Basel, Switzerland. This article is an open access article distributed under the terms and conditions of the Creative Commons Attribution (CC BY) license (http://creativecommons.org/licenses/by/4.0/).
Share and Cite
Chimienti, G.; Di Nisio, A.; Lanzolla, A.M.L. Size/Age Models for Monitoring of the Pink Sea Fan Eunicella verrucosa (Cnidaria: Alcyonacea) and a Case Study Application. J. Mar. Sci. Eng. 2020, 8, 951. https://doi.org/10.3390/jmse8110951
Chimienti G, Di Nisio A, Lanzolla AML. Size/Age Models for Monitoring of the Pink Sea Fan Eunicella verrucosa (Cnidaria: Alcyonacea) and a Case Study Application. Journal of Marine Science and Engineering. 2020; 8(11):951. https://doi.org/10.3390/jmse8110951
Chicago/Turabian StyleChimienti, Giovanni, Attilio Di Nisio, and Anna M.L. Lanzolla. 2020. "Size/Age Models for Monitoring of the Pink Sea Fan Eunicella verrucosa (Cnidaria: Alcyonacea) and a Case Study Application" Journal of Marine Science and Engineering 8, no. 11: 951. https://doi.org/10.3390/jmse8110951