Portable Waveguide-Based Optical Biosensor
by
 , ,
, ,
Philip A. Kocheril
1 ,
,
Kiersten D. Lenz
1,
David D. L. Mascareñas
2,
John E. Morales-Garcia
2,
Aaron S. Anderson
1 and
Harshini Mukundan
1,* 
1
Physical Chemistry and Applied Spectroscopy Group, Chemistry Division, Los Alamos National Laboratory, Los Alamos, NM 87545, USA
2
National Security Education Center, Los Alamos National Laboratory, Los Alamos, NM 87545, USA
*
Author to whom correspondence should be addressed.
Biosensors 2022, 12(4), 195; https://doi.org/10.3390/bios12040195
Submission received: 11 February 2022
/
Revised: 16 March 2022
/
Accepted: 17 March 2022
/
Published: 25 March 2022
(This article belongs to the Special Issue Portable Optical Biosensor Devices)
Abstract
:Rapid, on-site diagnostics allow for timely intervention and response for warfighter support, environmental monitoring, and global health needs. Portable optical biosensors are being widely pursued as a means of achieving fieldable biosensing due to the potential speed and accuracy of optical detection. We recently developed the portable engineered analytic sensor with automated sampling (PEGASUS) with the goal of developing a fieldable, generalizable biosensing platform. Here, we detail the development of PEGASUS’s sensing hardware and use a test-bed system of identical sensing hardware and software to demonstrate detection of a fluorescent conjugate at 1 nM through biotin-streptavidin chemistry.
1. Introduction
Point-of-care diagnostics are essential for early community intervention during outbreaks and to guide treatment decisions for various diseases. The term “point-of-care” describes all diagnostic tests that can be performed as close as possible to the patient, providing analytical results in a very short period for an immediate diagnostic or therapeutic decision. Point-of-care biomarker diagnostics require (1) the identification of critical, specific biomarkers, (2) the development of assays for their measurement in complex biological samples like sputum, blood, urine, and cerebrospinal fluid, and (3) rapid, sensitive, specific, quantitative, integrated, and portable biosensor platforms that are compatible with those assays [1,2,3,4]. Over the past few decades, the discovery of biomarkers and the development of biomarker-based diagnostic assays have progressed significantly, becoming clinically relevant for conditions such as cancer and infectious diseases [5,6,7,8,9,10]. However, the ability to rapidly and quantitatively measure specific biological signatures at the point of need remains challenging.
Biosensor platforms have evolved alongside biomarker-based diagnostic assays [10,11]. Portable biosensors are sought as a deployable means to monitor water quality, measure environmental pollution, assess warfighter health, detect pathogens in a point-of-care setting, and more [12,13,14,15,16,17,18]. Techniques such as interferometry, microwave sensing, surface plasmon resonance, fluorimetry, and Bloch surface wave sensing have been applied to the development of portable biosensing technologies [19,20,21,22,23,24,25,26,27]. In particular, fluorescent waveguide-based biosensors hold significant promise in portable applications due to their small size, potential low cost, relative ease of use, low (theoretically zero) background signal, and fast, low-noise detection with silicon photodiodes [28,29].
Our team at Los Alamos National Laboratory has previously reported a benchtop waveguide-based optical biosensor (WOB) that combines the spatial specificity of evanescent field sensing, the specificity of biotin-streptavidin binding, and the spectral sensitivity of a fluorescence detection platform [30]. This biosensor has been used to detect many different compounds of biochemical interest, including lipopolysaccharides, lipoteichoic acids, lipoarabinomannan, protein toxins, disease biomarkers, and viral nucleic acids [31,32,33,34,35,36]. In addition, we previously developed a highly portable biosensor, but that platform was designed to specifically detect cholera toxin and ricin [37,38]. For widespread use in point-of-care settings, it is important for a biosensor to be amenable to a wide array of targets. To address this requirement, we developed the portable engineered analytic sensor with automated sampling (PEGASUS) [39], which we present here.
PEGASUS was designed to miniaturize and integrate the sensing ability of WOB with a microfluidic chip for sample processing toward the goal of developing a truly fieldable biosensor. The details of our microfluidic platform have been described elsewhere [40]. PEGASUS additionally differs from WOB because it uses a different, smaller waveguide mounting apparatus. Light-coupling efficiency and overall sensing performance can vary between different waveguides. Therefore, to directly compare the performance of PEGASUS and WOB, we built a PEGASUS test-bed sensor (PTB) with identical sensing hardware and software to PEGASUS. PTB uses the same waveguide mounting system as WOB for cross-compatibility while maintaining portability, fitting into a 22″ × 14″ × 9″ case and weighing 19.4 lbs. Here, we present the design of PEGASUS’s biosensing hardware and evaluate the performance of PEGASUS’s sensing hardware and software through a comparison between PTB and WOB.
2. Experimental
2.1. Sensor Design
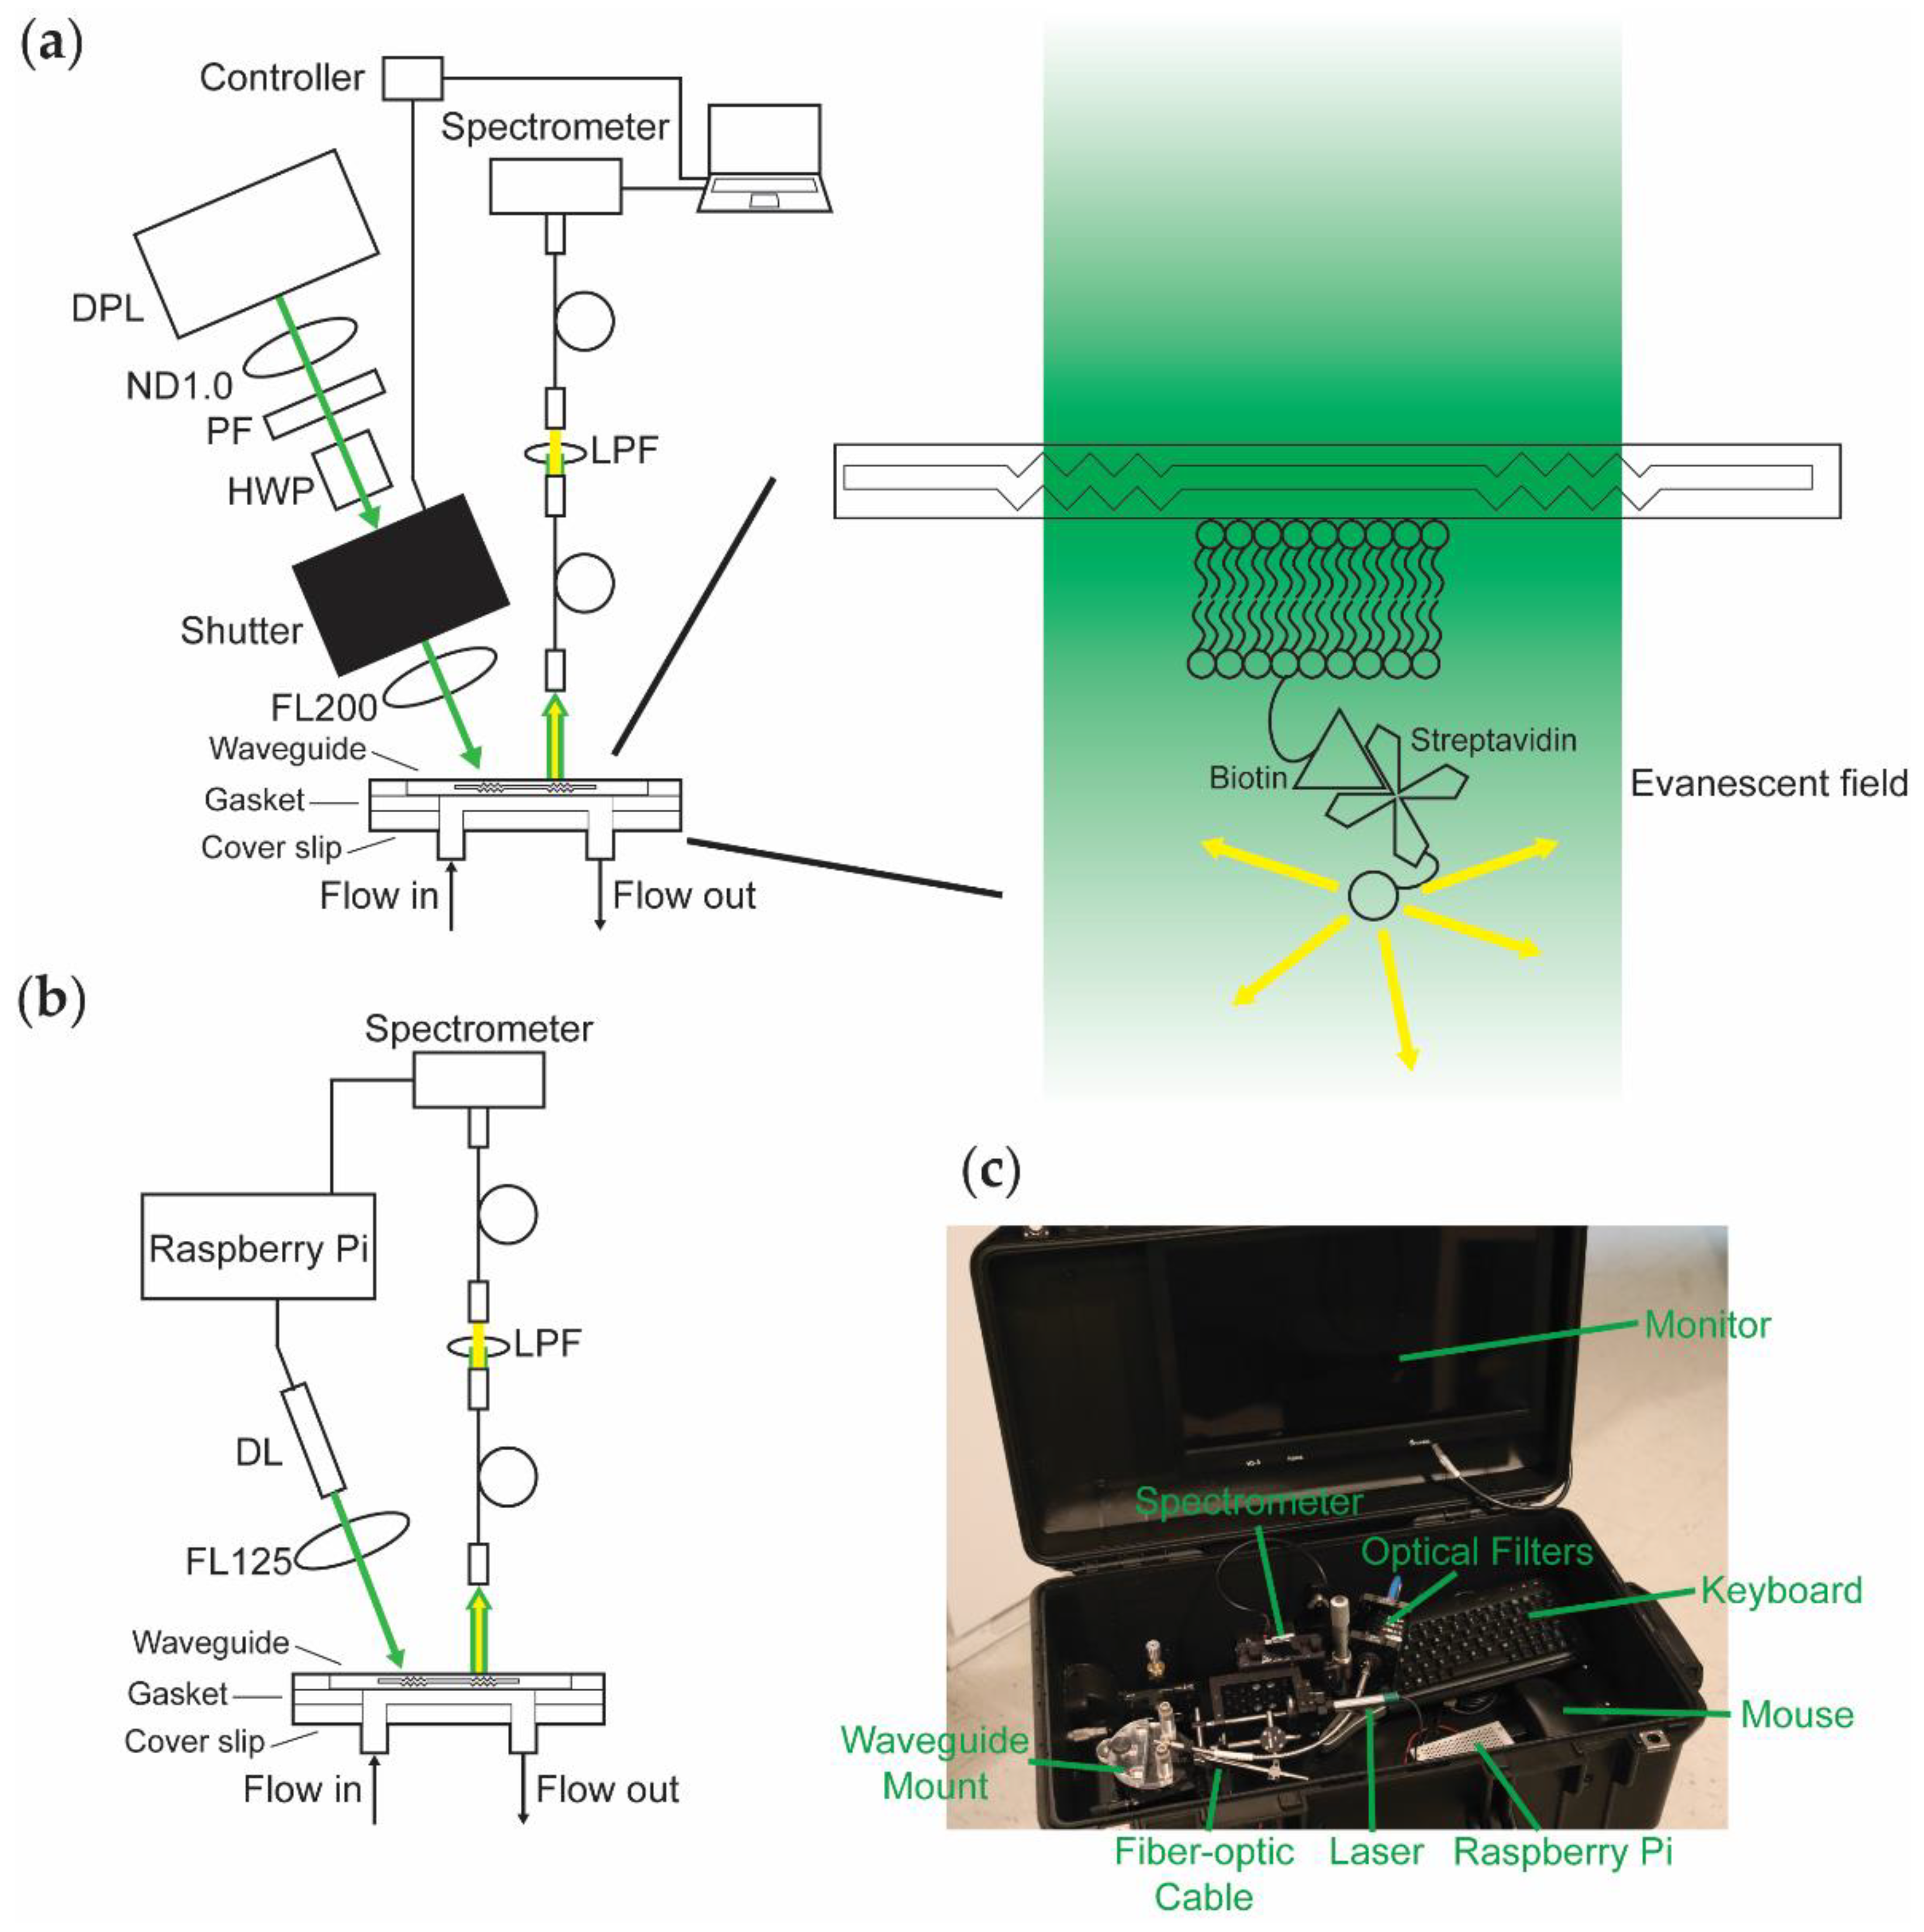
The design of WOB (Figure 1a) has been described previously [30,38]. In brief, 532-nm light from a frequency-doubled diode-pumped laser (GCL-025-S, CrystaLaser LC, Reno, NV, USA; 25 mW; laser head: 50 mm × 36 mm × 120 mm, 1.3 lbs; CrystaLaser CL-2000 power supply: 50 mm × 140 mm × 150 mm, 1 lb) is passed through a variable attenuator consisting of a neutral density (ND) filter (1 stop), a polarizing filter, and a zero-order half-wave plate, attenuating the laser’s total power to 520 μW to minimize photobleaching during data acquisition. The beam is passed through a digitally driven mechanical shutter (Model 845HP, Newport Corporation, Irvine, CA, USA; shutter head: 57.2 mm × 34.3 mm × 29 mm; controller: 82.5 mm × 152.5 mm × 159 mm; total weight 3.5 lbs) and focused (f = 200 mm; beam waist 1 mm) onto the diffraction grating of a silicon oxynitride single-mode planar optical waveguide (nGimat Ltd., Atlanta, GA, USA; Spectrum Thin Films Inc., Hauppauge, NY, USA). The beam of the laser can be thought of as being split into three main components at the waveguide–air interface: (1) light that is reflected off the surface of the waveguide, (2) light that is coupled into the thin film of the waveguide, and (3) light that is transmitted through the waveguide. The light that is not reflected off the surface of the waveguide (80 μW) or coupled into the waveguide (30–400 μW depending on the waveguide) is transmitted through the waveguide and monitored with a silicon photodiode power meter (S120C, Thorlabs, Newton, NJ, USA). The evanescent field generated by the light coupled into the waveguide excites fluorophores held near the surface of the waveguide. Isotropically emitted fluorescence is collected with a fiber-optic cable (QP600-025-UV-BX, Ocean Insight, Orlando, FL, USA; held roughly normal at 1 mm away from the surface of the waveguide). The collected light is routed through a 532-nm long-pass filter and coupled into a fiber-optic spectrometer (P600-2-UV-VIS, Ocean Insight; OceanOptics USB2000, Ocean Insight). The resulting data is transmitted to a computer (Dell Latitude D520; 5.9 lbs) running a LabVIEW-based Virtual Instrument that coordinates the shutter control with data acquisition and processes spectra (SCB-68, National Instruments, Austin, TX, USA; LabVIEW v7.1, National Instruments; OmniDriver, Ocean Insight).
We designed PEGASUS and PTB (Figure 1b) with the goal of miniaturizing our previous sensor by removing or replacing large components whenever possible. PTB is equipped with a compact diode laser (CPS532-C2, Thorlabs; 900 μW; cylindrical, 11 mm × 72.8 mm; 0.08 lbs) mounted in a Thorlabs 30-mm optical cage system, removing the need for the variable attenuator by using a weaker laser. The laser is focused (f = 125 mm; beam waist 1 mm) onto the diffraction grating of a silicon oxynitride single-mode planar optical waveguide (100 μW reflected, 30–170 μW coupled) and monitored with a power meter (S120C, Thorlabs). Isotropically emitted fluorescence from the thin film of the waveguide is collected with a fiber-optic cable (FG550UEC, Thorlabs; held roughly normal at 1 mm away from the surface of the waveguide), passed through a 532-nm long-pass filter, and coupled into a fiber-optic spectrometer (QP600-025-UV-BX, Ocean Insight; OceanOptics Flame-S, Ocean Insight). A Raspberry Pi (RPi; Raspberry Pi 3 Model B v1.2, Raspberry Pi Foundation, Cambridge, UK; 0.25 lbs) provides controllable power to the laser, thereby eliminating the need for the shutter. We use custom-written Python code (Tkinter; OceanOptics SeaBreeze, Ocean Insight) to process spectra on the RPi, replacing the laptop with a more compact and power-efficient computer. Alternatively, emulators (e.g., Box86) enable running x86 spectral processing software packages (e.g., OceanView v2.0.8, Ocean Insight) on an RPi.
As shown in Figure 1c, PTB fits in a 22″ × 14″ × 9″ case (Model 1535, Pelican, Torrance, CA, USA; 8.7 lbs) equipped with a monitor, keyboard, and mouse. Including the weight of the case, this contained sensing platform weighs 19.4 lbs. Because the RPi provides power to both the laser and the spectrometer and draws minimal power itself, the sensor hardware can be powered by a battery (at least 5 V, 2.5 A is required). Equipped with a USB-powered monitor, data acquisition can be performed entirely without mains electrical power. Alternatively, the power requirements of the system are small enough that a portable power station (e.g., Explorer 160, Jackery Inc., Fremont, CA, USA) is more than sufficient to power the sensor and peripherals that use mains power.
2.2. Methods
2.2.1. Flow Cell Preparation
We prepared our flow cell using previously published procedures [30,33,34,35,36,41,42]. A planar optical waveguide and a glass coverslip (3″ × 1″ glass microscope slide with two 1-mm holes drilled 1.5 cm from the center along the long axis of the coverslip; 48300-036, VWR International, Radnor, PA, USA) were cleaned for 5 min each in chloroform (319988, Millipore Sigma, St. Louis, MO, USA), ethanol (EX0276, Millipore Sigma), and ultrapure water (Direct-Q 3 UV-R, Millipore Sigma) by bath sonication (2510R-DTH Ultrasonic Cleaner, Branson Ultrasonics, Brookfield, CT, USA), dried under argon gas (Airgas, Radnor, PA, USA), and further cleaned by ultraviolet-ozone treatment (Model T10 × 10/OES, UVOCS Inc., Lansdale, PA, USA) for 40 min. The cleaned waveguide and coverslip were bonded together with a hydrophobic gasket (laser-cut 3″ × 1″ silicone sheet with a 1.5-mm-radius and 3-cm-straight side length geometric stadium cut out of the center of the gasket; CultureWell Silicone Sheet Material RD477403-M, Grace Bio-Labs, Bend, OR, USA) to form a 60-μL flow cell. The waveguide–gasket–coverslip assembly was clamped between two pieces of a custom-milled housing fitted with an O-ring-sealed septum (inlet) and an O-ring-sealed drain tube (outlet) that align with the holes on the coverslip.
2.2.2. Lipid Preparation
Supported lipid bilayers were prepared using previously published procedures [30,33,34,35,36,41,42]. 60 μL of 5 mM 1,2-dioleoyl-sn-glycero-3-phosphocholine (850345, Avanti Polar Lipids, Alabaster, AL, USA) in chloroform and 0.6 μL of 5 mM 1,2-dioleoyl-sn-glycero-3-phosphoethanolamine-N-(cap biotinyl) (870273, Avanti Polar Lipids) in chloroform were deposited in a glass test tube by syringe, dried under a gentle stream of argon gas, and reconstituted in 600 µL of filter-sterilized Dulbecco’s phosphate-buffered saline (PBS; D8662, Millipore Sigma) for a final total lipid concentration of 0.5 mM. The lipids were shaken for 30 min at room temperature (120 RPM) and passed ten times unidirectionally through the 0.1-μm polycarbonate membrane of a lipid extruder (Mini-Extruder 610000, Avanti Polar Lipids) at room temperature to prepare unilamellar vesicles (final volume 590 μL). 70 µL of prepared lipids were pipetted into the assembled flow cell, sealed (ST200 Adhesive Seal Tabs, Grace Bio-Labs), and incubated at 4 °C overnight (16 h) to allow fusion of a bilayer to the surface.
2.2.3. Fluorescence Assays
The flow cell was washed with 2 mL of PBS (flow rate 10 mL/min) and 2 mL of 0.5% bovine serum albumin (BSA; A7906, Millipore Sigma) in PBS (10 mL/min). Both biosensors were aligned by maximizing the intensity of the streak resulting from total internal reflection in the thin film of the waveguide (WOB: 391 μW coupled; PTB: 62 μW coupled). The lipid bilayer on the waveguide was blocked for 1 h at room temperature with 2 mL of 2% BSA in PBS (10 mL/min) and washed with 2 mL of 0.5% BSA in PBS (10 mL/min). Five background spectra were recorded on each sensor. All spectra were recorded from 400–700 nm in a dark room at room temperature with a black box placed on top of the sensor, an integration time of 3 s, and a ± 3 unweighted moving window average. PTB spectra were recorded as the average of three scans. The waveguide was incubated for 5 min at room temperature with a 250-μL injection of 1 nM streptavidin-Alexa Fluor 532 conjugate (SA-AF532; S11224, Thermo Fisher Scientific, Waltham, MA, USA) in PBS (1.2 mL/min). The cell was washed with 2 mL of 0.5% BSA in PBS (10 mL/min).
A fluorescence spectrum was recorded on WOB. The assembled flow cell was quickly moved to PTB and a fluorescence spectrum was recorded on PTB, providing a matched pair of spectra suitable for direct comparison. The SA-AF532 on the waveguide was photobleached by exposure to 532-nm laser light for 10 min on WOB, and a new background spectrum was recorded on each sensor following photobleaching. A total of four spectra were acquired for each sensor by performing this procedure three additional times with the same waveguide and lipid bilayer, alternating the order in which the sensors were used. Spectra were background-corrected by subtracting the most recently acquired background spectrum from the observed fluorescence spectrum.
3. Results and Discussion
We designed PEGASUS, a miniaturized version of WOB, with the goal of developing a generalizable biosensor that could meet the distinct need for sensitive, portable, and rapid biosensing. We have developed, optimized, and validated assays for several emerging biological challenges on WOB [31,32,33,34,35,36]. Because PEGASUS and WOB use similar biological assay architectures and general methodologies, PEGASUS is compatible with the lipid, protein, and nucleic acid sensing assays that we have previously described [31,32,33,34,35,36].
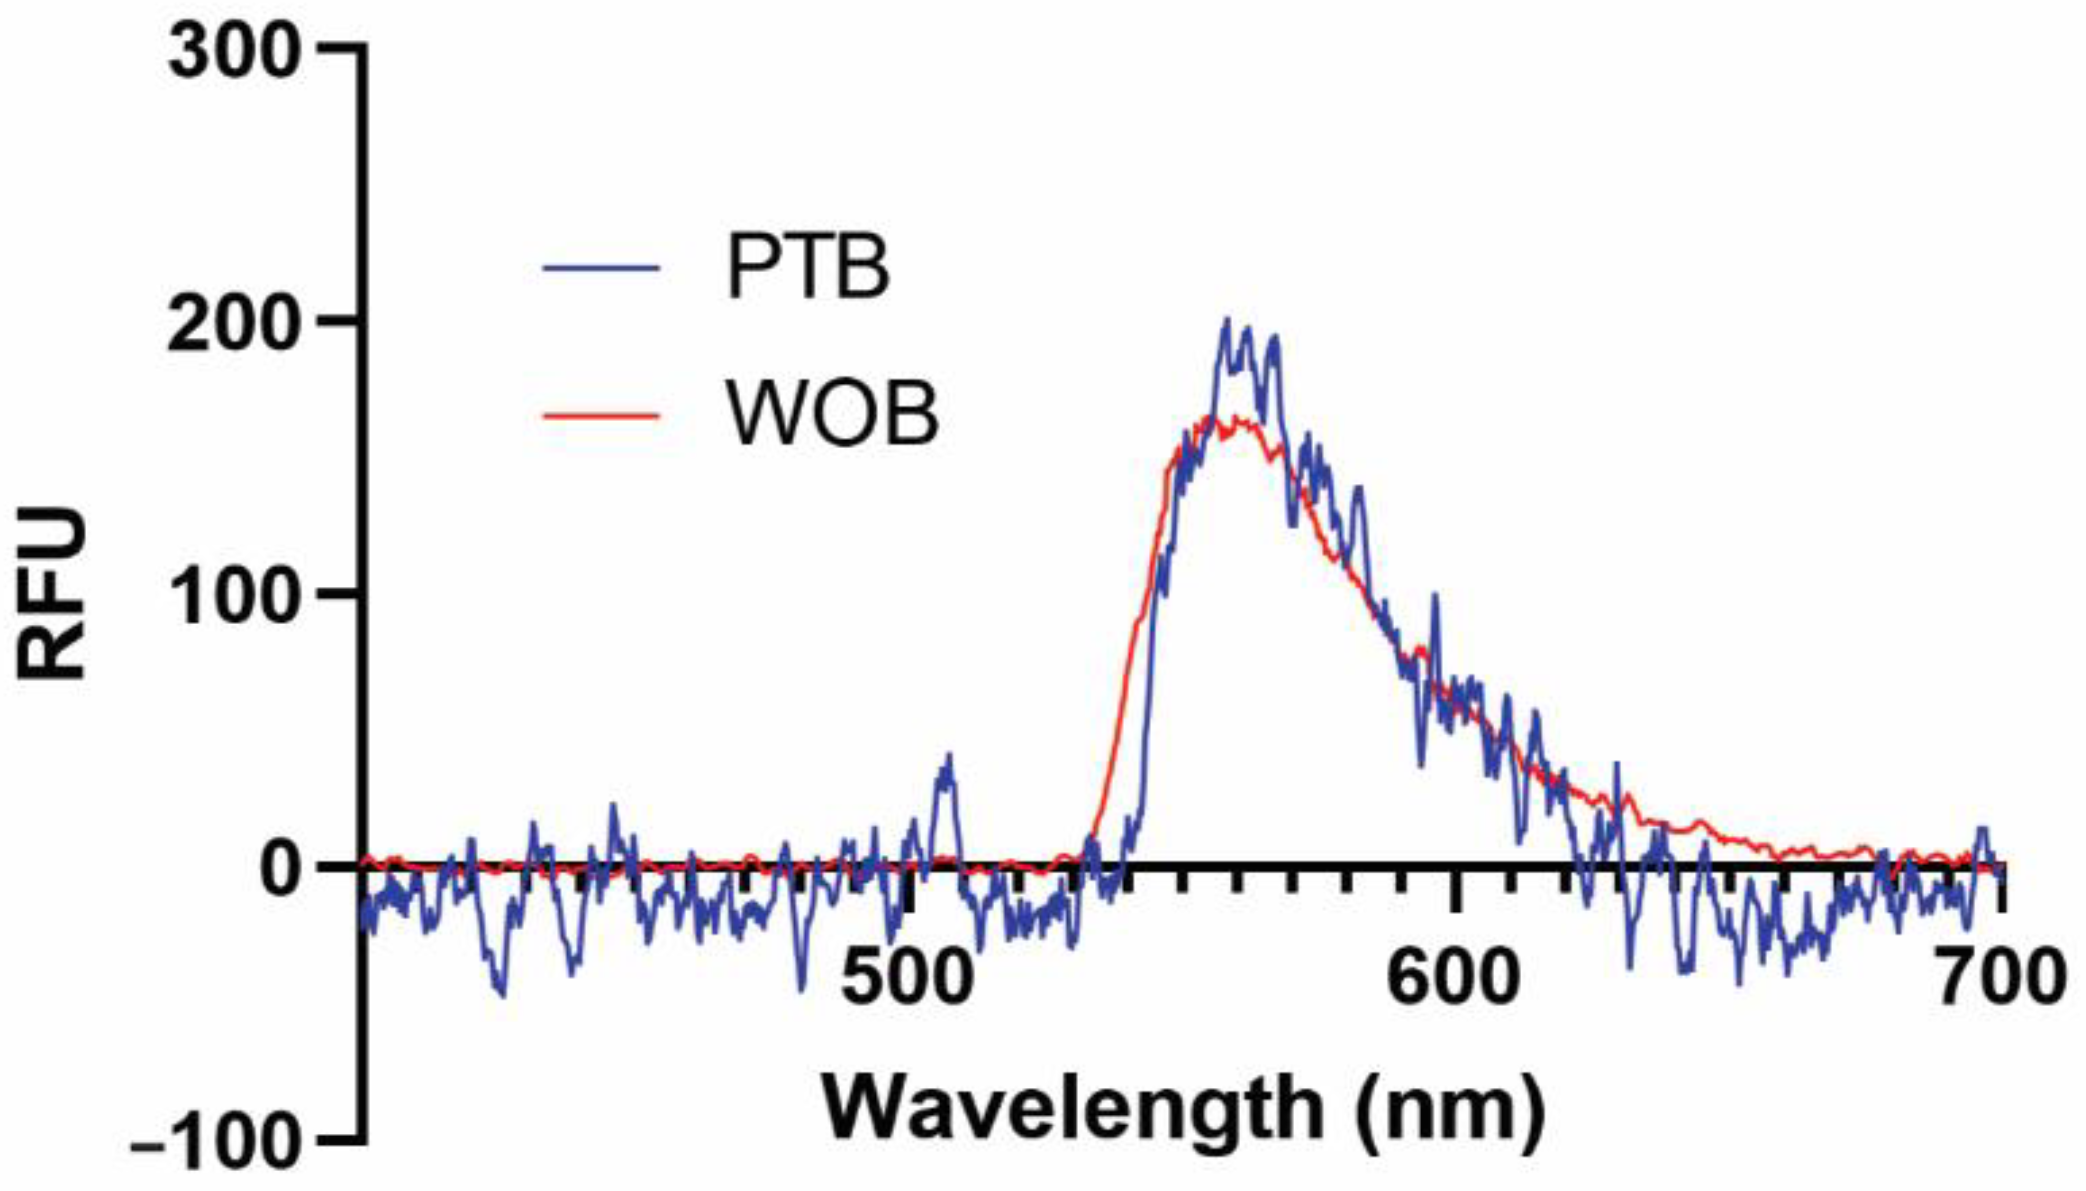
We have previously demonstrated that several functional surfaces are compatible with our biosensing platforms [41,43]. In this early validation study, we used a supported biotinylated lipid bilayer for its simplicity, ease of use, and nearly quantitative binding interaction with streptavidin (Kd = 40 fM) and its commercially available fluorescent conjugates [44]. Representative fluorescence spectra of 1 nM SA-AF532 taken on WOB and PTB are shown in Figure 2. Both WOB and PTB are clearly capable of detecting evanescent field-stimulated fluorescence at 560 nm from a low-nanomolar analyte.
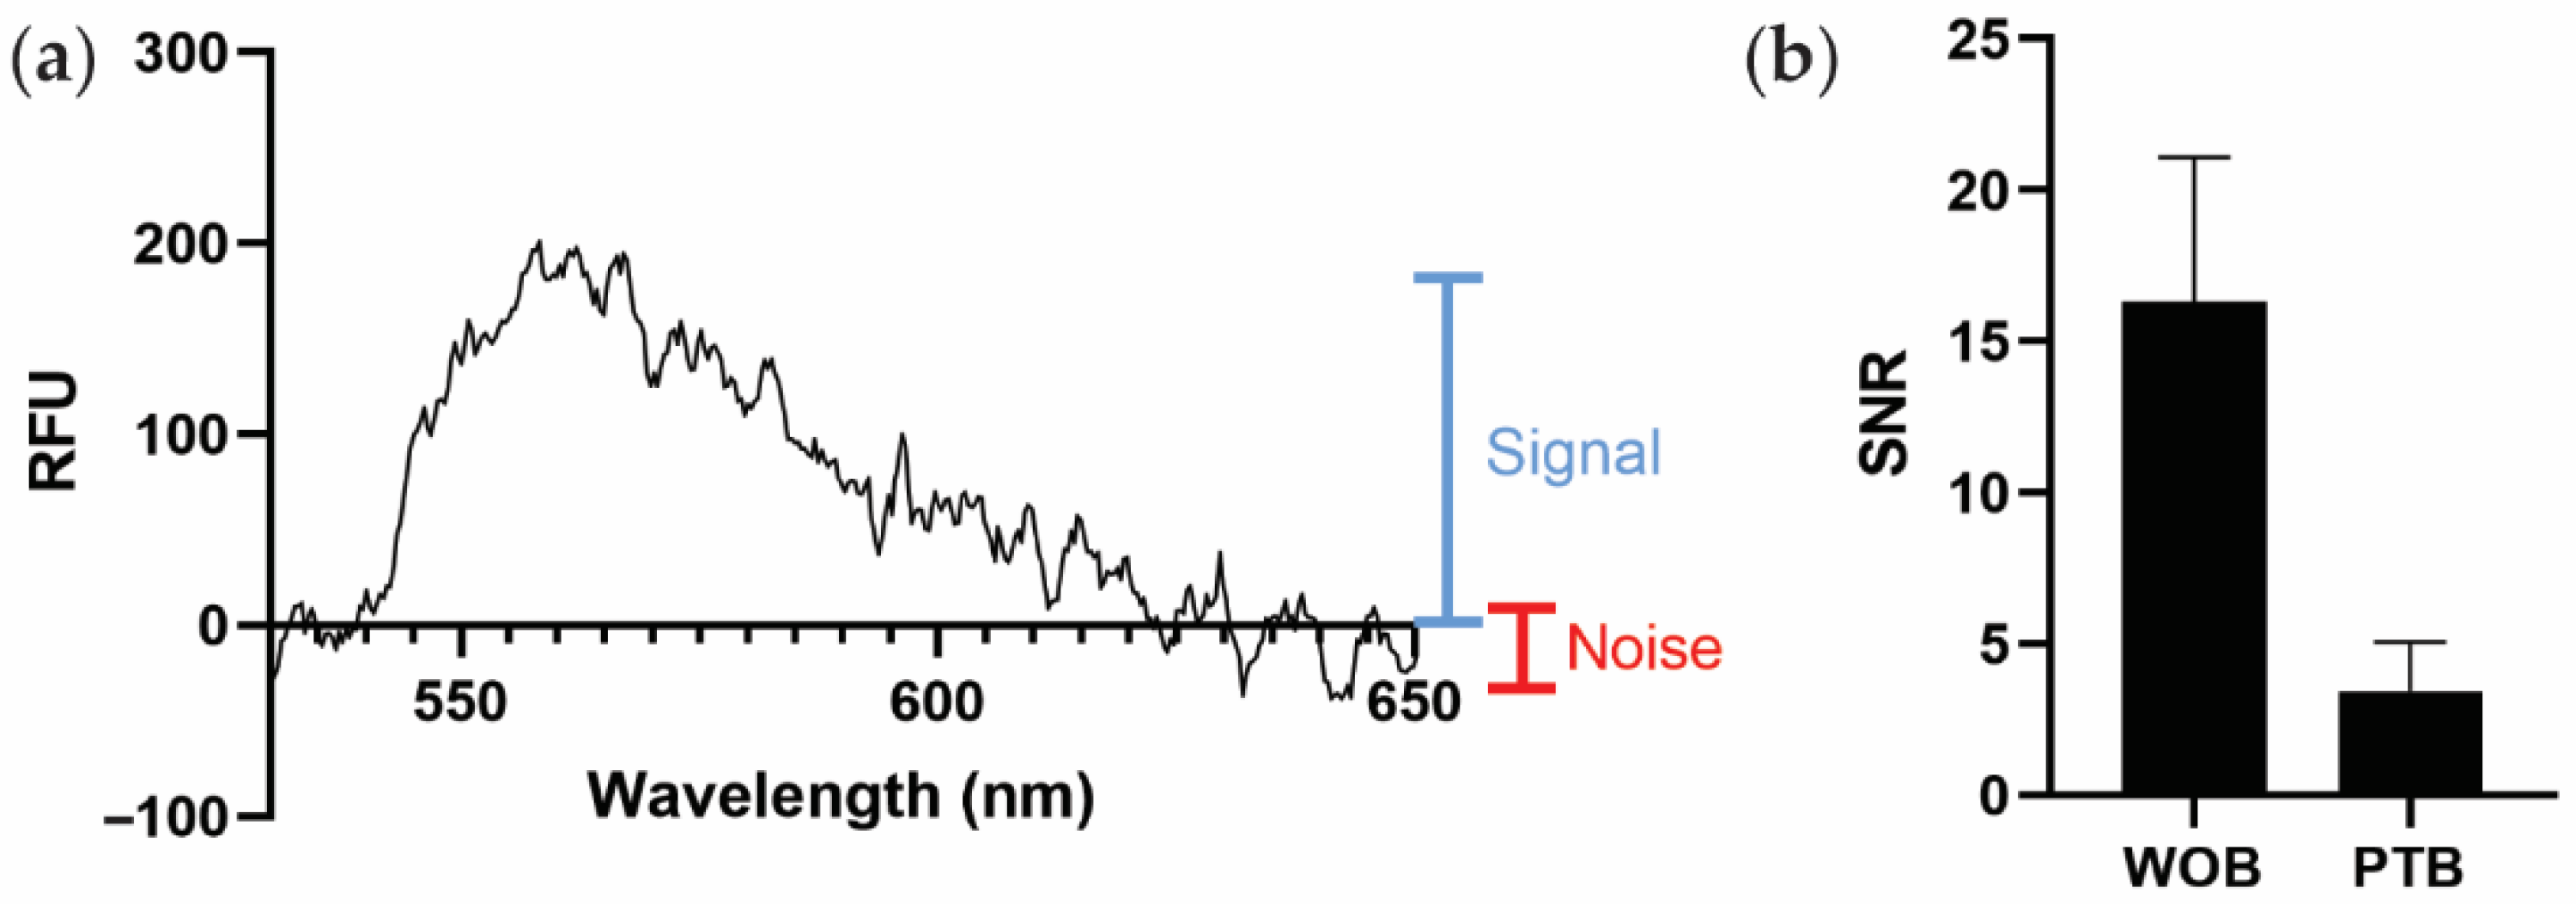
Because PTB and WOB use different spectrometers with different scales of relative fluorescent intensity, we instead use the average signal-to-noise ratio (SNR) as a generalizable metric to compare sensor performance (Figure 3a). As shown in Figure 3b, PTB (SNR 3.4 ± 1.6) exhibits a smaller estimated SNR than WOB (SNR 16.3 ± 4.8). The largest contributor to the difference in SNRs between WOB and PTB is likely the difference in coupling efficiency between the sensors. Defined as the percentage of incident, non-reflected light that is coupled into the waveguide (as opposed to the light that is transmitted through the waveguide), WOB exhibits an estimated coupling efficiency of 89% and PTB exhibits an estimated coupling efficiency of 8% in these experiments. A detailed discussion of the intricacies of polarization, refraction, and reflection is beyond the scope of this manuscript [45], but we do note that the additional optics used in WOB are likely responsible for the significant difference in coupling efficiency between WOB and PTB.
Although PTB exhibits a smaller estimated SNR than WOB, diminished sensitivity is an oft-encountered challenge in the development of miniaturized and fieldable sensors [46]. Furthermore, WOB is consistently more sensitive than conventional immunoassays using identical assay architectures (often by multiple orders of magnitude) [31,34]. Therefore, given that the SNR of PTB is within a factor of five of that of WOB, PEGASUS is likely more than sufficient for use with our biosensing assays, which generally employ bright fluorophores with high excitation efficiencies and quantum yields [31,32,33,34,35,36]. Additionally, further optimizations such as metal-enhanced fluorophores and other surface functionalizations could be employed in the future to improve the sensitivity of this biosensing platform [10,47,48,49]. Ultimately, the advantage of the portability of this platform outweighs the disadvantage of reduced sensitivity.
4. Conclusions
Integrated and portable biosensors in a point-of-care format enable rapid, on-site analytical measurements, making many use-cases possible that would not be possible with benchtop laboratory instrumentation (e.g., measuring water samples at a riverside, assessing warfighter biofluid samples when deployed, and analyzing patient biofluid samples in a point-of-care setting). We have developed a portable waveguide-based optical biosensor (PEGASUS) and used a test-bed (PTB) of identical sensing hardware and software to evaluate the sensor’s performance. PTB fits into a 22″ × 14″ × 9″ case and weighs 19.4 lbs. The creation and validation of this sensor is an important step toward a truly fieldable biosensor platform. Future work will focus on increasing the sensitivity of this platform and exploring performance in complex samples under field conditions.
Author Contributions
Conceptualization, A.S.A. and H.M.; methodology, P.A.K., K.D.L., A.S.A. and H.M.; software, D.D.L.M. and J.E.M.-G.; validation, P.A.K., K.D.L., D.D.L.M., J.E.M.-G. and A.S.A.; formal analysis, P.A.K.; investigation, P.A.K., K.D.L., A.S.A. and H.M.; resources, H.M.; data curation, P.A.K.; writing—original draft preparation, P.A.K.; writing—review and editing, P.A.K., K.D.L., D.D.L.M., J.E.M.-G., A.S.A. and H.M.; visualization, P.A.K.; supervision, K.D.L. and H.M.; project administration, H.M.; funding acquisition, H.M. All authors have read and agreed to the published version of the manuscript.
Funding
This work was supported by the Laboratory Directed Research and Development program of Los Alamos National Laboratory (project 20180387ER: Engineering the Universal Bacterial Sensor; PI H.M.) and the Defense Threat Reduction Agency (contract HDTRA R-00634-19-0: Fieldable Automated Biosensor for Universal Diagnostics and Discriminating Bacterial vs. Viral Pathogens; DTRA-CBA, Program Manager, Dr. Diane Dutt; PI H.M.). P.A.K. was supported by a Congressionally Directed Medical Research Program of the U.S. Department of Defense (project R-00674-19-0; PI H.M.). The views expressed in this article are those of the authors and do not reflect the official policy or position of the U.S. Department of Defense nor the U.S. Government.
Institutional Review Board Statement
Not applicable.
Informed Consent Statement
Not applicable.
Data Availability Statement
Spectral data are publicly available on Figshare (DOI: 10.6084/m9.figshare.17955254).
Acknowledgments
This work was performed at the Los Alamos National Laboratory, which is operated by Triad National Security, LLC, for the National Nuclear Security Administration of the U.S. Department of Energy (Contract No. 89233218CNA000001). The authors thank Basil I. Swanson (retired, Laboratory Fellow, Los Alamos National Laboratory) for his vision and development of the WOB platform.
Conflicts of Interest
The authors declare no conflict of interest.
References
- Chandramouli, K.; Qian, P.Y. Proteomics: Challenges, techniques and possibilities to overcome biological sample complexity. Hum. Genom. Proteom. 2009, 2009, 239204. [Google Scholar] [CrossRef] [PubMed] [Green Version]
- Wolfender, J.-L.; Marti, G.; Thomas, A.; Bertrand, S. Current approaches and challenges for the metabolite profiling of complex natural extracts. J. Chromatogr. A 2015, 1382, 136–164. [Google Scholar] [CrossRef] [PubMed]
- Sanz-Medel, A. Trace element analytical speciation in biological systems: Importance, challenges and trends. Spectrochim. Acta Part B At. Spectrosc. 1998, 53, 197–211. [Google Scholar] [CrossRef]
- Feist, P.; Hummon, A.B. Proteomic challenges: Sample preparation techniques for microgram-quantity protein analysis from biological samples. Int. J. Mol. Sci. 2015, 16, 3537–3563. [Google Scholar] [CrossRef] [PubMed] [Green Version]
- Henry, N.L.; Hayes, D.F. Cancer biomarkers. Mol. Oncol. 2012, 6, 140–146. [Google Scholar] [CrossRef] [PubMed] [Green Version]
- Stromberg, L.R.; Lilley, L.M.; Mukundan, H. Advances in lipidomics for cancer biomarker discovery. In Proteomic and Metabolomic Approaches to Biomarker Discovery; Elsevier: Amsterdam, The Netherlands, 2020; pp. 421–436. [Google Scholar]
- Gohring, J.T.; Dale, P.S.; Fan, X. Detection of HER2 breast cancer biomarker using the opto-fluidic ring resonator biosensor. Sens. Actuators B Chem. 2010, 146, 226–230. [Google Scholar] [CrossRef]
- Mukundan, H.; Price, D.N.; Goertz, M.; Parthasarathi, R.; Montaño, G.A.; Kumar, S.; Scholfield, M.R.; Anderson, A.S.; Gnanakaran, S.; Iyer, S.; et al. Understanding the interaction of Lipoarabinomannan with membrane mimetic architectures. Tuberculosis 2012, 92, 38–47. [Google Scholar] [CrossRef]
- Kubicek-Sutherland, J.Z.; Vu, D.M.; Mendez, H.M.; Jakhar, S.; Mukundan, H. Detection of Lipid and Amphiphilic Biomarkers for Disease Diagnostics. Biosensors 2017, 7, 25. [Google Scholar] [CrossRef] [PubMed] [Green Version]
- Mukundan, H.; Anderson, A.S.; Grace, W.K.; Grace, K.M.; Hartman, N.; Martinez, J.S.; Swanson, B.I. Waveguide-based biosensors for pathogen detection. Sensors 2009, 9, 5783–5809. [Google Scholar] [CrossRef] [Green Version]
- Srinivasan, B.; Tung, S. Development and Applications of Portable Biosensors. J. Lab. Autom. 2015, 20, 365–389. [Google Scholar] [CrossRef] [PubMed] [Green Version]
- Eyvazi, S.; Baradaran, B.; Mokhtarzadeh, A.; Guardia, M.d.l. Recent advances on development of portable biosensors for monitoring of biological contaminants in foods. Trends Food Sci. Technol. 2021, 114, 712–721. [Google Scholar] [CrossRef]
- Chen, Y.-R.; Anderson, G.P.; Rowe-Taitt, C.A.; Tu, S.-I. Water quality monitoring using an automated portable fiber optic biosensor: RAPTOR. In Photonic Detection and Intervention Technologies for Safe Food; SPIE: Bellingham, WA, USA, 2001; pp. 58–63. [Google Scholar]
- Chocarro-Ruiz, B.; Fernández-Gavela, A.; Herranz, S.; Lechuga, L.M. Nanophotonic label-free biosensors for environmental monitoring. Curr. Opin. Biotechnol. 2017, 45, 175–183. [Google Scholar] [CrossRef] [Green Version]
- Datta, M.K.; Kumta, P.N.; Roy, A.; Kunjukunju, S. Novel Aptamer-Based Biosensor Platforms for Detection of Cardiomyopathy Conditions; Defense Technical Information Center: Fort Belvoir, VA, USA, 2021; p. 17.
- Lim, D.V.; Kearns, E.A.; Leskinen, S.D.; Magaña, S.; Stroot, J.M.; Hunter, D.M.; Schlemmer, S.M. Sample preparation and assay refinements for pathogen detection platforms. In Frontiers in Pathogen Detection: From Nanosensors to Systems; SPIE: Bellingham, WA, USA, 2009. [Google Scholar]
- Shriver-Lake, L.C.; Taitt, C.R.; Golden, J.P.; Ligler, F.S.; Sapsford, K.E.; Shubin, Y. Biological Agent Detection in Food with an Array Biosensor; Defense Technical Information Center: Fort Belvoir, VA, USA, 2003; p. 13.
- Sadighbayan, D.; Ghafar-Zadeh, E. Portable Sensing Devices for Detection of COVID-19: A Review. IEEE Sens. J. 2021, 21, 10219–10230. [Google Scholar] [CrossRef]
- Sepúlveda, B.; Río, J.S.D.; Moreno, M.; Blanco, F.J.; Mayora, K.; Domínguez, C.; Lechuga, L.M. Optical biosensor microsystems based on the integration of highly sensitive Mach–Zehnder interferometer devices. J. Opt. A Pure Appl. Opt. 2006, 8, S561–S566. [Google Scholar] [CrossRef]
- Omer, A.E.; Shaker, G.; Safavi-Naeini, S.; Kokabi, H.; Alquié, G.; Deshours, F.; Shubair, R.M. Low-cost portable microwave sensor for non-invasive monitoring of blood glucose level: Novel design utilizing a four-cell CSRR hexagonal configuration. Sci. Rep. 2020, 10, 15200. [Google Scholar] [CrossRef] [PubMed]
- Prabowo, B.A.; Su, L.-C.; Chang, Y.-F.; Lai, H.-C.; Chiu, N.-F.; Liu, K.-C. Performance of white organic light-emitting diode for portable optical biosensor. Sens. Actuators B Chem. 2016, 222, 1058–1065. [Google Scholar] [CrossRef]
- Yildirim, N.; Long, F.; Gao, C.; He, M.; Shi, H.C.; Gu, A.Z. Aptamer-based optical biosensor for rapid and sensitive detection of 17β-estradiol in water samples. Environ. Sci. Technol. 2012, 46, 3288–3294. [Google Scholar] [CrossRef]
- Anderson, G.P.; Rowe-Taitt, C.A.; Ligler, F.S. RAPTOR: A Portable, Automated Biosensor. In Proceedings of the First Joint Conference on Point Detection for Chemical and Biological Defense, Williamsburg, VA, USA, 23–27 October 2000; Defense Technical Information Center: Fort Belvoir, VA, USA, 2000; pp. 408–414. [Google Scholar]
- Chen, C.; Wang, J. Optical biosensors: An exhaustive and comprehensive review. Analyst 2020, 145, 1605–1628. [Google Scholar] [CrossRef]
- Ligler, F.S.; Sapsford, K.E.; Golden, J.P.; Shriver-Lake, L.C.; Taitt, C.R.; Dyer, M.A.; Barone, S.; Myatt, C.J. The array biosensor: Portable, automated systems. Anal. Sci. 2007, 23, 5–10. [Google Scholar] [CrossRef] [PubMed] [Green Version]
- Toma, K.; Descrovi, E.; Toma, M.; Ballarini, M.; Mandracci, P.; Giorgis, F.; Mateescu, A.; Jonas, U.; Knoll, W.; Dostálek, J. Bloch surface wave-enhanced fluorescence biosensor. Biosens. Bioelectron. 2013, 43, 108–114. [Google Scholar] [CrossRef]
- Occhicone, A.; Del Porto, P.; Danz, N.; Munzert, P.; Sinibaldi, A.; Michelotti, F. Enhanced Fluorescence Detection of Interleukin 10 by Means of 1D Photonic Crystals. Crystals 2021, 11, 1517. [Google Scholar] [CrossRef]
- Benito-Peña, E.; Valdés, M.G.; Glahn-Martínez, B.; Moreno-Bondi, M.C. Fluorescence based fiber optic and planar waveguide biosensors. A review. Anal. Chim. Acta. 2016, 943, 17–40. [Google Scholar] [CrossRef] [PubMed]
- Markus, C.R.; Perry, A.J.; Hodges, J.N.; McCall, B.J. Improving cavity-enhanced spectroscopy of molecular ions in the mid-infrared with up-conversion detection and Brewster-plate spoilers. Opt. Express. 2017, 25, 3709–3721. [Google Scholar] [CrossRef] [Green Version]
- Martinez, J.S.; Grace, W.K.; Grace, K.M.; Hartman, N.; Swanson, B.I. Pathogen detection using single mode planar optical waveguides. J. Mater. Chem. 2005, 15, 4639–4647. [Google Scholar] [CrossRef]
- Kubicek-Sutherland, J.Z.; Vu, D.M.; Noormohamed, A.; Mendez, H.M.; Stromberg, L.R.; Pedersen, C.A.; Hengartner, A.C.; Klosterman, K.E.; Bridgewater, H.A.; Otieno, V.; et al. Direct detection of bacteremia by exploiting host-pathogen interactions of lipoteichoic acid and lipopolysaccharide. Sci. Rep. 2019, 9, 6203. [Google Scholar] [CrossRef] [PubMed] [Green Version]
- Jakhar, S.; Sakamuri, R.; Vu, D.; Dighe, P.; Stromberg, L.R.; Lilley, L.; Hengartner, N.; Swanson, B.I.; Moreau, E.; Dorman, S.E.; et al. Interaction of amphiphilic lipoarabinomannan with host carrier lipoproteins in tuberculosis patients: Implications for blood-based diagnostics. PLoS ONE 2021, 16, e0243337. [Google Scholar] [CrossRef] [PubMed]
- Mukundan, H.; Xie, H.; Price, D.; Kubicek-Sutherland, J.Z.; Grace, W.K.; Anderson, A.S.; Martinez, J.S.; Hartman, N.; Swanson, B.I. Quantitative multiplex detection of pathogen biomarkers on multichannel waveguides. Anal. Chem. 2010, 82, 136–144. [Google Scholar] [CrossRef] [PubMed]
- Mukundan, H.; Kumar, S.; Price, D.N.; Ray, S.M.; Lee, Y.-J.; Min, S.; Eum, S.; Kubicek-Sutherland, J.; Resnick, J.M.; Grace, W.K.; et al. Rapid detection of Mycobacterium tuberculosis biomarkers in a sandwich immunoassay format using a waveguide-based optical biosensor. Tuberculosis 2012, 92, 407–416. [Google Scholar] [CrossRef] [Green Version]
- Mukundan, H.; Kubicek, J.Z.; Holt, A.; Shively, J.E.; Martinez, J.S.; Grace, K.; Grace, W.K.; Swanson, B.I. Planar optical waveguide-based biosensor for the quantitative detection of tumor markers. Sens. Actuators B Chem. 2009, 138, 453–460. [Google Scholar] [CrossRef]
- Courtney, S.J.; Stromberg, Z.R.; Myers y Gutiérrez, A.; Jacobsen, D.; Stromberg, L.R.; Lenz, K.D.; Theiler, J.; Foley, B.T.; Gans, J.; Yusim, K.; et al. Optical Biosensor Platforms Display Varying Sensitivity for the Direct Detection of Influenza RNA. Biosensors 2021, 11, 367. [Google Scholar] [CrossRef] [PubMed]
- Song, X.; Nolan, J.; Swanson, B.I. Optical Biosensor Based on Fluorescence Resonance Energy Transfer: Ultrasensitive and Specific Detection of Protein Toxins. J. Am. Chem. Soc. 1998, 120, 11514–11515. [Google Scholar] [CrossRef]
- Grace, K.M.; Goeller, R.M.; Grace, W.K.; Kolar, J.D.; Morrison, L.J.; Sweet, M.R.; Wiig, L.G.; Reed, S.M.; Lauer, S.A.; Little, K.M.; et al. Reagentless optical biosensor. In Chemical and Biological Point Sensors for Homeland Defense; SPIE: Bellingham, WA, USA, 2004. [Google Scholar]
- Ambrosiano, N. New Biosensor Designed to Detect Toxins and More. Available online: https://www.lanl.gov/discover/news-release-archive/2021/April/0422-pegasus-biosensor.php (accessed on 6 January 2022).
- Lenz, K.D.; Jakhar, S.; Chen, J.W.; Anderson, A.S.; Purcell, D.C.; Ishak, M.O.; Harris, J.F.; Akhadov, L.E.; Kubicek-Sutherland, J.Z.; Nath, P.; et al. A centrifugal microfluidic cross-flow filtration platform to separate serum from whole blood for the detection of amphiphilic biomarkers. Sci. Rep. 2021, 11, 5287. [Google Scholar] [CrossRef] [PubMed]
- Mukundan, H.; Xie, H.; Anderson, A.S.; Grace, W.K.; Shively, J.E.; Swanson, B.I. Optimizing a waveguide-based sandwich immunoassay for tumor biomarkers: Evaluating fluorescent labels and functional surfaces. Bioconjug. Chem. 2009, 20, 222–230. [Google Scholar] [CrossRef] [PubMed]
- Stromberg, L.R.; Hengartner, N.W.; Swingle, K.L.; Moxley, R.A.; Graves, S.W.; Montaño, G.A.; Mukundan, H. Membrane Insertion for the Detection of Lipopolysaccharides: Exploring the Dynamics of Amphiphile-in-Lipid Assays. PLoS ONE 2016, 11, e0156295. [Google Scholar] [CrossRef]
- Anderson, A.S.; Dattelbaum, A.M.; Montaño, G.A.; Price, D.N.; Schmidt, J.G.; Martinez, J.S.; Grace, W.K.; Grace, K.M.; Swanson, B.I. Functional PEG-modified thin films for biological detection. Langmuir 2008, 24, 2240–2247. [Google Scholar] [CrossRef]
- Deng, L.; Kitova, E.N.; Klassen, J.S. Dissociation kinetics of the streptavidin-biotin interaction measured using direct electrospray ionization mass spectrometry analysis. J. Am. Soc. Mass. Spectrom. 2013, 24, 49–56. [Google Scholar] [CrossRef] [Green Version]
- Bliokh, K.Y.; Bliokh, Y.P. Polarization, transverse shifts, and angular momentum conservation laws in partial reflection and refraction of an electromagnetic wave packet. Phys. Rev. E 2007, 75, 066609. [Google Scholar] [CrossRef] [Green Version]
- Dahlin, A.B. Size matters: Problems and advantages associated with highly miniaturized sensors. Sensors 2012, 12, 3018–3036. [Google Scholar] [CrossRef] [Green Version]
- Jeong, Y.; Kook, Y.-M.; Lee, K.; Koh, W.-G. Metal enhanced fluorescence (MEF) for biosensors: General approaches and a review of recent developments. Biosens. Bioelectron. 2018, 111, 102–116. [Google Scholar] [CrossRef]
- Sciuto, E.L.; Santangelo, M.F.; Villaggio, G.; Sinatra, F.; Bongiorno, C.; Nicotra, G.; Libertino, S. Photo-physical characterization of fluorophore Ru(bpy)32+ for optical biosensing applications. Sens. Bio-Sens. Res. 2015, 6, 67–71. [Google Scholar] [CrossRef] [Green Version]
- Sciuto, E.L.; Bongiorno, C.; Scandurra, A.; Petralia, S.; Cosentino, T.; Conoci, S.; Sinatra, F.; Libertino, S. Functionalization of Bulk SiO2 Surface with Biomolecules for Sensing Applications: Structural and Functional Characterizations. Chemosensors 2018, 6, 59. [Google Scholar] [CrossRef] [Green Version]
Figure 1.
Top-down comparison of the biosensor platforms being evaluated. (a) WOB diagram. DPL: diode-pumped laser; ND1.0: 1-stop neutral density filter; PF: polarizing filter; HWP: half-wave plate; FL200: focusing lens with 200-mm focal length; LPF: long-pass filter. (b) PTB diagram. DL: diode laser; FL125: focusing lens with 125-mm focal length. (c) Photograph of PTB inside of a 22″ × 14″ × 9″ case equipped with a monitor (embedded in the top panel of the case), keyboard, and mouse (total weight 19.4 lbs).

Figure 2.
Representative fluorescence spectra of 1 nM streptavidin-Alexa Fluor 532 conjugate from 400–700 nm recorded on WOB (red) and PTB (blue). RFU: relative fluorescence units.
Figure 2.
Representative fluorescence spectra of 1 nM streptavidin-Alexa Fluor 532 conjugate from 400–700 nm recorded on WOB (red) and PTB (blue). RFU: relative fluorescence units.

Figure 3.
Comparison of biosensor performance. (a) Graphical representation of signal (blue) and noise (red) on a spectrum of PTB recorded with 1 nM SA-AF532, as used to estimate the signal-to-noise ratio (SNR) in this work. RFU: relative fluorescence units. (b) Comparison of average SNRs of WOB and PTB. Error bars are ± one standard deviation (n = 4).

Publisher’s Note: MDPI stays neutral with regard to jurisdictional claims in published maps and institutional affiliations. |
© 2022 by the authors. Licensee MDPI, Basel, Switzerland. This article is an open access article distributed under the terms and conditions of the Creative Commons Attribution (CC BY) license (https://creativecommons.org/licenses/by/4.0/).
Share and Cite
MDPI and ACS Style
Kocheril, P.A.; Lenz, K.D.; Mascareñas, D.D.L.; Morales-Garcia, J.E.; Anderson, A.S.; Mukundan, H. Portable Waveguide-Based Optical Biosensor. Biosensors 2022, 12, 195. https://doi.org/10.3390/bios12040195
AMA Style
Kocheril PA, Lenz KD, Mascareñas DDL, Morales-Garcia JE, Anderson AS, Mukundan H. Portable Waveguide-Based Optical Biosensor. Biosensors. 2022; 12(4):195. https://doi.org/10.3390/bios12040195
Chicago/Turabian StyleKocheril, Philip A., Kiersten D. Lenz, David D. L. Mascareñas, John E. Morales-Garcia, Aaron S. Anderson, and Harshini Mukundan. 2022. "Portable Waveguide-Based Optical Biosensor" Biosensors 12, no. 4: 195. https://doi.org/10.3390/bios12040195
Note that from the first issue of 2016, this journal uses article numbers instead of page numbers. See further details here.