Article

Salt Tolerance in Machilus faberi: Elucidating Growth and Physiological Adaptations to Saline Environments

1
College of Horticulture, Hunan Agricultural University, Changsha 410128, China
2
Hunan Botanical Garden, Changsha 410128, China
3
Hunan Mid-Subtropical Quality Plant Breeding and Utilization Engineering Technology Research Center, Changsha 410005, China
4
Engineering Research Center for Horticultural Crop Germplasm Creation and New Variety Breeding, Ministry of Education, Changsha 410128, China
5
School of Economics, Hunan Agricultural University, Changsha 410128, China
6
School of Biological Sciences, Nanyang Technological University, 60 Nanyang Drive, Singapore 637551, Singapore
*
Authors to whom correspondence should be addressed.
Biology 2024, 13(2), 75; https://doi.org/10.3390/biology13020075
Submission received: 18 December 2023 / Revised: 8 January 2024 / Accepted: 22 January 2024 / Published: 26 January 2024

Abstract

:

Simple Summary

In this study, the physiological response mechanism of Machilus faberi Hemsl under salt stress was discussed. In different salt concentration environments, we observed the growth status of and internal changes in plants. For example, plants of this species could still grow normally at a concentration of 100–300 mmol−1/L. These findings provide important theoretical data for the promotion of this species in saline–alkaline areas. This study provides a practical basis for the promotion of this species and fills the research gap of this species under abiotic stress.

Abstract

Adversity stress is the main environmental factor limiting plant growth and development, including salt and other stress factors. This study delves into the adaptability and salt tolerance mechanisms of Machilus faberi Hemsl, a species with potential for cultivation in salinized areas. We subjected the plants to various salt concentrations to observe their growth responses and to assess key physiological and biochemical indicators. The results revealed that under high salt concentrations (500 and 700 mmol−1/L), symptoms such as leaf yellowing, wilting, and eventual death were observed. Notably, plant height and shoot growth ceased on the 14th day of exposure. Chlorophyll content (a, b, total a + b, and the a/b ratio) initially increased but subsequently decreased under varying levels of salt stress. Similarly, the net photosynthetic rate, stomatal conductance, leaf water content, and root activity significantly declined under these conditions. Moreover, we observed an increase in malondialdehyde levels and relative conductivity, indicative of cellular damage and stress. The activity of superoxide dismutase and ascorbate peroxidase initially increased and then diminished with prolonged stress, whereas peroxidase activity consistently increased. Levels of proline and soluble protein exhibited an upward trend, contrasting with the fluctuating pattern of soluble sugars, which decreased initially but increased subsequently. In conclusion, M. faberi exhibits a degree of tolerance to salt stress, albeit with growth limitations when concentrations exceed 300 mmol−1/L. These results shed light on the plant’s mechanisms of responding to salt stress and provide a theoretical foundation for its cultivation and application in salt-affected regions.

1. Introduction

Plants are often affected by a variety of abiotic stresses during their growth, with soil salinization being a critical environmental challenge that limits plant productivity [1]. Currently, approximately 800 million hectares of land globally, about 25% of the Earth’s land area, is affected by salinization, and the number is rising annually, especially in arid and semi-arid climates [2,3]. Factors such as low rainfall, high evaporation, poor water management, and the misuse of large amounts of fertilizers contribute to the increasing concentration of soil salinity [4]. Excessive salt in the soil leads to increased osmotic pressure in soil solutions, reduced soil aeration, and decreased water permeability. These changes not only diminish soil fertility but also significantly impede plant growth and productivity, potentially resulting in biodiversity loss [1,5].
Efforts to mitigate the negative impacts of salt stress on plants have led to significant advancements in enhancing plant salt tolerance through traditional selection and breeding techniques [2]. However, despite these advances, the survival adaptation mechanisms of plants under salt stress remain insufficiently understood [6]. The detrimental effects of salinity on plants can vary based on climatic conditions, light intensity, plant species, and soil properties. In response to salt stress, plants undergo a range of physiological and biochemical changes, such as osmoregulation, CO2 assimilation, photosynthetic electron transport, chlorophyll content and fluorescence, reactive oxygen species (ROS) production, and antioxidant defense systems [7]. Correlations have been observed between various biochemical indicators and the salt tolerance of plants [8]. Notably, most plants struggle to thrive in high-salt environments; concentrations as low as 100–200 mmol−1/L can hinder or halt their growth and development, potentially leading to plant death, sometimes within a short duration. However, a small number of plants survive in environments with a salt concentration of 300~500 mmol−1/L and show significant resilience [9,10]. Given the high salinity tolerance of these plants, there has been a growing interest in cultivating salt-tolerant species in salt-affected soils. This approach offers an alternative strategy for economic desalination and the restoration of severely degraded saline–alkaline lands [11]. This process, known as phytoremediation, leverages the inherent capabilities of these plants to rehabilitate salt-impacted environments effectively.
Machilus faberi, a member of the Lauraceae family’s Machilus genus, is a precious native tree species with wide application and unique ornamental value. Studying the physiological response mechanism of M. faberi is conducive to the popularization and application of this species. Therefore, M. faberi was selected for research. Existing studies have predominantly focused on the analysis of volatile oil composition in leaves [12], anti-fungi in vitro, transplanting technology [13], and forest land selection [14,15]. Research on the physiological responses of M. faberi under abiotic stress is relatively lacking.
The aim of this study was to explore the physiological traits, growth state, and photosynthetic system of M. faberi under salt stress, aiming to gain a comprehensive understanding of its salt tolerance mechanisms. This study evaluated the physiological response mechanism of salt stress on M. faberi. The results provide data support for its cultivation and application in saline environments.

2. Materials and Methods

2.1. Plant Materials

In May 2022, one-year-old seedlings of M. faberi exhibiting consistent growth and promising potential were sourced mainly from the germplasm resource garden of the Hunan Botanical Garden. These were planted in flowerpots (25 cm × 30 cm), using a cultivation matrix composed of garden soil, peat, perlite, and cow dung in a ratio of 8:6:3:1. The experimental site was located in the greenhouse of the Flower Base of Hunan Agricultural University (113°08′ E, 28°18′ N). The annual average temperature is 17.2 °C, the annual average precipitation is 1361.6 mm, the annual average sunshine is about 1200–1600 h, the daytime temperature is 25°~30°, the nighttime temperature is 8°~15°, and the relative humidity is 85%~95%. Unified water and fertilizer management was ensured.

2.2. Salt Stress Treatment Using Sodium Chloride

In this study, sodium chloride of high purity (greater than 99%) was utilized as the agent for salt stress treatment. Based on previous studies and pre-experimental results, we established five distinct salt concentration gradients: 0, 100, 300, 500, and 700 mmol−1/L. The plants grew strong and well. Each treatment group was set up with 3 replicates and 5 plants per replicate, and each plant was planted in a flowerpot. Different concentrations of salt solution were prepared, and salt treatment was performed every 5 days during the experiment. In order to avoid the loss of salt and water as much as possible, a tray was set at the bottom of the basin, and the exuded salt was poured back into the basin in time. In addition, in order to prevent salt accumulation, 300 mL of half-strength Hoagland nutrient solution was used to irrigate every three days [16].

2.3. Morphological Measurements

The data collected before the stress treatment were T0. On the 7th, 14th, 21st, and 28th days after stress treatment, the data were collected again as T7, T14, T21, and T28. The measured morphological characteristics included plant height, the growth length of new shoots, and the number of new shoots.

2.4. Chlorophyll Determination

Mature leaves were collected from the top of the plant and washed thoroughly with deionized water. The samples were dried and sliced on transparent paper. Then, 0.2 g of fresh leaf samples were weighed and soaked in 10 mL 95% ethanol for 24 h of dark incubation. Absorbance at 470 nm, 649 nm, and 665 nm was determined using an ultraviolet spectrophotometer (UNICO, Shanghai, China) [17]. This process was repeated at T0, T7, T14, T21, and T28 to determine chlorophyll content.

2.5. Determination of Pn and Gs

Net photosynthetic rate (Pn) and stomatal conductance (Gs) were measured using a portable photosynthesis system (LI-COR Bioscience, Lincoln, NE, USA). In each treatment, five new mature leaves were selected for testing. In order to ensure full activation, the test leaves were exposed to bright light for 10 min before testing.

2.6. Determination of Water Content, Relative Conductivity, Malondialdehyde Content, and Root Activity of Plant Leaves

The stressed material was washed, and the fresh weight of its leaves was weighed; then, it was dried in a 60° oven to constant weight, and its dry weight was measured.
The relative conductivity was assessed following Chen Aikui’s methodology to evaluate cell membrane integrity [18]. Uniformly sized plant leaves (ensuring leaf integrity and avoiding stem nodes) were first rinsed with tap water and then thrice with distilled water. Surface water was removed using filter paper, and the leaves were cut into strips of appropriate length, avoiding the main veins. Three fresh samples (0.1 g each) were quickly weighed and placed in a 10 mL graduated test tube containing deionized water, sealed with a glass stopper, and left to soak at room temperature for 12 h. The conductivity of the extract (R1) was measured using a conductivity meter. The samples were then boiled for 30 min, cooled to room temperature, shaken well, and the conductivity (R2) measured again. The relative conductivity was calculated as R1/R2 × 100%.
Oxidative damage to the cell membrane was assessed by measuring malondialdehyde (MDA) content changes over the duration of salt treatment. A 0.1 g sample was mixed with 1% trichloroacetic acid solution and centrifuged at 10,000× g for 10 min. Following this, 500 microliters of the supernatant was combined with an equal volume of 20% trichloroacetic acid solution containing 0.5% thiobarbituric acid. The mixture was heated at 90 °C for 20 min, followed by an ice bath to halt the reaction, and then centrifuged at 10,000× g for 5 min. Absorbance at 532 nm and 600 nm was measured, using a 20% trichloroacetic acid solution containing 0.5% thiobarbituric acid as a control [19]. Root activity was quantified using the TTC (triphenyl tetrazolium chloride) method [20].

2.7. The Activities of SOD, POD, and APX Were Determined

The activities of superoxide dismutase (SOD), peroxidase (POD), and ascorbate peroxidase (APX) in plant leaves were quantitatively assessed using enzyme activity assay kits provided by Sinobestbio.

2.8. The Contents of Pro, SS, and SP Were Determined

The free proline (Pro) in the leaves of M. faberi was detected via the sulfosalicylic acid method [21]. This technique is widely recognized for its accuracy in Pro quantification. For the assessment of soluble sugar (SS) content, anthrone colorimetry was employed, providing reliable measurements of sugar concentrations in plant tissues [22]. Additionally, the soluble protein (SP) content in the leaves of M. faberi was quantified using the Coomassie Brilliant Blue staining method [23], a standard approach known for its sensitivity and precision in protein analysis. Original manuscript data can be found in Supplementary Materials.

2.9. Statistical Analysis

Data processing was conducted using Excel 2021 and IBM SPSS Statistics 26 software, while Origin 2021 and R4.3.1 was utilized for chart creation. A one-way analysis of variance (ANOVA) was employed to analyze the data of various indicators under different salt stress treatments, providing a robust statistical framework for evaluating the effects of salinity on plant physiology.

3. Results

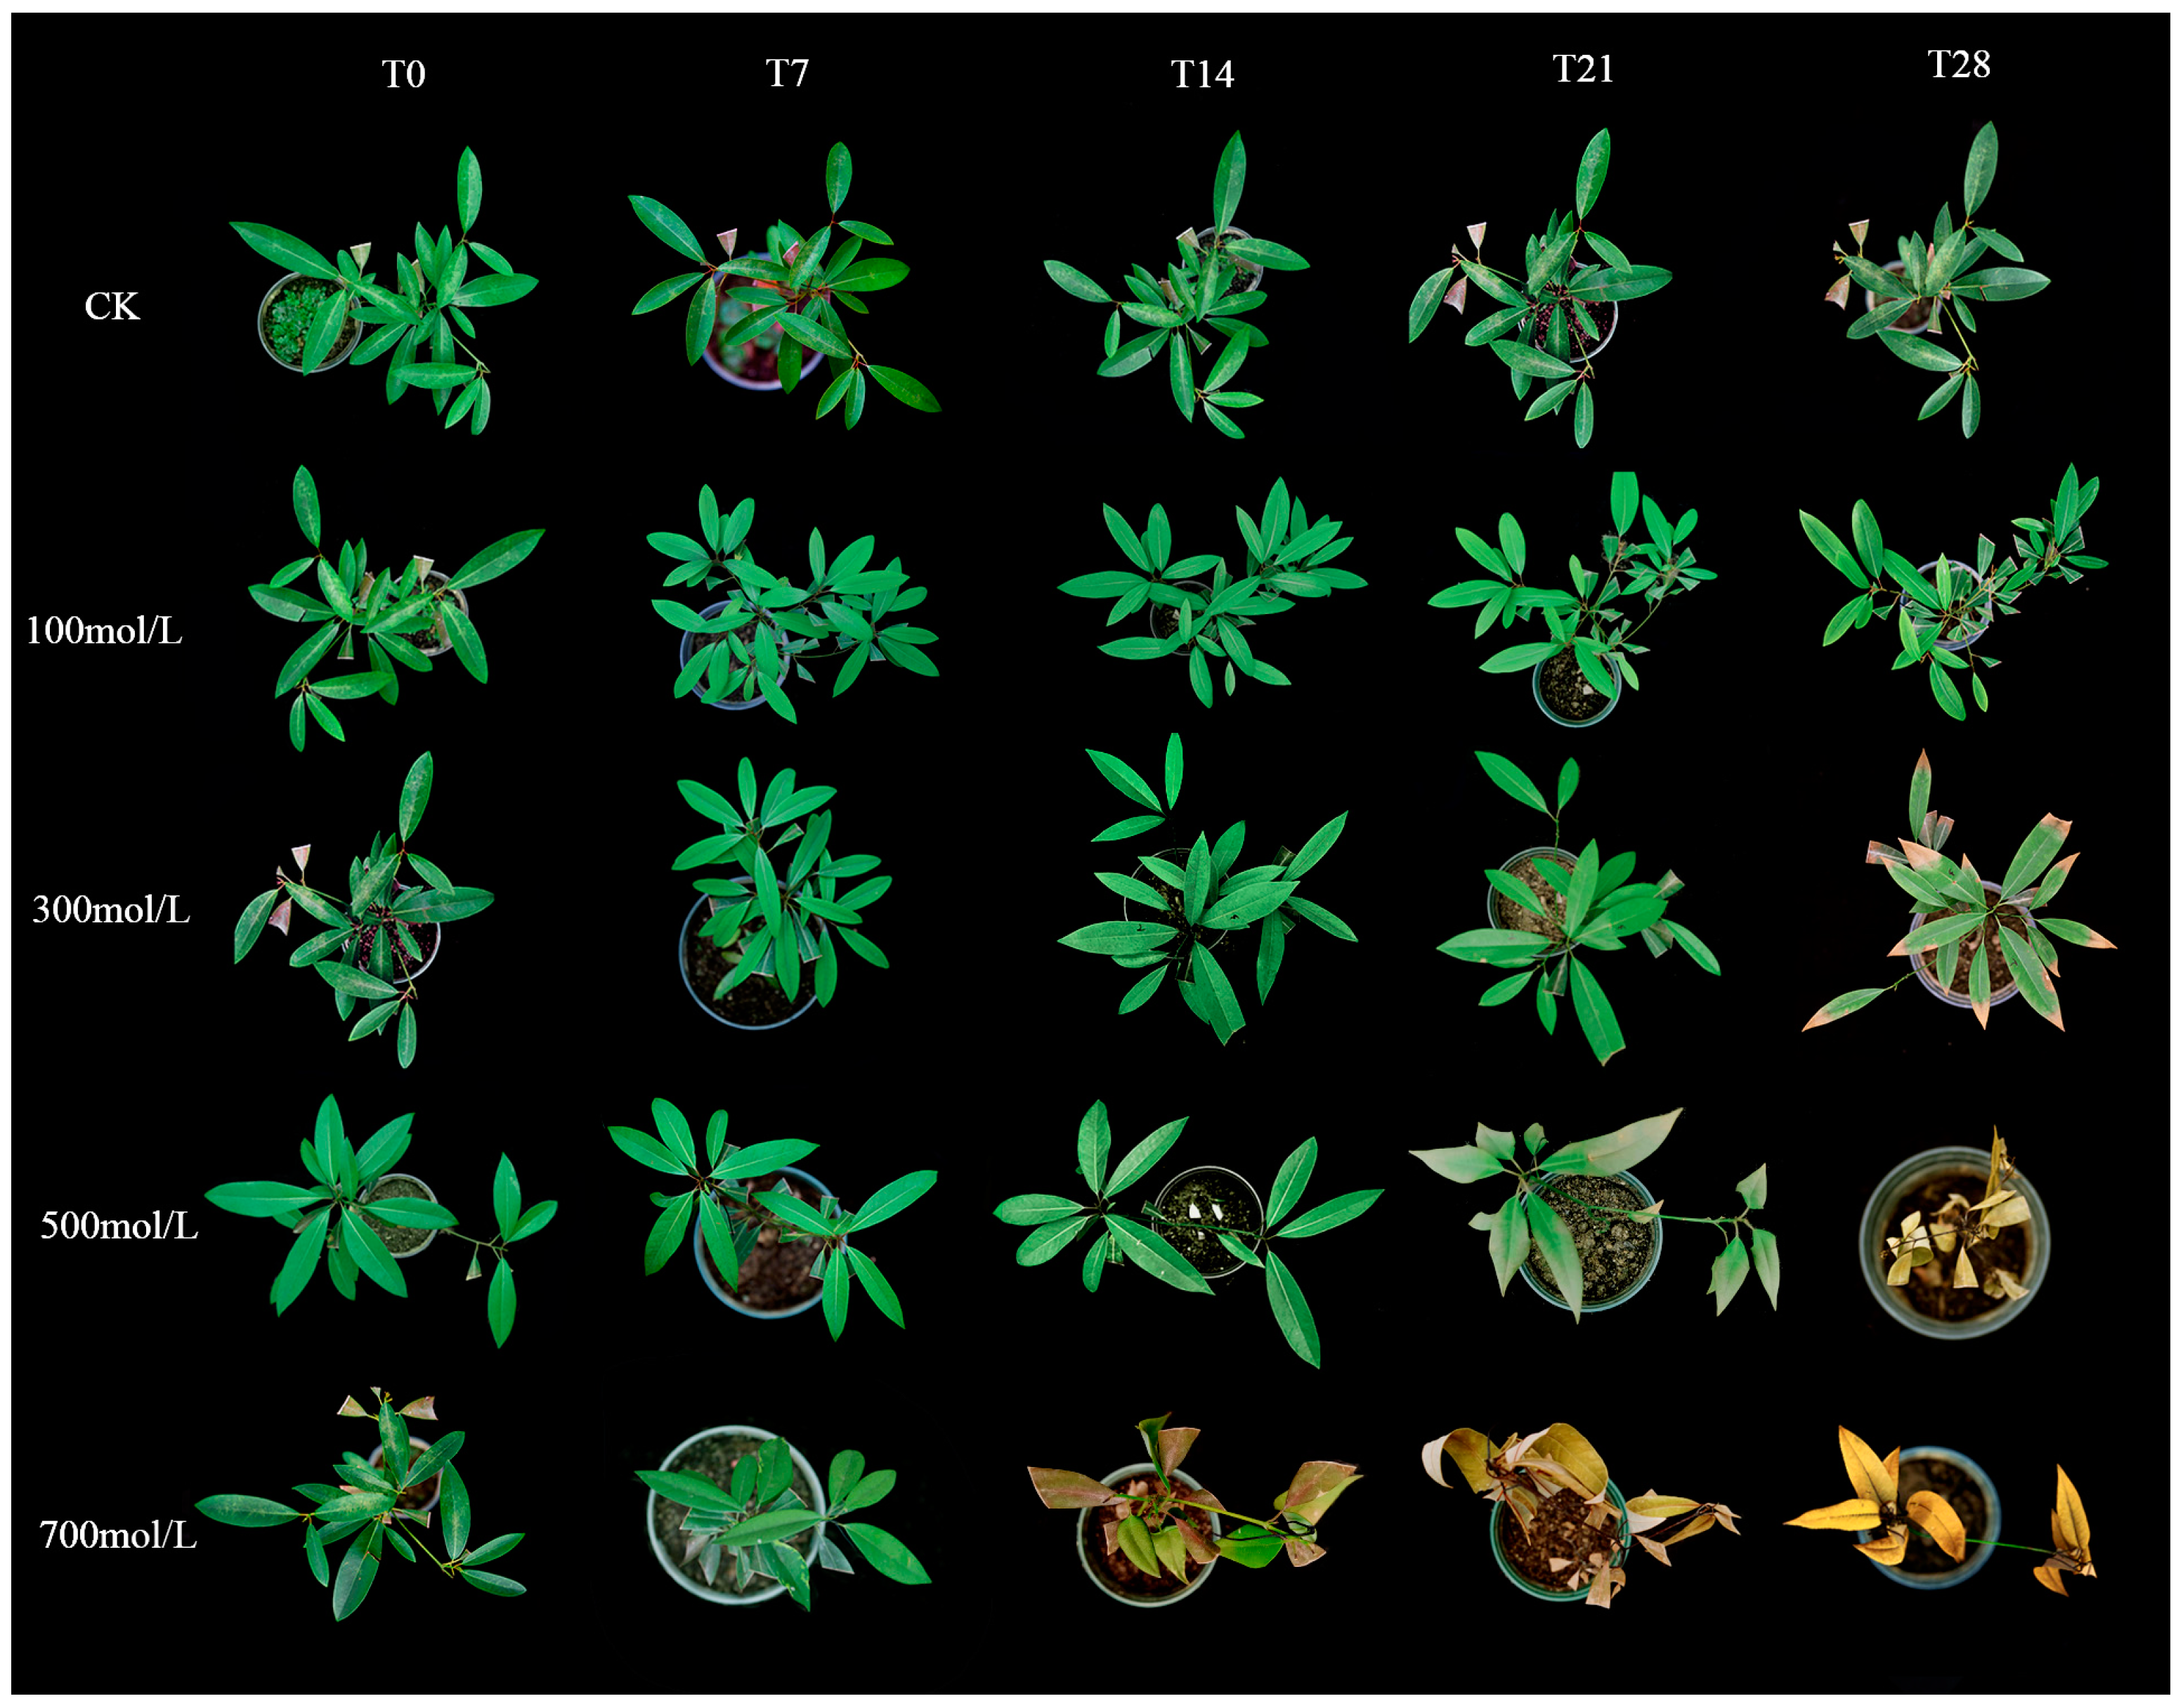
3.1. Observation of Leaf Phenotype and Change in Growth Index

The results indicated that M. faberi exhibited varying responses to different concentrations of salt stress (Figure 1). Under low salt stress, leaf yellowing was observed starting from day 21, persisting until day 28. At a moderate salt concentration of 300 mmol−1/L, yellowing of leaves commenced on the 14th day, extending to the 28th day, with yellowing initiating from the leaf tips. In conditions of high salt stress (500 and 700 mmol−1/L), visible changes started from the 21st day, with leaves beginning to discolor from the tips and progressively wilting. By the 28th day, the leaves had completely withered. Moreover, salt stress at varying concentrations significantly impacted the number of shoots, shoot length, and plant height (Table 1). While the number of shoots declined under low-concentration stress, the shoot length and plant height continued to increase steadily. Conversely, under high salt stress, there was no increase in shoot length and plant height after 14 days. Combined with the phenotype, this is due to the deepening of the degree of stress, which causes plant growth disorder, resulting in no further growth.

3.2. Changes in Chlorophyll Content in Leaves of M. faberi

In this study, the leaves of M. faberi exhibited unique characteristics, and the contents of chlorophyll a and b did not decrease as the salt stress intensified. Instead, they peaked at values of 0.20 mg/g and 0.051 mg/g (Table 2), respectively, on the 21st day of treatment. A marked decline in chlorophyll content was observed on day 28, with the rate of decrease correlating with the salt stress concentration.
The chlorophyll a/b ratio can be used as an indicator of plant stress resistance. In general, lower chlorophyll a/b values indicate stronger stress resistance. The data in Table 2 showed that under various salt stress conditions, the chlorophyll a/b ratio in the leaves of M. faberi showed a downward trend, which was related to the increase in stress time and salt concentration.

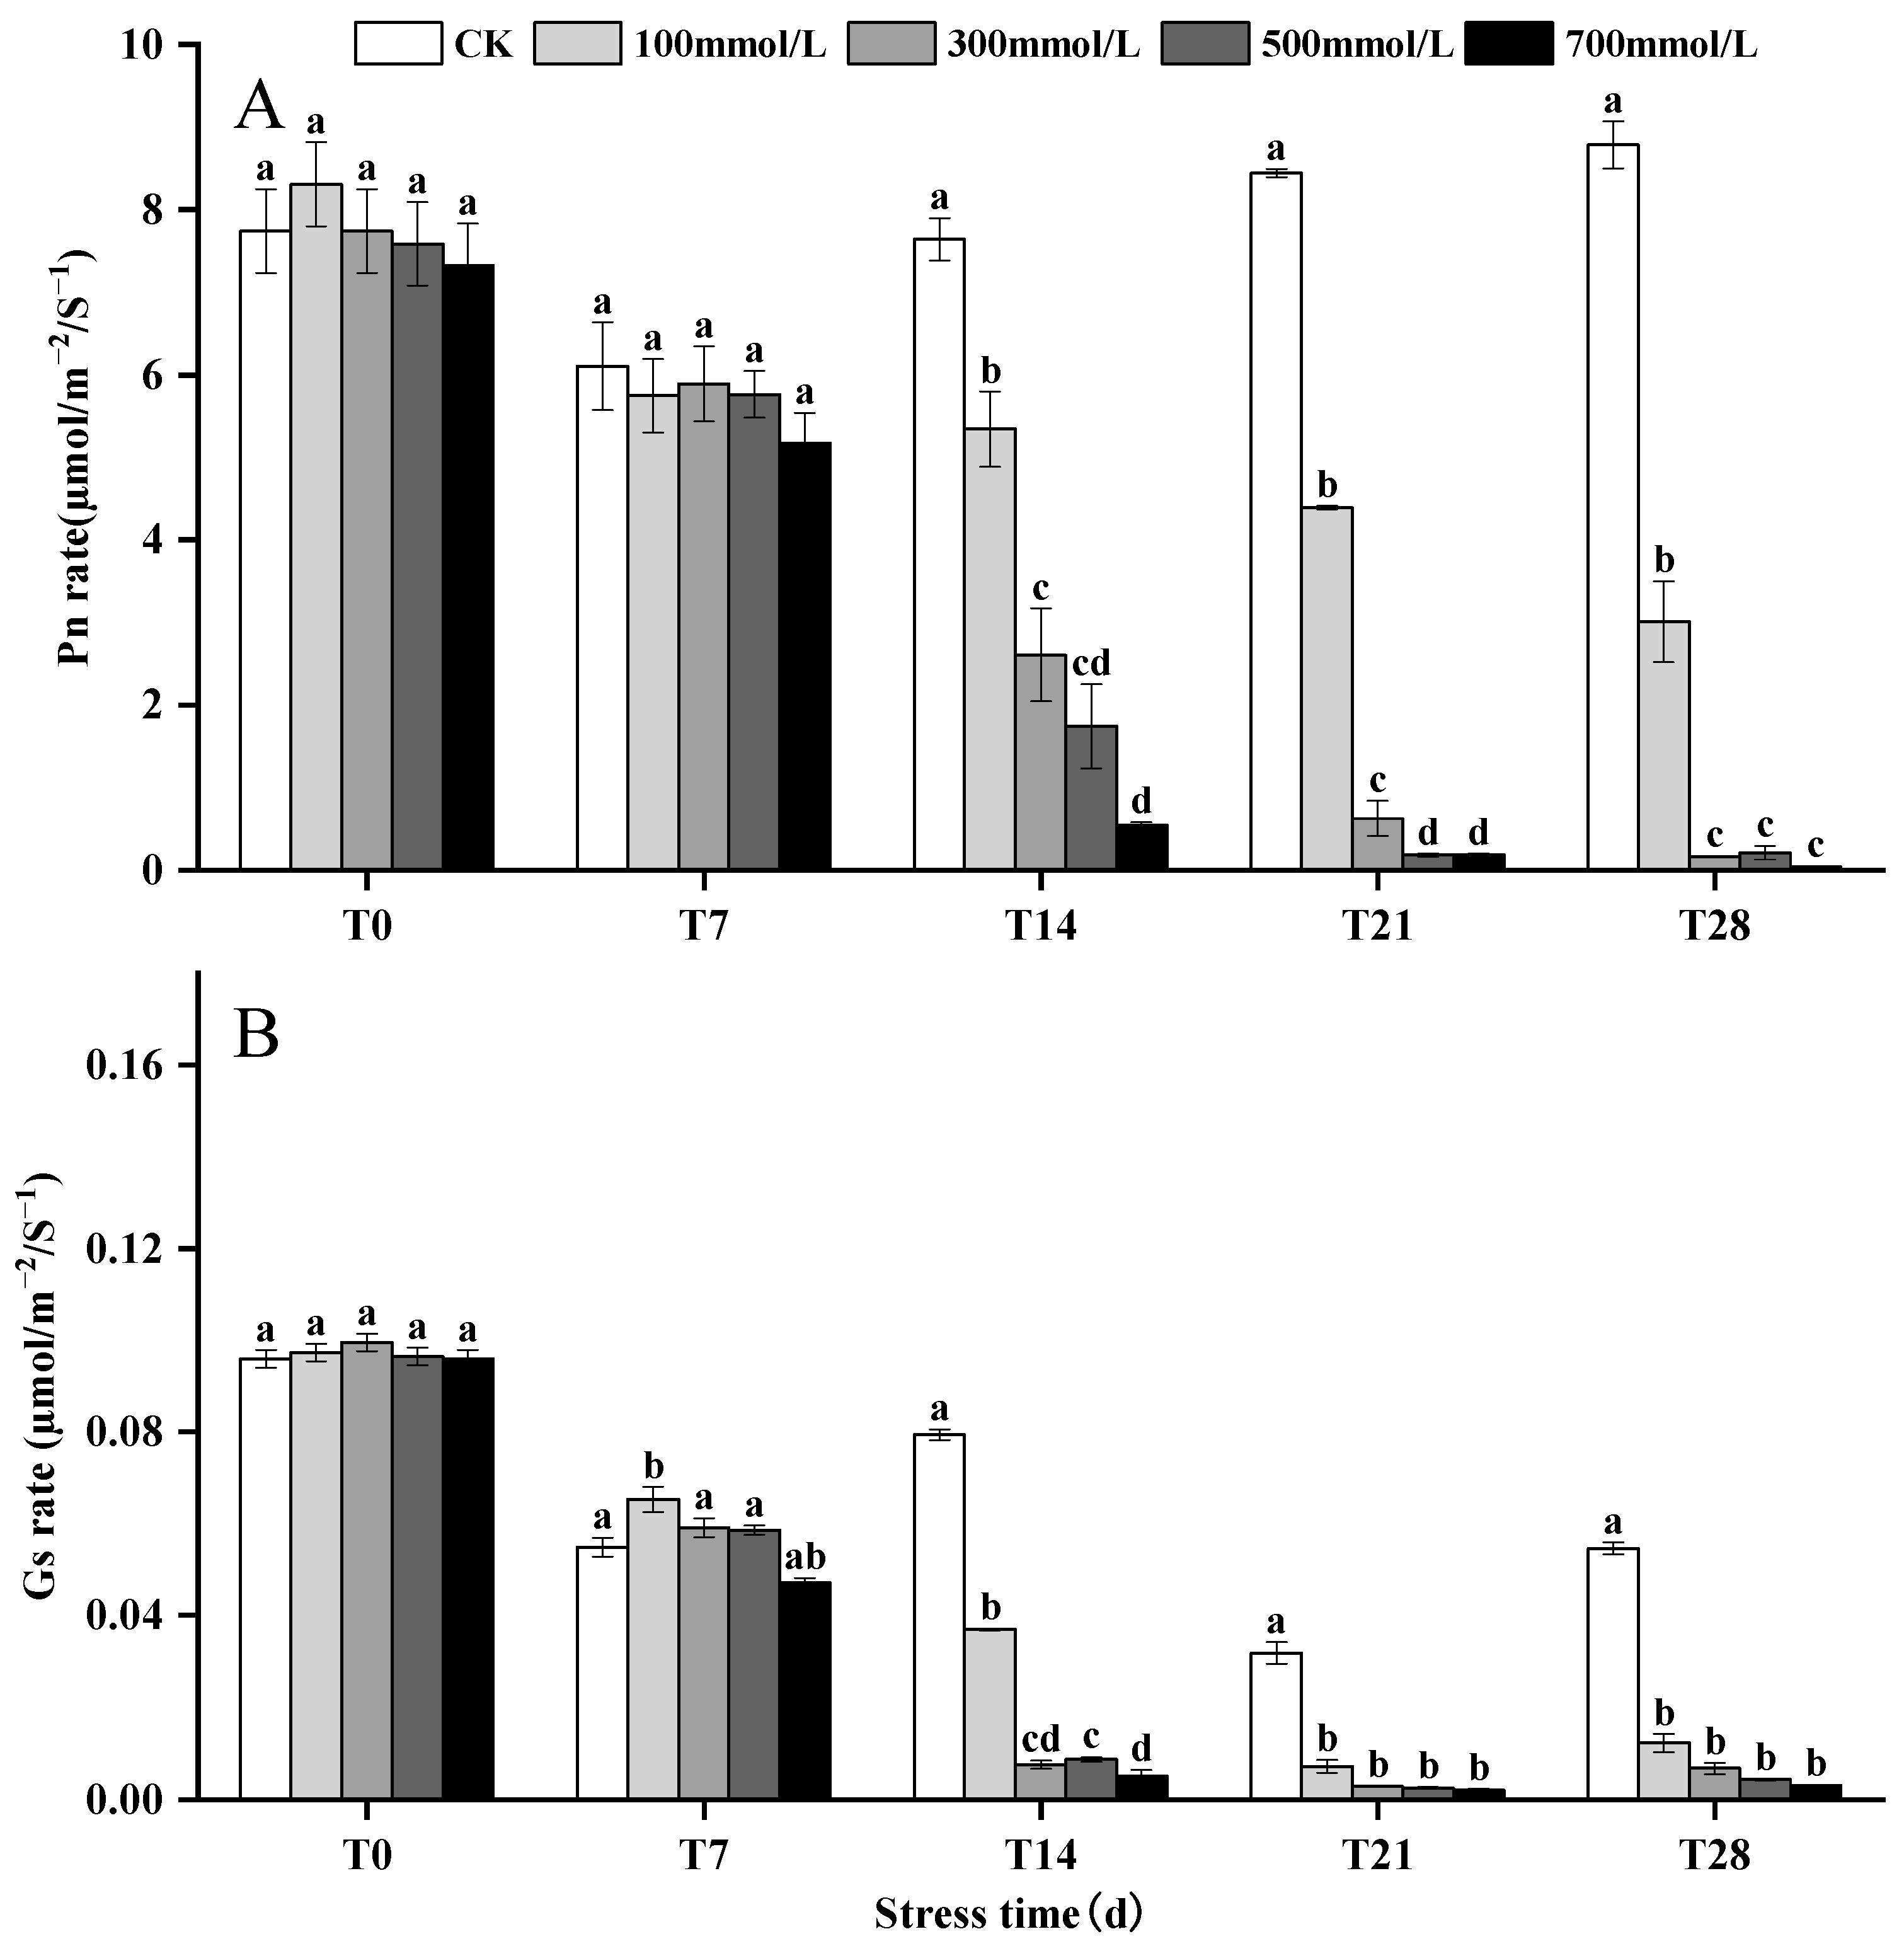
3.3. Effects of Salt Stress on Pn and Gs

After 28 days of salt stress, the Pn of M. faberi at salt concentrations of 100, 300, 500, and 700 mmol−1/L decreased by 201%, 83.7%, 79.15%, and 95.37%, respectively, compared to the control group. Similarly, Gs experienced a significant reduction, decreasing by 98.77%, 99.31%, 99.56%, and 99.68% at the respective salt concentrations (Figure 2 and Figure S2).

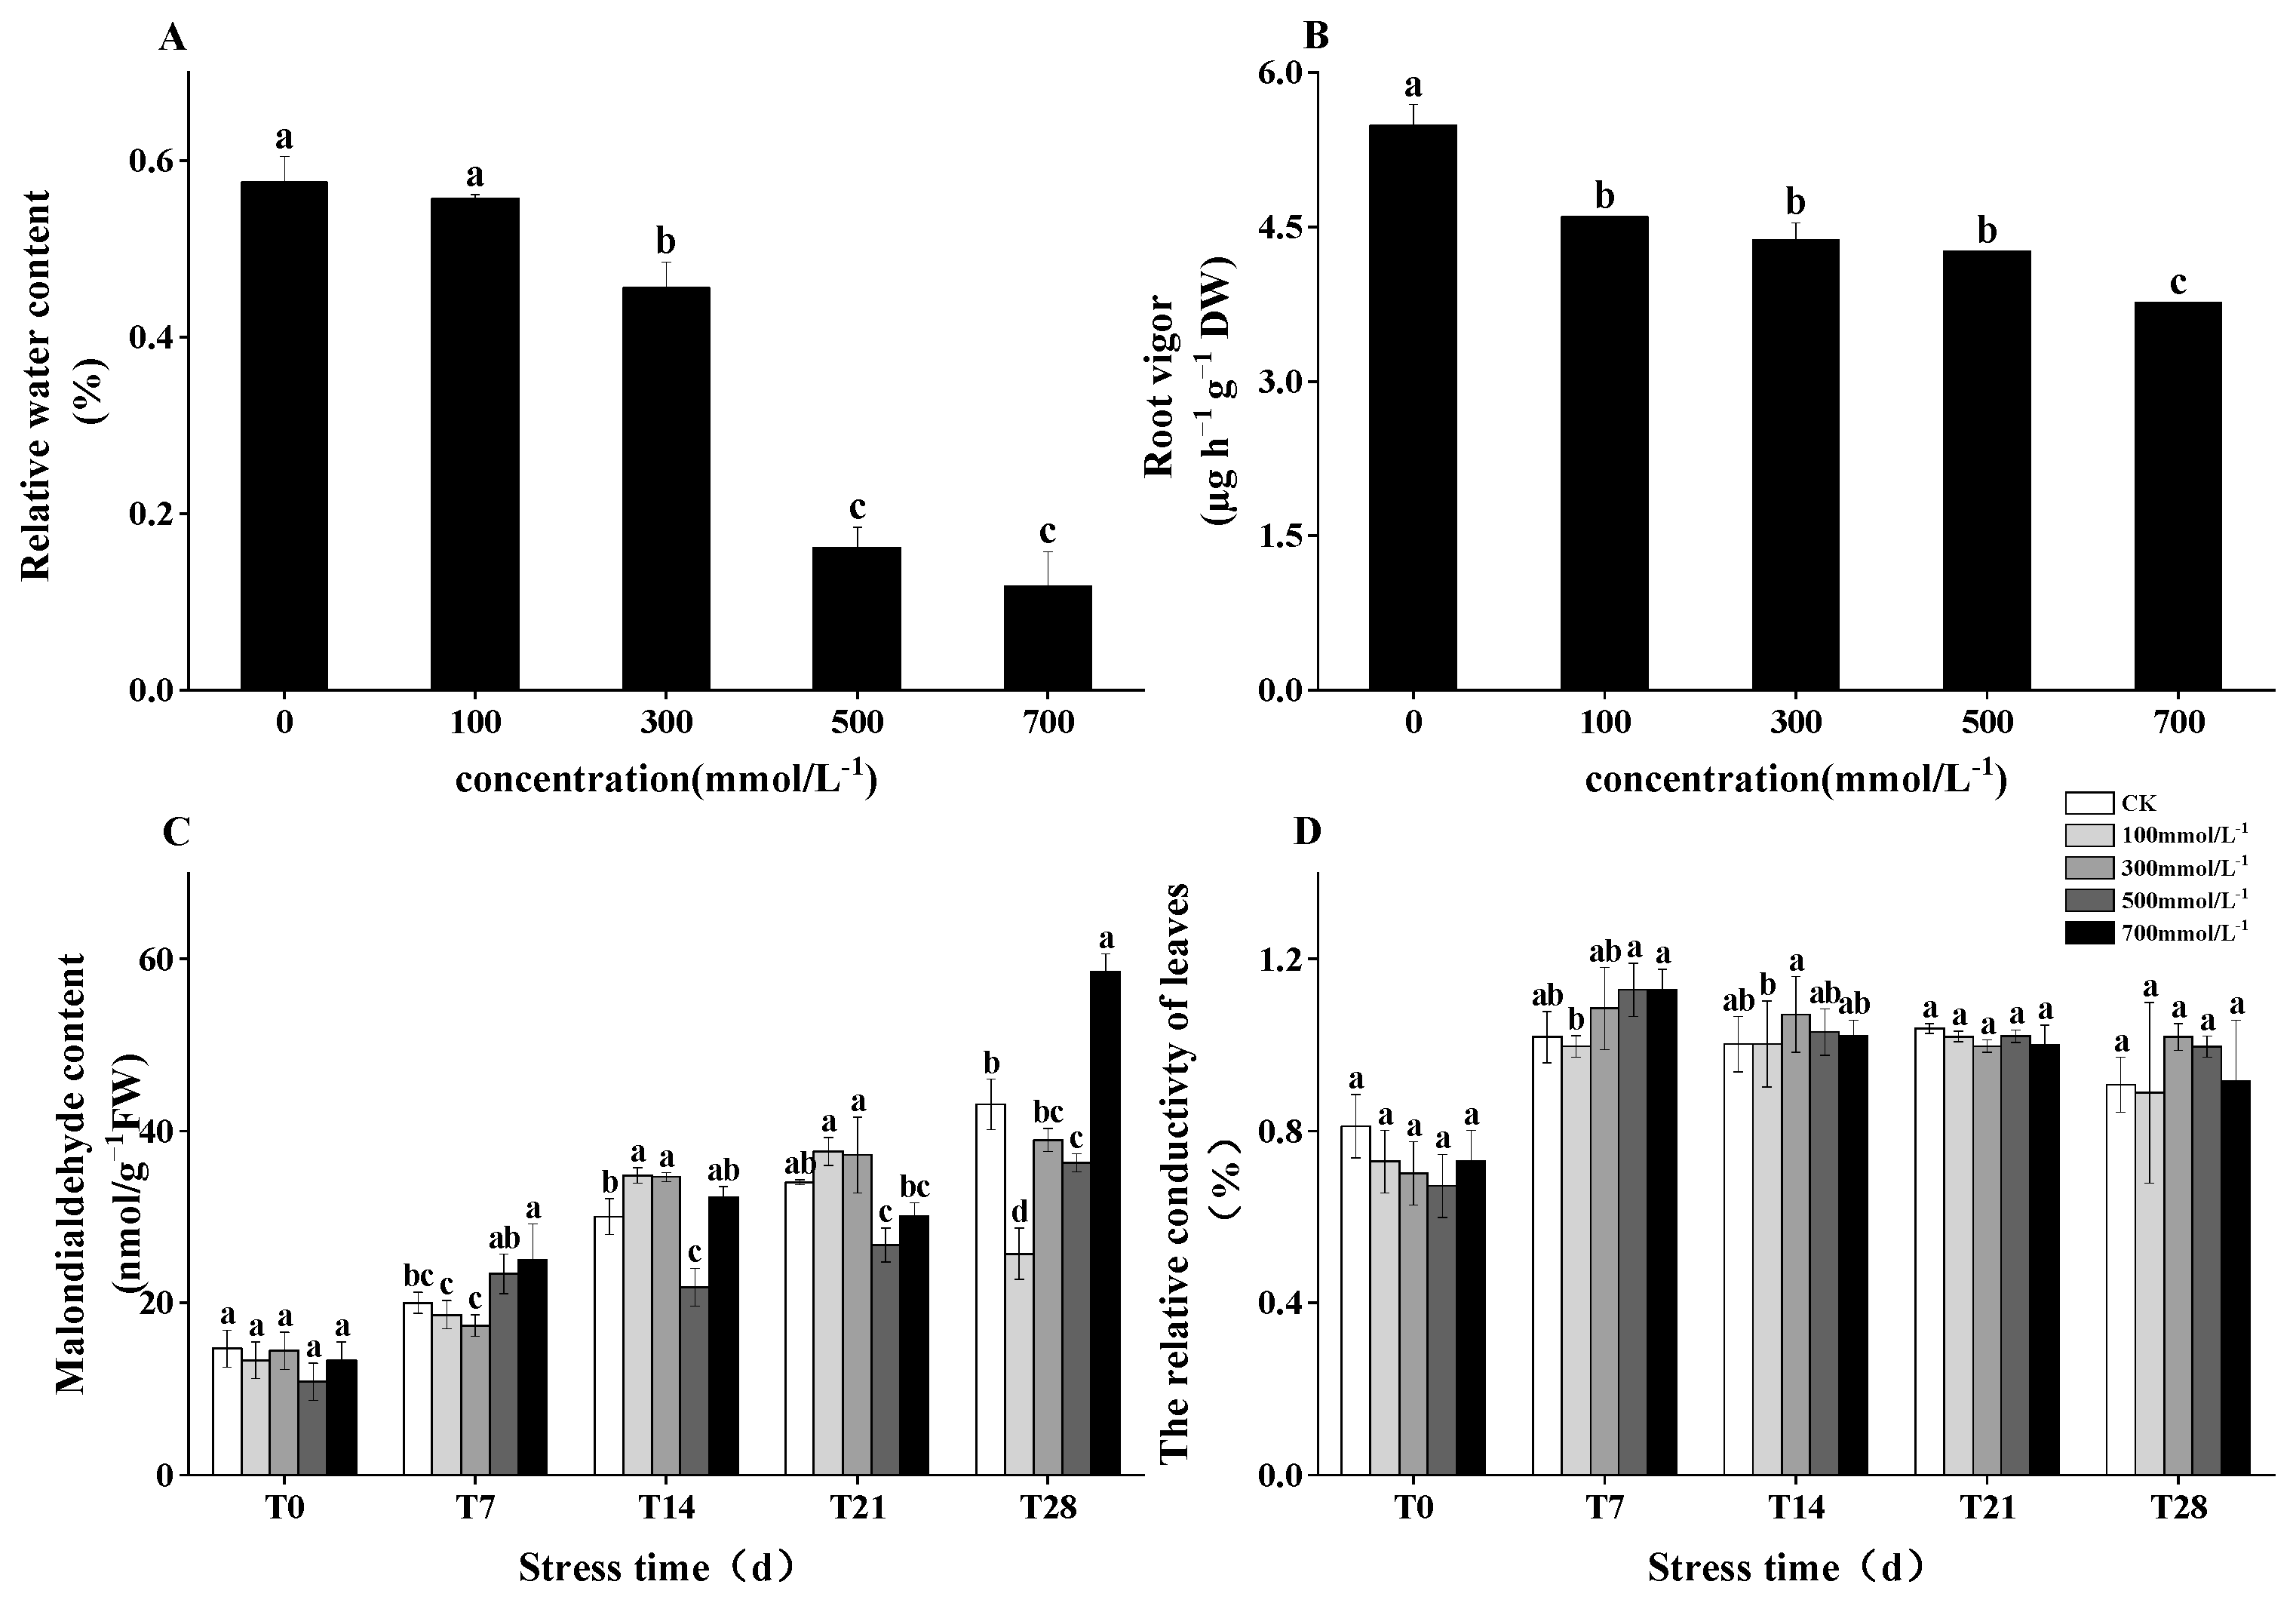
3.4. Root Activity, MDA Content, and Electrical Conductivity in Response to Salt Stress

As the salt stress intensified, the root activity of M. faberi exhibited varying trends. Under salt stress of 100 and 300 mmol−1/L, the decrease in relative water content (RWC) was relatively modest. However, at higher concentrations of 500 and 700 mmol−1/L, RWC sharply declined, by 83.82% and 88.24%, respectively. Correspondingly, root activity showed a significant decrease, with reductions of 359%, 336%, 325%, and 276% observed as the salt concentration increased. Additionally, with the prolongation of salt stress, both malondialdehyde (MDA) content and relative electrical conductivity in M. faberi exhibited an upward trend (Figure 3 and Figure S3).

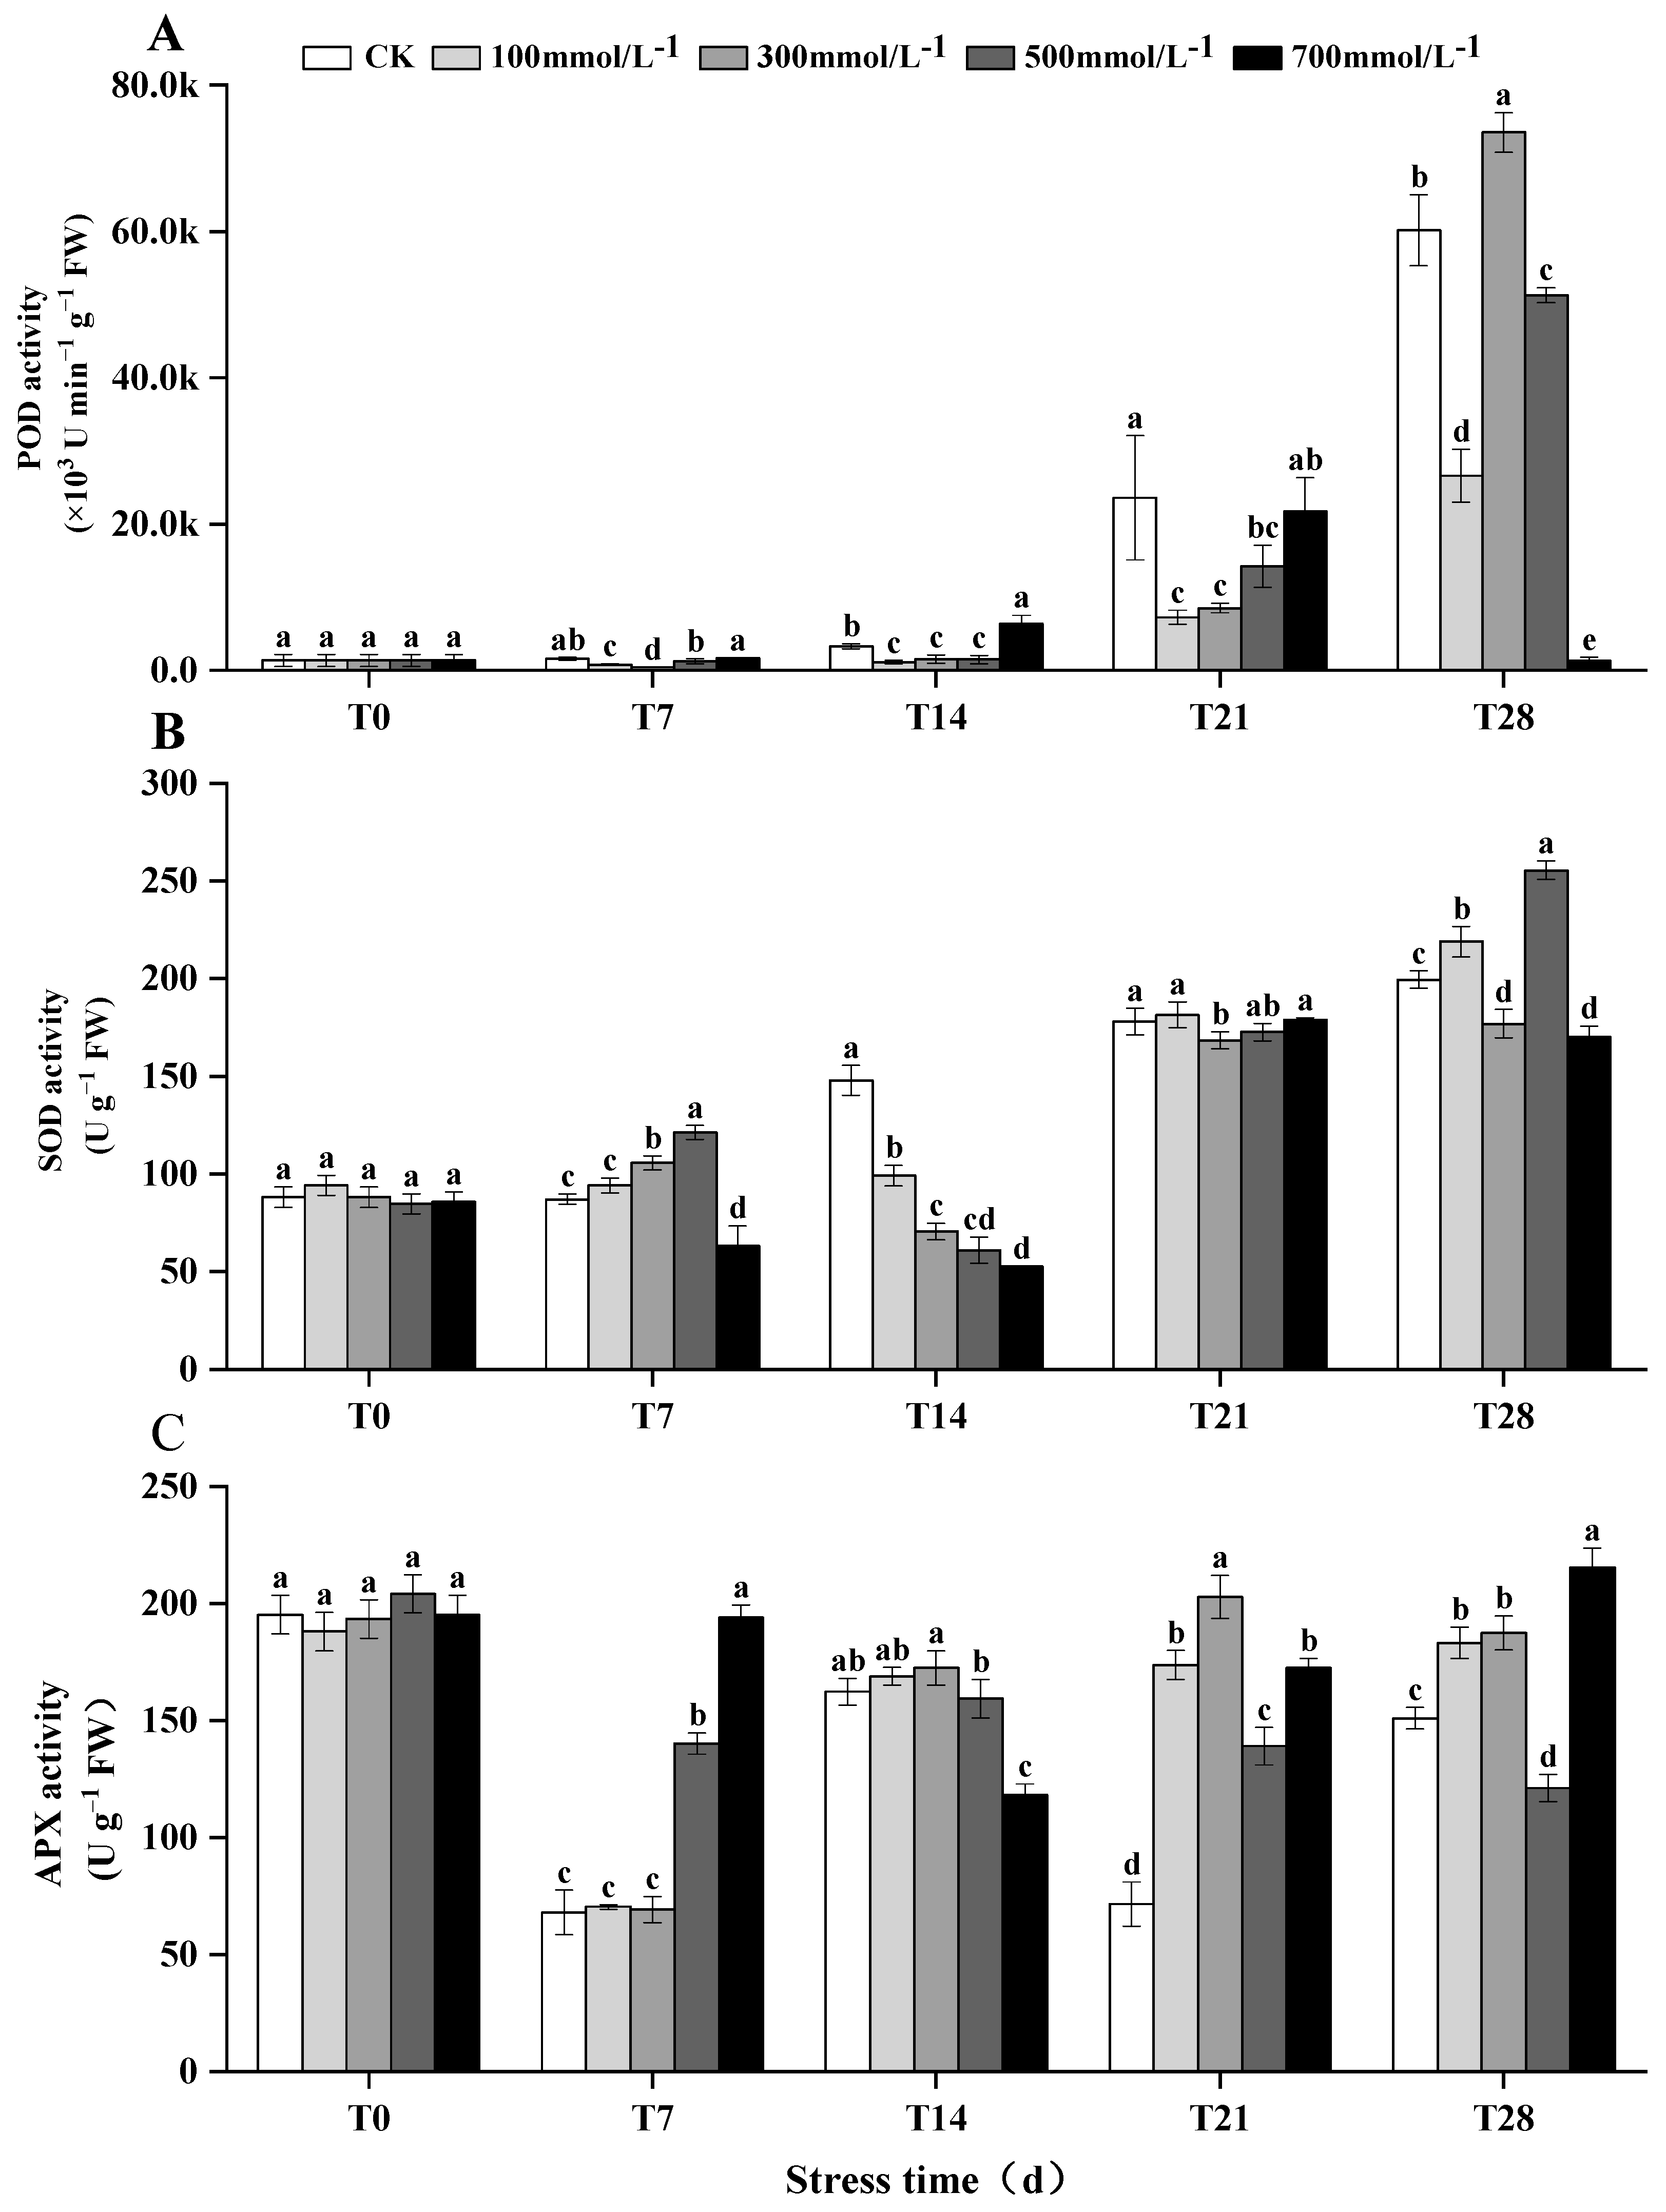
3.5. Enzymatic Responses in M. faberi Leaves under Salt Stress

The activity of SOD in M. faberi leaves exhibited a complex response to varying salt stress concentrations. Under low concentrations (100 and 300 mmol−1/L), SOD activity gradually increased. However, it decreased after 14 days of continuous exposure to high concentrations of salt stress, only to increase again after 28 days (Figure 4B and Figure S4). POD plays a crucial role in catalyzing the redox reaction between hydrogen peroxide (H2O2) and other substrates, mitigating the excess H2O2 produced by SOD and the membrane peroxidation damage caused by reactive oxygen species during stress. The POD activity in the leaves showed a consistent increase over the 28-day period under various salt stress levels (Figure 4A and Figure S4). Concurrently, APX activity also displayed an increasing trend after 28 days of continuous treatment under low-concentration salt stress, though it remained lower than the baseline (T0) levels. Notably, under high-concentration salt stress (700 mmol−1/L), APX activity first decreased and then increased, reaching a peak value of 215.39U g−1FW in the T28 period (Figure 4C and Figure S4).

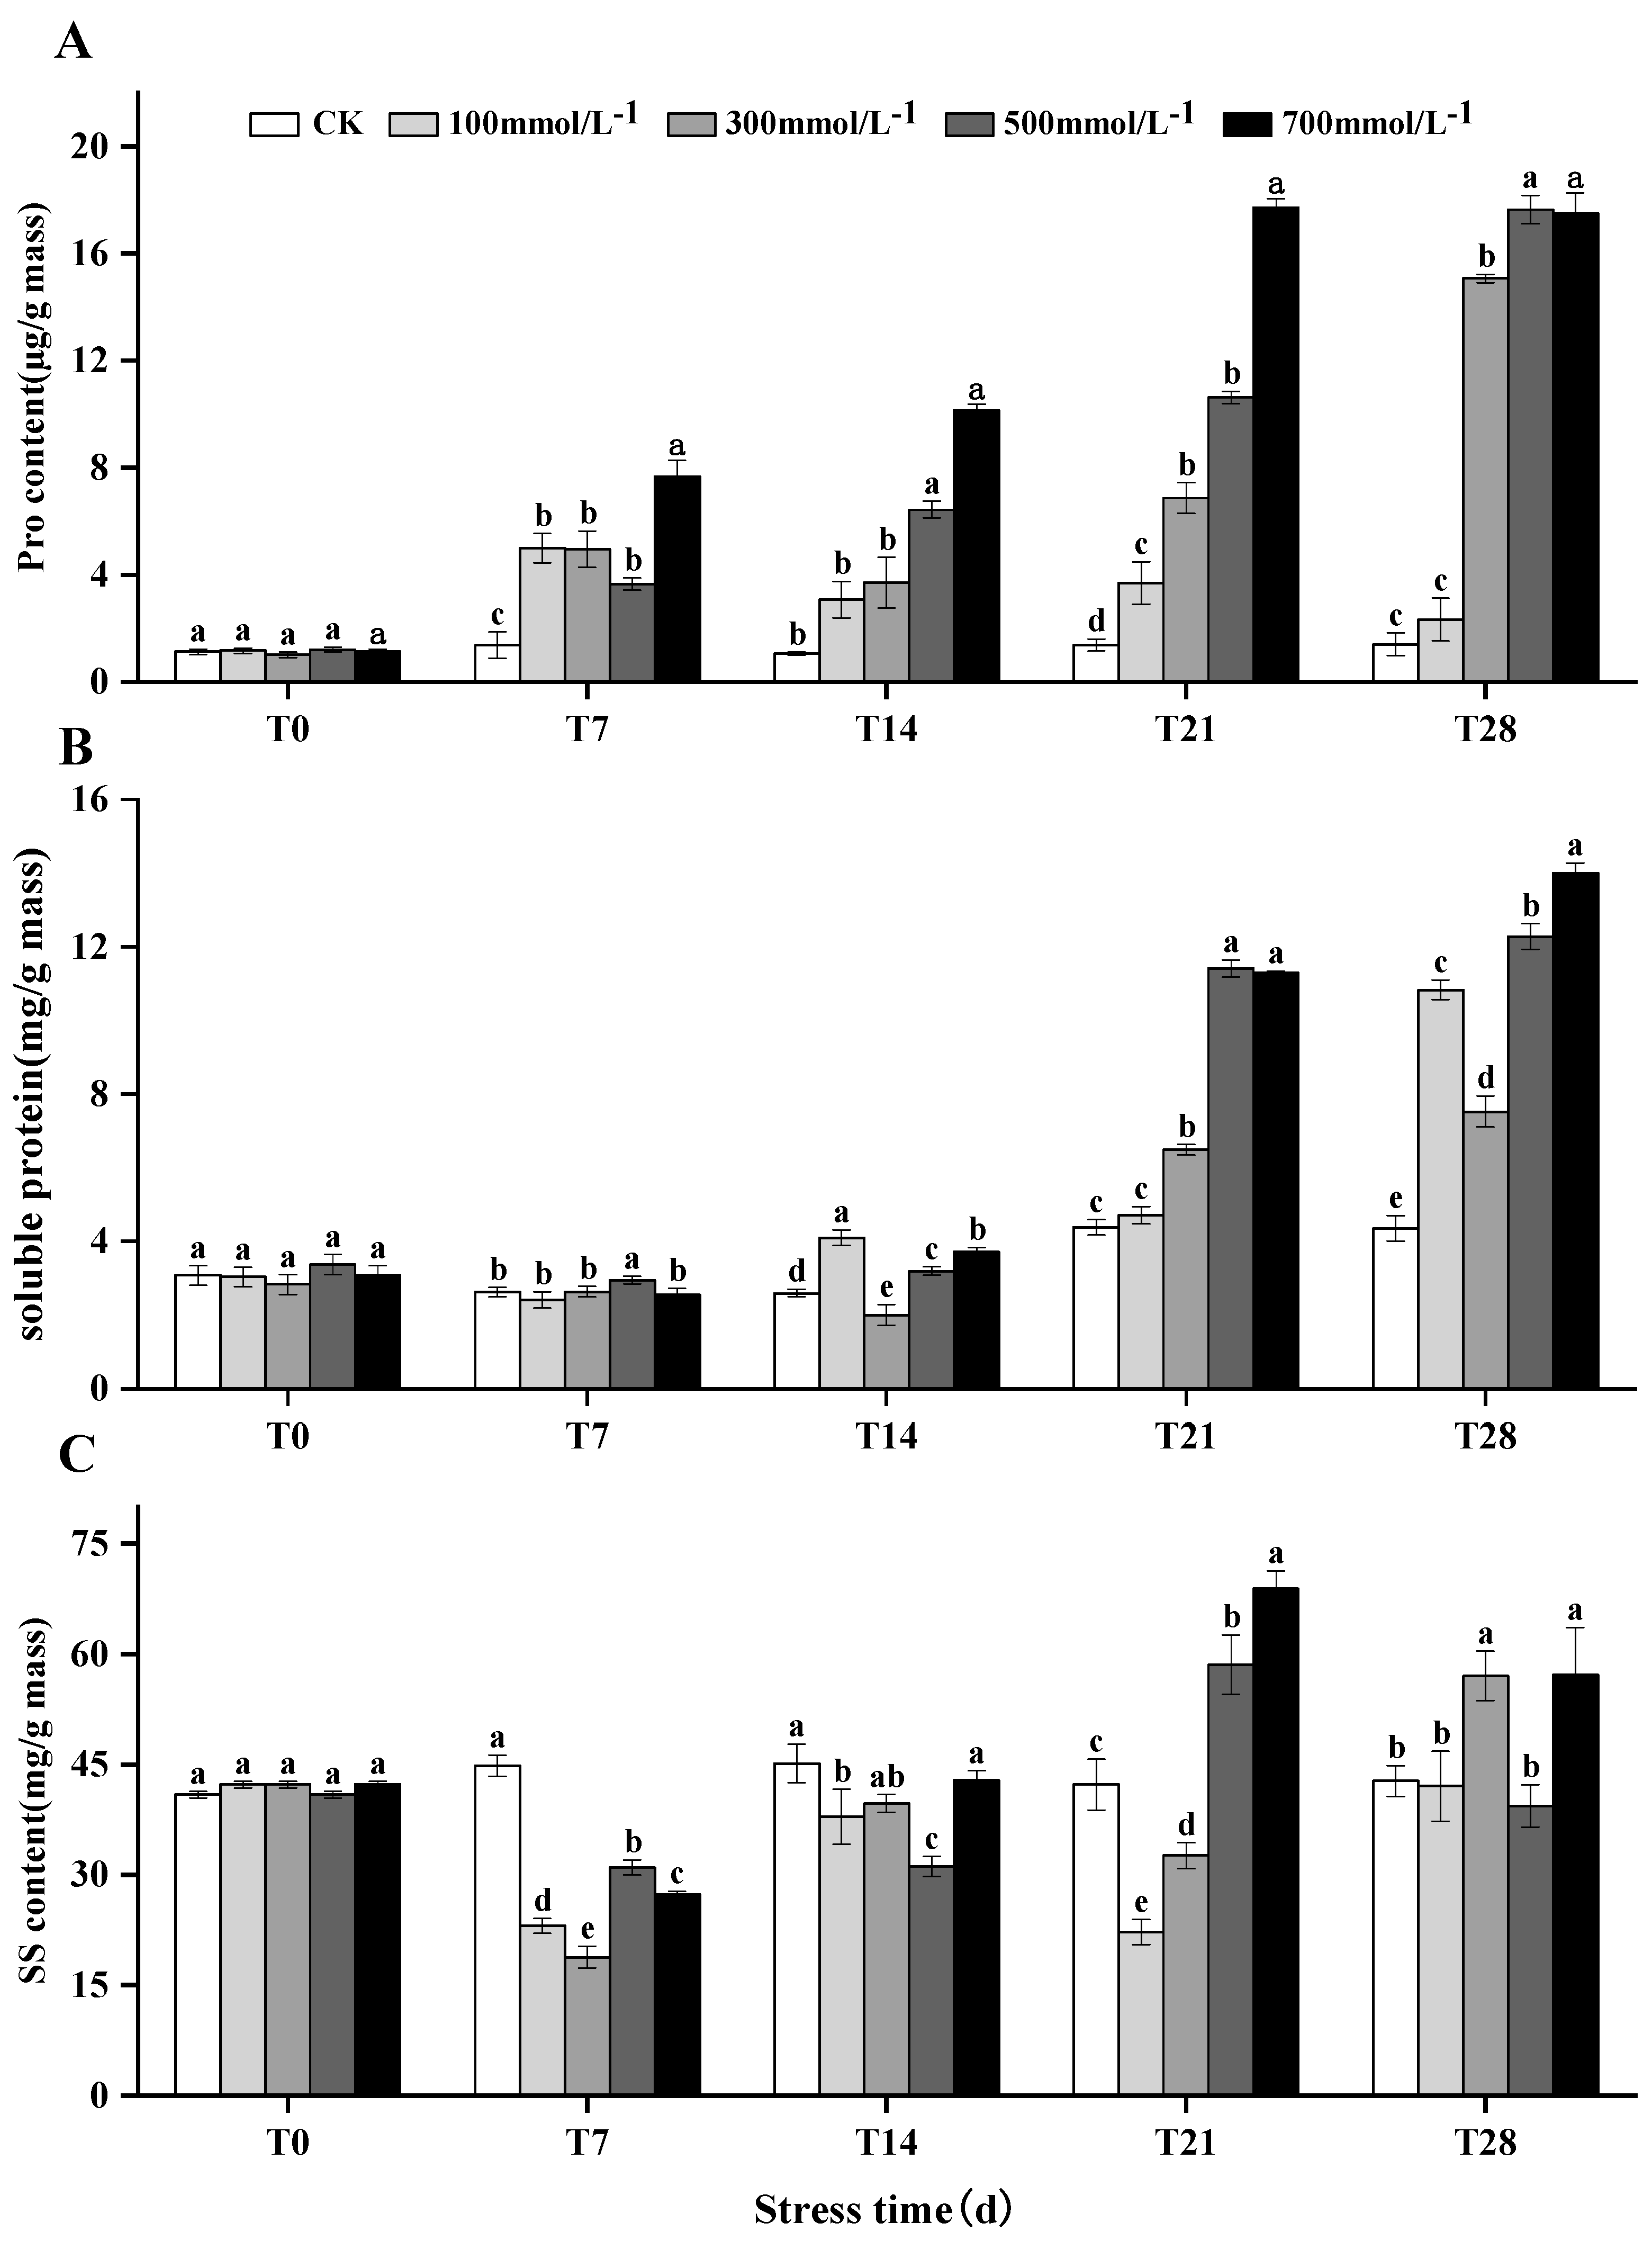
3.6. Accumulation of Soluble Proteins, Proline, and Soluble Sugars in M. faberi under Salt Stress

The levels of SP and Pro in the leaves of M. faberi exhibited an upward trend across different salt stress concentrations over time (Figure 5A,B and Figure S5). Notably, salt stress markedly enhanced the concentrations of proline and soluble protein. For instance, after 28 days of stress, the levels of proline and soluble protein under various salt concentrations were significantly higher than those in the control group, showing increases of 132%, 1407%, 1664%, 1652%, and 982% for proline and 652%, 1127%, and 1299% for soluble protein, respectively. Conversely, the content of SS in the leaves initially decreased during the T7 period (Figure 5C and Figure S5) and subsequently began to rise as the duration of stress extended. Under low-concentration salt treatments, the soluble sugar content decreased in the T21 period and then increased. However, in high-salt-stress concentrations, the soluble sugar content continued to decrease until 28 days.

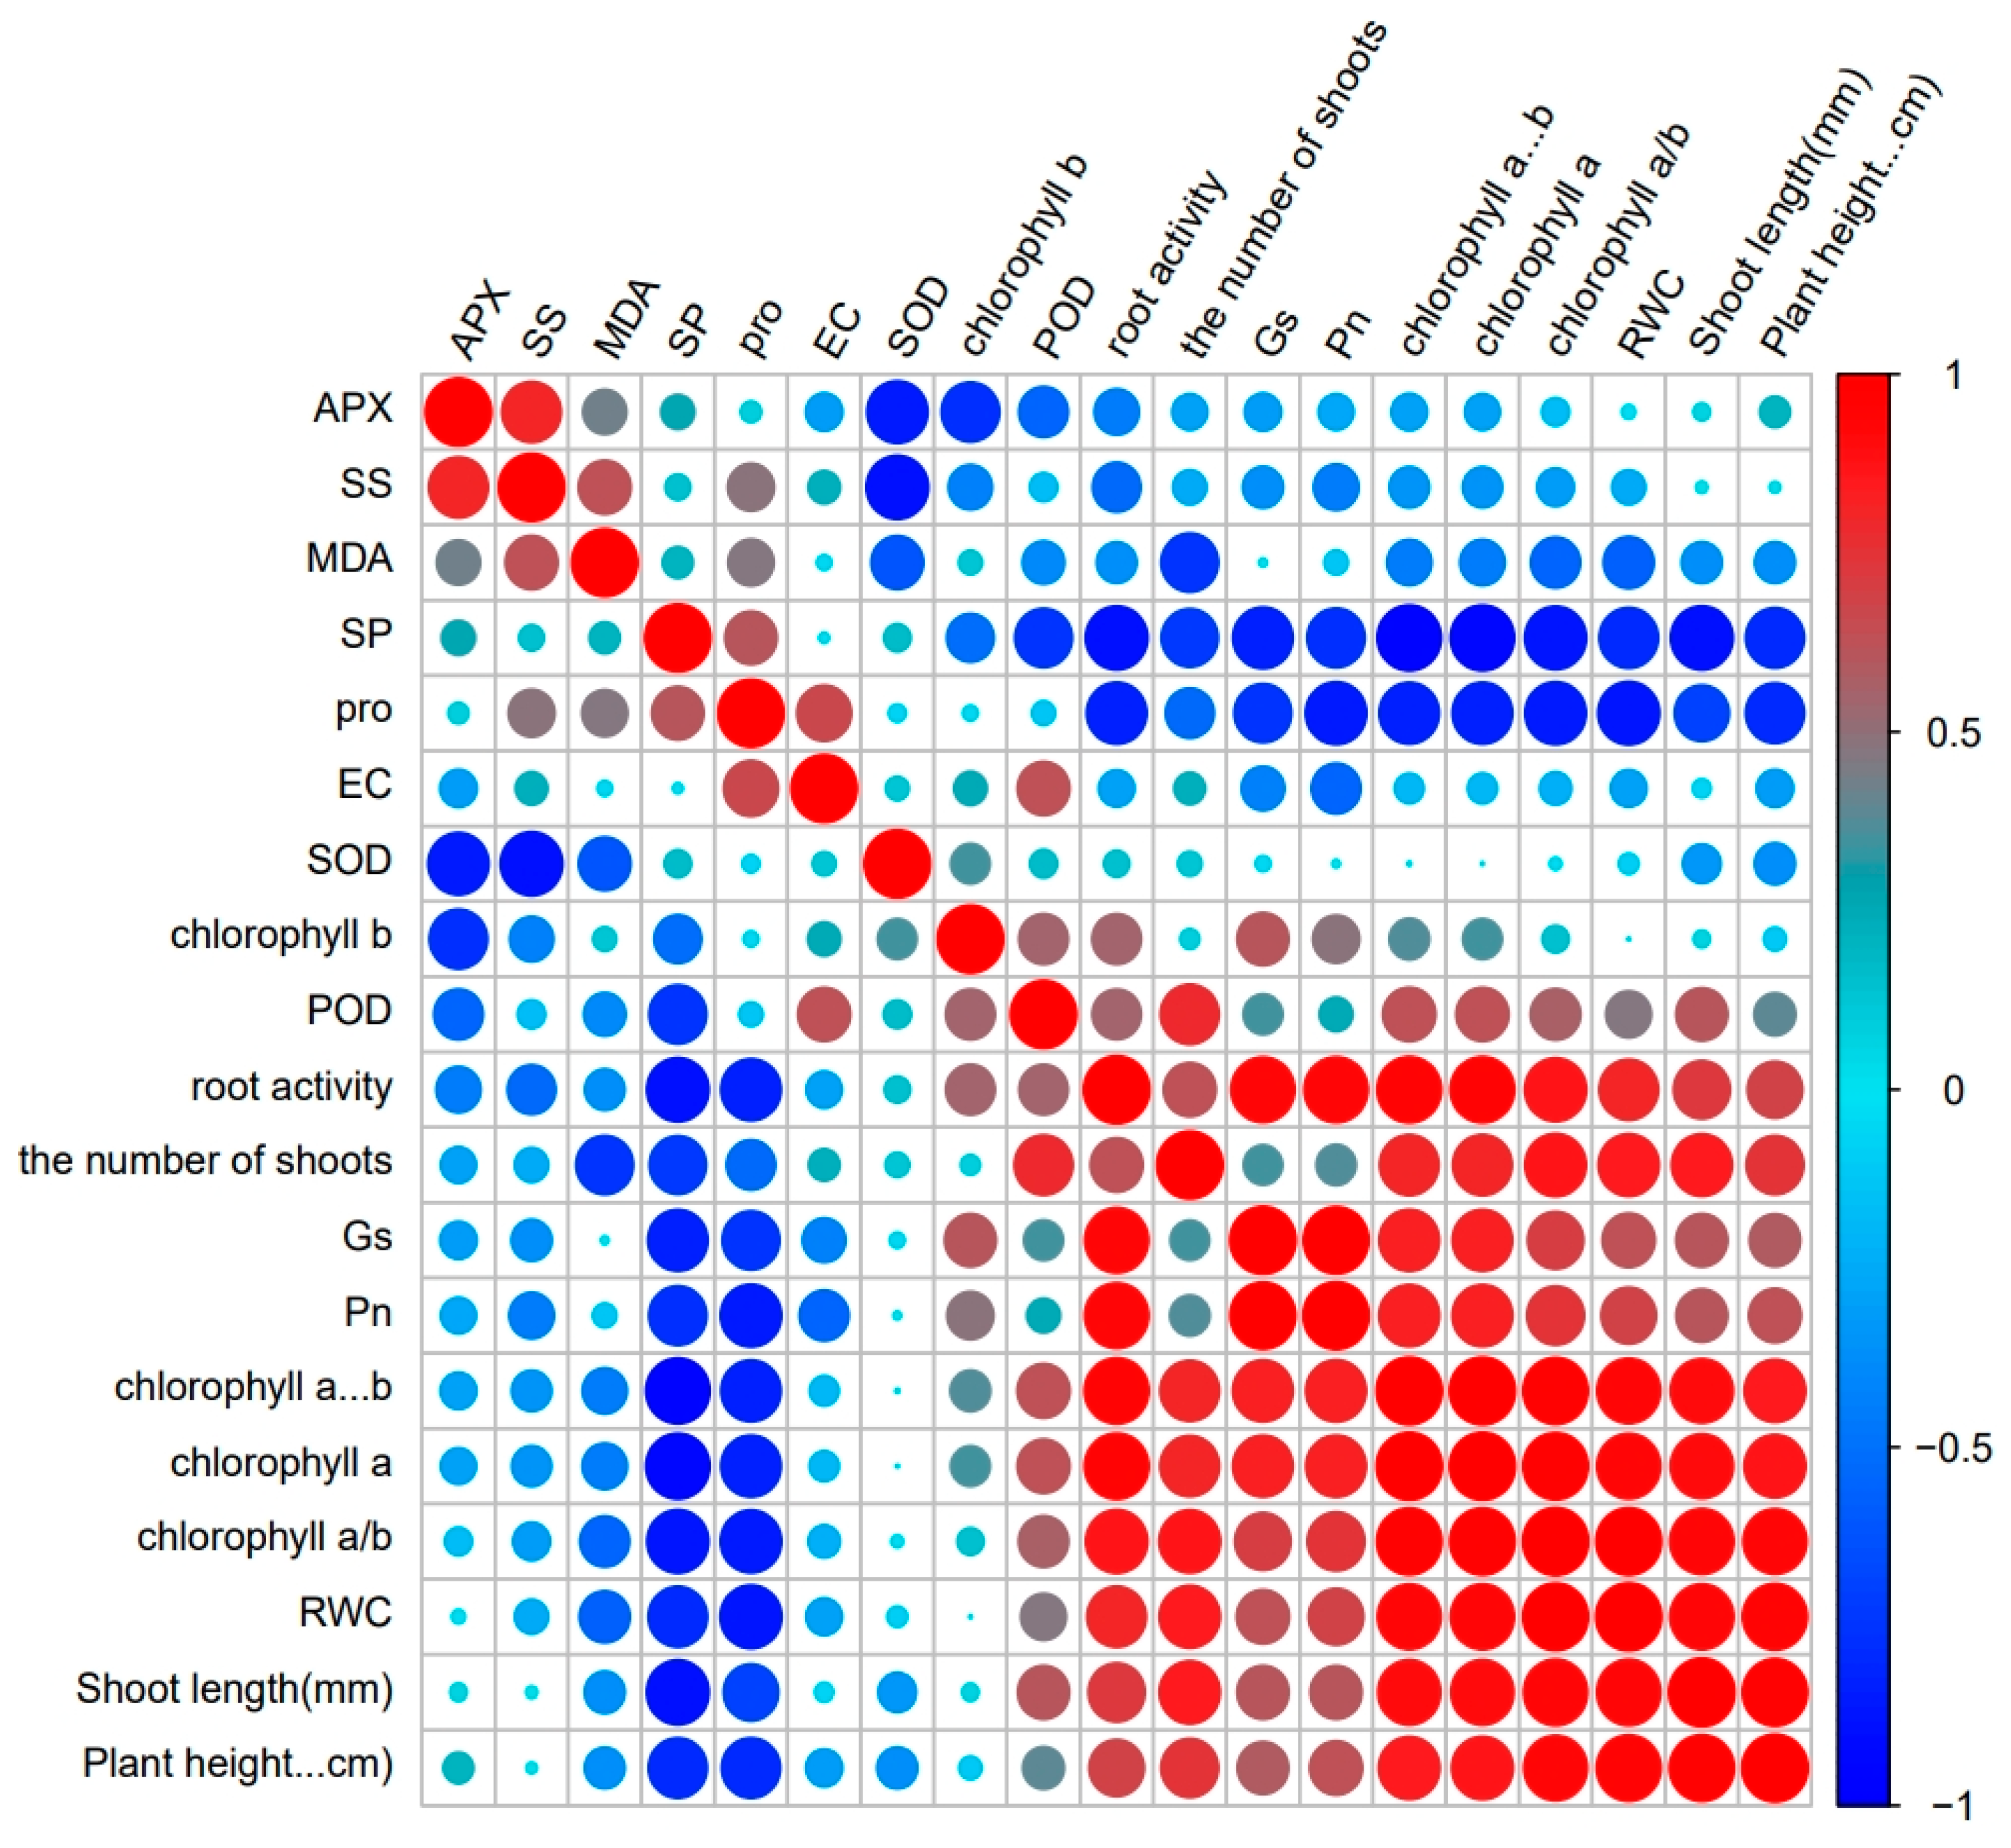
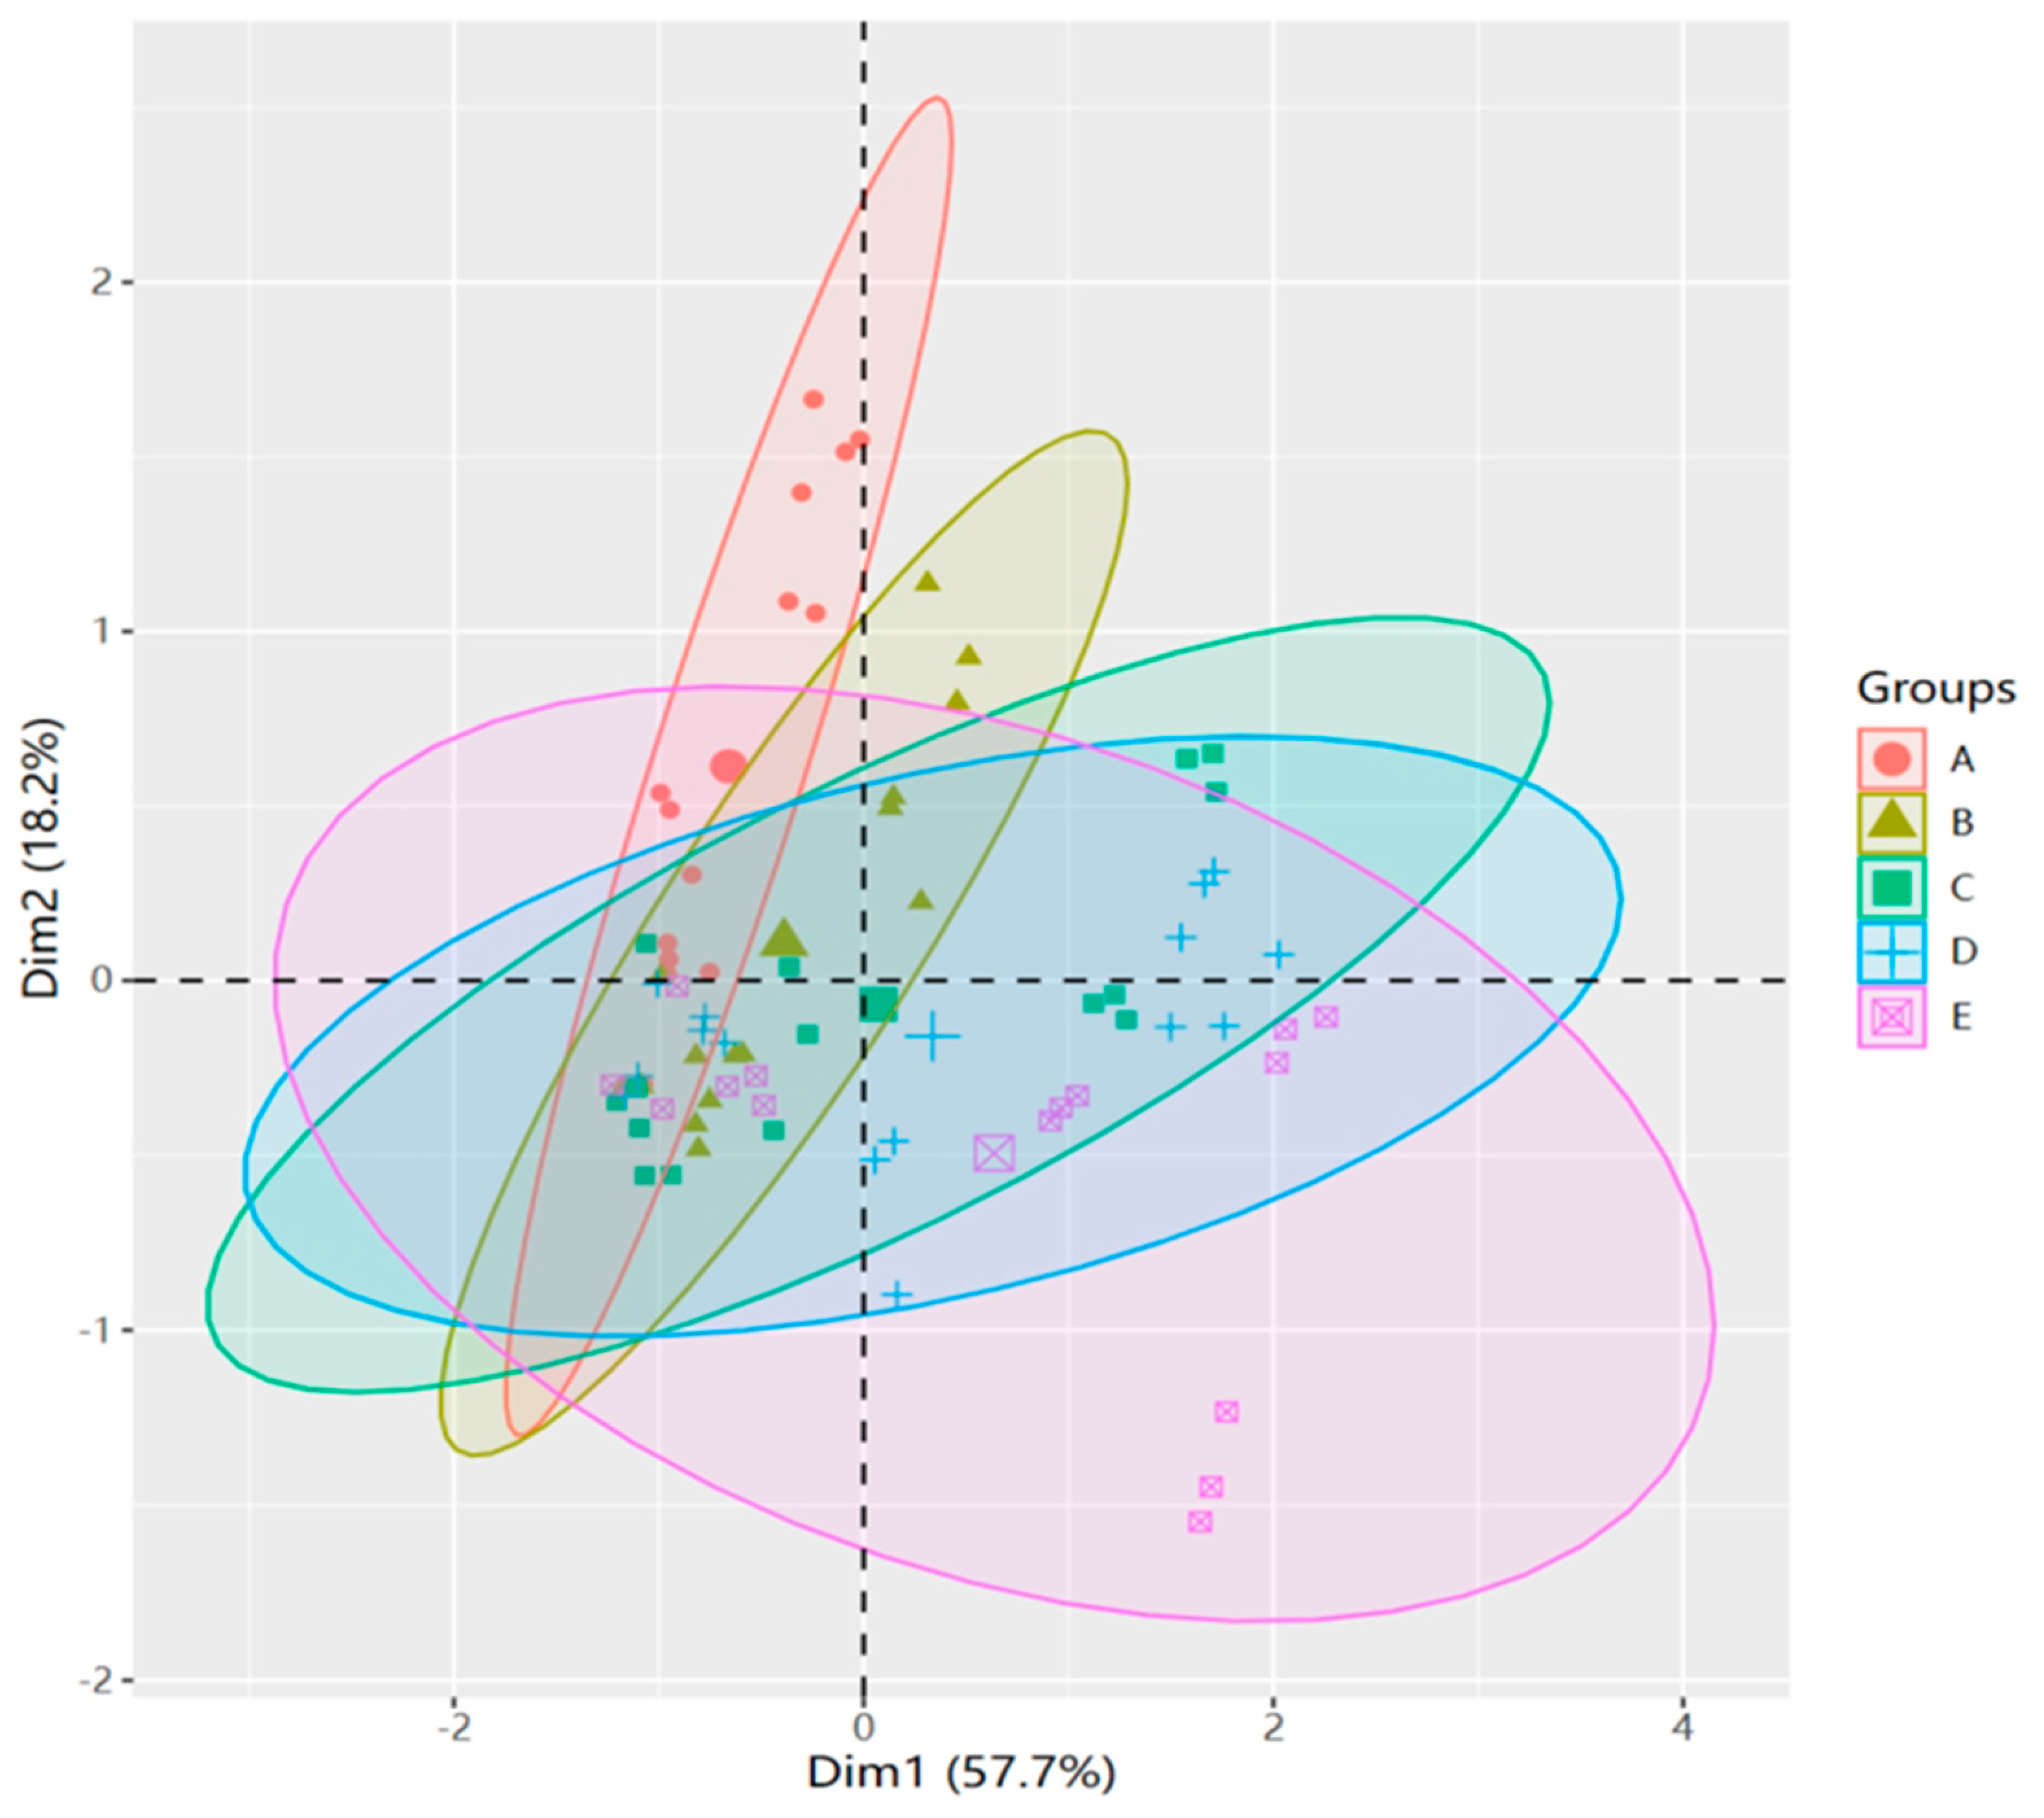
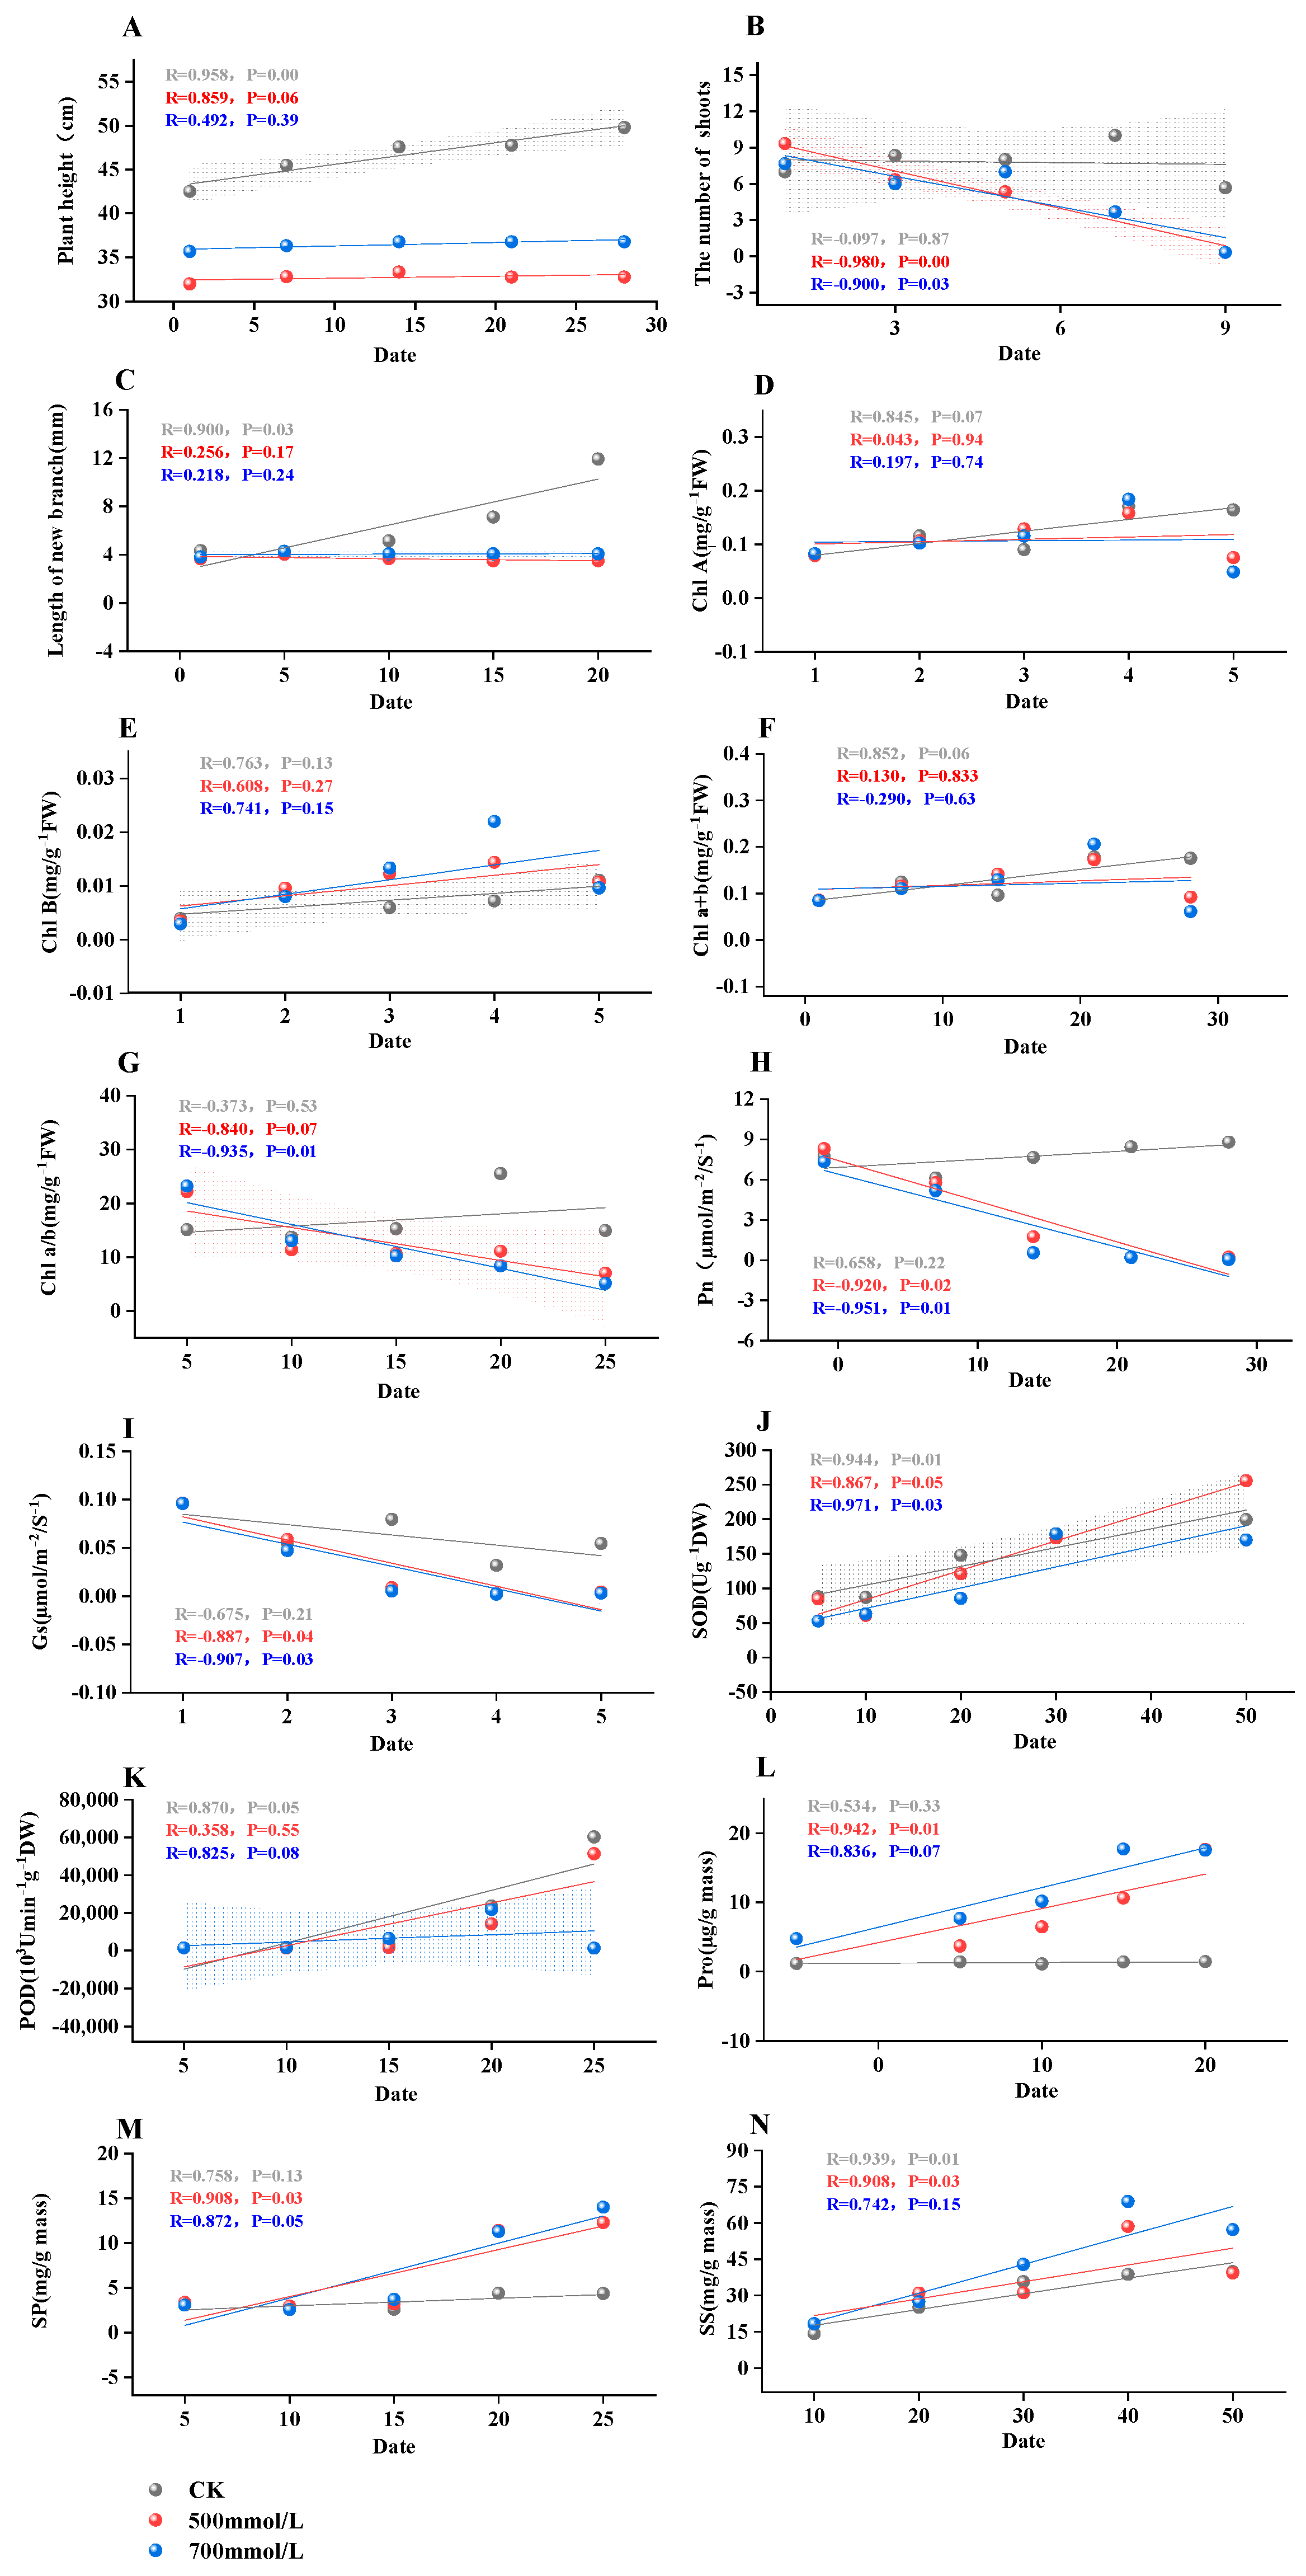
3.7. Principal Component Analysis, Correlation, and Regression Insights in M. faberi under Salt Stress

It can be seen from Figure 6 that there is a close correlation between the morphological Characteristics, chlorophyll content, photosynthetic system, osmotic regulation system, and antioxidant system of M. faberi (Figure 6 and Figure S6). Notably, SOD exhibited a strong negative correlation with SS and APX. Furthermore, a pronounced negative relationship was observed between the Pn and Pro, indicating that a decrease in Pn leads to an increase in Pro content. Stomatal conductance also showed a significant negative correlation with SP and Pro, suggesting an increase in SP and Pro as stomatal conductance decreases. In addition, a positive correlation emerged between POD and the number of new shoots, implying that the quantity of new shoots rises in tandem with increasing POD content.
The principal component analysis of the five sample groups revealed significant segregation within the first principal component (accounting for 57.7% of total variance) and the second principal component (constituting 18.2% of total variance) (Figure 7 and Figure S7). This distinction indicates substantial differences in the leaf properties of M. faberi across the control (CK) and varying salt concentrations (100, 300, 500, and 700 mmol−1/L).
To examine these correlations in greater detail, linear regression analysis was conducted on each significant index under control, semi-lethal, and lethal concentrations, based on the correlation patterns illustrated in Figure 8. This analysis revealed that both plant height and shoot length were significantly correlated with the duration of stress, as evidenced (Figure 8A,B and Figure S8). However, the relationship between chlorophyll content and the number of days under stress was relatively weak (Figure 8D–G and Figure S8). Interestingly, the Pn and Gs exhibited strong and significant correlations at lethal and semi-lethal concentrations (Figure 8H,I and Figure S8). Furthermore, SOD, Pro and SP also demonstrated similar correlation trends (Figure 8J,L,M and Figure S8). Conversely, POD and SS displayed a weak and nonsignificant correlation (Figure 8K,N and Figure S8).

4. Discussion

When plants are subjected to salt stress, plant growth and development are impaired [24,25], and their phenotypes and growth indicators show different trends at salt concentrations [26]. In general, salt stress can restrict the growth of plants and lead to significant changes in phenotypic characteristics [27]. Plants showed slower growth rates, lighter leaf color, and slower shoot growth in the face of different concentrations of salt stress, which is consistent with previous studies [24]. According to Sarker and Oba [28], this phenomenon is caused by increased osmotic pressure from increased salinity, which impedes the absorption and transport of water, resulting in a water deficit in plants, thus limiting growth and development.
Studies have shown that when plants are subjected to salt stress, the chloroplast structure is damaged and the production of chlorophyll protein–lipid complex is reduced [29], resulting in a general decrease in chlorophyll content [27,30,31]. This study found that the chlorophyll content of leaves showed a trend of increasing first and then decreasing, which may be due to the response of plants to environmental changes in the early stage of stress, but with the extension of time, chlorophyll synthesis gradually decreased. This may be due to the decrease in the light energy absorption capacity of chloroplasts under high salt stress, which leads to the decrease in chlorophyll content [32]. At the same time, salt stress also limits the photosynthetic rate and stomatal conductivity of plants [33,34,35]. This study found that under salt stress of different concentrations, the results of Pn and Gs are consistent and show a downward trend with the extension of stress time, which is consistent with the research results of Soliman [36]. These results indicated that salt stress had adverse effects on the chlorophyll content and photosynthesis of plants [33].
When plants are under salt stress, the dynamic balance mode of reactive oxygen species production and removal will be broken, and the rapid accumulation of reactive oxygen species will cause membrane lipid peroxidation [37], causing plant death and injury. Plants can use antioxidant enzymes, such as SOD, POD, and APX, to clear excess oxygen species (ROS) [38] such as hydrogen peroxide and superoxide anions [39,40], so as to slow down the damage ROS cause to the lipid peroxidation of the cell membrane [41]. In this experiment, after applying salt stress at different concentrations, the SOD activity of the leaves of M. faberi continued to rise at 100 mmol−1/L concentration, increasing first and then decreasing at 300 and 500 mmol−1/L concentrations; it then then increased at a concentration of 700 mmol−1/L. The reason for this may be that the change in the environment and the different stress concentrations in the stress process led to a great difference in SOD activity, but with the extension of time, the SOD activity was always higher than that of the control group. The activity of APX decreased first and then increased, which may be due to intracellular oxidative stress caused by salt stress [42], which can lead to the consumption of ascorbic acid, so that the activity of APX is inhibited. With prolonged stress, plants may activate genes associated with antioxidant defense, leading to APX protein synthesis, thereby increasing APX activity to improve the plant’s ability to fight oxidative stress. The continuous increase in POD activity indicated that under stress conditions, these enzymes could reduce the damage caused by removing reactive oxygen species, which was consistent with previous research results [41,43]. SOD, POD, and APX activities rose under salt stress, which indicated that the plant could balance active oxygen in vivo by increasing the activity of antioxidant enzymes, so as to improve the plant’s salt tolerance [44].
SS, SPand Pro are important osmoregulatory substances in plants [45]. The results showed that SS, SP, and Pro showed an increasing trend under salt stress, which indicated that the cell osmotic sites were maintained by accumulating osmotic regulatory substances such as SS, SP, and Pro [46]. Thus, the osmotic pressure of cells was improved, and the ability to absorb and retain water was maintained. This is consistent with the findings of AI-Farsi [47] and Xiaoe Liu [48].
The diversity analysis of physiological and biochemical indexes of plants under salt stress reflects the physiological response of plants under salt stress, which plays an irreplaceable role in the application and promotion of plants [49]. We found there was a certain correlation among these indicators. There was a significant negative correlation between photosynthetic indexes and SP and Pro, indicating that the content of SP and Pro increased with the decrease in Pn and Gs. A significant positive correlation existed between chlorophyll content and photosynthetic index. The decrease in chlorophyll content likely led to the decrease in the photosynthetic capacity of plants. This may be due to the damage to the chlorophyll structure of the plant under stress conditions, and the destruction of the internal capsule membrane, which then leads to a decrease in the photosynthetic capacity of the leaves. In order to resist the damage caused by salt stress, the osmotic adjustment system continuously accumulates osmotic substances to maintain the normal operation of the plant. From the principal component analysis, we can clearly observe that there are significant differences between different concentrations of salt stress, and these were caused by the different degrees of damage suffered by plants. In order to analyze the correlation of plants in more detail, we also carried out linear regression analysis. It can be found that the correlation between net photosynthetic rate and stomatal conductance was strong and significant at lethal and semi-lethal concentrations. At the same time, SOD, Pro, and SP also showed a similar correlation. It indicated that with the deepening of stress, the contents of SOD, Pro, and SP in the leaves of M. faberi increased continuously to resist adversity, which was similar to the response of predecessors under high salt stress [49,50].

5. Conclusions

In conclusion, this study showed that salt stress significantly affected the phenotype, photosynthetic system, and antioxidant response of M. faberi. Among them, chlorophyll content, photosynthetic rate, and stomatal conductance showed a downward trend, while MDA, SOD, POD, SP, Pro, and other indicators showed an upward trend, indicating that the growth status and characteristics of this species were constantly changing to resist stress when necessary. Studies have shown that M. faberi can grow normally at a concentration of 100–300 mmol−1/L. This provides data support for the promotion of this species in saline–alkaline areas.

Supplementary Materials

The following supporting information can be downloaded at: https://www.mdpi.com/article/10.3390/biology13020075/s1, Figure S2. Effects of different concentrations of salt stress on Pn and Gs of leaves of Machilus faberi Hemsl. Figure S3. The variation trend of relative water content, root activity, malondialdehyde content and relative conductivity of leaves of M. faberi Hemsl under different sale concentration. Figure S4. Effects of different concentrations of salt stress on the activities of POD, SOD and APX in leaves treated. Figure S5. Effects of salt stress on Pro, SS and SP in leaves of M. faberi Hemsl treated. Figure S6. Correlation analysis of each index under salt stress. Figure S7. Principal component analysis between different salt concentrations. Figure S8. Linear regression analysis.

Author Contributions

Q.M., L.Y., Y.L. (Yanlin Li) and X.Y. proposed the design of the article, performed the experiments, and authored or reviewed drafts of the paper; Y.L. (Yang Liu), L.L. and H.W. analyzed the data; Q.Y., E.W. and L.J. prepared the figures and tables; Q.M., Y.L. (Yang Liu), L.Y. and X.Y. authored or reviewed drafts of the article; Q.M. completed the manuscript. All authors have read and agreed to the published version of the manuscript.

Funding

This work was funded by the Forestry Science and Technology Innovation Foundation of Hunan Forestry Bureau science and technology innovation project (XLKY202213), the Hunan Province for Distinguished Young Scholarship (XLKJ202205), the Foundation of Changsha Municipal Science and Technology Bureau (KQ2202227), the key project of Hunan Provincial Education Department (22A0155), the Forestry Bureau for Industrialization Management of Hunan Province (2130221),the Graduate Innovation Project of Hunan Province (2023XC108), the College Student Innovation and Entrepreneurship Project of China (S202310537005), and the Project fund of Hunan Province Philosophy and Social Science Achievements Evaluation Committee (XSP20YBZ123).

Institutional Review Board Statement

Not applicable.

Informed Consent Statement

Not applicable.

Data Availability Statement

Data are contained within the article and the Supplementary Materials.

Acknowledgments

We acknowledge the editors and all anonymous reviewers for their constructive comments on this manuscript.

Conflicts of Interest

The authors declare no conflicts of interest.

References

  1. Ashraf, M.; Harris, P.J.C. Potential biochemical indicators of salinity tolerance in plants. Plant Sci. 2004, 166, 3–16. [Google Scholar] [CrossRef]
  2. Colla, G.; Rouphael, Y.; Leonardi, C.; Bie, Z. Role of grafting in vegetable crops grown under saline conditions. Sci. Hortic. 2010, 127, 147–155. [Google Scholar] [CrossRef]
  3. Acosta-Motos, J.; Ortuño, M.; Bernal-Vicente, A.; Diaz-Vivancos, P.; Sanchez-Blanco, M.; Hernandez, J. Plant Responses to Salt Stress: Adaptive Mechanisms. Agronomy 2017, 7, 18. [Google Scholar] [CrossRef]
  4. Mahajan, S.; Tuteja, N. Cold, salinity and drought stresses: An overview. Arch. Biochem. Biophys. 2005, 444, 139–158. [Google Scholar] [CrossRef] [PubMed]
  5. Hayat, S.; Hayat, Q.; Alyemeni, M.N.; Wani, A.S.; Pichtel, J.; Ahmad, A. Role of proline under changing environments: A review. Plant Signal. Behav. 2012, 7, 1456–1466. [Google Scholar] [CrossRef]
  6. Othman, Y.A.; Hani, M.B.; Ayad, J.Y.; St Hilaire, R. Salinity level influenced morpho-physiology and nutrient uptake of young citrus rootstocks. Heliyon 2023, 9, e13336. [Google Scholar] [CrossRef]
  7. Zhang, S.-H.; Xu, X.-F.; Sun, Y.-M.; Zhang, J.-L.; Li, C.-Z. Influence of drought and salt stress on the growth of young. New For. 2018, 17, 336–347. [Google Scholar]
  8. Garg, A.K.; Kim, J.-K.; Owens, T.G.; Ranwala, A.P. Trehalose accumulation in rice plants confers hightolerance levels to different abiotic stresses. Proc. Natl. Acad. Sci. USA 2002, 10, 99. [Google Scholar]
  9. Flowers, T.J.; Colmer, T.D. Plant salt tolerance: Adaptations in halophytes. Ann. Bot. 2015, 115, 327–331. [Google Scholar] [CrossRef] [PubMed]
  10. Rahman, M.M.; Mostofa, M.G.; Keya, S.S.; Siddiqui, M.N.; Ansary, M.M.U.; Das, A.K.; Rahman, M.A.; Tran, L.S.-P. Adaptive Mechanisms of Halophytes and Their Potential in Improving Salinity Tolerance in Plants. Int. J. Mol. Sci. 2021, 22, 10733. [Google Scholar] [CrossRef] [PubMed]
  11. Litalien, A.; Zeeb, B. Curing the earth: A review of anthropogenic soil salinization and plant-based strategies for sustainable mitigation. Sci. Total Environ. 2020, 698, 134235. [Google Scholar] [CrossRef] [PubMed]
  12. Yang, D.; Wang, F.; Zhang, H.; Ren, S. Chemical constituents and antifungal activities of essential oil from leaves of Phoebe faberi. Guihaia 2000, 20, 181–184. [Google Scholar]
  13. Qunsheng, Z. Transplanting technology of Machilus faberi Hemsley tree. Flower Plant Penjing 2011, 7, 43–46, 43–44,46. [Google Scholar]
  14. Jinjing, C. Study on Transplanting Cultivation Techniques of Greening Seedlings of Machilus bambusoides. Anhui Agric. Sci. Bull. 2013, 19, 110–112. [Google Scholar]
  15. Xiangjun, C. Study on Forestland Selection and Fertilization Experiment of Machilus faberi Hemsley; Hunan Forestry Science & Technology: Changsha, China, 1998; pp. 27–31. [Google Scholar]
  16. Karimi, S.; Karami, H.; Vahdati, K.; Mokhtassi-Bidgoli, A. Antioxidative responses to short-term salinity stress induce drought tolerance in walnut. Sci. Hortic. 2020, 267, 109322. [Google Scholar] [CrossRef]
  17. Yue, D. Study on extraction method of chlorophyll from rape pods. Crop Res. 2023, 37, 10–13. [Google Scholar]
  18. Chen, A.K.; Han, R.H.; Li, D.Y.; Lin, L.L.; Luo, H.X.; Tang, S.J. A Comparison of Two Methods for Electrical Conductivity about Plant leaves. J. Guangdong Univ. Educ. 2010, 30, 88–91. [Google Scholar]
  19. Zhang, Q.; Wu, X.; Zheng, J.; Sun, M. Progress of Researches on Methods FOR Determination of Malondialdenhyde in Biological Sampies. Phys. Test. Chem. Anal. (Part B Chem. Anal.) 2016, 52, 979–985. [Google Scholar]
  20. Zhu, X.; Liang, M.; Ma, Y. A Review Report on the Experiments for the Determination of Root Activiyy by TTC Method. Guangdong Chem. Ind. 2020, 47, 211–212. [Google Scholar]
  21. Han, Y.; Fan, S.; Zhang, Q.; Wang, Y. Effect of heat stress on the MDA, proline and soluble sugar content in leaf lettuce seedlings. Agric. Sci. 2013, 4, 112–115. [Google Scholar] [CrossRef]
  22. Yue, S.-Y.; Zhou, R.-R.; Nan, T.-G.; Huang, L.-Q.; Yuan, Y. Comparison of major chemical components in Puerariae Thomsonii Radix and Puerariae Lobatae Radix. China J. Chin. Mater. Med. 2022, 47, 2689–2697. [Google Scholar] [CrossRef]
  23. Ribeiro, H.; Duque, L.; Sousa, R.; Abreu, I. Ozone effects on soluble protein content of Acer negundo, Quercus robur and Platanus spp. pollen. Aerobiologia 2013, 29, 443–447. [Google Scholar] [CrossRef]
  24. Bayomy, H.M.; Alamri, E.S.; Alharbi, B.M.; Foudah, S.H.; Genaidy, E.A.; Atteya, A.K. Response of Moringa oleifera trees to salinity stress conditions in Tabuk region, Kingdom of Saudi Arabia. Saudi J. Biol. Sci. 2023, 30, 103810. [Google Scholar] [CrossRef] [PubMed]
  25. Hasanuzzaman, M.; Alam, M.M.; Rahman, A.; Hasanuzzaman, M.; Nahar, K.; Fujita, M. Exogenous proline and glycine betaine mediated upregulation of antioxidant defense and glyoxalase systems provides better protection against salt-induced oxidative stress in two rice (Oryza sativa L.) varieties. Biomed. Res. Int. 2014, 2014, 757219. [Google Scholar] [CrossRef] [PubMed]
  26. Fatima, N.; Akram, M.; Shahid, M.; Abbas, G.; Hussain, M.; Nafees, M.; Wasaya, A.; Tahir, M.; Amjad, M. Germination, growth and ions uptake of moringa (Moringa oleifera L.) grown under saline condition. J. Plant Nutr. 2018, 41, 1555–1565. [Google Scholar] [CrossRef]
  27. Farooq, F.; Rashid, N.; Ibrar, D.; Hasnain, Z.; Ullah, R.; Nawaz, M.; Irshad, S.; Basra, S.M.A.; Alwahibi, M.S.; Elshikh, M.S.; et al. Impact of varying levels of soil salinity on emergence, growth and biochemical attributes of four Moringa oleifera landraces. PLoS ONE 2022, 17, e0263978. [Google Scholar] [CrossRef]
  28. Sarker, U.; Oba, S. The Response of Salinity Stress-Induced A. tricolor to Growth, Anatomy, Physiology, Non-Enzymatic and Enzymatic Antioxidants. Front. Plant Sci. 2020, 11, 559876. [Google Scholar] [CrossRef]
  29. Ghogdi, E.A.; lzadi-Darbandi, A.; Borzouei, A. Effects of salinity on some physiological traits in wheat (Triticum aestivum L.) cultivars. Indian J. Sci. Technol. 2012, 5, 1901–1906. [Google Scholar] [CrossRef]
  30. Dos Santos Araujo, G.; de Oliveira Paula-Marinho, S.; de Paiva Pinheiro, S.K.; de Castro Miguel, E.; de Sousa Lopes, L.; Camelo Marques, E.; de Carvalho, H.H.; Gomes-Filho, E. H2O2 priming promotes salt tolerance in maize by protecting chloroplasts ultrastructure and primary metabolites modulation. Plant Sci. 2021, 303, 110774. [Google Scholar] [CrossRef]
  31. Zhou, J.; Wang, J.; Bi, Y.; Wang, L.; Tang, L.; Yu, X.; Ohtani, M.; Demura, T.; Zhuge, Q. Overexpression of PtSOS2 Enhances Salt Tolerance in Transgenic Poplars. Plant Mol. Biol. Rep. 2014, 32, 185–197. [Google Scholar] [CrossRef]
  32. Zhang, L.X.; Chang, Q.S.; Hou, X.G.; Liu, W.; Li, X.P.; Gao, Y.H.; Zhang, X.-L.; Ding, S.-Y.; Xiao, R.-X.; Zhang, Y.; et al. Effects of NaCl stress on antioxidant capacity and photosynthetic characteristics of Prunella vulgaris seedlings. Acta Prataculturae Sin. 2017, 26, 167–175. [Google Scholar] [CrossRef]
  33. Lu, W.; Wei, G.; Zhou, B.; Liu, J.; Zhang, S.; Guo, J. A comparative analysis of photosynthetic function and reactive oxygen species metabolism responses in two hibiscus cultivars under saline conditions. Plant Physiol. Biochem. 2022, 184, 87–97. [Google Scholar] [CrossRef]
  34. Yan, Y.; Wang, S.; Wei, M.; Gong, B.; Shi, Q. Effect of Different Rootstocks on the Salt Stress Tolerance in Watermelon Seedlings. Hortic. Plant J. 2018, 4, 239–249. [Google Scholar] [CrossRef]
  35. Penella, C.; Landi, M.; Guidi, L.; Nebauer, S.G.; Pellegrini, E.; San Bautista, A.; Remorini, D.; Nali, C.; Lopez-Galarza, S.; Calatayud, A. Salt-tolerant rootstock increases yield of pepper under salinity through maintenance of photosynthetic performance and sinks strength. J. Plant Physiol. 2016, 193, 1–11. [Google Scholar] [CrossRef]
  36. Soliman, S.; Hall, R.C. Forensic issues in medical evaluation: Competency and end-of-life issues. Adv. Psychosom. Med. 2015, 34, 36–48. [Google Scholar] [CrossRef] [PubMed]
  37. Chen, T.; Wang, G.; Shen, W.; Li, X.; Qi, J.; Xu, J.; Tao, A.; Liu, X. Effect of Salt Stress on the Growth and Antioxidant Enzyme Activity of Kenaf Seedlings. PLant Sci. J. 2011, 29, 493–501. [Google Scholar] [CrossRef]
  38. Wasim, M.A.; Naz, N.; Zehra, S. Anatomical characteristic, ionic contents and nutritional potential of Buffel grass (Cenchrus ciliaris L.) under high salinity. S. Afr. J. Bot. 2022, 144, 471–479. [Google Scholar] [CrossRef]
  39. Heyno, E.; Mary, V.; Schopfer, P.; Krieger-Liszkay, A. Oxygen activation at the plasma membrane: Relation between superoxide and hydroxyl radical production by isolated membranes. Planta 2011, 234, 35–45. [Google Scholar] [CrossRef] [PubMed]
  40. Sharma, P.; Dubey, R.S. Involvement of oxidative stress and role of antioxidative defense system in growing rice seedlings exposed to toxic concentrations of aluminum. Plant Cell Rep. 2007, 26, 2027–2038. [Google Scholar] [CrossRef] [PubMed]
  41. Yang, M.; Wang, Y.; Gan, X.; Luo, H.; Zhang, Y.; Zhang, W. Effects of Exogenous Nitric Oxide on Growth, Antioxidant System and Photosynthetic Characterics in Seedling of Cotton Cultivar Under Chilling Lnjury Stress. Sci. Agric. Sin. 2012, 45, 3058–3067. [Google Scholar] [CrossRef]
  42. Thornalley, P.J. The glyoxalase system new developments towards functional characterization of a metabolic pathway fundamental to biological lifetrue. Biochem. J. 1990, 269, 1–11. [Google Scholar] [CrossRef]
  43. Guo, Q.; Wu, Y.; Lin, Y.; Zheng, H. Effect of NaCl stress on growth and antioxidant systems of Pogostemon cablin. China J. Chin. Mater. Med. 2009, 34, 530–534. [Google Scholar]
  44. Mubushar, M.; El-Hendawy, S.; Tahir, M.U.; Alotaibi, M.; Mohammed, N.; Refay, Y.; Tola, E. Assessing the Suitability of Multivariate Analysis for Stress Tolerance Indices, Biomass, and Grain Yield for Detecting Salt Tolerance in Advanced Spring Wheat Lines Irrigated with Saline Water under Field Conditions. Agronomy 2022, 12, 3084. [Google Scholar] [CrossRef]
  45. Zhang, S.-H.; Xu, X.-F.; Sun, Y.-M.; Zhang, J.-L.; Li, C.-Z. Influence of drought hardening on the resistance physiology of potato seedlings under drought stress. J. Integr. Agric. 2018, 17, 336–347. [Google Scholar] [CrossRef]
  46. Gao, G.; Tester, M.A.; Julkowska, M.M. The Use of High-Throughput Phenotyping for Assessment of Heat Stress-Induced Changes in Arabidopsis. Plant Phenomics 2020, 2020, 3723916. [Google Scholar] [CrossRef]
  47. Al-Farsi, S.M.; Nawaz, A.; Anees ur, R.; Nadaf, S.K.; Al-Sadi, A.M.; Siddique, K.H.M.; Farooq, M. Effects, tolerance mechanisms and management of salt stress in lucerne (Medicago sativa). Crop Pasture Sci. 2020, 71, 411–428. [Google Scholar] [CrossRef]
  48. Liu, X.; Su, S. Growth and Physiological Response of Viola tricolor L. to NaCl and NaHCO3 Stress. Plants 2023, 12, 178. [Google Scholar] [CrossRef]
  49. Meng, S.; Xu, T.; Zhu, X.; Di, J.; Zhu, Y.; Yang, X.; Zou, S.; Yang, X.; Qin, C.; Yan, W. Diversity Analysis of Soybean Landraces Collected from Jiangsu Province Using Phenotypic Traits. J. Plant Genet. Resour. 2023, 24, 419–436. [Google Scholar] [CrossRef]
  50. Liang, F.; Huang, Q.W.; Yu, Y.P.; Liang, H.; Huang, Q.Y.; Liu, X.M.; Chen, Q.Y.; Tan, X.H. Physiological response of endangered semi-mangrove Barringtonia racemosa to salt stress and its correlation analysis. J. Cent. South Univ. For. Technol. 2019, 39, 12–18. [Google Scholar]
Figure 1. Leaf phenotype of M. faberi under different salt stress.
Biology 13 00075 g001
Figure 2. Effects of different concentrations of salt stress (0, 100, 300, 500, 700 mmol−1/L) on the Pn rate and Gs rate of leaves of M. faberi treated for 7, 14, 21 and 28 days. (A) Pn rate, (B) Gs rate. Different letters indicate differences between groups (p < 0.05).
Biology 13 00075 g002
Figure 3. Variation trends in relative water content, root activity, malondialdehyde content and relative conductivity of leaves of M. faberi under different concentration gradients (0, 100, 300, 500, 700 mmol−1/L) and time (T0, T7, T14, T21, T28). The black columns in (A) and (B) represent period T28, (C) MDA content, (D) The relative conductivity of leaves. Different letters indicate significant differences between groups, p < 0.05 level.
Biology 13 00075 g003
Figure 4. Effects of different concentrations of salt stress (0, 100, 300, 500, 700 mmol−1/L) on the activities of (A) POD, (B) SOD and (C) APX in leaves treated at 7, 14, 21 and 28 days. Different letters indicate differences between groups, p < 0.05.
Biology 13 00075 g004
Figure 5. Effects of salt stress (0, 100, 300, 500, 700 mmol−1/L) on (A) proline, (B) soluble protein and (C) soluble sugar in leaves of M. faberi treated for 7, 14, 21 and 28 days. Different letters indicate differences between groups, p < 0.05.
Biology 13 00075 g005
Figure 6. Correlation analysis of each index under salt stress. The positive correlation coefficient is represented by red, and the negative correlation index is represented by blue.
Biology 13 00075 g006
Figure 7. Principal component analysis between different salt concentrations. Group A is CK, group B is 100 mmol−1/L, group C is 300 mmol−1/L, group D is 500 mmol−1/L, and group E is 700 mmol−1/L.
Biology 13 00075 g007
Figure 8. Studies the correlation analysis between CK, semi-lethal concentration (500 mmol−1/L) and lethal concentration (700 mmol−1/L) in the significant indicators of the correlation diagram. (A) Plant height; (B) The number of shoots; (C) Length of new branch; (D) Chl A; (E) Chl B; (F) Chl a+b; (G) Chl a/b; (H) Pn; (I) Gs; (J) SOD; (K) POD; (L) Pro; (M) SP; (N) SS. The Pearson correlation coefficient values are listed digitally below each correlation plot. The p value of each correlation pair was calculated by t test.
Biology 13 00075 g008
Table 1. Morphological characteristics of M. faberi Hemsley on chinensis under salt stress.
Morphologic
Characteristics
DaysT0T7T14T21T28
Concentration
(mmol−1/L)
Number of
new shoots (pcs)
CK7.00 ± 1.73a8.33 ± 1.89a8.00 ± 1.46ab10.00 ± 1.66a5.67 ± 1.04a
1008.67 ± 1.53a12.33 ± 1.11a10.33 ± 1.21a7.33 ± 1.13a6.00 ± 1.00a
30013.00 ± 1.00a11.33 ± 1.53a10.33 ± 1.16a8.00 ± 1.367.00 ± 1.73a
5009.33 ± 1.53a6.33 ± 1.31a5.33 ± 1.15ab3.67 ± 1.52a3.67 ± 1.52a
7007.67 ± 1.08a6.00 ± 1.00a1.00 ± 1.00b0.33 ± 0.58a0.33 ± 0.58a
Length of
new branch (mm)
CK4.32 ± 0.59a4.23 ± 0.66a5.13 ± 0.95a7.10 ± 1.95a16.94 ± 5.56a
1003.60 ± 0.17a3.50 ± 0.51a3.53 ± 1.25a4.25 ± 0.50b12.98 ± 5.11a
3003.58 ± 1.40a7.39 ± 4.34a3.82 ± 1.49a3.81 ± 0.28b16.39 ± 7.45b
5003.65 ± 0.94a3.97 ± 0.19a3.66 ± 0.92a3.49 ± 1.18b3.49 ± 1.18b
7003.79 ± 0.53a4.26 ± 1.34a4.05 ± 0.99a4.05 ± 0.99b4.05 ± 0.99a
Plant height (cm)CK42.51 ± 6.21a45.47 ± 5.91a47.56 ± 6.10a47.77 ± 5.91a49.77 ± 3.36a
10041.00 ± 8.77a42.98 ± 8.501a44.94 ± 8.71a44.66 ± 7.64ab48.13 ± 8.78ab
30039.97 ± 10.61a43.00 ± 11.01a44.11 ± 12.49a43.37 ± 12.77ab47.57 ± 10.37ab
50031.98 ± 3.94a32.80 ± 4.10a33.34 ± 4.20a32.78 ± 3.61b32.78 ± 3.61c
70035.67 ± 3.11a36.31 ± 2.50a36.79 ± 2.84a36.79 ± 2.84ab36.79 ± 2.84b
Note: Different letters indicate differences between groups (p < 0.05).
Table 2. Chlorophyll content under different concentrations of salt stress.
Chl SpeciesDaysT0T7T14T21T28
Concentration
(mmol−1/L)
CK0.081 ± 0.002a0.115 ± 0.005a0.090 ± 0.007c0.171 ± 0.027b0.164 ± 0.017a
1000.082 ± 0.002a0.098 ± 0.007b0.113 ± 0.002b0.207 ± 0.009a0.119 ± 0.001b
Chl a (mg/g)3000.102 ± 0.013a0.096 ± 0.001b0.126 ± 0.006a0.129 ± 0.015c0.117 ± 0.003b
5000.158 ± 0.022a0.106 ± 0.010ab0.129 ± 0.004a0.158 ± 0.018c0.075 ± 0.005c
7000.157 ± 0.005a0.102 ± 0.005b0.116 ± 0.004b0.184 ± 0.004ab0.049 ± 0.003d
CK0.004 ± 0.001a0.009 ± 0.001a0.006 ± 0.001c0.007 ± 0.003d0.011 ± 0.001a
1000.007 ± 0.003a0.008 ± 0.002a0.031 ± 0.002a0.014 ± 0.004c0.009 ± 0.001a
Chl b (mg/g)3000.006 ± 0.002a0.008 ± 0.003a0.004 ± 0.001c0.051 ± 0.006a0.010 ± 0.001a
5000.008 ± 0.003a0.010 ± 0.002a0.012 ± 0.002c0.014 ± 0.003c0.011 ± 0.001a
7000.008 ± 0.003a0.008 ± 0.001a0.013 ± 0.006c0.022 ± 0.001b0.010 ± 0.001a
CK0.085 ± 0.00a0.124 ± 0.004a0.096 ± 0.008c0.178 ± 0.030b0.175 ± 0.019a
1000.0892 ± 0.00a0.107 ± 0.009b0.144 ± 0.004a0.222 ± 0.013a0.129 ± 0.001b
Chl a + b (mg/g)3000.108 ± 0.001a0.103 ± 0.004b0.129 ± 0.006b0.181 ± 0.021b0.127 ± 0.005b
5000.166 ± 0.02a0.116 ± 0.011ab0.141 ± 0.006a0.172 ± 0.020b0.086 ± 0.006c
7000.165 ± 0.007a0.110 ± 0.004b0.129 ± 0.007b0.206 ± 0.004ab0.058 ± 0.004d
CK22.180 ± 0.616a13.682 ± 0.931a15.294 ± 0.195b25.533 ± 0.368a14.932 ± 0.468a
10013.655 ± 5.779a12.244 ± 0.976a3.654 ± 0.172c15.184 ± 0.183b13.009 ± 0.904b
Chl a/b (mg/g)30016.318 ± 2.242a13.552 ± 0.686a36.357 ± 0.750a2.511 ± 0.015c11.905 ± 0.015b
50023.080 ± 9.908a11.348 ± 0.895a10.649 ± 0.531b11.081 ± 0.733b7.017 ± 0.198c
70023.726 ± 10.786a13.016 ± 0.374a10.221 ± 0.800b8.387 ± 0.449ab5.105 ± 0.420d
Note: Different letters indicate differences between groups (p < 0.05).
Disclaimer/Publisher’s Note: The statements, opinions and data contained in all publications are solely those of the individual author(s) and contributor(s) and not of MDPI and/or the editor(s). MDPI and/or the editor(s) disclaim responsibility for any injury to people or property resulting from any ideas, methods, instructions or products referred to in the content.

