

Does Artificial Intelligence Promote or Inhibit On-the-Job Learning? Human Reactions to AI at Work
1
Business School, Shandong University, Weihai 264209, China
2
HSBC Business School, Peking University, Shenzhen 518055, China
3
School of Mechanical, Electrical & Information Engineering, Shandong University, Weihai 264209, China
*
Author to whom correspondence should be addressed.
Systems 2023, 11(3), 114; https://doi.org/10.3390/systems11030114
Submission received: 23 January 2023
/
Revised: 17 February 2023
/
Accepted: 20 February 2023
/
Published: 22 February 2023
(This article belongs to the Special Issue Human–AI Teaming: Synergy, Decision-Making and Interdependency)
Abstract
:This paper examines how AI at work impacts on-the-job learning, shedding light on workers’ reactions to the groundbreaking AI technology. Based on theoretical analysis, six hypotheses are proposed regarding three aspects of AI’s influence on on-the-job learning. Empirical results demonstrate that AI significantly inhibits people’s on-the-job learning and this conclusion holds true in a series of robustness and endogeneity checks. The impact mechanism is that AI makes workers more pessimistic about the future, leading to burnout and less motivation for on-the-job learning. In addition, AI’s replacement, mismatch, and deskilling effects decrease people’s income while extending working hours, reducing their available financial resources and disposable time for further learning. Moreover, it has been found that AI’s impact on on-the-job learning is more prominent for older, female and less-educated employees, as well as those without labor contracts and with less job autonomy and work experience. In regions with more intense human–AI competition, more labor-management conflicts, and poorer labor protection, the inhibitory effect of AI on further learning is more pronounced. In the context of the fourth technological revolution driving forward the intelligent transformation, findings of this paper have important implications for enterprises to better understand employee behaviors and to promote them to acquire new skills to achieve better human–AI teaming.
1. Introduction
Artificial intelligence, as the core driving force of the fourth technological revolution, has grown by leaps and bounds in recent years. According to 2022 International Federation of Robotics (IFR) statistics, the number of new industrial robots installed worldwide reached an all-time high of 517,385 in 2021, with a yearly growth rate of 31%. Over the past six years, annual robot installations have more than doubled (https://ifr.org/worldrobotics/ accessed on 16 January 2023). The rapid development of AI brings immense economic benefits [1,2,3] and profound changes in people’s preferences and behaviors [4]. From an enterprise perspective, the new work pattern applying AI contributes to wiser organizational decisions [5], better innovation management [6], and performance improvement [7]. From the viewpoint of workers, the new work style teaming with AI deeply influences their employment [8,9], income [10], and well-being [11]. However, how workers react to the AI technological revolution at work remains an unanswered question. It is yet to be determined whether workers tend to further improve their skills to enhance competitiveness against AI, or whether they passively accept AI’s replacement and deskilling effects on their jobs, resulting in a decrease in further learning.
On the one hand, the stimulation effect of artificial intelligence may motivate workers to further improve skills so as to avoid being replaced by the new technology [12]. AI’s complementarity and cost-saving effects can also increase people’s income [13,14]. In addition, the productivity and replacement effects of AI may reduce employees’ working hours [15,16,17]. All of these factors can help to promote people’s on-the-job learning. However, on the other hand, AI may also lead people to have more pessimistic expectations about the future by substituting their jobs, as well as bringing about a burnout effect [18,19], which undermines their motivation for further learning. In addition, AI has the replacement effect [8], mismatch effect [20], and deskilling effect [21,22] on people’s jobs, decreasing their financial resources and time available for on-the-job learning.
Therefore, based on a theoretical analysis, it is unclear whether artificial intelligence promotes or inhibits on-the-job learning. In the current context of the booming AI technology and digital transformation of industries, promoting employees to learn new skills that can facilitate collaborating with AI is crucial for enterprises to improve their competitiveness [23,24]. In light of this, this paper empirically examines the impact of AI on on-the-job learning using the data from the Chinese general social survey (CGSS). In addition, this study conducts a series of robustness and endogeneity tests by applying different AI and on-the-job learning measures, ordered response models, instrumental variables approach, penalized regressions, placebo tests, etc. We also systematically explore the future expectation, economic income, and working-time mechanisms through which AI affects on-the-job learning. Furthermore, the heterogeneities of AI’s influence in terms of demographic, working, and regional characteristics are further explored.
The contributions of this paper include the following aspects. First, this paper deepens our understanding of human reactions to artificial intelligence at work from an on-the-job learning perspective and expands the research concerning AI’s impact on workers. Existing studies about the impacts of AI on workers have mainly focused on its direct effects on employment [8,9,25], income [10], and well-being [11,26]. However, there is a lack of literature on how workers react to AI. This paper provides a valuable exploration in this regard. The findings of this paper reveal that workers passively accept the effect of AI and reduce on-the-job learning. This can help companies to better understand employee preferences and behaviors while taking advantage of AI for technological upgrades. Second, this paper examines factors influencing employees’ on-the-job learning from a novel perspective of technological change and clarifies the impact mechanism of technological progress on on-the-job learning. There are numerous elements affecting on-the-job learning, and the related literature has mainly emphasized factors with respect to organizational environment [27], job attributes [28,29], demographic characteristics [30,31], as well as personal traits [32]. Nevertheless, the effects of technological advances on on-the-job learning have been relatively neglected. Therefore, this study contributes to a more comprehensive understanding of the elements influencing on-the-job learning from a new view. In addition, this study indicates that by creating more pessimistic expectations, reducing income, and extending work hours through its deskilling effect, AI inhibits workers’ on-the-job learning. Thus, this paper enlightens enterprises to optimize their management strategy from the perspectives of workers’ expectations, earnings, and working hours, so as to motivate workers to learn furth, improve human capital, and promote innovation. Third, this paper also identifies vulnerable subgroups whose on-the-job learning is more adversely affected in the era of AI, such as older, female and less-educated workers, as well as those with less job autonomy and work experience. This contributes to encouraging enterprises and governments to pay more attention to these employees and consider providing them with more training opportunities and labor protection.
The remainder of the paper is structured as follows: Section 2 is the literature review and theoretical background. Section 3 introduces data and variables. Section 4 presents the results of benchmark analysis, as well as endogeneity and robustness tests. Section 5 explores impact mechanisms through which artificial intelligence affects on-the-job learning. Section 6 conducts heterogeneity analysis. Section 7 summarizes the findings of this study and puts forward implications.
2. Literature Review and Theoretical Background
2.1. AI’s Impacts on People’s Future Expectations and On-the-Job Learning
The previous literature has shown that the growing power of artificial intelligence and its increasing status in the workplace may make workers more pessimistic about their future. According to Huang and Rust [33], both humans and AI have four intelligences: mechanical, analytical, intuitive, and empathetic intelligences. Mechanical intelligence is responsible for standardized and repetitive tasks. Analytical intelligence is the ability to process information and to perform tasks requiring logical thinking in decision-making. Intuitive intelligence completes tasks needing intuitive, holistic, experiential, and contextual interactions. Empathetic intelligence is applied for tasks that involve empathy and emotional analytics. Although currently humans have the advantage in the “softer” intuitive and empathetic skills [33,34], with the rapid development of enhanced computing power and machine learning algorithms, AI can learn and accumulate knowledge on its own, just like human capital [35]. Thus, it is suggested that AI will replace people to perform complex tasks requiring the latter two intelligences [33]. In addition, the power of AI is also reflected in its increasing importance and status at work [4,5,6], where the role of AI gradually changes from follower to manager [36,37] or even leader [38,39], leaving workers with less room for further promotion. Because of the above reasons, humans may perceive AI as a threat to their jobs, leading to increased fear of unemployment, anxiety [40], and job insecurity [26]. Lan et al. [41] find that when human employees feel threatened, they may develop robot-phobia and have more pessimistic expectations about the future due to AI-induced displacement of their jobs.
When workers perceive their roles as vulnerable to being replaced by artificial intelligence and have pessimistic expectations, the existing literature does not provide a definitive answer as to whether they are stimulated to further improve their skills to enhance competitiveness or whether they become burned out and reduce on-the-job learning. A strand of literature believes that the threat brought by new technologies stimulates workers to learn more to update their knowledge. Ivanov et al. [12] find that when faced with a potential threat of substitution, employees prefer the “fight strategy”, in which they learn how to use new technologies to be more productive to stay competitive. In addition, it is also shown that people with job insecurity are more willing to undertake training to strengthen their ability to find jobs outside the organization [32]. At the same time, the improvement of skills enables workers to build confidence in their employability, thus increasing job satisfaction and security [42]. Therefore, Hypothesis 1a can be proposed: the pessimistic expectations caused by AI have a stimulation effect and thus promote on-the-job learning. However, on the other hand, when employees feel fear of unemployment and the negative emotions dominate, AI may lead to burnout, thus discouraging further learning [18,19]. This is because people may perceive themselves as no longer competitive against AI and that human capital has been totally replaced by AI. Hence, people have a sense of hopelessness in achieving better performance at work than AI even if they engage in further learning [43]. Based on this, Hypothesis 1b, which is the opposite of Hypothesis 1a, can be put forward: the pessimistic expectations caused by AI have a burnout effect and thus inhibit on-the-job learning.
2.2. AI’s Impacts on Workers’ Income and On-the-Job Learning
In addition to affecting future expectations, artificial intelligence can also impact workers’ income. Nevertheless, studies have not reached a unanimous conclusion as to whether AI increases or decreases income. A stream of research argues that AI is labor-friendly and raises income. First, AI has a complementarity effect on labor demand. When AI is applied in production, it requires close collaboration with human cognitive and interpersonal skills, thus promoting the employment and income of workers with such skills [13,14]. Moreover, this will motivate workers to seek further learning and training to acquire these skills to achieve better human–AI collaboration, and therefore, increase wages [44]. In addition, AI also has a cost-saving effect. The application of automation can save production costs, lower the price of products and increase total demand, creating more demand for labor and thus resulting in increased incomes [45]. Therefore, on the grounds of its complementarity and cost-saving effects, AI may exert a positive effect on income.
However, another stream of research holds the view that artificial intelligence reduces workers’ income, mainly due to the following two reasons. First, AI has a capital-deepening effect and brings down labor demand, which leads to job replacement and lowers earnings for workers [8]. For example, it has been found that in the human–machine competition, automation brought by AI displaces labor and decreases its wage [16]. Second, AI can also exert a mismatch effect on the labor market. Despite the aforementioned complementarity effect, skills in the workforce may not suit the requirements of the new technology in the short term. Consequently, AI can lead to a mismatch between labor skills and the demands of new technologies, thus reducing economic gains from AI application [20]. Furthermore, the AI-induced mismatch creates a higher risk of frictional unemployment and lowers workers’ income [10,25]. Therefore, from the theoretical analysis, the impact of AI on people’s income is unclear. On-the-job learning entails financial resources as well as opportunity costs in lost income. If AI raises employees’ income, they can shoulder higher costs of on-the-job learning, and thus increase the frequency of their on-the-job learning. In view of this, Hypothesis 2a can be proposed: AI’s complementarity and cost-saving effects increase income and thus promote on-the-job learning. On the contrary, if AI decreases people’s income, there will be less financial resources available for training, resulting in reduced on-the-job learning. So, Hypothesis 2b, opposite to Hypothesis 2a, can be proposed: AI’s replacement and mismatch effects reduce income and thus inhibit on-the-job learning.
2.3. AI’s Impacts on Employees’ Working Hours and On-the-Job Learning
On-the-job learning, which is a form of human capital investment, not only requires financial expenses but also involves investment in time. Therefore, exploring the impact of artificial intelligence on further learning also requires clarifying the relationship between AI application and working time. There are two opposite viewpoints on this issue in the existing literature. On the one hand, some studies suggest that AI deskills workers and reduces their bargaining power [46]. As a consequence, AI may extend working hours. To be specific, with the standardization of work tasks realized by advanced technologies, it is no longer necessary for experienced and skilled workers to perform complicated tasks at work. As a result, their skills could not automatically give them bargaining power in the workplace [21,22]. Therefore, people’s working hours may increase because of their reduced negotiating power. Moreover, employees’ control over their work also decreases due to AI-driven deskilling [47]. Machines can work at more intense rhythms and increase human workload and working time [48,49]. In this process, AI can also manage and monitor work processes in real time [50], resulting in employees experiencing more work stress. In addition, from a macroeconomic perspective, technological advances may also increase working hours. This is due to the fact that, based on the real business cycle theory, favorable technological advances can drive investment, which requires more labor input [51].
However, on the other hand, some research demonstrates that artificial intelligence may reduce working time. First, AI has the productivity effect. It can support workers in performing repetitive and heavy tasks and the human–machine cooperation saves working time [52]. Therefore, the application of AI directly improves productivity [2,53]. Moreover, technological upgrading promotes labor reallocation, for which AI also indirectly promotes productivity [15]. Owing to the lifted productivity, people’s working hours may decrease. Second, AI has the replacement effect discussed earlier, which can decrease people’s work on certain tasks, thereby shortening working hours [16,17]. For example, Cho and Kim [54] find that AI application in some Korean firms helps to reduce overwork. According to the above literature, AI may either decrease or increase working hours. If AI increases working time due to its deskilling effect, workers would have less time available for learning, and thus, their on-the-job learning would be less frequent. This leads to Hypothesis 3a: AI’s deskilling effect increases working hours and thus inhibits on-the-job learning. Conversely, if AI reduces working hours thanks to its productivity or substitution effects, then workers can spare more time to learn new skills. From this, Hypothesis 3b can be put forward: AI’s productivity and replacement effects reduce working hours and thus promote on-the-job learning.
2.4. Possible Heterogeneities in AI’s Effects on On-the-Job Learning
From the existing literature, there may exist heterogeneities in the effects of artificial intelligence on on-the-job learning across different groups. First, the impact of AI on on-the-job learning may vary depending on demographic characteristics. In terms of age, younger workers are more willing to acquire new knowledge and skills, whereas the older labor force is less able to adapt to technological changes, and thus, more likely to be replaced by AI [55]. Moreover, the accelerating pace of technological progress and innovation increases the demand for work-related learning. However, as people age, their motivation to learn diminishes. As a consequence, employers are more willing to provide more training and development opportunities to younger workers [56,57]. For these reasons, older employees’ willingness to learn on the job may decrease to a greater extent when their jobs are impacted by AI. Regarding gender, studies find that women tend to perform routine tasks more often than men even within the same occupational category, making them more at risk of being substituted [58]. Furthermore, women are more vulnerable to labor market discrimination in terms of job search, promotion opportunities, and payment for labor [59]. Therefore, it is more difficult for them to switch jobs by updating skills when being replaced by new technology. In terms of education, those with higher levels of education are less likely to be displaced by AI [25]. Zhou et al. [60] have discovered that for those with college and above educational attainment, the substitution probability is only half of that of low-education groups. Furthermore, educational level is usually positively correlated with a willingness to participate in work-related learning [31]. Hence, in the face of AI’s replacement effect, workers with lower levels of education may be less inclined to learn on the job.
Second, the impact of artificial intelligence may differ based on working characteristics. Labor contracts are the legal basis for workers to protect their rights and interests. They can raise social insurance coverage and reduce the likelihood of wage arrears, thus improving the welfare of underprivileged labor [61,62]. All these factors contribute to mitigating the impact of AI on workers. Therefore, labor contracts may reduce the impact of AI at work on on-the-job learning. With regard to job autonomy, related studies have shown that granting workers more autonomy to determine their work content increases their willingness to learn [63]. Conversely, less job autonomy not only decreases willingness to learn but also increases turnover intention [64,65]. In addition, work experience can enhance employability [66], which helps workers better switch jobs when they are replaced by AI. Consequently, the effect of AI on on-the-job learning may be smaller for those with higher job autonomy and more work experience. Third, macro-level regional factors may also play a role in the impact of AI on workers’ on-the-job learning. In regions with faster technological development, workers often develop more negative emotions, such as anxiety, insecurity, and aversion to new technologies [67]. As a result, they may react more passively to technological progress, reducing on-the-job learning to a greater extent. In contrast, in regions with stronger labor protection, workers tend to have a more positive attitude toward new technology. They are also more likely to adapt to rapidly evolving skill demands through reeducation and retraining [68]. From the above analysis, the impact of AI on workers’ on-the-job learning can vary in regions with different levels of technological development, AI application, and labor protection.
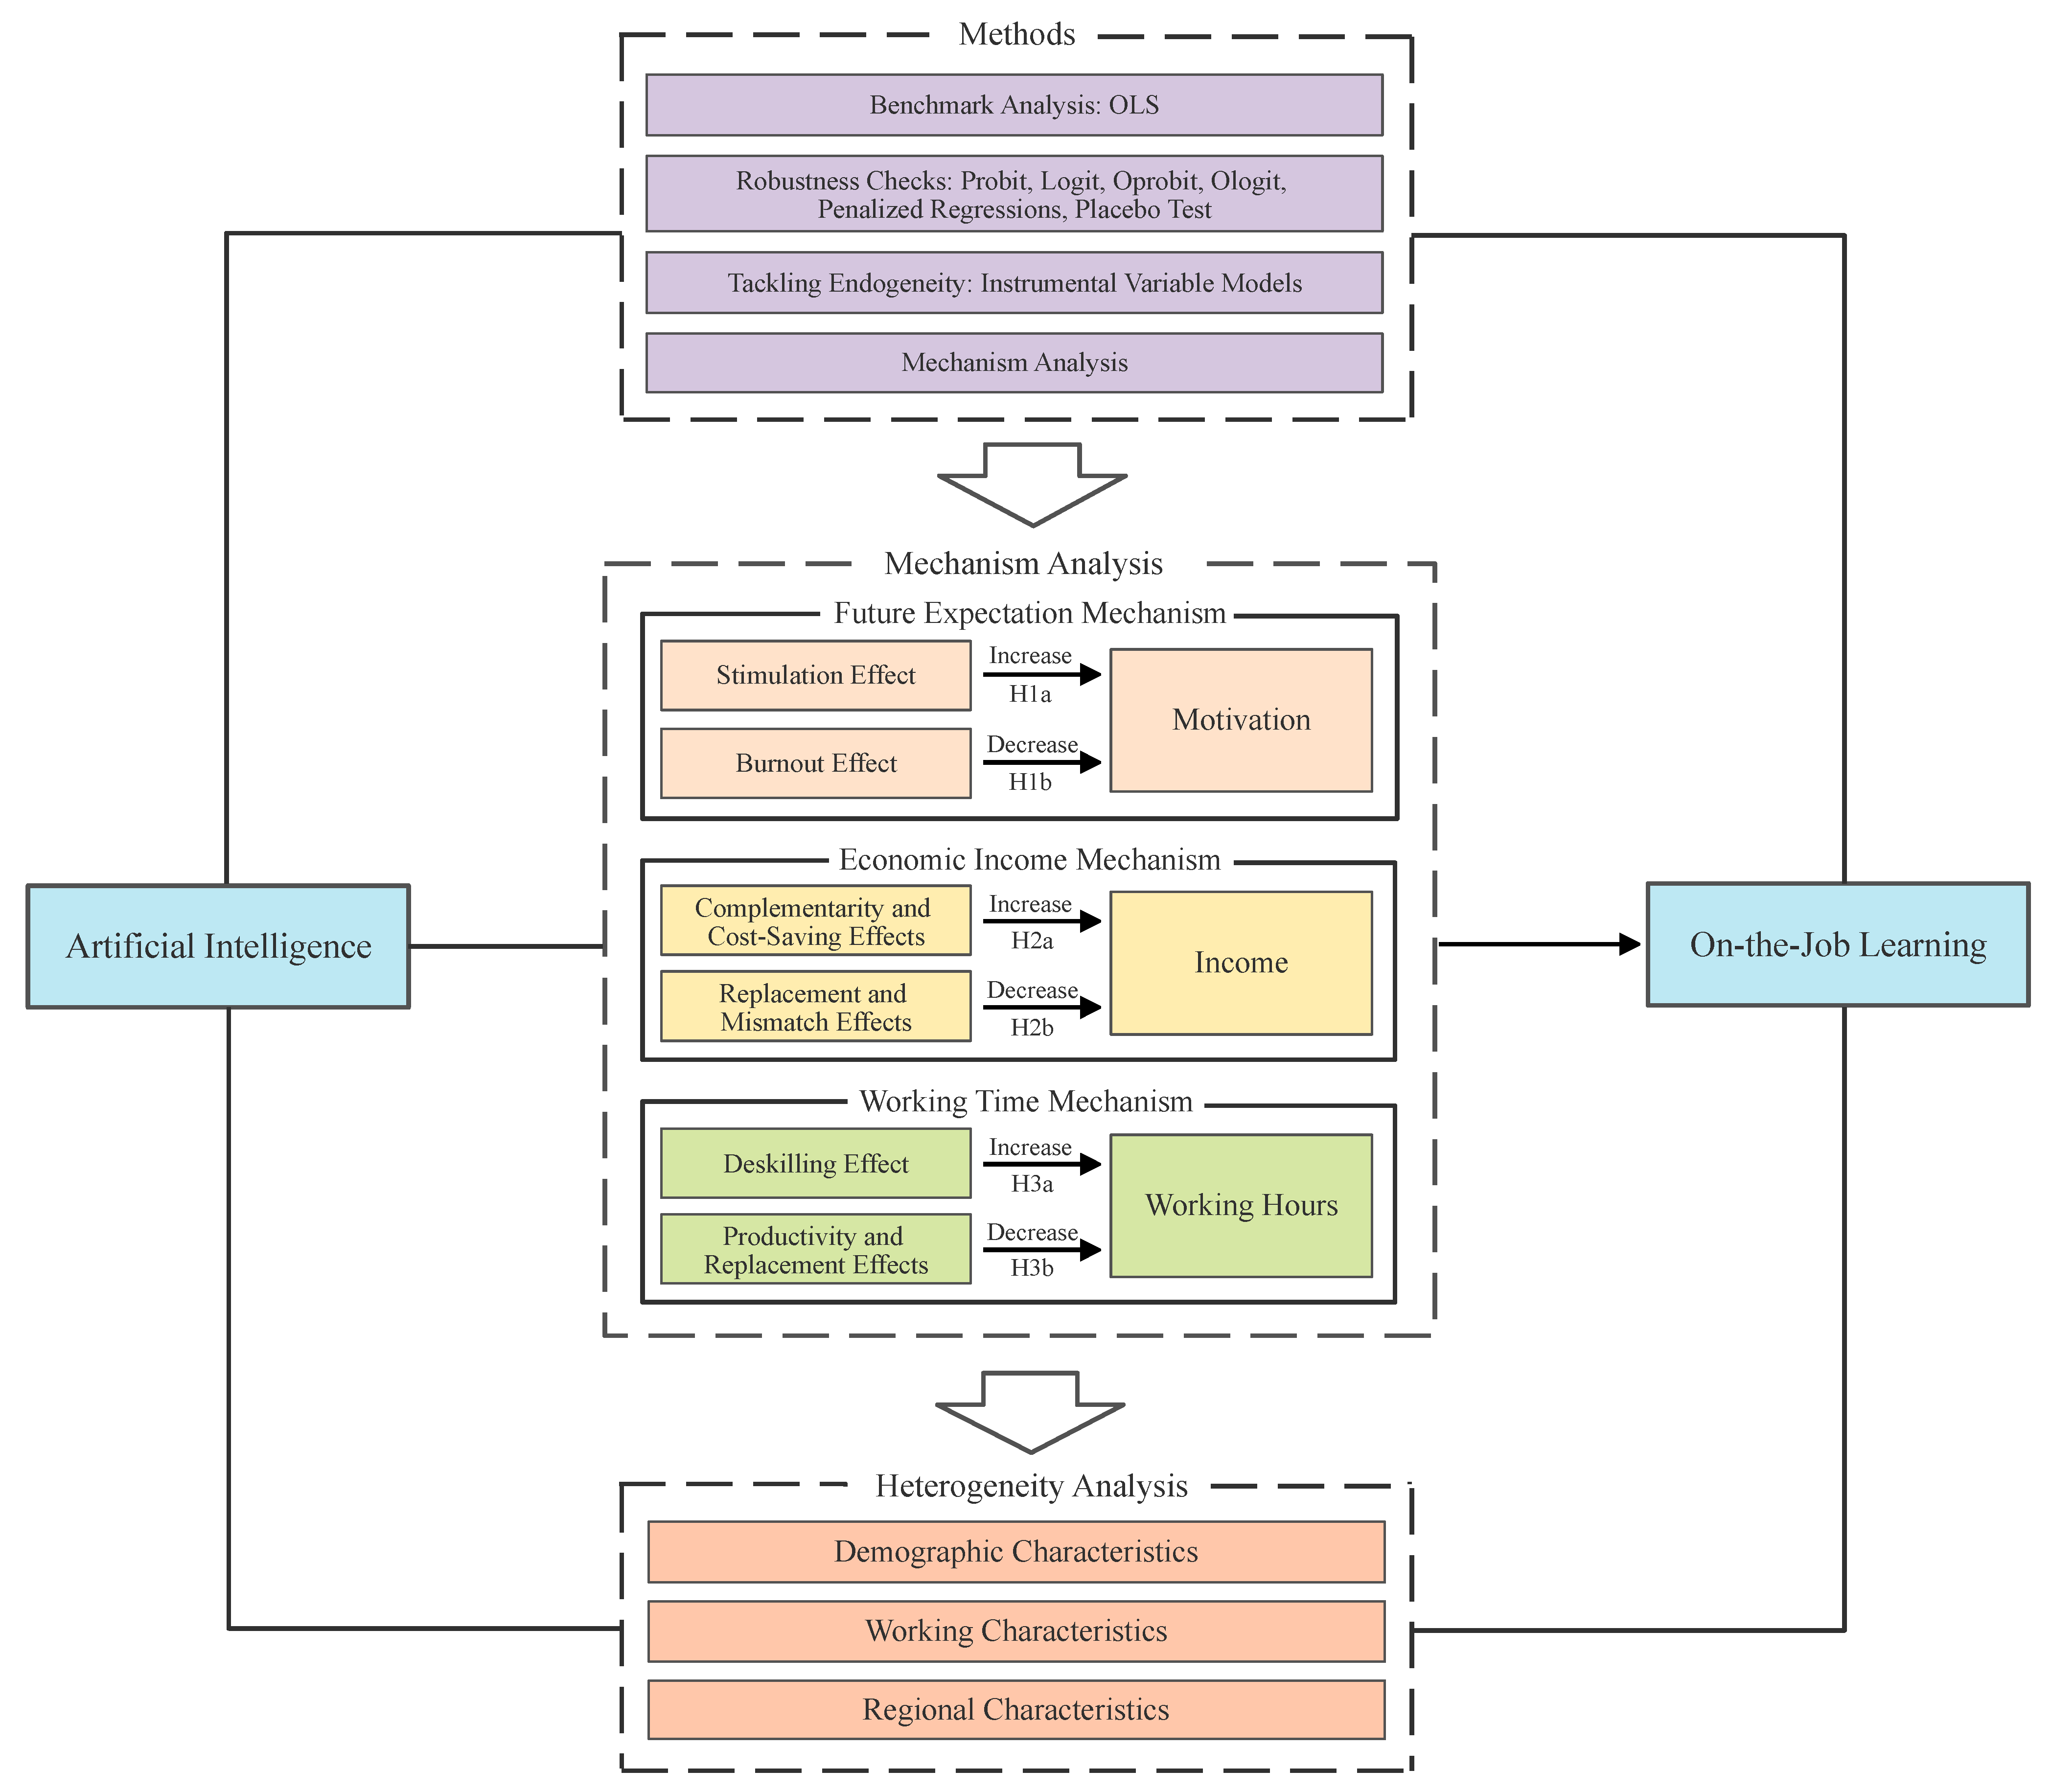
Based on the above analysis, the theoretical framework and research design of this study are illustrated in Figure 1.
3. Data and Variables
3.1. Data Source
This paper examines the impact of artificial intelligence on employees’ on-the-job learning using data from the Chinese general social survey (CGSS). CGSS is the first nationwide, comprehensive, and continuous large-scale survey project in China, aiming to systematically collect multi-dimensional information at the individual level and monitor changes in society. Compared with other data sources, CGSS has two advantages for this study: first, CGSS investigates respondents’ on-the-job learning frequencies and comprehensive factors influencing further learning, facilitating the construction of the dependent and control variables of this research. Second, CGSS provides people’s occupational codes of the international standard classification of occupations 2008 (ISCO-2008), which enables us to measure AI’s impact on respondents’ work, so as to construct the explanatory variables of this paper. CGSS data have been updated to 2018; however, since the ISCO-2008 standard occupational codes are not available in the data before 2017, this paper uses the 2017–2018 wave data in CGSS.
3.2. Variables
3.2.1. Dependent Variables
The main dependent variable in this paper is the frequency of on-the-job learning, derived from the responses of employed respondents to the frequency of further learning, denoted as . Specifically, the frequency of further on-the-job learning is measured based on the five-point Likert scale, classifying learning frequency from 1 to 5 as “never”, “seldom”, “sometimes”, “often”, and “frequently”. Higher scores indicate more frequent on-the-job learning. This indicator has been used in many existing studies to characterize workers’ on-the-job learning [69,70].
3.2.2. Explanatory Variables
The most commonly used indicator to characterize artificial intelligence’s impact on workers is the routine task intensity constructed by Autor and Dorn [71]. They have found that the new technological progress led by AI is task-biased rather than skill-biased. The greater degree of routine cognitive and routine manual intensity a task has, the more codable it is, the easier it is to be performed by machine learning algorithms, and the greater the impact of AI on it [72,73]. Therefore, based on the task characteristics of different occupations in the Dictionary of Occupational Titles of the United States Department of Labor, they measure occupations’ routine intensity from the cognitive and operational dimensions to characterize AI’s impact on workers. This indicator is calculated based on the standard occupational classification 2009 version (SOC-2009). We use the occupational crosswalk system from the United States Department of Labor to convert this index into the ISCO-2008 standard indicator, and then match it to CGSS data, denoted as AI. It is worth pointing out that in the crosswalk from SOC-2009 to ISCO-2008, a certain ISCO-2008 occupation may correspond to multiple SOC-2009 occupations. In this regard, we calculate the mean value as the AI indicator of the ISCO-2008 occupation. In addition, other measures are also used for robustness checks [25].
3.2.3. Control Variables
Referring to the literature on factors influencing on-the-job learning, e.g., [18,69], this paper comprehensively controls for variables in six aspects to avoid omitted variable bias: (1) Demographic characteristics include gender, age, and the quadratic term of age; (2) Work characteristics include personal income, whether one works in the system and whether one has pension and medical insurance; (3) Human capital characteristics include educational status and health condition; (4) Social identity characteristics include whether one belongs to an ethnic minority, whether one has religious beliefs, and whether one is a Communist Party of China (CPC) member; (5) Family characteristics include whether one is married, family size, and number of children; (6) Time and province dummies. Table 1 presents the descriptive statistics of the above variables.
4. Results and Discussion
4.1. Benchmark Empirical Results
First, the following ordinary least squares (OLS) model is constructed to examine the impact of AI on on-the-job learning:
In Model (1), the dependent variable refers to employed respondent’s frequency of on-the-job learning. The explanatory variable characterizes the degree to which the respondent’s work is affected by AI. , and, are the vectors of control variables, as well as year and province dummy variables as mentioned above. , , and are parameters to be estimated; we specifically focus on .
Estimation results of Model (1) are shown in Table 2. Column (1), which does not include any control variables, indicates that the effect of artificial intelligence is significantly negatively related to on-the-job learning frequencies. Columns (2)–(7) sequentially include the six types of control variables mentioned above. Results display that no matter which controls are included in the regression, the estimated coefficients of AI, which are −0.075, −0.06, −0.049, −0.048, −0.05, and −0.05, are all significantly negative at the 1% level, implying that AI significantly reduces on-the-job learning. In addition, as different aspects of characteristics are added, estimates of the relationship between AI and on-the-job learning decrease slightly but basically stabilize at around −0.050, suggesting that the negative relationship between the two factors is robust and not interfered by other elements. The estimated results of controls are generally in line with theoretical expectations and the existing literature. For example, younger workers participate in more on-the-job learning because they have more opportunities of career development and acquire new skills more quickly [56,57]. Higher-educated employees have a greater willingness to engage in further learning [31]. Those with higher incomes can afford higher learning costs, and therefore, learn on the job more frequently.
4.2. Robustness and Endogeneity Tests
4.2.1. Using Other AI Measures
In converting the artificial intelligence indicator constructed by Autor and Dorn [71] from SOC-2009 to ISCO-2008 occupations, when an ISCO-2008 occupation has more than one corresponding occupations in SOC-2009, the mean measure of SOC-2009’s AI indexes is used in the benchmark analysis. However, this approach fails to take into account the scale of employment in different SOC-2009 occupations. To address this, this paper constructs a weighted average AI indicator, denoted as AI_weighted, by taking the employment scale of different occupations in the US occupational employment survey (OES) as the weight to check the robustness of the above findings. In addition, to avoid the interference of outliers to which the mean and weighted values are subject to, the median AI index of SOC-2009 occupations is also constructed for ISCO-2008, denoted as AI_median. Furthermore, to check the robustness of findings, a more radical conversion is applied, in which the maximum value of different SOC-2009 occupations’ AI indicators is used.
Moreover, to more comprehensively characterize working features, considering that the higher the non-routine intensity, the lower the influence of AI on the occupation, this research subtracts the non-routine cognitive analytic and non-routine interpersonal intensities of the occupation from its routine cognitive and routine manual intensities to construct the AI_2 index. Based on this, we also calculate the AI_3 indicator that further subtracts the non-routine manual physical and non-routine manual interpersonal intensities from AI_2. Then, this paper utilizes these different AI indicators based on Autor and Dorn [71] to perform robustness tests.
In addition, we are also concerned about whether the conclusions of this paper still hold if artificial intelligence indicators constructed by other scholars are exploited. Another AI indicator newly developed by Frey and Osborne [25] has also received attention recently. So, we performed a robustness test using this indicator, denoted as AI_Frey. This indicator, based on the characteristics of different occupations in the occupational information network (O*NET), uses machine learning algorithms to measure the degree to which different occupations are affected by AI. It takes values in the interval [0, 1], with higher values indicating AI’s greater impact on people. Robustness tests results using the above different AI indexes are exhibited in Table 3. It is shown that the impact of AI on on-the-job learning is significantly negative at the 1% level, regardless of which indicator is applied. Furthermore, AI’s estimated coefficients obtained using the above indicators are largely consistent, confirming the robustness of the findings in this paper.
4.2.2. Dealing with Measurement Errors in the On-the-Job Learning Indicator
Considering that different respondents may have varied understandings of the options presented in the questionnaire, the dependent variable may suffer from measurement errors. To check the robustness of the benchmark regression results, this paper further constructs the dummy variable Whe_Learning, according to whether ratings of on-the-job learning frequencies are greater than 3. Therefore, if the respondents seldom or never participate in on-the-job learning, Whe_Learning is coded as 0 and as 1 if otherwise. This dummy variable can mitigate measurement errors caused by differences in respondents’ understandings of question options to a large extent. The reason lies in the fact that although different respondents may have divergent understandings of the frequency of “sometimes”, “often”, and “frequently”, there is hardly any difference in the judgment of whether the further learning frequency belongs to Whe_Learning = 0 (never or seldom) or Whe_Learning = 1 (sometimes, often or frequently). Since this explained variable is a binary variable, the predicted values of the OLS model may be outside [0, 1], so probit and logit models based on the maximum likelihood estimation are applied. The log-likelihood function is of the following form:
or
In expression (2), S is the set of all observations such that . can take the form of either Equation (3) or Equation (4). Equation (3), where is the standard normal cumulative density function, corresponds to the probit model. Equation (4) is applied to the logit model. Based on this, and are estimated by .
The results estimated using the probit model and logit model are shown in Table 4 and Table 5, respectively. Similarly, by stepwise adding control variables in six aspects, the estimated coefficients of AI’s effect on Whe_Learning remain significantly negative at the 1% level. This demonstrates that AI significantly inhibits on-the-job learning after dealing with measurement errors in the on-the-job learning indicator, no matter whether a probit or logit model is employed.
4.2.3. Using Ordered Response Models
The dependent variable is an ordered variable because it takes the values of 1, 2, 3, 4, and 5. This means that although further learning frequencies are ordered from “never” to “frequently”, the spacing between the values of may not be the same across different levels. The linear models, such as OLS, assume that these categories are equally spaced, which may not be the case. Therefore, to check the robustness of the conclusions obtained from the linear model, ordered response models are further applied, which assume that the explained variable is ordinal and different categories are not equally spaced. Specifically, based on the sample is divided into five subgroups, denoted = 1 to 5, representing those that never, seldom, sometimes, often, and frequently engage in on-the-job learning, respectively. The probability of a given observation in group is
or
In Equation (5), is and is . can take two forms. The first is to use Equation (6) for an ordered probit model estimation, where is the standard normal cumulative distribution function. The other approach is to apply Equation (7) for an ordered logit model estimation. Accordingly, the log likelihood of the maximum likelihood estimation (MLE) is
where and is the sample size. Based on this, and are estimated by .
The estimation results obtained from the ordered probit and ordered logit models are displayed in Table 6 and Table 7, respectively. In all regressions, the estimated coefficients of artificial intelligence’s impact on are significantly negative at the 1% level, consistent with the conclusions derived from the benchmark regressions. This indicates that the application of AI decreases workers’ further learning. Additionally, with the inclusion of different control variables, the estimated coefficients of AI are stable around −0.06, suggesting that the conclusions of this paper are robust and that AI’s effects on on-the-job learning are not altered by model selection or the inclusion of other factors.
4.2.4. Instrumental Variable Methods
In benchmark regressions, the impact of artificial intelligence on on-the-job learning may be subject to the endogeneity problem for two reasons. On the one hand, the reverse causality problem may arise from the concern that workers who learn more frequently may be less likely to be replaced by AI because of their high human capital, and thus, AI has less impact on the jobs they perform. On the other hand, there may exist other unobserved factors that could affect on-the-job learning in the random disturbance term, resulting in biased estimates of AI’s coefficient. To address potential endogeneity issues, the following two-stage least squares (2SLS) model is constructed:
In Model (9), is the instrumental variable. This is the first stage regression of 2SLS, in which is used to estimate . In Model (10), the predicted value of is used to test its effect on on-the-job learning. The instrumental variable is the routine intensity index constructed by Marcolin et al. [74]. The higher the , the higher the routine intensity of the occupation, and the easier it is to be influenced by artificial intelligence [74]. Therefore, this instrumental variable satisfies the correlation prerequisite. In addition, this indicator also satisfies exogeneity due to the following two reasons. First, from a reverse causality perspective, is an indicator measured based on the 2011–2012 OECD survey of adult skills, whereas the data used in this paper are from the 2017–2018 CGSS, making it unlikely that Chinese respondents in 2017 and 2018 reversely affect the earlier . Second, is an indicator at the sectoral level, which is based on three-digit ISCO-2008, whereas is an individual-level four-digit ISCO2008 measure. Consequently, is exogenous to respondents’ individual characteristics. Based on the above two points, satisfies the exogeneity condition of instrumental variables. Column (1) of Table 8 exhibits the estimation results of the first stage of 2SLS, indicating that significantly increases at the 1% level, proving the above proposition. Additionally, the F value of this regression is 74.127, much larger than the empirical criterion of 10, confirming that this instrumental variable is valid for the estimation. The results of the second-stage regression of 2SLS are listed in Column (2) of Table 8. After addressing endogeneity, the effect of AI on on-the-job learning is still significantly negative at the 1% level, demonstrating that AI robustly inhibits on-the-job learning. Furthermore, as presented in Columns (3)–(5) of Table 8, when employing different instrumental variable models, including the limited information maximum likelihood estimation (LIML), two-step optimal generalized method of moments (GMM) and iterative GMM (IGMM), AI’s impact on on-the-job learning remains significantly negative at the 1% level. This supports the notion that the findings of this paper are not affected by the endogeneity issue and are highly reliable.
4.2.5. Penalized Machine Learning Estimations
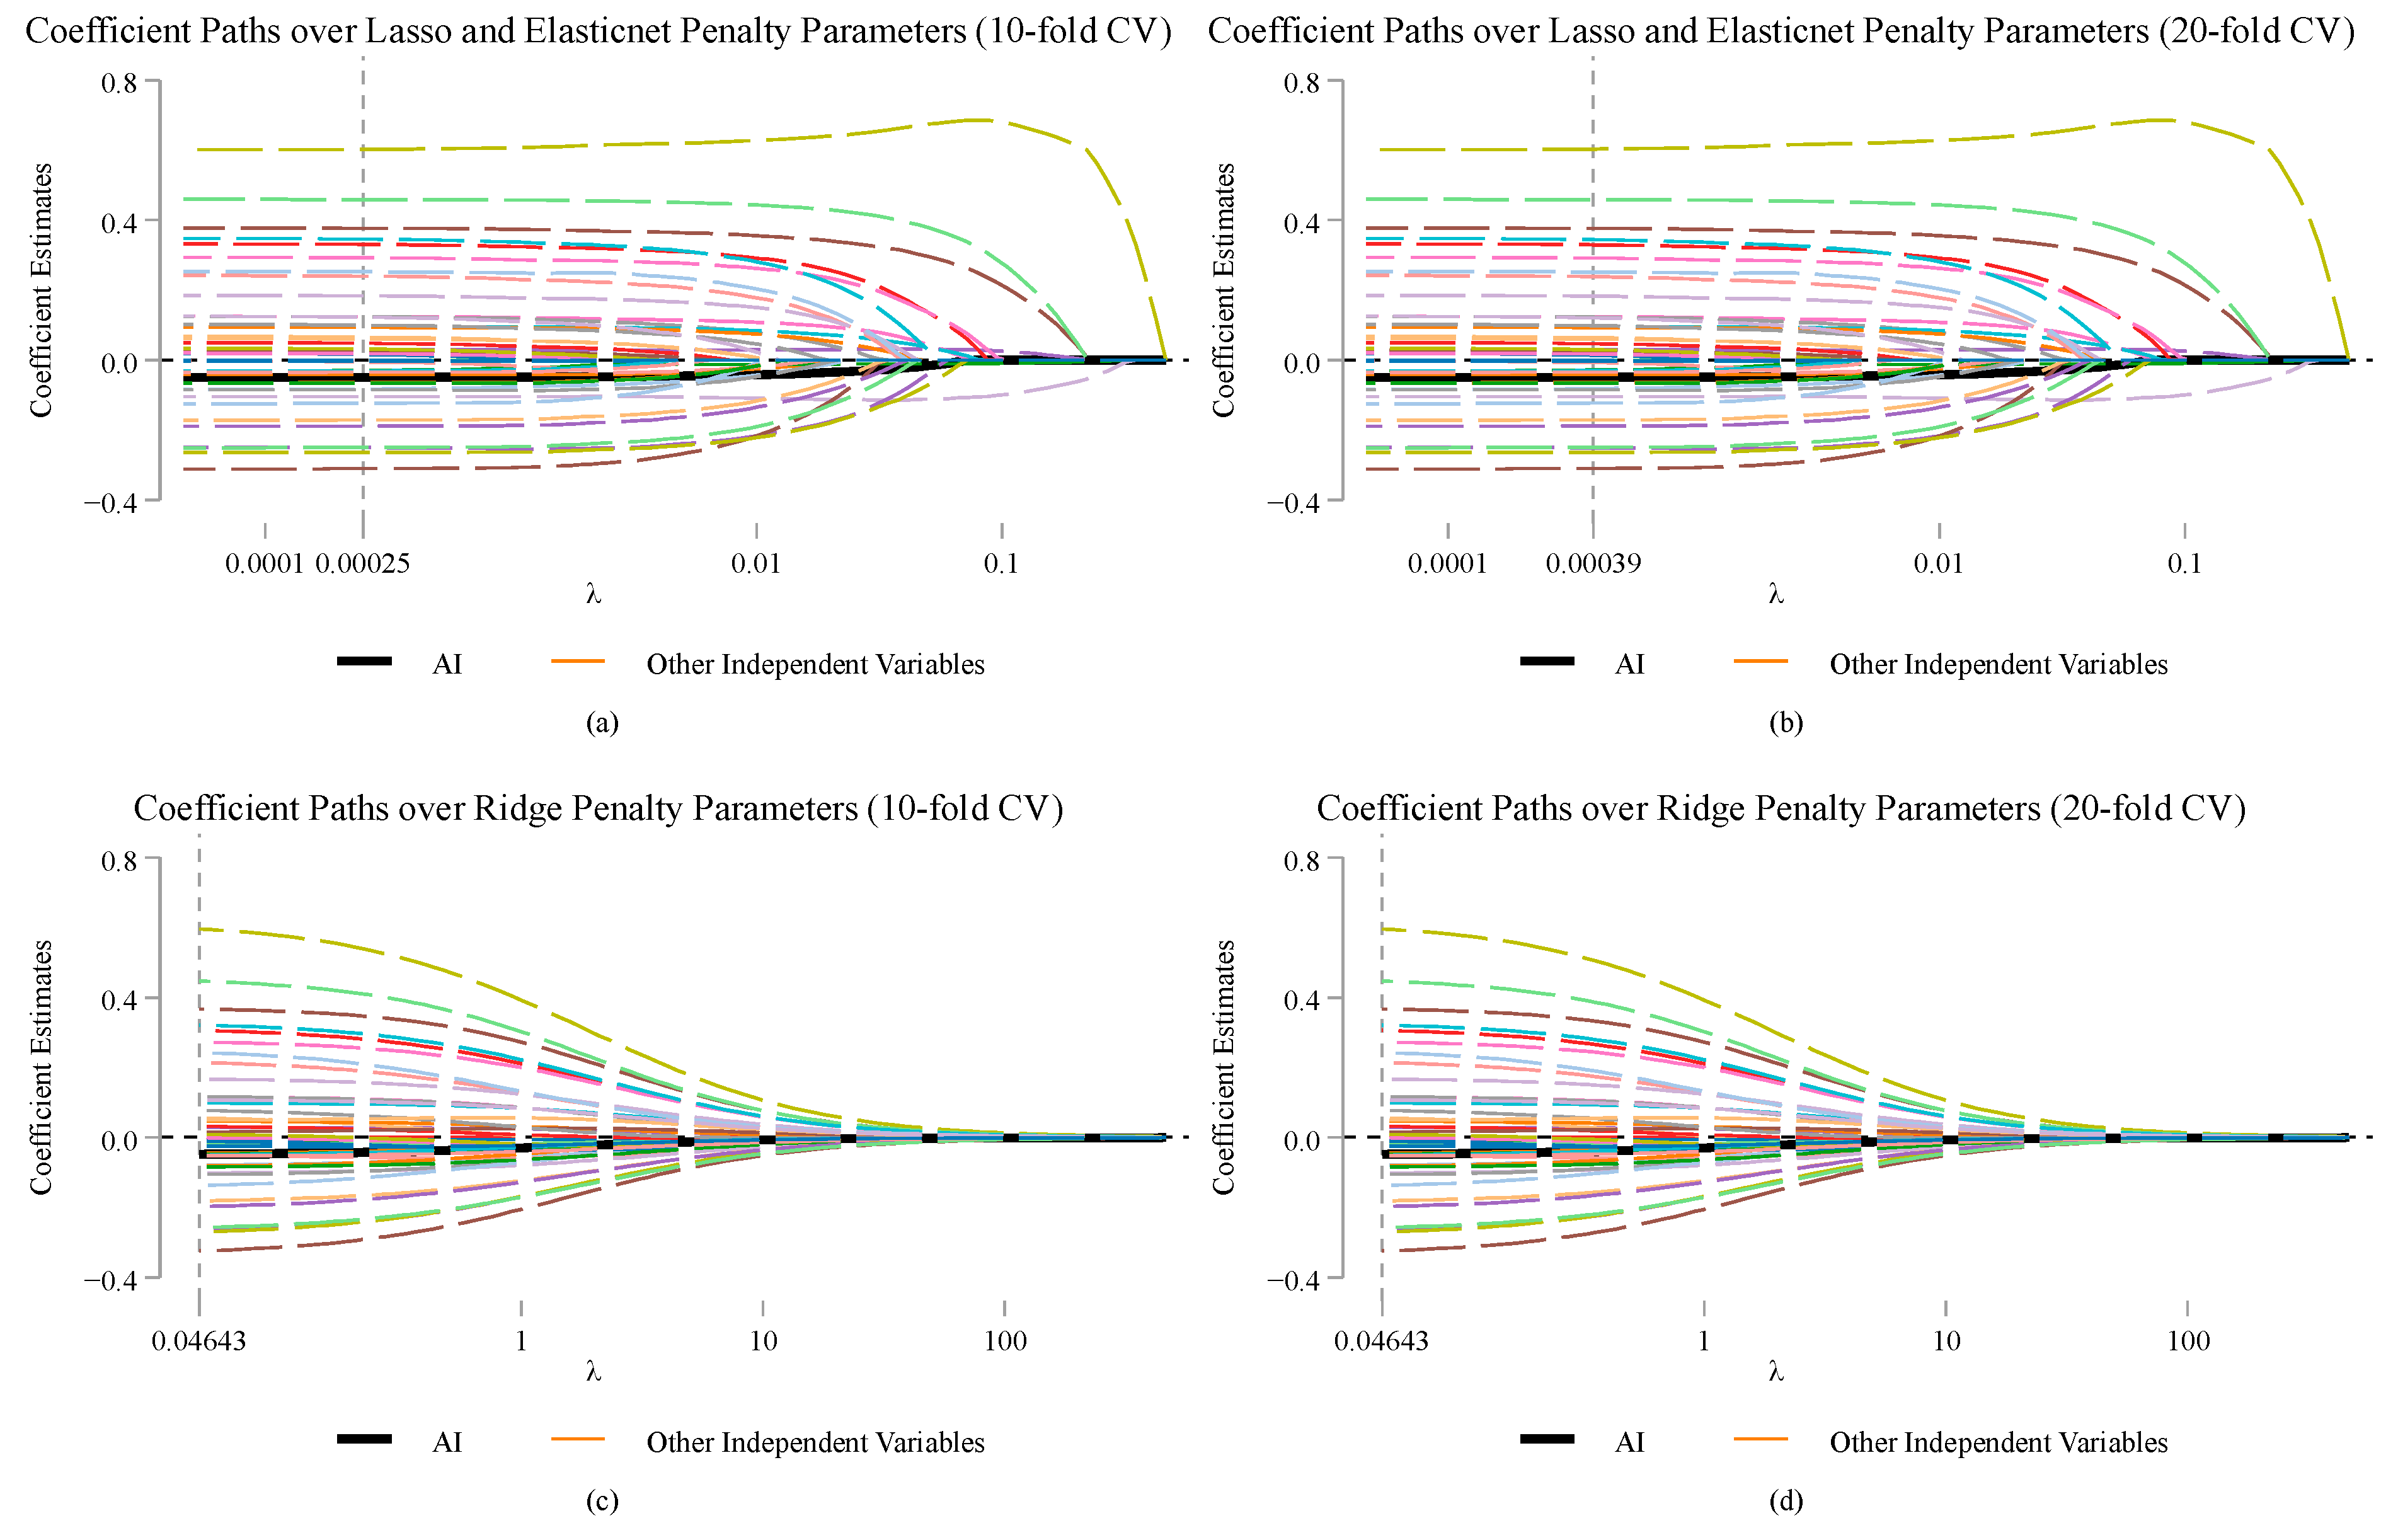
Given that the existing literature has not yet focused on the impact of artificial intelligence on on-the-job learning, we further test the predictive and explanatory power of AI on further learning in comparison to other factors. To achieve this, this paper first utilizes the lasso model of machine learning for analysis. We calculate the optimal penalties using both 10-fold and 20-fold cross-validation methods and obtain the two optimal penalty parameters of 0.00025 and 0.00039, respectively. As shown in Columns (1) and (2) of Table 9, under the optimal penalties, AI is among the non-zero independent variables in both models with negative estimates. This implies that AI is an important predictor of workers’ on-the-job learning frequencies. Subsequently, we use the Ridge and Elastic net models for estimation. The optimal obtained in the Elastic net model is 1, indicating that it is equivalent to the lasso model. The results demonstrate that AI is a necessary predictor of on-the-job learning in all the penalty models. To visually and intuitively analyze the changes in the coefficients of different independent variables as the penalty parameter increases, we further plot the change paths of independent variables’ coefficients for each penalized machine learning model, as shown in Figure 2, where the coefficient paths of AI are the black bolded lines. It is demonstrated that, first, none of the AI’s estimates converge to 0 at the optimal penalties in these models, consistent with the estimation results in Table 9. Second, the estimated coefficients of AI converge to 0 only when penalty parameters are very large when few variables are not penalized to 0. This suggests that the explanatory power of AI for on-the-job learning is very robust compared to other factors.
4.2.6. Placebo Tests
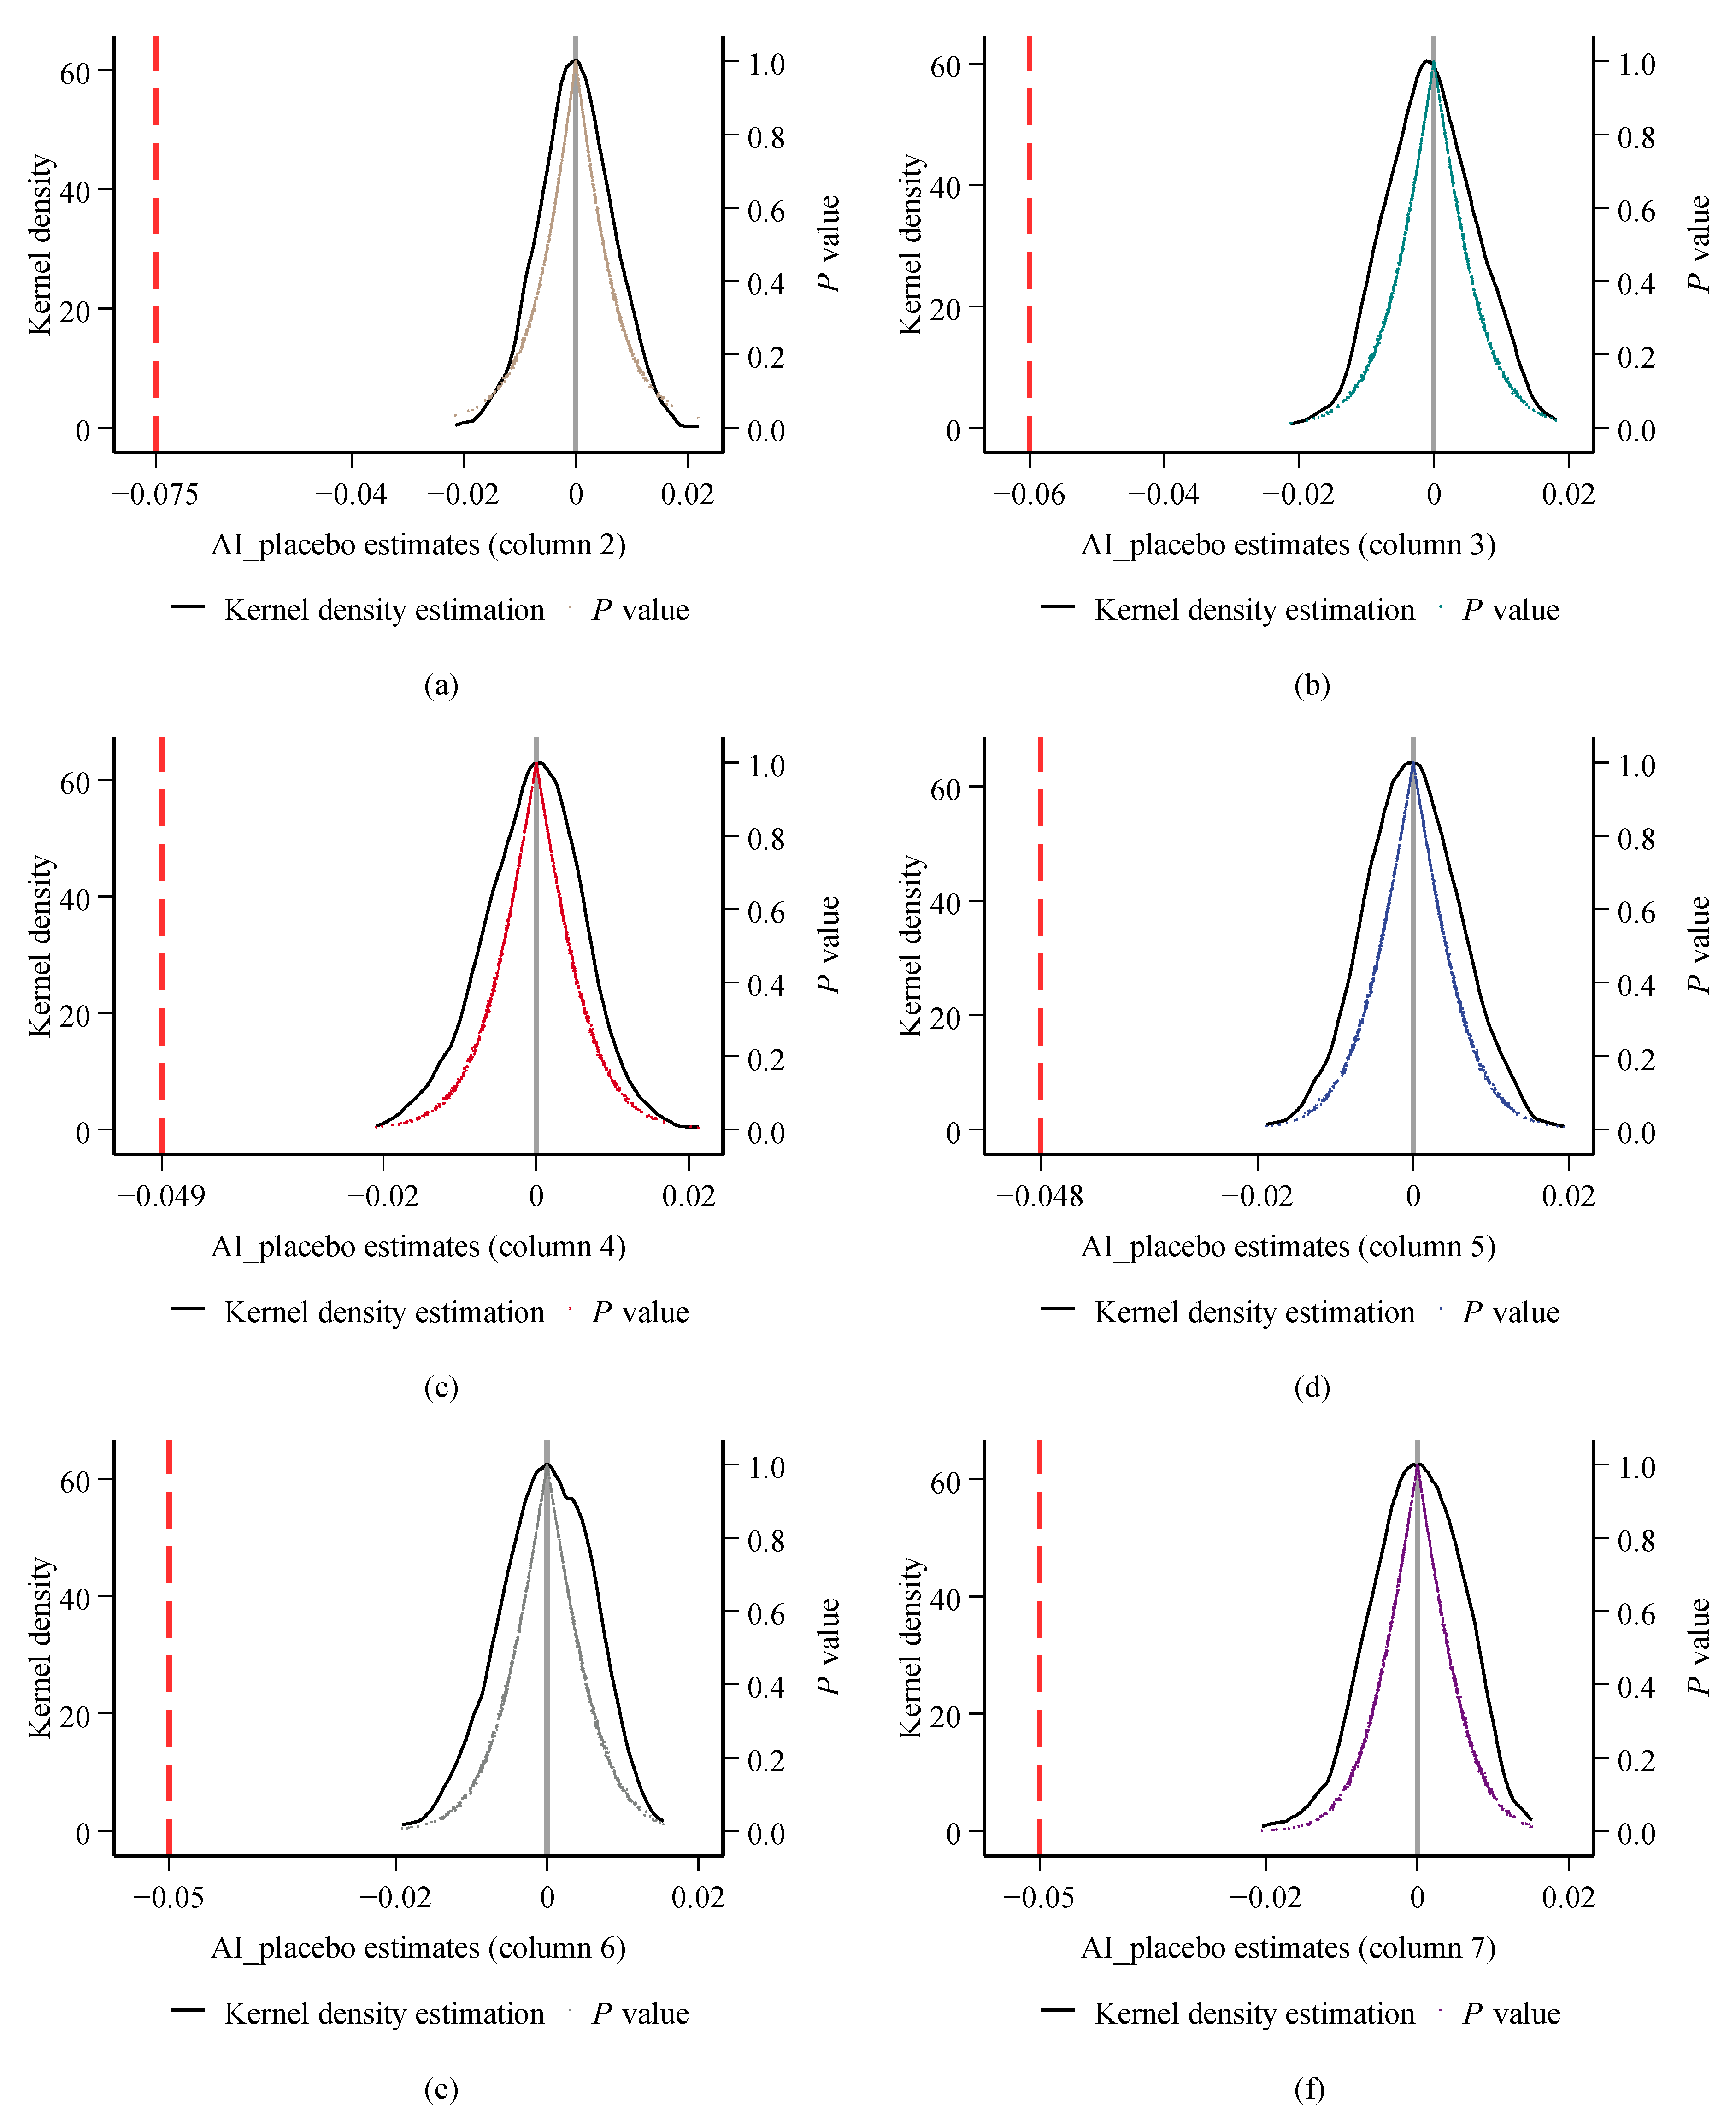
We have examined the impact of artificial intelligence on on-the-job learning from different perspectives, but there is still a concern that the statistical significance of AI’s estimates may be due to uncontrolled random factors. If this speculation is true, the results of this paper would not be valid. To address this concern, placebo tests were conducted. Specifically, we randomly assigned the AI indicator in the sample 1000 times to obtain the placebo explanatory variable , and then used these 1000 new samples for regression to estimate the impact of on on-the-job learning. The estimated results are plotted in Figure 3, where the six sub-figures are the placebo test results performing the benchmark regressions in Columns (2)–(7) of Table 2, with the stepwise addition of control variables. The black solid lines are the probability density curves of ’s estimated coefficients in regressions with the 1000 new samples. The colored scatters are the P values corresponding to the estimates of . The red vertical dashed lines signify the estimates of benchmark regressions in Columns (2)–(7) of Table 2. It is clear that the distributions of coefficients are all basically centered on 0, showing a near-normal distribution in all regression models. The colored scatters, which are the P values corresponding to the estimated coefficients of , are almost all higher than 0.1. More importantly, the estimated coefficients of benchmark regressions in Columns (2)–(7) of Table 2 are all much smaller than the 1000 placebo estimates. This proves that the magnitude of the relationship between AI and on-the-job learning owing to chance factors is far from the results obtained in benchmark regressions. Therefore, this provides evidence that the effect of AI on further learning is not due to uncontrolled random factors.
5. Mechanism Analysis
The preceding sections have confirmed the negative effect of artificial intelligence on on-the-job learning. We next examine the mechanisms by which AI influences workers’ on-the-job learning. Based on the above theoretical analysis, this paper further tests the future expectation mechanism, income mechanism, and working-time mechanism. Referring to Alesina et al. [75], the following model is constructed to conduct the mechanism analysis based on dealing with endogeneity:
where is the mediating variable. is the fitted value of AI in the first stage regression of 2SLS in Model (9). Models (11) and (12) use the fitted values of AI obtained from Model (9) for the second stage regression of 2SLS. If both in Model (11) and in Model (12) are estimated to be significant, is proven to mediate AI’s effect on on-the-job learning.
5.1. Future Expectation Mechanism
In the first part of theoretical analysis, two hypotheses concerning the future expectation mechanism (H1a and H1b) are proposed. It has been discussed that the pessimistic expectations caused by AI may produce a stimulation effect and thus promote on-the-job learning. At the same time, the pessimistic expectations can also bring a burnout effect, which may inhibit further learning. In light of this, this paper tests the future expectation mechanism using the above mechanism test approach. To directly measure people’s future expectations, we construct a variable Optimism about future, based on respondents’ answers to the CGSS question “I am optimistic about my future”. This variable, based on the five-point Likert scale, classifies the level of agreement to the above question from 1–5 in the order of “strongly disagree”, “disagree”, “neither agree nor disagree”, “agree”, and “strongly agree”. Obviously, higher scores represent more optimistic future expectations. Because this question comes from the extension module of the CGSS questionnaire in the 2017 wave, the number of observations in regressions with this variable is smaller. Additionally, a variable indirectly characterizing future expectations, Anticipated social status, is utilized, which is based on the question “what social class do you think you will belong to in the next 10 years?” The options for this question are on a scale from 1 to 10, with 10 representing the top social class and 1 being the bottom class. Based on the above two variables that directly and indirectly measure workers’ future expectations, this paper conducts the following mechanism analysis.
Table 10 shows the test results of the future expectation mechanism. In Columns (2) and (4), artificial intelligence significantly decreases people’s expectations for the future. Meanwhile, the results in Columns (3) and (5) indicate that the more optimistic towards future workers are and the higher the expected social status, the larger the further learning frequencies. Moreover, the absolute values of AI’s estimated coefficients drop from 0.227 to 0.211 when the mediating variable is included in the regression. This implies that AI reduces on-the-job learning frequencies by lowering workers’ future expectations. Therefore, H1b is confirmed, meaning that more pessimistic expectations caused by AI inhibit people’s on-the-job learning.
5.2. Economic Income Mechanism
In addition to the future expectation mechanism, artificial intelligence may also influence on-the-job learning through its impact on income. In this regard, H2a and H2b are put forward in the second part of the theoretical analysis. It is shown that the complementarity and cost-saving effects of AI may increase income, and therefore, promote on-the-job learning. However, its replacement and mismatch effects can reduce earnings, which may inhibit further learning. To test the hypotheses, this paper firstly uses workers’ personal income for mechanism analysis. The results in Column (2) of Table 11 demonstrate that AI significantly reduces workers’ personal income at the 1% level. In Column (3), personal income significantly increases the frequency of on-the-job learning. Moreover, after controlling for income, the absolute value of AI’s estimated coefficient decreases from 0.230 to 0.227, while still being significant at the 1% level, compared with that in Column (1). This means that personal income mediates the negative effect of AI on on-the-job learning. Therefore, H2b is supported. Furthermore, we perform a robustness test for this mechanism using household income. To avoid multicollinearity, personal income is not controlled in Columns (4) and (5). The results show that the economic income mechanism still holds when household income is used as the mediating variable. Therefore, by cutting down people’s income, AI decreases the financial resources they can spend on human capital investment, thus reducing on-the-job learning.
5.3. Working Time Mechanism
On-the-job learning involves not only financial costs but also investment in time. In this respect, H3a and H3b are proposed in theoretical analysis. On the one hand, the deskilling effect of artificial intelligence increases working time, and thus, may inhibit on-the-job learning. However, on the other hand, its productivity and replacement effect can reduce working time, which may enhance on-the-job learning. To test the mechanism, the number of hours worked per week is firstly used as the mediator for analysis. Results in Column (2) of Table 12 exhibit that AI significantly increases working hours at the 1% level. This indicates that the application of AI does not reduce workers’ workload, while extending their working time because of its deskilling effect as discussed in the theoretical analysis, which is consistent with the existing literature [22,48,49]. In Column (3), working hours significantly reduce people’s further learning, demonstrating that the longer the working time, the less time they can spend on learning. Furthermore, the absolute value of AI’s estimated coefficient in Column (3), which is 0.220, drops compared to 0.227 in Column (1). This implies that AI inhibits on-the-job learning through increasing working hours, proving H3a. Furthermore, to test the robustness of this mechanism, a dummy variable of whether one overworks is generated. Referring to [76,77], working more than 50 h per week is defined as overworking. Since the explained variable here is a binary variable, the IV Probit model is applied for estimation. As illustrated in Columns (4) and (5), AI also discourages further learning by increasing the probability of overworking, again verifying H3a. Therefore, it is concluded that the application of AI results in longer working hours, and thus, inhibits on-the-job learning.
6. Heterogeneity Analysis
6.1. Heterogeneities in Terms of Demographic Characteristics
Artificial intelligence has significantly negative effects on on-the-job learning, but this consequence may vary with different workers’ characteristics. So, we perform subgroup regressions to test heterogeneities in terms of different demographic characteristics. Results in Columns (1) and (2) of Table 13 show that AI’s negative impacts on further learning are greater for workers over 45 years of age. This may be attributed to the fact that older people have more difficulty in acquiring new skills and are less willing to learn further [55]. Consequently, faced with the new AI technology, they have lower on-the-job learning frequencies. In terms of gender, findings demonstrate that AI’s inhibitory effect on on-the-job learning is more salient for female workers. This may be because women are at a disadvantaged position in the labor market [59] and it is harder for them to switch jobs by updating skills when being displaced by new technologies. In addition, women may tend to perform routine tasks more often than men even within the same occupational category, making them more at risk of being substituted [58]. Hence, AI negatively affects their on-the-job learning to a greater extent. In addition, with respect to educational attainment, Columns (5) and (6) display that AI causes a greater reduction in on-the-job learning for workers with lower education levels. By contrast, since highly educated workers who have a college degree or higher are more competitive in the labor market, they are less affected by technological shocks [25,60]. Moreover, because employers tend to provide those who are higher educated with more training opportunities, they are easier to engage in further learning [31]. Thus, AI has a less negative impact on on-the-job learning for highly educated workers.
6.2. Heterogeneities in Terms of Working Characteristics
We have examined the variations in artificial intelligence’s effect on on-the-job learning from the perspective of demographic characteristics. Next, the heterogeneities of AI’s impact on workers’ on-the-job learning in terms of working characteristics are explored. In detail, we conducted analysis from the three aspects of labor contract, job autonomy, and work experience. First, considering that labor contract provides the legal basis for employees to protect their rights, we performed the subsample regressions based on whether one has a labor contract. The results are reported in Columns (1) and (2) of Table 14, where the effect of AI on further learning is greater for workers without a labor contract. This indicates that strengthening labor protection through labor contracts can mitigate AI’s negative effect on on-the-job learning. This echoes the findings of Li and Freeman [61] and Zhao and Tang [62] that labor contracts help improve the welfare of vulnerable workers. Second, with regard to job autonomy, according to respondents’ answers to the CGSS question, “In your current job, how much autonomy do you have to decide your work pattern?”, the sample is divided into lower and higher job autonomy subgroups. Specifically, the workers reporting “having no autonomy” and “having little autonomy” are classified in the lower autonomy group, while those answering “have full autonomy” and “have some autonomy” are categorized as in higher autonomy jobs. Columns (3) and (4) of Table 14 present that the inhibitory effect of AI on on-the-job learning is more prominent for workers in low-autonomy jobs. On the contrary, those with more job autonomy are less affected by AI, since they can spare more time on further learning. This also supports the previous analysis on the working-time mechanism from another angle. Third, in terms of work experience, it is generally believed that the more the working years, the more work experience is accumulated. So, based on the average working time in the current job of respondents in the CGSS sample, which is 6.120 years, we classify respondents into subgroups with less and more working experience. The results in Columns (5) and (6) show that AI has a greater impact on further learning for workers with less work experience. This can be explained by the fact that work experience can enhance employability [66].
6.3. Regional Heterogeneities
This paper further investigates the regional variations in the impact of artificial intelligence. First, we carry out an analysis from the perspective of human–AI competition. Considering that more technologically developed regions have a wider application of AI and the human–AI competition there is more intense, subsample analysis is carried out from the perspective of regional variations in technological development. Specifically, according to the median of the proportion of high-technology industry output (=high-technology industry output/GDP) in the China Torch Statistical Yearbook 2017, provinces are divided into high-technology and low-technology regions. The results in Table 15, Columns (1) and (2) show that AI has a greater negative effect on on-the-job learning for workers in high-technology regions, indicating that intense human–AI competition reduces workers’ willingness to learn further to a greater extent. Moreover, this paper investigates AI’s heterogeneous effects in regions with different numbers of labor disputes and unemployment rates. Based on the median number of labor disputes and unemployment rate in the China Labor Statistics Yearbook 2017, provinces are divided into areas with fewer and more disputes, as well as lower and higher unemployment rates. Results demonstrate that the negative effect of AI on on-the-job learning is more pronounced in regions with more labor disputes and higher unemployment rates. This may be due to the fact that in regions with stronger labor protection, workers tend to have a more positive attitude toward new technology. They are also more likely to adapt to rapidly evolving skill demands through reeducation and retraining [68]. Therefore, more harmonious labor relations and better job security contribute to weakening AI’s adverse consequences.
7. Conclusions and Implications
This paper systematically explores the impact of artificial intelligence on on-the-job learning. Based on the literature review and theoretical analysis, six hypotheses are proposed relating to three aspects of AI’s consequences on workers’ further learning. On this basis, empirical tests using CGSS data are performed. The findings demonstrate that: First, the application of AI in the workplace significantly inhibits workers’ on-the-job learning. This conclusion holds in a series of robustness and endogeneity checks, including using different AI and on-the-job learning measures, ordered response models, instrumental variable approach, penalized regressions, placebo tests, etc. Second, AI’s adverse impact on on-the-job learning is mediated by future expectation, economic income and working-time mechanisms. To be specific, AI makes people more pessimistic about their future, leading to burnout, and thus, less motivation for on-the-job learning. At the same time, AI decreases workers’ income and lengthens working hours, for which their available financial resources and disposable time for further learning are cut down, thus inhibiting on-the-job learning. Third, this paper explores the variations in AI’s impact in the aspects of demographic, working, and regional characteristics. It has been found that AI has greater negative impacts on on-the-job learning for older, female, and less-educated employees. Moreover, its effect is more conspicuous for those without a labor contract, as well as with less job autonomy and work experience. In terms of regional heterogeneities, results show that in regions with more intense human–AI competition, more labor-management conflicts, and poorer labor protection, the negative effect of AI on on-the-job learning is more pronounced. This highlights that harmonious labor relations and better employment protection are conducive to mitigating AI’s adverse impact on on-the-job learning.
In the current context of the fourth technological revolution driving the intelligent transformation, the findings of this paper have important implications for enterprises to better understand employee preferences and behaviors, and accordingly optimize their management strategy in the era of AI. First, managers should attach great importance to AI’s negative effect on employees’ on-the-job learning. The findings of this paper reveal that AI does not necessarily stimulate employees to further improve their skills and increase human capital investment, but rather makes them more pessimistic about the future and thus discourages on-the-job learning. This is not favorable in terms of promoting employees to acquire new skills to achieve human–AI teaming and cooperation, and thus, is detrimental to future innovation. So, in the process of taking advantage of AI for technological upgrades, on the one hand, enterprises should bolster workers’ positive psychological expectations and motivate them to improve their skills. On the other hand, more training opportunities should be provided for workers to master new skills that are compatible with the new technology, which can help enhance their human capital and foster long-term innovation. Second, enterprises should be aware of AI’s adverse impact on employees’ income and working time. It has been shown that AI reduces workers’ income while extending work hours through its deskilling effect, leading them to have less money and time available on on-the-job learning. For this reason, for enterprises aiming to motivate employees to learn new skills, they can consider offering subsidies for skill training. At the same time, for those who have further learning motivations, managers need to optimize their working time arrangement to better support them to participate in on-the-job learning. Third, more attention should be paid to employees who have fewer learning opportunities or are less willing to learn, such as older, female and less-educated workers, as well as those with less job autonomy and work experience. It is more critical for companies to provide more training opportunities for them. Fourth, in the process of applying AI technology, governments and relevant public agencies should strengthen labor protection for workers. Measures such as improving employment contracting systems, setting up efficient labor dispute resolution mechanisms and providing better job security should be emphasized to help workers develop more stable and positive employment expectations, thus mitigating the negative effects of AI on on-the-job learning.
However, there are limitations in this study. Although this paper takes an empirical approach to examine workers’ reactions to AI, it fails to analyze the personnel failure, as well as workers’ reliability in human–AI teaming, resulting in a lack of an in-depth examination of on-the-job learning contents. In the future, using human reliability analysis [78,79] to evaluate the causes and impact of human error so as to study the contents of on-the-job learning would be a valuable research direction.
Author Contributions
C.L. contributed to the conception and design of the study and performed the statistical analysis. Y.Z. generated the tables and figures based on C.L.’s analysis. C.L. and Y.Z. wrote the first draft of the manuscript. X.N., F.C. and H.Z. worked on the revisions of the manuscript. All authors have read and agreed to the published version of the manuscript.
Funding
This research was funded by the Humanities and Social Science Research Project of the Ministry of Education of China (grant number 19YJC790055); the Project of the Natural Science Foundation of China (grant number 71973081 & 72202232); the Project of the Natural Science Foundation of Shandong Province, China (grant number ZR2020QG038), and the Project of the Social Science Foundation of Shandong Province, China (grant number 19DJJJ08).
Institutional Review Board Statement
Not applicable.
Informed Consent Statement
Not applicable.
Data Availability Statement
The data that support the findings of this study are available from the Chinese general social survey (CGSS, http://cgss.ruc.edu.cn/English/Home.htm (accessed on 16 January 2023)). Restrictions apply to the availability of these data, which were used under license for this study. Data are also available from the authors with the permission of the CGSS.
Conflicts of Interest
The authors declare that the research was conducted in the absence of any commercial or financial relationships that could be construed as a potential conflict of interest.
References
- Aghion, P.; Jones, B.F.; Jones, C.I. Artificial intelligence and economic growth. In The Economics of Artificial Intelligence: An Agenda; Agrawal, A., Gans, J., Goldfarb, A., Eds.; University of Chicago Press: Chicago, IL, USA, 2019; pp. 237–282. Available online: https://ideas.repec.org/b/nbr/nberbk/agra-1.html (accessed on 6 April 2019).
- Damioli, G.; Van Roy, V.; Vertesy, D. The impact of artificial intelligence on labor productivity. Eurasian Bus. Rev. 2021, 11, 1–25. [Google Scholar] [CrossRef]
- Sequeira, T.N.; Garrido, S.; Santos, M. Robots are not always bad for employment and wages. Int. Econ. 2021, 167, 108–119. [Google Scholar] [CrossRef]
- Sowa, K.; Przegalinska, A.; Ciechanowski, L. Cobots in knowledge work. J. Bus. Res. 2021, 125, 135–142. [Google Scholar] [CrossRef]
- Dellermann, D.; Lipusch, N.; Ebel, P.; Leimeister, J.M. Design principles for a hybrid intelligence decision support system for business model validation. Electron. Mark. 2018, 29, 423–441. [Google Scholar] [CrossRef] [Green Version]
- Füller, J.; Hutter, K.; Wahl, J.; Bilgram, V.; Tekic, Z. How AI revolutionizes innovation management—Perceptions and implementation preferences of AI-based innovators. Technol. Forecast. Soc. Chang. 2022, 178, 121598. [Google Scholar] [CrossRef]
- Wilson, H.J.; Daugherty, P.R. Collaborative Intelligence: Humans and AI are joining forces. Harv. Bus. Rev. 2018, 96, 114–123. Available online: https://hometownhealthonline.com/wp-content/uploads/2019/02/ai2-R1804J-PDF-ENG.pdf (accessed on 1 August 2018).
- Acemoglu, D.; Restrepo, P. Robots and Jobs: Evidence from US Labor Markets. J. Politi-Econ. 2020, 128, 2188–2244. [Google Scholar] [CrossRef] [Green Version]
- Schlogl, L.; Sumner, A. The rise of the robot reserve army: Automation and the future of economic development, work, and wages in developing countries. SSRN Electron. J. 2018. [Google Scholar] [CrossRef] [Green Version]
- Autor, D.; Dorn, D.; Katz, L.F.; Patterson, C.; Van Reenen, J. The Fall of the Labor Share and the Rise of Superstar Firms. Q. J. Econ. 2020, 135, 645–709. [Google Scholar] [CrossRef] [Green Version]
- Nazareno, L.; Schiff, D.S. The impact of automation and artificial intelligence on worker well-being. Technol. Soc. 2021, 67, 101679. [Google Scholar] [CrossRef]
- Ivanov, S.; Kuyumdzhiev, M.; Webster, C. Automation fears: Drivers and solutions. Technol. Soc. 2020, 63, 101431. [Google Scholar] [CrossRef]
- Autor, D.H. Why Are There Still So Many Jobs? The History and Future of Workplace Automation. J. Econ. Perspect. 2015, 29, 3–30. [Google Scholar] [CrossRef] [Green Version]
- Squicciarini, M.; Nachtigall, H. Demand for AI skills in jobs: Evidence from online job postings. In OECD Science, Technology and Industry Working Papers 2021; OECD: Paris, France, 2021. [Google Scholar] [CrossRef]
- Koch, M.; Manuylov, I.; Smolka, M. Robots and firms. Econ. J. 2021, 131, 2553–2584. [Google Scholar] [CrossRef]
- Acemoglu, D.; Restrepo, P. Low-Skill and High-Skill Automation. J. Hum. Cap. 2018, 12, 204–232. [Google Scholar] [CrossRef] [Green Version]
- Graetz, G.; Michaels, G. Robots at work. Rev. Econ. Stat. 2018, 100, 753–768. [Google Scholar] [CrossRef] [Green Version]
- Sen, W.; Hong, Z.; Xiaomei, Z. Effects of Human–Machine Interaction on Employee’S Learning: A Contingent Perspective. Front. Psychol. 2022, 13, 876933. Available online: https://www.frontiersin.org/articles/10.3389/fpsyg.2022.876933/full (accessed on 25 July 2022). [CrossRef]
- Cheng, G.H.-L.; Chan, D.K.-S. Who Suffers More from Job Insecurity? A Meta-Analytic Review. Appl. Psychol. 2008, 57, 272–303. [Google Scholar] [CrossRef]
- Acemoglu, D.; Restrepo, P. Artificial intelligence, automation, and work. In The Economics of Artificial Intelligence: An Agenda; Agrawal, A., Gans, J., Goldfarb, A., Eds.; University of Chicago Press: Chicago, IL, USA, 2019; pp. 197–236. Available online: http://www.nber.org/chapters/c14027 (accessed on 1 May 2019).
- Rafner, J.; Dellermann, D.; Hjorth, A.; Verasztó, D.; Kampf, C.; Mackay, W.; Sherson, J. Deskilling, Upskilling, and Reskilling: A Case for Hybrid Intelligence. Morals Mach. 2021, 1, 24–39. [Google Scholar] [CrossRef]
- Huang, Y.; Sharif, N. From ‘labour dividend’ to ‘robot dividend’: Technological change and workers’ power in South China. Agrar. South J. Polit. Econ. 2017, 6, 53–78. [Google Scholar] [CrossRef]
- Chowdhury, S.; Budhwar, P.; Dey, P.K.; Joel-Edgar, S.; Abadie, A. AI-employee collaboration and business performance: Integrating knowledge-based view, socio-technical systems and organisational socialisation framework. J. Bus. Res. 2022, 144, 31–49. [Google Scholar] [CrossRef]
- Marhraoui, M.A.; Janati Idrissi, M.A.; Manouar, A.E. An integrated human-AI Framework towards organizational agility and sustainable performance. In Innovations in Smart Cities Applications; Ben Ahmed, M., Boudhir, A.A., Karaș, İ.R., Jain, V., Mellouli, S., Eds.; Springer: Cham, Switzerland, 2021; Volume 5, pp. 73–87. [Google Scholar] [CrossRef]
- Frey, C.B.; Osborne, M.A. The future of employment: How susceptible are jobs to computerisation? Technol. Forecast. Soc. Change 2017, 114, 254–280. [Google Scholar] [CrossRef]
- Brougham, D.; Haar, J. Technological disruption and employment: The influence on job insecurity and turnover intentions: A multi-country study. Technol. Forecast. Soc. Chang. 2020, 161, 120276. [Google Scholar] [CrossRef]
- Hortovanyi, L.; Ferincz, A. The impact of ICT on learning on-the-job. Learn. Organ. 2015, 22, 2–13. [Google Scholar] [CrossRef]
- Ouweneel, A.P.E.; Taris, T.W.; Van Zolingen, S.J.; Schreurs, P.J.G. How Task Characteristics and Social Support Relate to Managerial Learning: Empirical Evidence from Dutch Home Care. J. Psychol. 2009, 143, 28–44. [Google Scholar] [CrossRef]
- Jeske, D.; Lippke, S. Predictors of employees’ self-reported future learning ability and disengagement at work. J. Work. Learn. 2021, 34, 277–294. [Google Scholar] [CrossRef]
- Sanders, J.; Oomens, S.; Blonk, R.W.; Hazelzet, A. Explaining lower educated workers’ training intentions. J. Work. Learn. 2011, 23, 402–416. [Google Scholar] [CrossRef]
- Kyndt, E.; Onghena, P.; Smet, K.; Dochy, F. Employees’ willingness to participate in work-related learning: A multilevel analysis of employees’ learning intentions. Int. J. Educ. Vocat. Guid. 2014, 14, 309–327. [Google Scholar] [CrossRef]
- Van Hootegem, A.; De Witte, H.; De Cuyper, N.; Elst, T.V. Job Insecurity and the Willingness to Undertake Training: The Moderating Role of Perceived Employability. J. Career Dev. 2018, 46, 395–409. [Google Scholar] [CrossRef]
- Huang, M.H.; Rust, R.T. Artificial Intelligence in Service. J. Serv. Res. 2018, 21, 155–172. [Google Scholar] [CrossRef]
- Korteling, J.E.; van de Boer-Visschedijk, G.C.; Blankendaal, R.A.M.; Boonekamp, R.C.; Eikelboom, A.R. Human- versus Artificial Intelligence. Front. Artif. Intell. 2021, 4, 622364. [Google Scholar] [CrossRef]
- Lu, C.-H. The impact of artificial intelligence on economic growth and welfare. J. Macroecon. 2021, 69, 103342. [Google Scholar] [CrossRef]
- Young, J.; Cormier, D. Can robots be managers, too. Harv Bus. Rev. 2014. Available online: https://hbr.org/2014/04/can-robots-be-managers-too (accessed on 2 April 2014).
- Yam, K.C.; Goh, E.-Y.; Fehr, R.; Lee, R.; Soh, H.; Gray, K. When your boss is a robot: Workers are more spiteful to robot supervisors that seem more human. J. Exp. Soc. Psychol. 2022, 102, 104360. [Google Scholar] [CrossRef]
- Tsai, C.-Y.; Marshall, J.D.; Choudhury, A.; Serban, A.; Hou, Y.T.-Y.; Jung, M.F.; Dionne, S.D.; Yammarino, F.J. Human-robot collaboration: A multilevel and integrated leadership framework. Leadersh. Q. 2022, 33, 101594. [Google Scholar] [CrossRef]
- Bourne, D. My Boss the Robot. Sci. Am. 2013, 308, 38–41. [Google Scholar] [CrossRef]
- Dodel, M.; Mesch, G.S. Perceptions about the impact of automation in the workplace. Inf. Commun. Soc. 2020, 23, 665–680. [Google Scholar] [CrossRef]
- Lan, J.; Yuan, B.; Gong, Y. Predicting the change trajectory of employee robot-phobia in the workplace: The role of perceived robot advantageousness and anthropomorphism. Comput. Hum. Behav. 2022, 135, 107366. [Google Scholar] [CrossRef]
- Bhargava, A.; Bester, M.; Bolton, L. Employees’ Perceptions of the Implementation of Robotics, Artificial Intelligence, and Automation (RAIA) on Job Satisfaction, Job Security, and Employability. J. Technol. Behav. Sci. 2020, 6, 106–113. [Google Scholar] [CrossRef]
- Chigbu, B.I.; Nekhwevha, F.H. The future of work and uncertain labour alternatives as we live through the industrial age of possible singularity: Evidence from South Africa. Technol. Soc. 2021, 67, 101715. [Google Scholar] [CrossRef]
- Ciarli, T.; Kenney, M.; Massini, S.; Piscitello, L. Digital technologies, innovation, and skills: Emerging trajectories and challenges. Res. Policy 2021, 50, 104289. [Google Scholar] [CrossRef]
- Gregory, T.; Salomons, A.; Zierahn, U. Racing with or against the machine? Evidence from Europe. SSRN Electron. J. 2016. [Google Scholar] [CrossRef] [Green Version]
- Braverman, H. Labour and Monopoly Capital: The Degradation of Work in the Twentieth Century; Monthly Review Press: New York, NY, USA, 1998; Available online: https://www.jstor.org/stable/j.ctt9qfrkf? (accessed on 21 February 2023).
- Cheng, W.; Pien, L.; Cheng, Y. Occupation-level automation probability is associated with psychosocial work conditions and workers’ health: A multilevel study. Am. J. Ind. Med. 2020, 64, 108–117. [Google Scholar] [CrossRef]
- Gaddi, M. Technological and organisational innovation under Industry 4.0–Impact on working conditions in the Italian automotive supply sector. In The Challenge of Digital Transformation in the Automotive Industry: Jobs, Upgrading and the Prospects for Development; Drahokoupil, J., Ed.; ETUI aisbl: Brussels, Belgium, 2020; pp. 127–152. Available online: http://zbw.eu/econis-archiv/bitstream/11159/4875/1/1738901548.pdf#page=130 (accessed on 2 September 2020).
- Pham, Q.-C.; Madhavan, R.; Righetti, L.; Smart, W.; Chatila, R. The Impact of Robotics and Automation on Working Conditions and Employment [Ethical, Legal, and Societal Issues]. IEEE Robot. Autom. Mag. 2018, 25, 126–128. [Google Scholar] [CrossRef]
- Delfanti, A.; Frey, B. Humanly Extended Automation or the Future of Work Seen through Amazon Patents. Sci. Technol. Hum. Values 2020, 46, 655–682. [Google Scholar] [CrossRef]
- Ko, J.-H.; Kwon, H.U. Do technology shocks lower hours worked—Evidence from Japanese industry level data. J. Macroecon. 2015, 44, 138–157. [Google Scholar] [CrossRef]
- Simone, V.D.; Pasquale, V.D.; Giubileo, V.; Miranda, S. Human-Robot Collaboration: An analysis of worker’s performance. Procedia Comput. Sci. 2022, 200, 1540–1549. [Google Scholar] [CrossRef]
- Kromann, L.; Sørensen, A. Automation, performance and international competition: A firm-level comparison of process innovation. Econ. Policy 2019, 34, 691–722. [Google Scholar] [CrossRef]
- Cho, J.; Kim, J. Identifying Factors Reinforcing Robotization: Interactive Forces of Employment, Working Hour and Wage. Sustainability 2018, 10, 490. [Google Scholar] [CrossRef] [Green Version]
- Schmidpeter, B.; Winter-Ebmer, R. Automation, unemployment, and the role of labor market training. Eur. Econ. Rev. 2021, 137, 103808. [Google Scholar] [CrossRef]
- Tones, M.; Pillay, H.; Fraser, J. The influence of demographics and work related goals on adaptive development for work related learning amongst private hospital employees. Contemp. Nurse 2010, 36, 143–158. [Google Scholar] [CrossRef]
- Froehlich, D.E.; Raemdonck, I.; Beausaert, S. Resources to Increase Older Workers’ Motivation and Intention to Learn. Vocat. Learn. 2022, 1–25. [Google Scholar] [CrossRef]
- Piasna, A.; Drahokoupil, J. Gender inequalities in the new world of work. Transf. Eur. Rev. Labour Res. 2017, 23, 313–332. [Google Scholar] [CrossRef]
- Darity, W.A., Jr.; Mason, P.L. Evidence on Discrimination in Employment: Codes of Color, Codes of Gender. J. Econ. Perspect. 1998, 12, 63–90. Available online: https://pubs.aeaweb.org/doi/pdf/10.1257/jep.12.2.63 (accessed on 28 June 2014). [CrossRef]
- Zhou, G.; Chu, G.; Li, L.; Meng, L. The effect of artificial intelligence on China’s labor market. China Econ. J. 2019, 13, 24–41. [Google Scholar] [CrossRef]
- Li, X.; Freeman, R.B. How Does China’s New Labour Contract Law Affect Floating Workers? Br. J. Ind. Relat. 2014, 53, 711–735. [Google Scholar] [CrossRef]
- Zhao, C.; Tang, M. Research on the Influence of Labor Contract on the Urban Integration of Migrant Workers: Empirical Analysis Based on China’s Micro Data. Int. J. Environ. Res. Public Health 2022, 19, 11604. [Google Scholar] [CrossRef]
- Kyndt, E.; Govaerts, N.; Dochy, F.; Baert, H. The Learning Intention of Low-Qualified Employees: A Key for Participation in Lifelong Learning and Continuous Training. Vocat. Learn. 2011, 4, 211–229. [Google Scholar] [CrossRef]
- Dysvik, A.; Kuvaas, B. Perceived job autonomy and turnover intention: The moderating role of perceived supervisor support. Eur. J. Work. Organ. Psychol. 2013, 22, 563–573. [Google Scholar] [CrossRef] [Green Version]
- Puhakka, I.J.A.; Nokelainen, P.; Pylväs, L. Learning or Leaving? Individual and Environmental Factors Related to Job Satisfaction and Turnover Intention. Vocat. Learn. 2021, 14, 481–510. [Google Scholar] [CrossRef]
- Andresen, M.; Lazarova, M.; Apospori, E.; Cotton, R.; Bosak, J.; Dickmann, M.; Kaše, R.; Smale, A. Does international work experience pay off? The relationship between international work experience, employability and career success: A 30-country, multi-industry study. Hum. Resour. Manag. J. 2021, 32, 698–721. [Google Scholar] [CrossRef]
- Erebak, S.; Turgut, T. Anxiety about the speed of technological development: Effects on job insecurity, time estimation, and automation level preference. J. High Technol. Manag. Res. 2021, 32, 100419. [Google Scholar] [CrossRef]
- Mulas-Granados, C.; Varghese, R.; Boranova, V.; Dechalendar, A.; Wallenstein, J. Automation, Skills and the Future of Work. IMF Work. Pap. 2019. [Google Scholar] [CrossRef]
- Liu, W.; Xiang, S. The positive impact of guilt. Leadersh. Organ. Dev. J. 2018, 39, 883–898. [Google Scholar] [CrossRef]
- Bezuijen, X.M.; Dam, K.; Berg, P.T.; Thierry, H. How leaders stimulate employee learning: A leader-member exchange approach. J. Occup. Organ. Psychol. 2010, 83, 673–693. [Google Scholar] [CrossRef]
- Autor, D.H.; Dorn, D. The Growth of Low-Skill Service Jobs and the Polarization of the US Labor Market. Am. Econ. Rev. 2013, 103, 1553–1597. [Google Scholar] [CrossRef] [Green Version]
- de Vries, G.J.; Gentile, E.; Miroudot, S.; Wacker, K.M. The rise of robots and the fall of routine jobs. Labour Econ. 2020, 66, 101885. [Google Scholar] [CrossRef]
- Acemoglu, D.; Autor, D.; Hazell, J.; Restrepo, P. AI and Jobs: Evidence from Online Vacancies. NBER Work. Pap. 2020. [Google Scholar] [CrossRef]
- Marcolin, L.; Miroudot, S.; Squicciarini, M. To be (routine) or not to be (routine), that is the question: A cross-country task-based answer†. Ind. Corp. Change 2019, 28, 477–501. [Google Scholar] [CrossRef]
- Alesina, A.; Zhuravskaya, E. Segregation and the Quality of Government in a Cross Section of Countries. Am. Econ. Rev. 2011, 101, 1872–1911. [Google Scholar] [CrossRef] [Green Version]
- Cortes, P.; Pan, J. Cross-Country Evidence on the Relationship between Overwork and Skilled Women’s Job Choices. Am. Econ. Rev. 2017, 107, 105–109. [Google Scholar] [CrossRef] [Green Version]
- Cha, Y.; Weeden, K.A. Overwork and the Slow Convergence in the Gender Gap in Wages. Am. Sociol. Rev. 2014, 79, 457–484. [Google Scholar] [CrossRef] [Green Version]
- Zaitseva, E.; Levashenko, V.; Rabcan, J.; Krsak, E. Application of the Structure Function in the Evaluation of the Human Factor in Healthcare. Symmetry 2020, 12, 93. [Google Scholar] [CrossRef] [Green Version]
- Pan, X.; Lin, Y.; He, C. A Review of Cognitive Models in Human Reliability Analysis. Qual. Reliab. Eng. Int. 2016, 33, 1299–1316. [Google Scholar] [CrossRef]
Figure 1.
Theoretical framework and research design.

Figure 2.
Coefficient paths in penalized machine learning estimations.

Figure 3.
Placebo tests results. Notes: Sub-figures (a–f) depict kernel density curves of AI_placebo’s estimated coefficients and the corresponding p values in regressions of Columns (2)–(7) of Table 2, respectively.
Figure 3.
Placebo tests results. Notes: Sub-figures (a–f) depict kernel density curves of AI_placebo’s estimated coefficients and the corresponding p values in regressions of Columns (2)–(7) of Table 2, respectively.


Table 1.
Descriptive statistics.
| Variable | Description | Obs. | Mean | Std. Dev. | Min. | Max. |
|---|---|---|---|---|---|---|
| Dependent Variables | ||||||
| Further Learning | Frequency of on-the-job learning, 1–5 levels | 12,418 | 1.943 | 1.064 | 1 | 5 |
| Whe_Learning | Whether often participate in on-the-job learning | 12,418 | 0.282 | 0.450 | 0 | 1 |
| Explanatory Variables | ||||||
| AI | AI (unweighted index) | 12,418 | −0.473 | 1.333 | −6.190 | 4.235 |
| AI_weighted | AI (weighted index) | 12,418 | −0.474 | 1.348 | −6.190 | 4.235 |
| AI_median | AI (median index) | 12,418 | −0.474 | 1.345 | −6.190 | 4.235 |
| AI_max | AI (max index) | 12,418 | 0.113 | 1.618 | −6.190 | 6.100 |
| AI_2 | AI index subtracting the non-routine cognitive analytic and non-routine interpersonal intensity | 12,418 | −0.335 | 2.570 | −7.407 | 5.887 |
| AI_3 | AI_2 index subtracting the non-routine manual physical and non-routine manual interpersonal intensity | 12,262 | −0.382 | 2.905 | −7.976 | 6.221 |
| AI_Frey | Another AI index constructed by Frey and Osborne [25] | 12,085 | 0.634 | 0.312 | 0.004 | 0.990 |
| Control Variables | ||||||
| Demographic characteristics | ||||||
| Whether female | Yes = 1, No = 0 | 12,418 | 0.471 | 0.499 | 0 | 1 |
| Age | Age | 12,418 | 45.407 | 13.145 | 18 | 75 |
| Age_squared | Squared term of age | 12,418 | 2234.583 | 1219.794 | 324 | 5625 |
| Work characteristics | ||||||
| ln_Income | Logarithm of personal income (RMB) | 11,867 | 9.451 | 2.771 | 0 | 16.113 |
| Whether workingin-system | Yes = 1, No = 0 | 12,347 | 0.112 | 0.315 | 0 | 1 |
| Whether having pension | Yes = 1, No = 0 | 12,401 | 0.742 | 0.437 | 0 | 1 |
| Whether havingmedical insurance | Yes = 1, No = 0 | 12,412 | 0.934 | 0.248 | 0 | 1 |
| Human capital characteristics | ||||||
| Whether higher educated | Yes = 1, No = 0 | 12,414 | 0.139 | 0.345 | 0 | 1 |
| Whether healthy | Yes = 1, No = 0 | 12,414 | 0.633 | 0.482 | 0 | 1 |
| Social identity characteristics | ||||||
| Whether ethnic minorities | Yes = 1, No = 0 | 12,418 | 0.081 | 0.273 | 0 | 1 |
| Whether religious believer | Yes = 1, No = 0 | 12,418 | 0.095 | 0.293 | 0 | 1 |
| Whether CPC member | Yes = 1, No = 0 | 12,403 | 0.101 | 0.302 | 0 | 1 |
| Family characteristics | ||||||
| Whether married | Yes = 1, No = 0 | 12,418 | 0.825 | 0.380 | 0 | 1 |
| Number of children | Number of children | 12,418 | 1.515 | 1.035 | 0 | 10 |
| Family size | Number of family members | 12,418 | 2.940 | 1.424 | 1 | 12 |
| Year dummies | ||||||
| Province dummies | ||||||
Notes: Working in-system in China refers to having jobs in Communist Party of China organizations, governments, and state-owned corporations. Compared with out-system jobs, in-system jobs bring better social security and additional hidden benefits. Whether higher educated denotes whether the respondent has a college degree or higher.
Table 2.
Impacts of AI on on-the-job learning.
| Model | (1) OLS | (2) OLS | (3) OLS | (4) OLS | (5) OLS | (6) OLS | (7) OLS |
|---|---|---|---|---|---|---|---|
| Variable | Further Learning | Further Learning | Further Learning | Further Learning | Further Learning | Further Learning | Further Learning |
| AI | −0.085 *** (0.007) | −0.075 *** (0.007) | −0.060 *** (0.007) | −0.049 *** (0.007) | −0.048 *** (0.007) | −0.050 *** (0.007) | −0.050 *** (0.006) |
| Whether female | −0.139 *** (0.018) | −0.065 *** (0.018) | −0.074 *** (0.017) | −0.052 *** (0.017) | −0.038 ** (0.017) | −0.042 *** (0.016) | |
| Age | −0.038 *** (0.004) | −0.060 *** (0.004) | −0.038 *** (0.004) | −0.041 *** (0.004) | −0.033 *** (0.004) | −0.031 *** (0.004) | |
| Age_squared | 0.000 ** (0.000) | 0.000 *** (0.000) | 0.000 *** (0.000) | 0.000 *** (0.000) | 0.000 *** (0.000) | 0.000 *** (0.000) | |
| ln_Income | 0.063 *** (0.003) | 0.047 *** (0.003) | 0.044 *** (0.003) | 0.040 *** (0.003) | 0.030 *** (0.003) | ||
| Whether working in-system | 0.728 *** (0.032) | 0.481 *** (0.032) | 0.387 *** (0.033) | 0.373 *** (0.033) | 0.378 *** (0.032) | ||
| Whether having pension | 0.275 *** (0.020) | 0.184 *** (0.019) | 0.165 *** (0.019) | 0.157 *** (0.019) | 0.125 *** (0.020) | ||
| Whether having medical insurance | 0.125 *** (0.034) | 0.097 *** (0.033) | 0.080 ** (0.033) | 0.100 *** (0.033) | 0.125 *** (0.032) | ||
| Whether higher educated | 0.839 *** (0.030) | 0.736 *** (0.031) | 0.690 *** (0.031) | 0.601 *** (0.031) | |||
| Whether healthy | 0.110 *** (0.018) | 0.095 *** (0.018) | 0.092 *** (0.017) | 0.096 *** (0.017) | |||
| Whether ethnic minorities | −0.149 *** (0.031) | −0.131 *** (0.030) | −0.084 ** (0.036) | ||||
| Whether religious believer | 0.044 (0.030) | 0.069 ** (0.031) | 0.062 ** (0.031) | ||||
| Whether CPC member | 0.483 *** (0.035) | 0.483 *** (0.034) | 0.460 *** (0.034) | ||||
| Whether married | −0.004 (0.025) | −0.002 (0.025) | |||||
| Number of children | −0.129 *** (0.010) | −0.105 *** (0.010) | |||||
| Family size | −0.010 (0.006) | −0.004 (0.006) | |||||
| Time dummies | No | No | No | No | No | No | Yes |
| Province dummies | No | No | No | No | No | No | Yes |
| Constant | 1.902 *** (0.010) | 3.461 *** (0.096) | 2.814 *** (0.107) | 2.268 *** (0.103) | 2.410 *** (0.103) | 2.382 *** (0.106) | 2.701 *** (0.114) |
| Observations | 12,418 | 12,418 | 11,788 | 11,780 | 11,770 | 11,770 | 11,770 |
| Adjusted R2 | 0.011 | 0.138 | 0.239 | 0.298 | 0.315 | 0.327 | 0.351 |
Notes: ***, **, and * indicate significance at the levels of 1%, 5%, and 10%, respectively. The values in parentheses are standard errors robust to heteroskedasticity. Yes means the corresponding variables are controlled in the regression, while no means not controlled. Adjusted R2 is reported for linear models and pseudo R2 is reported for nonlinear models. The same applies to other tables below.
Table 3.
Robustness and endogeneity tests: using other AI measures.
| Model | (1) OLS | (2) OLS | (3) OLS | (4) OLS | (5) OLS | (6) OLS |
|---|---|---|---|---|---|---|
| Variable | Further Learning | Further Learning | Further Learning | Further Learning | Further Learning | Further Learning |
| AI_weighted | −0.049 *** (0.006) | |||||
| AI_median | −0.049 *** (0.006) | |||||
| AI_max | −0.045 *** (0.005) | |||||
| AI_2 | −0.046 *** (0.004) | |||||
| AI_3 | −0.034 *** (0.003) | |||||
| AI_Frey | −0.317 *** (0.030) | |||||
| Controls | Yes | Yes | Yes | Yes | Yes | Yes |
| Constant | 2.703 *** (0.114) | 2.703 *** (0.114) | 2.740 *** (0.114) | 2.738 *** (0.113) | 2.705 *** (0.114) | 2.926 *** (0.117) |
| Observations | 11,770 | 11,770 | 11,770 | 11,770 | 11,626 | 11,454 |
| Adjusted R2 | 0.351 | 0.351 | 0.351 | 0.358 | 0.355 | 0.351 |
Table 4.
Robustness and endogeneity tests: using the dummy measure of on-the-job learning (probit model).
Table 4.
Robustness and endogeneity tests: using the dummy measure of on-the-job learning (probit model).
| Model | (1) Probit | (2) Probit | (3) Probit | (4) Probit | (5) Probit | (6) Probit | (7) Probit |
|---|---|---|---|---|---|---|---|
| Variable | Whe_ Learning | Whe_ Learning | Whe_ Learning | Whe_ Learning | Whe_ Learning | Whe_ Learning | Whe_ Learning |
| AI | −0.095 *** (0.009) | −0.086 *** (0.009) | −0.074 *** (0.010) | −0.064 *** (0.010) | −0.064 *** (0.010) | −0.068 *** (0.010) | −0.067 *** (0.010) |
| Demographic characteristics | No | Yes | Yes | Yes | Yes | Yes | Yes |
| Work characteristics | No | No | Yes | Yes | Yes | Yes | Yes |
| Human capital characteristics | No | No | No | Yes | Yes | Yes | Yes |
| Social identity characteristics | No | No | No | No | Yes | Yes | Yes |
| Family characteristics | No | No | No | No | No | Yes | Yes |
| Time and province characteristics | No | No | No | No | No | No | Yes |
| Constant | −0.627 *** (0.013) | 0.722 *** (0.140) | 0.029 (0.170) | −0.477 *** (0.166) | −0.313 * (0.167) | −0.393 ** (0.179) | −0.002 (0.193) |
| Observations | 12,418 | 12,418 | 11,788 | 11,780 | 11,770 | 11,770 | 11,770 |
| Pseudo R2 | 0.008 | 0.087 | 0.161 | 0.200 | 0.213 | 0.223 | 0.243 |
Table 5.
Robustness and endogeneity tests: using the dummy measure of on-the-job learning (logit model).
Table 5.
Robustness and endogeneity tests: using the dummy measure of on-the-job learning (logit model).
| Model | (1) Logit | (2) Logit | (3) Logit | (4) Logit | (5) Logit | (6) Logit | (7) Logit |
|---|---|---|---|---|---|---|---|
| Variable | Whe_ Learning | Whe_ Learning | Whe_ Learning | Whe_ Learning | Whe_ Learning | Whe_ Learning | Whe_ Learning |
| AI | −0.161 *** (0.016) | −0.144 *** (0.016) | −0.123 *** (0.017) | −0.109 *** (0.017) | −0.109 *** (0.017) | −0.117 *** (0.017) | −0.116 *** (0.018) |
| Demographic characteristics | No | Yes | Yes | Yes | Yes | Yes | Yes |
| Work characteristics | No | No | Yes | Yes | Yes | Yes | Yes |
| Human capital characteristics | No | No | No | Yes | Yes | Yes | Yes |
| Social identity characteristics | No | No | No | No | Yes | Yes | Yes |
| Family characteristics | No | No | No | No | No | Yes | Yes |
| Time and province characteristics | No | No | No | No | No | No | Yes |
| Constant | −1.021 *** (0.022) | 0.938 *** (0.241) | −0.377 (0.331) | −1.000 *** (0.299) | −0.702 ** (0.298) | −0.931 *** (0.319) | −0.285 (0.342) |
| Observations | 12,418 | 12,418 | 11,788 | 11,780 | 11,770 | 11,770 | 11,770 |
| Pseudo R2 | 0.008 | 0.087 | 0.162 | 0.199 | 0.213 | 0.223 | 0.242 |
Table 6.
Robustness and endogeneity tests: using ordered response models (ordered probit model).
| Model | (1) Oprobit | (2) Oprobit | (3) Oprobit | (4) Oprobit | (5) Oprobit | (6) Oprobit | (7) Oprobit |
|---|---|---|---|---|---|---|---|
| Variable | Further Learning | Further Learning | Further Learning | Further Learning | Further Learning | Further Learning | Further Learning |
| AI | −0.085 *** (0.007) | −0.077 *** (0.008) | −0.065 *** (0.008) | −0.055 *** (0.008) | −0.055 *** (0.008) | −0.060 *** (0.008) | −0.060 *** (0.008) |
| Demographic characteristics | No | Yes | Yes | Yes | Yes | Yes | Yes |
| Work characteristics | No | No | Yes | Yes | Yes | Yes | Yes |
| Human capital characteristics | No | No | No | Yes | Yes | Yes | Yes |
| Social identity characteristics | No | No | No | No | Yes | Yes | Yes |
| Family characteristics | No | No | No | No | No | Yes | Yes |
| Time and province characteristics | No | No | No | No | No | No | Yes |
| Observations | 12,418 | 12,418 | 11,788 | 11,780 | 11,770 | 11,770 | 11,770 |
| Pseudo R2 | 0.004 | 0.063 | 0.109 | 0.129 | 0.138 | 0.145 | 0.161 |
Table 7.
Robustness and endogeneity tests: using ordered response models (ordered logit model).
| Model | (1) Ologit | (2) Ologit | (3) Ologit | (4) Ologit | (5) Ologit | (6) Ologit | (7) Ologit |
|---|---|---|---|---|---|---|---|
| Variable | Further Learning | Further Learning | Further Learning | Further Learning | Further Learning | Further Learning | Further Learning |
| AI | −0.140 *** (0.013) | −0.128 *** (0.013) | −0.110 *** (0.013) | −0.094 *** (0.013) | −0.094 *** (0.013) | −0.101 *** (0.014) | −0.103 *** (0.014) |
| Demographic characteristics | No | Yes | Yes | Yes | Yes | Yes | Yes |
| Work characteristics | No | No | Yes | Yes | Yes | Yes | Yes |
| Human capital characteristics | No | No | No | Yes | Yes | Yes | Yes |
| Social identity characteristics | No | No | No | No | Yes | Yes | Yes |
| Family characteristics | No | No | No | No | No | Yes | Yes |
| Time and province characteristics | No | No | No | No | No | No | Yes |
| Observations | 12,418 | 12,418 | 11,788 | 11,780 | 11,770 | 11,770 | 11,770 |
| Pseudo R2 | 0.004 | 0.067 | 0.113 | 0.134 | 0.143 | 0.150 | 0.166 |
Table 8.
Robustness and endogeneity tests: instrumental variable regressions.
| Model | (1) First Stage | (2) 2SLS Second Stage | (3) LIML Second Stage | (4) GMM Second Stage | (5) IGMM Second Stage |
|---|---|---|---|---|---|
| Variable | AI | Further Learning | Further Learning | Further Learning | Further Learning |
| RII | 0.806 *** (0.016) | ||||
| AI | −0.227 *** (0.017) | −0.227 *** (0.017) | −0.227 *** (0.017) | −0.227 *** (0.017) | |
| Controls | Yes | Yes | Yes | Yes | Yes |
| Constant | −1.023 *** (0.155) | 2.776 *** (0.117) | 2.776 ***(0.117) | 2.776 *** (0.117) | 2.776 *** (0.117) |
| Observations | 11,780 | 11,770 | 11,770 | 11,770 | 11,770 |
| Adjusted R2 | 0.191 | 0.305 | 0.305 | 0.305 | 0.305 |
Table 9.
Robustness and endogeneity tests: explanatory power of AI.
| Model | (1) Lasso (10-Fold CV) | (2) Lasso (20-Fold CV) | (3) Ridge (10-Fold CV) | (4) Ridge (20-Fold CV) | (5) Elastic Net (10-Fold CV) | (6) Elastic Net (20-Fold CV) |
|---|---|---|---|---|---|---|
| Variable | Further Learning | Further Learning | Further Learning | Further Learning | Further Learning | Further Learning |
| AI | −0.0493 | −0.0492 | −0.0475 | −0.0475 | −0.0493 | −0.0492 |
| Number of non-zero coefficients | 44 | 44 | 46 | 46 | 44 | 44 |
| Out-of-sample R2 | 0.3475 | 0.3481 | 0.3464 | 0.3470 | 0.3475 | 0.3481 |
| 0.00025 | 0.00039 | 0.04643 | 0.04643 | 0.00025 | 0.00039 | |
| 1 | 1 | |||||
| Observations | 11,770 | 11,770 | 11,770 | 11,770 | 11,770 | 11,770 |
Table 10.
Future expectation mechanism analysis.
| Model | (1) 2SLS | (2) 2SLS | (3) 2SLS | (4) 2SLS | (5) 2SLS |
|---|---|---|---|---|---|
| Variable | Further Learning | Optimism about Future | Further Learning | Anticipated Social Status | Further Learning |
| AI | −0.227 *** (0.017) | −0.075 ** (0.030) | −0.211 *** (0.044) | −0.279 *** (0.033) | −0.211 *** (0.017) |
| Optimismabout future | 0.080 *** (0.029) | ||||
| Anticipated social status | 0.056 *** (0.005) | ||||
| Controls | Yes | Yes | Yes | Yes | Yes |
| Constant | 2.776 *** (0.117) | 3.937 *** (0.242) | 2.130 *** (0.327) | 6.636 *** (0.239) | 2.420 *** (0.123) |
| Observations | 11,770 | 1864 | 1864 | 11,253 | 11,253 |
| Adjusted R2 | 0.302 | 0.045 | 0.287 | 0.129 | 0.321 |
Table 11.
Economic income mechanism analysis.
| Model | (1) 2SLS | (2) 2SLS | (3) 2SLS | (4) 2SLS | (5) 2SLS |
|---|---|---|---|---|---|
| Variable | Further Learning | Personal Income | Further Learning | Family Income | Further Learning |
| AI | −0.230 *** (0.017) | −0.125 *** (0.036) | −0.227 *** (0.017) | −0.136 *** (0.022) | −0.217 *** (0.018) |
| Personal Income | 0.023 *** (0.003) | ||||
| Family Income | 0.057 *** (0.006) | ||||
| Other controls | Yes | Yes | Yes | Yes | Yes |
| Constant | 2.956 *** (0.113) | 7.714 *** (0.342) | 2.776 *** (0.117) | 10.142 *** (0.201) | 2.426 *** (0.135) |
| Observations | 11,770 | 11,770 | 11,770 | 11,356 | 11,356 |
| Adjusted R2 | 0.298 | 0.227 | 0.302 | 0.302 | 0.308 |
Notes: other controls in this table refer to control variables excluding ln_Income.
Table 12.
Working time mechanism analysis.
| Model | (1) 2SLS | (2) 2SLS | (3) 2SLS | (4) IV Probit | (5) 2SLS |
|---|---|---|---|---|---|
| Variable | Further Learning | Working Hours | Further Learning | Whether Overwork | Further Learning |
| AI | −0.227 *** (0.017) | 3.087 *** (0.312) | −0.220 *** (0.017) | 0.155 *** (0.021) | −0.210 *** (0.017) |
| Working hours | −0.003 *** (0.000) | ||||
| Whether overwork | −0.152 *** | ||||
| (0.018) | |||||
| Controls | Yes | Yes | Yes | Yes | Yes |
| Constant | 2.776 *** (0.117) | 21.161 *** (2.732) | 2.820 *** (0.117) | −1.531 *** (0.168) | 2.755 *** (0.117) |
| Observations | 11,770 | 11,673 | 11,673 | 11,673 | 11,673 |
| Adjusted R2 | 0.302 | 0.070 | 0.309 | . | 0.310 |
Table 13.
Heterogeneities in terms of demographic characteristics (2SLS).
| Sample | (1) Older than 45 | (2) Younger than 45 | (3) Men | (4) Women | (5) Lower Education Levels | (6) Higher Education Levels |
|---|---|---|---|---|---|---|
| Variable | Further Learning | Further Learning | Further Learning | Further Learning | Further Learning | Further Learning |
| AI | −0.258 *** (0.032) | −0.206 *** (0.020) | −0.219 *** (0.023) | −0.240 *** (0.027) | −0.225 *** (0.019) | −0.192 *** (0.039) |
| Controls | Yes | Yes | Yes | Yes | Yes | Yes |
| Constant | 1.655 *** (0.100) | 2.017 *** (0.094) | 2.350 *** (0.163) | 3.151 *** (0.165) | 2.930 *** (0.128) | 3.255 *** (0.435) |
| Observations | 6001 | 5769 | 6269 | 5501 | 10,162 | 1608 |
| Adjusted R2 | 0.234 | 0.237 | 0.267 | 0.351 | 0.173 | 0.023 |
Table 14.
Heterogeneities in terms of working characteristics (2SLS).
| Sample | (1) Not Having Labor Contracts | (2) Having Labor Contracts | (3) Lower Autonomy | (4) Higher Autonomy | (5) Less Working Experience | (6) More Working Experience |
|---|---|---|---|---|---|---|
| Variable | Further Learning | Further Learning | Further Learning | Further Learning | Further Learning | Further Learning |
| AI | −0.276 *** (0.032) | −0.192 *** (0.021) | −0.291 *** (0.034) | −0.220 *** (0.025) | −0.228 *** (0.022) | −0.212 *** (0.029) |
| Controls | Yes | Yes | Yes | Yes | Yes | Yes |
| Constant | 2.822 *** (0.186) | 2.136 *** (0.211) | 2.913 *** (0.273) | 2.747 *** (0.133) | 3.112 *** (0.129) | 0.669 (0.454) |
| Observations | 6790 | 4919 | 2300 | 9455 | 8605 | 2816 |
| Adjusted R2 | 0.235 | 0.154 | 0.235 | 0.314 | 0.339 | 0.166 |
Table 15.
Regional heterogeneities (2SLS).
| Sample | (1) Low-Technology Regions | (2) High-Technology Regions | (3) Regions with Fewer Labor Disputes | (4) Regions with More Labor Disputes | (5) Regions with Lower Unemployment Rate | (6) Regions with Higher Unemployment Rate |
|---|---|---|---|---|---|---|
| Variable | Further Learning | Further Learning | Further Learning | Further Learning | Further Learning | Further Learning |
| AI | −0.161 *** (0.035) | −0.244 *** (0.020) | −0.162 *** (0.034) | −0.244 *** (0.020) | −0.222 *** (0.025) | −0.233 *** (0.024) |
| Controls | Yes | Yes | Yes | Yes | Yes | Yes |
| Constant | 2.667 *** (0.182) | 2.614 *** (0.144) | 2.375 *** (0.193) | 2.774 *** (0.141) | 2.587 *** (0.190) | 2.727 *** (0.160) |
| Observations | 4110 | 7660 | 3857 | 7913 | 5569 | 6201 |
| Adjusted R2 | 0.307 | 0.284 | 0.295 | 0.302 | 0.308 | 0.297 |
Disclaimer/Publisher’s Note: The statements, opinions and data contained in all publications are solely those of the individual author(s) and contributor(s) and not of MDPI and/or the editor(s). MDPI and/or the editor(s) disclaim responsibility for any injury to people or property resulting from any ideas, methods, instructions or products referred to in the content. |
© 2023 by the authors. Licensee MDPI, Basel, Switzerland. This article is an open access article distributed under the terms and conditions of the Creative Commons Attribution (CC BY) license (https://creativecommons.org/licenses/by/4.0/).
Share and Cite
MDPI and ACS Style
Li, C.; Zhang, Y.; Niu, X.; Chen, F.; Zhou, H. Does Artificial Intelligence Promote or Inhibit On-the-Job Learning? Human Reactions to AI at Work. Systems 2023, 11, 114. https://doi.org/10.3390/systems11030114
AMA Style
Li C, Zhang Y, Niu X, Chen F, Zhou H. Does Artificial Intelligence Promote or Inhibit On-the-Job Learning? Human Reactions to AI at Work. Systems. 2023; 11(3):114. https://doi.org/10.3390/systems11030114
Chicago/Turabian StyleLi, Chao, Yuhan Zhang, Xiaoru Niu, Feier Chen, and Hongyan Zhou. 2023. "Does Artificial Intelligence Promote or Inhibit On-the-Job Learning? Human Reactions to AI at Work" Systems 11, no. 3: 114. https://doi.org/10.3390/systems11030114
Note that from the first issue of 2016, this journal uses article numbers instead of page numbers. See further details here.