1. Introduction
Monitoring the overall status of patients on a daily basis has become a very important key point in the field of healthcare due to the fact that patients cannot stay under long-term monitoring in Intensive Care Units (ICU), which is limited to cases of serious health problems. Therefore, another solution is to use the capabilities of IT in order to come up with much easier ways to automate such tasks and alert doctors in cases of the detection of any deterioration in the health status of their patients. Telemedicine is a good solution for this, as it provides the ability to share the actual health status of patients using a shared online service between doctors and patients, which shares immediate data related to different human bio-signals that could be collected using either small non-invasive sensors, such as pulse meters, pulse belts, ECG single-channel/multi-channel sensors and even body temperature sensors, or minimal-invasive sensors, such as instant blood glucose sensors or continuous blood glucose sensors that perform Continuous Glucose Monitoring (CGM).
ECG is a very important parameter for detecting human bio-signals as it might reflect both the normal sinus rhythm of the heart as well as many heart problems that are usually very critical to human life. By monitoring human ECG, we can detect many kinds of heart problems/failures, such as Premature Atrial Contractions (PAC), also called atrial premature complex (APC), Premature Ventricular Contractions (PVC), Sick Sinus Syndrome (Bradycardia, Tachycardia), or Sinus Arrest. PAC [
1] is described as an extra heartbeat starting in the upper chamber of the human heart, where it could be felt as a skipped beat if the heart contains less blood at that moment, or is felt as an extra heartbeat if the heart contains a lot of blood at the moment of this beat. PVC [
2] is described as a very early heartbeat in the ventricles, which follows a normal beat and causes a small pause in the heart and then a strong heartbeat due to the amount of blood that was collected in the heart during the pause. A “normal sinus rhythm” will result in a normal pulse ranging from 60 bpm to 100 bpm; however, the “Sick Sinus Syndrome” [
3] is basically described as an abnormal sinus rhythm, which could be a “Bradycardia” that presents a slow sinus rhythm (pulse is less than 60 bpm) or a “Tachycardia” that presents a fast sinus rhythm (pulse is higher than 100 bpm). Sinus Arrest/Pause is a pause in the heart’s sinus rhythm, presented as a slightly longer time period between two sequential heartbeats.
From the previous explanation, we can see that these are the most relevant sinus rhythms for this study. We can extract seven different signal types, with different ECG shapes for each one of them. The different shapes are explained by the following characteristics:
Normal sinus rhythm in a normal healthy person would result in a normal pulse rate of a value of 60–100 bpm. Each beat has a normal shape in the PQRST complex;
PAC, which might not affect the pulse rate but will affect the sinus rhythm by causing an early heartbeat generated in the upper part of the heart (Atrial) followed by a small pause of the sinus rhythm. It has a normal ECG shape in the PQRST complex, but occurs earlier than usual, so that the time period between the “P” peak of this beat and the “T” peak of the previous beat is almost null;
PVC shape 1, which is an extra heartbeat generated in the lower part of the heart (ventricle) and disrupts the normal heartbeat generated in the upper part. This will result in a different shape, whereby the peaks “P” and “T” are missing, and a wide QRS complex;
PVC shape 2, which is the same as the previous but is different only in the shape;
Sinus Arrest, which is a pause in the sinus rhythm, meaning that we can detect a slightly longer time period between two beats, and this could have a big influence on the pulse if the pause is repeated;
Sick Sinus Syndrome (Bradycardia), which is a slow sinus rhythm and will result in a pulse of less than 60 bpm. The shape of the PQRST complex is normal;
Sick Sinus Syndrome (Tachycardia), which is a fast sinus rhythm and will result in a pulse of more than 100 bpm. The shape of the PQRST complex is normal.
As the digitalized ECG values are presented as a signal, we are able to use different signal processing approaches to analyze the ECG signal. The main idea here is that we are interested in detecting the different peaks of a heartbeat from the whole ECG signal. To do so, we need to first split every beat; then we are able to train a model in order to predict the type of every beat. The first step in splitting the beats is calculating the discrete derivative of the ECG signal function, then checking the points where the derivative changes its sign in order to find the “R” peaks. Finally, we split the heartbeats in connection with the sampling rate (or the measurement frequency) of the used sensor.
After splitting the heartbeats, we use so-called Autoencoders in order to detect if a given ECG signal of a heartbeat is normal or abnormal. The Autoencoder will provide a reconstructed version of the formal shape of a normal sinus rhythm in an ECG signal. After determining that a given heartbeat is abnormal, we perform the next step to predict the type of abnormal ECG signal according to the known characteristics of heart problems. Any failure in detecting the shape of the ECG signal could mean that the given signal presents another heart problem, and this is alerted to doctors for manual assessment.
Autoencoders are often used for noise reduction in images [
4], human bio-signals such as the ECG [
5,
6], and even for speech signals [
7], but they are here used to train a model for abnormal ECG arrhythmia detection by comparing the test data to the reconstructed ECG signal. The training is performed using the MIT-BIH database, the St Petersburg INCART 12-lead Arrhythmia Database, and the Long-Term Atrial Fibrillation (AF) Database (LTAFDB). The prediction result is further assessed by calculating the error value between every heartbeat and the reconstructed ECG signal. The error is introduced by the area surface between the heartbeat and the reconstructed ECG signal, whereas, in this case, it is the cumulative absolute value of the difference between these two signals for all consecutive values of one heartbeat.
In this paper, we propose a novel algorithm for ECG pre-annotation and beat-to-beat separation for heartbeat classification using Autoencoders. The solution and workflow are proposed for no-noise and noise-based ECG signals, where the noisy ECG signal mostly comes from stream-like ECG sensors. In the pre-annotation process, we aim to detect the R peaks in order to use them to separate the heartbeats, and make the prediction later using the trained Autoencoder models. First, we get the first discrete derivative of the original signal, calculated as the difference between all consecutive values of the data. Second, we calculate the threshold based on the maximum value of the discrete derivative. Finally, we determine which represents the R peaks.
The novelty of our research is our use of Autoencoders to learn the formal shape of a normal heartbeat ECG curve, reconstruct its shape, and then compare it to any input signal in order to check the similarity between the two input signals and thus predict if it is a normal or abnormal heartbeat, using the auto-calculated threshold derived from the training process. Therefore, we first had to develop a preprocessing block to perform the pre-annotation based on the first discrete derivative of the input signal, calculated as the difference between every two consecutive values of the signal, and then detect the spots where this derivative changes its polarity and has a big value of change in a small time period. The change should be bigger than the threshold calculated automatically based on the input signal, where these detected spots present the R peaks of the different heartbeats. These annotations are used to split the heartbeats based on the sensor sampling rate. The different heartbeats are then assessed using the trained Autoencoder model to detect normal or abnormal beats. If any arrhythmia is detected in any of these beats, the given heartbeat is checked again with the very same process, but using another Autoencoder model trained to detect anomalies such as different shapes of PVC heartbeats. The same process is used to detect other types of arrhythmias.
In the
Section 3, we introduce the background of similar attempts using automated ECG annotation tools. In the
Section 4, we start by introducing heart problems, which helps us to understand the patterns of these heart issues; then, we give a deep explanation of the proposed algorithm.
Section 5 gives a brief introduction of the achieved results, followed by a discussion, and finally, we summarize the technical contributions of our paper compared to other existing solutions.
3. Related Work
Many attempts have been made to provide automated solutions to detect deteriorations in patients by detecting different types of abnormalities in human bio-signals. In the case of human ECG signals, some research has been undertaken to provide annotated ECG databases that will enable researchers to then further improve the manual annotations, detect important spots in the signals, such as the QRS complex of the ECG signal, or to find the RR intervals between different heartbeats. Other types of research include the use of machine learning techniques and trained models to automatically detect the different peaks or the key points of an ECG signal (PQRST peaks). Furthermore, other advanced research has been undertaken to enable patient monitoring with noisy signals, or even to provide a real-time solution to enable the real-time monitoring of patients in all types of daily activities. In this section, we provide a good description of the related work, assessing all the different contributions made by researchers in this field.
PhysioBank, PhysioToolkit, and PhysioNet [
8] are the three main components of a research solution that enables researchers to save, archive, or reuse complex physiologic signals in the PhysioBank, using the libraries of PhysioToolkit and visualizing using PhysioNet. The MIT-BIH Arrhythmia Database [
9] was the first standard test material available for researchers to undertake further research on the usage of automated solutions for patient monitoring. The St Petersburg INCART 12-lead Arrhythmia Database [
10] is a 12-lead ECG database of heart ECG arrhythmia records presented and contributed by the St. Petersburg Institute of Cardiological Technics (Incart). The Long-Term Atrial Fibrillation (AF) Database [
11] is another ECG database available online that provides 84 long-term ECG signals of patients with paroxysmal or sustained atrial fibrillation. Moreover, the Chinese Cardiovascular Disease Database (CCDD or CCD database) [
12] was developed to provide a wide set of improved technical parameters of raw ECG data.
Some attempts have been made to automate the annotation process of these ECG signal recordings and/or those from many other databases that are available online. A cascaded classification system is provided in [
13] for multi-lead ECG signals based on feature fusion to improve the performance of ECG signal classification on a beat-to-beat basis. In this research, ten different features were selected and used to train the model separately on the 12 different leads of the ECG input signal. Furthermore, these ten features were fused together in a novel feature fusion method to implement the cascaded classifier using multilayer perceptron (MLP) and random forest (RF). A new single lead delineator [
14] was developed based on phasor transform by converting every ECG sample into a phasor that can easily manage P and T peaks with low amplitude compared to the R peak; this research used many different online databases and reached 99.81% detection accuracy for the QRS complex, with a maximum localization error of 6 milliseconds between the automated and the manual annotation.
A convolutional neural network (CNN) model was trained in [
15] using PhysioNet databases for ECG annotation of P waves, QRS complexes, T waves, noise signals, and inter-beat ECG segments. This research was performed as the basis for proposing a classification system of normal or abnormal cardiac rhythms. Signal features were extracted for NSR, AF, alternative rhythm and noisy signals. This research achieved a 98% positive detection rate in the manual annotation of R peaks in the QT database, and a 99% positive predictive value. However, the positive detection rate of the P and T peaks reached 92% and 88%, respectively. A semi-automated solution was introduced in [
16] based on the PhysioNet LightWAVE visualization tool to extend its capabilities for ECG peak annotation. This solution is referred to as semi-automated because it can produce automated annotations, but will require manual annotation by specialists in cases of low detection confidence compared to a threshold.
A novel algorithm was presented in [
17] to enable the real-time detection of heart rate and the annotation of heart-beats in multi-model data that consist of the ECG signal together with the blood pressure signals. This latter is used to detect heartbeat annotations if the ECG signal is unavailable, distorted, or very noisy. As part of the PhysioNet/CinC Challenge 2017, the authors of [
18] presented an automated algorithm that classifies atrial fibrillation (AF), normal sinus rhythm (NSR), and noisy signals in short and single-channel ECG records. Another method was used to combine two different methods for a better onset prediction of atrial fibrillation using the variability of ECG signals [
19], and the final prediction rate reached 90%; the first method involved the analysis of the ECG signal’s heart rate variability (HRV), while the second method is based on the ECG signal’s morphologic variability (MV). Furthermore, a system [
20] was implemented to perform the automated annotation of different specific peaks of the ECG signal, as well as the rhythm of the heartbeats, by diagnosing and detecting significant changes in the ECG signal.
In the case of ambulatory ECG devices, the results obtained in [
21] show that this is a good starting point, and is suitable to include in next-generation wearable devices or sensors. This research involves the use of a reliability index that is assigned to ECG segments in order to assess the reliability of heart rate signals retrieved from ambulatory ECG sensors or devices. The proposed method was validated on 1500 manually annotated samples of ECG signals with different sampling rates taken from other studies. Another study was undertaken in [
22] to provide a filtering and classification tool for ECG signals in free-living or so-called non-supervised environments. An integral–coefficient–band-stop (ICBS) filter and two-layered Hidden Markov Models (HMMs) are used to firstly remove the time-consuming floating-point processes and then perform the feature extraction and classification of the input signals into the normal or one of the two abnormal ECG signals (either APC or PVC).
Other research was performed in [
23] to provide decision support or a decision-making system to diagnose coronary heart disease caused by plaque in the walls of heart arteries. This research involves the implementation and comparison of seven different algorithms that are used for the baseline removal of the ECG signal. The compared algorithms involve the use of different approaches and methods, such as adaptive filters, linear digital filters, polynomial-based approaches, multi-resolution analysis, and curve fitting. The comparison was made according to the manual annotation of ST segments in many ST segment deviation records of the European Society of Cardiology (ESC) ST-T database. This research shows that the results obtained from the use of a “Wavelet Adaptive Filter” for baseline removal were the closest to the ground-truth manual annotations. Another study [
24] combined the analysis of ECG signals and motion activity to diagnose coronary heart disease. The research involves the detection of the ST segments of ECG signals together with the motion activity, represented by the heart rate signal. The method is trained and simulated using the Long-Term ST Database, which includes in its annotation whether the specific patient has a coronary heart disease, and achieves an accuracy of 80%.
Other studies used wavelet transform to detect the R peaks, such as in [
25], where the authors introduced a supervised learning algorithm that is able to automatically detect the scales of the used training database using a small dataset with manual annotations made by physicians. The selected scales are applied to the whole ECG signal in order to annotate the R peaks. Furthermore, the wavelet transform technique was used to analyze ECG data compression in [
26] by looking for redundancy in the ECG signal and trying to find an optimal compression method based on a strategy specifically designed for ECG signals. In addition to this research, an automated solution [
27] was developed and tested to detect pediatric ventricular pre-excitation (VPE) with a trained classifier based on decision trees, where the positive prediction value reached 88%. Furthermore, a novel real-time classifier for normal human cardiac behavior detection was proposed in [
28]. This classifier is used to profile different cardiac behaviors in different patients, and even for different physical conditions for the same patient.
The applied research did not focus only on classifying ECG heartbeats, but also on detecting the quality of the ECG signal. The research in [
29] was based on a tree classifier that classifies the ECG signal into four different classes, ranging from high quality signal to electrode shedding with serious noise.
Furthermore, it is worth noting that the annotation of ECG is used in other research related to seismocardiography (SCG), such as in [
30], where the authors collected ECG and SCG data from 18 participants subjected to lower negative body pressure and the corresponding manual ECG annotation of R peaks, and then automatically annotated the SCG. The results of comparing the manual isovolumic moment timings and the automated results of the algorithm look promising. Another research [
31] introduced a novel algorithm for the use of micro-electro-mechanical system (MEMS) accelerometers in the automated annotation of seismocardiographic (SCG) recordings for patients in a resting state, achieving a 96.9% detection rate of isovolumic moment (IM) peaks and a 95.6% rate for aortic valve closure (AC) peaks.
In the previous research presented in the literature, many problems have been detected regarding ECG monitoring, such as the problems related to the digitalization and storage of stream-like long ECG recordings that are collected from long-term ambulatory sensors or devices [
32]. A framework and a real solution for all the steps involved in ECG monitoring, from data collection from single-channel ECG sensors and digitalization to data storing, were introduced in [
33]. Furthermore, we have presented a new enhanced version of the Health Level Seven International (HL7) Fast Healthcare Interoperability Resources (FHIR) data format, named HL7-aECG. The new enhanced version, published in [
34], serves to improve the ability to store stream-like ECG data, which we have reviewed previously. Finally, one of the most important problems when dealing with digital ECG data regards the interoperability issues between different data formats or standards; therefore, we introduced a conversion tool in [
35] that uses an intermediate flexible data format in order to enable data transfer between different standards, via mapping all data of different standards to an intermediate data format. This was applied to conversion between digitized ECG signals. On the other hand, the conversion from paper-based to digitized ECG signals is a difficult task; however, a morphological method was presented in [
36] introducing a new conversion process that separates the background noise from the input paper-based signal and provides it in a digital format in the corresponding ECG signal.
The novelty of our research lies in the use of Autoencoders, not for signal noise reduction, but to learn the shape of a normal heartbeat ECG curve, reconstructing its formal shape, and then comparing it to any input signal in order to extract a similarity approximation between the two signals, then predicting its normality vs. abnormality status compared to the threshold auto-calculated in the training process. To do so, we first had to develop a pre-annotation solution based on the first discrete derivative of the input signal, calculated as the difference between each two consecutive values of the signal, and then detect the spots where this derivative shows a large change value (above a given threshold calculated automatically based on the input signal) in a small time period. These spots present the R peaks of the different heartbeats, and these annotations are used to split the heartbeats based on the frequency of the sensor sampling rate. The different heartbeats are then predicted using the trained Autoencoder model to identify normal or abnormal beats. If any arrhythmia is detected in any of these beats, then the given heartbeat is predicted again with the very same process using another Autoencoder model, trained to detect anomalies such as a PVC heartbeat. The same process is used to detect other types of arrhythmias.
4. Heart Arrhythmia and Proposed Algorithm
Before describing the details about the proposed algorithm, it is necessary to give brief overview of the different problems related to heart rhythm in order to better understand the process of the novel algorithm. The heart problems presented in the
Section 1 of the Introduction will be explained, and an example is presented for each type of arrhythmia.
4.1. Heart Arrhythmia Problems
4.1.1. Premature Contractions
Premature Contractions are heartbeats that are generated either in the atrial or the ventricle. The type generated in the atrial are referred to as Premature Atrial Contractions (PAC), whereas those generated in the ventricle are called Premature Ventricular Contractions (PVC). PAC and PVC have different ECG signal shapes, and it is also important to mention that the PVC exhibits two differently shape ECG signals.
PAC [
1] is an extra heartbeat that is generated in one of the two upper chambers (atrial) of the human heart, and it could be felt by the patient as a skipped beat if the heart contains less blood at that moment, or as an extra heartbeat if the heart contains more blood at the moment of this beat. This will result in a heartbeat that looks the same as a normal heartbeat, but with a small RR interval between the affected heartbeat and its predecessor.
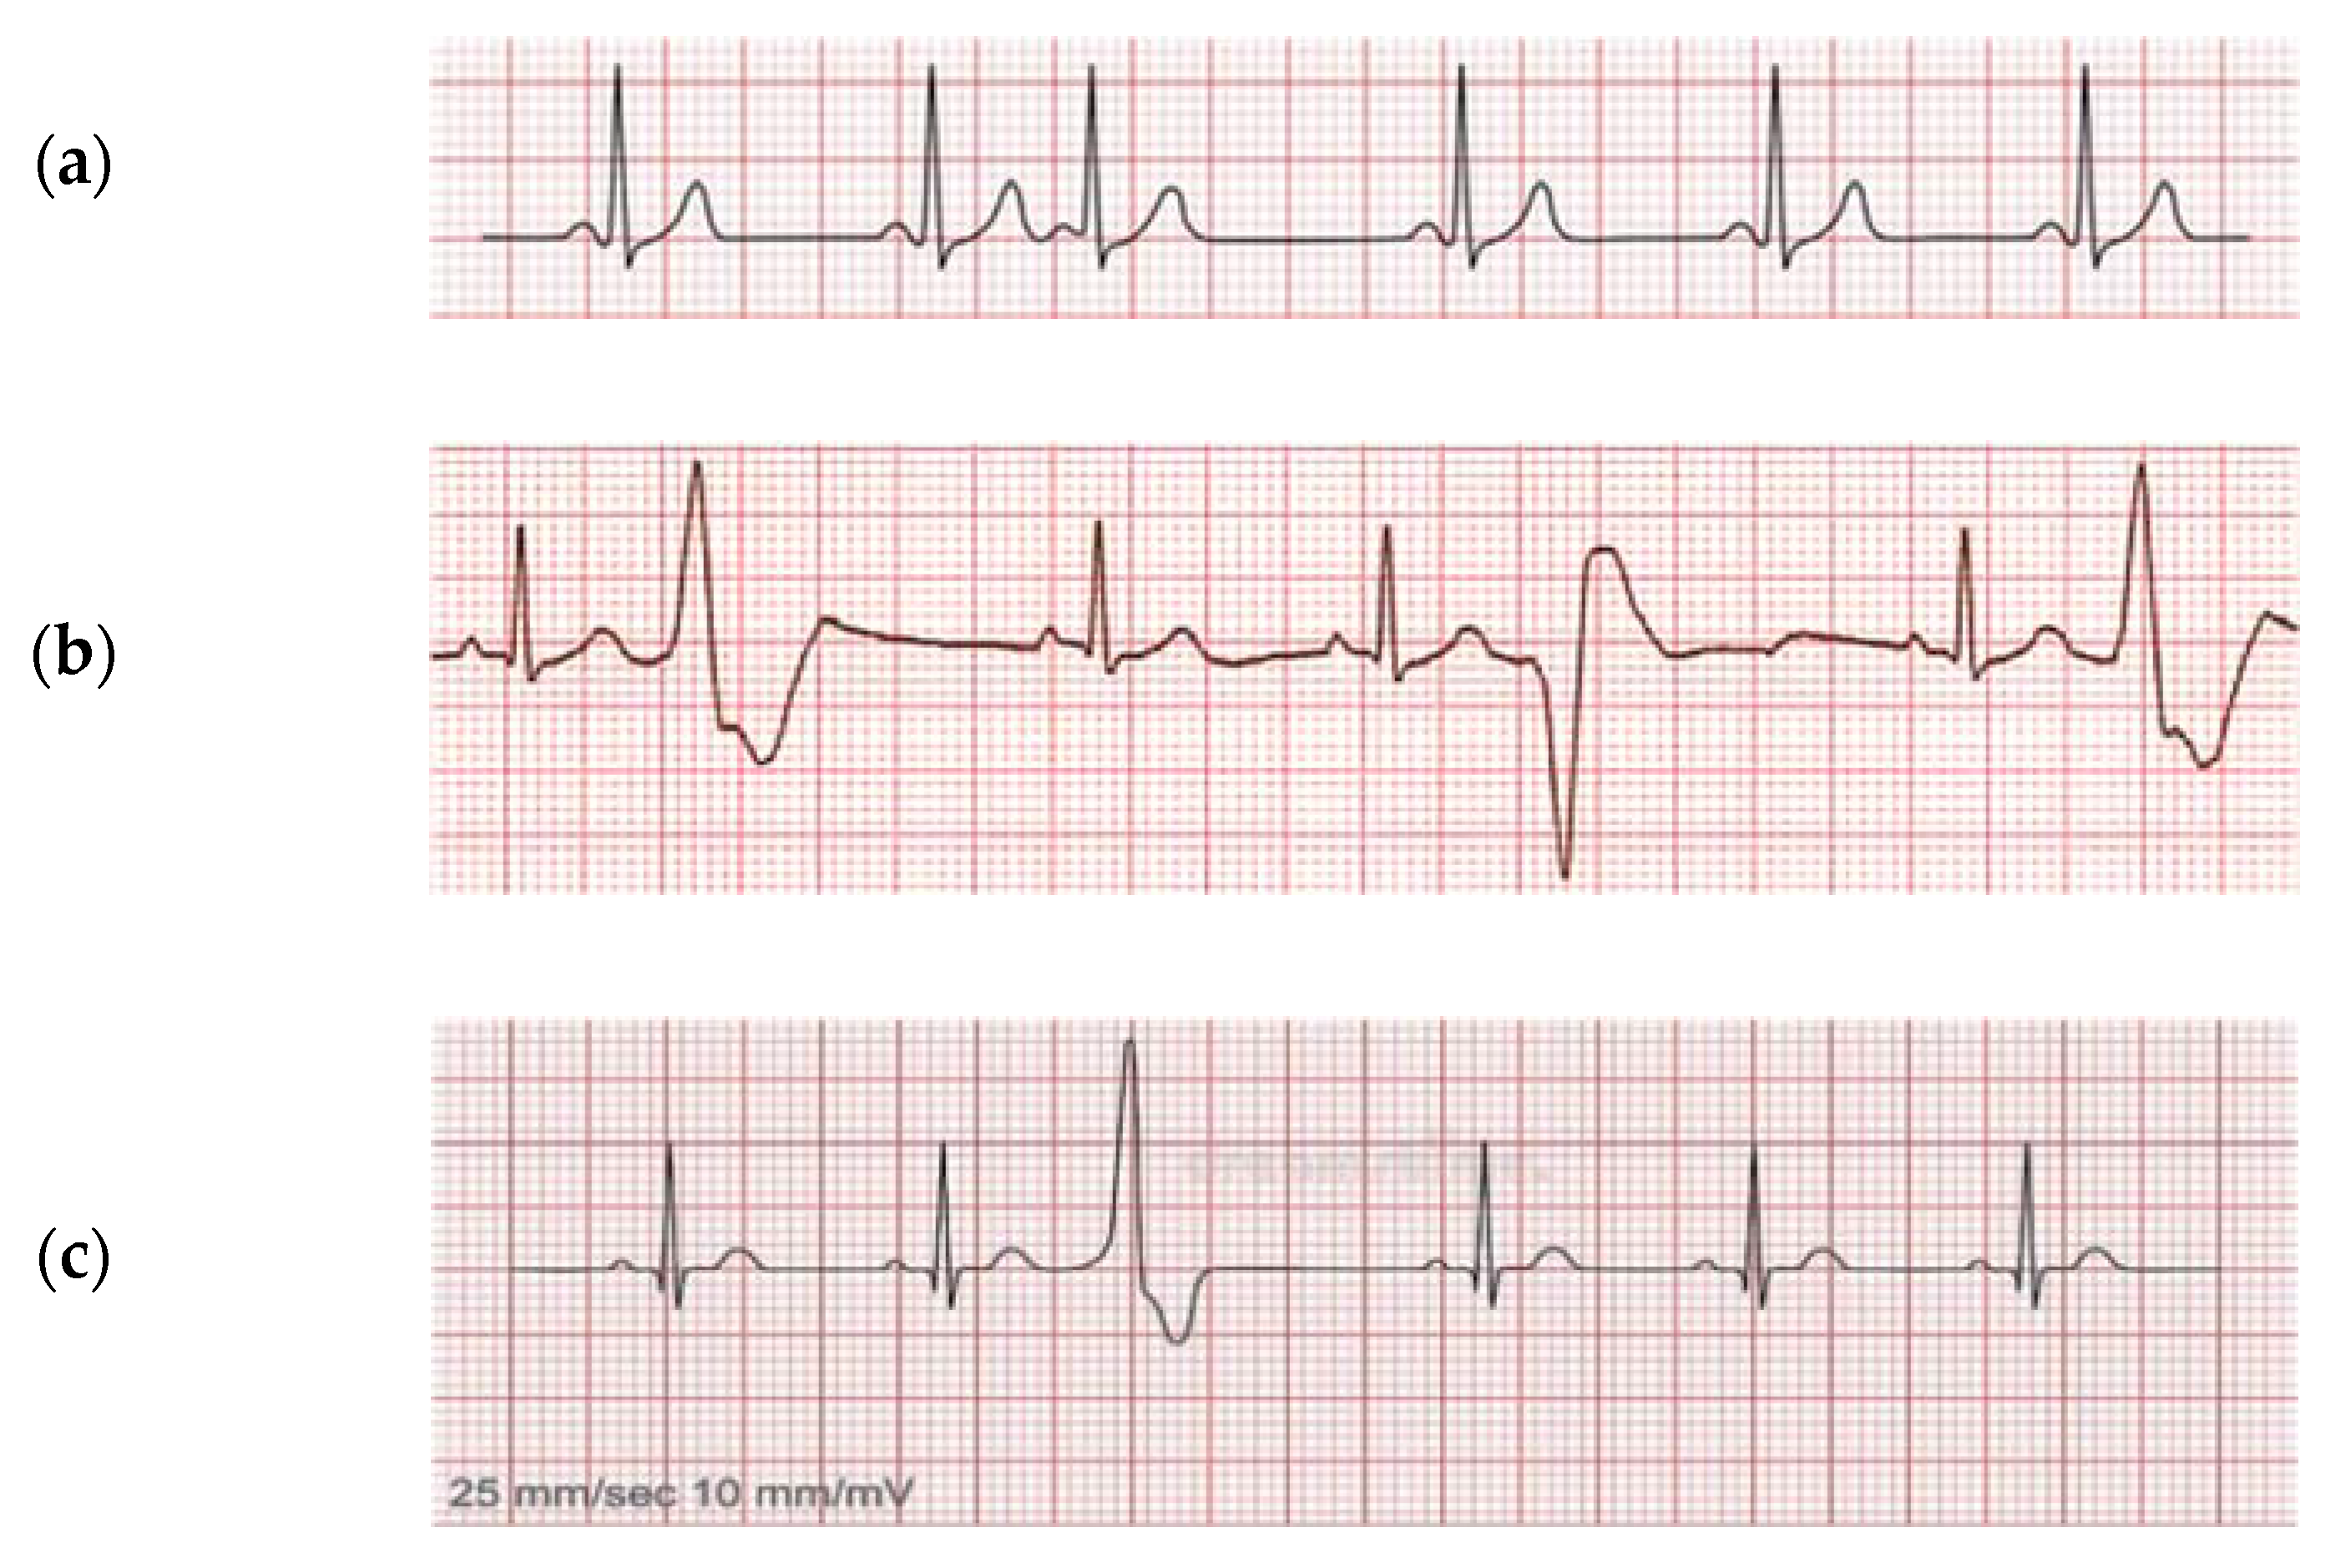
Figure 1a shows the general shape of a PAC, where we can see that the third heartbeat comes too early and has the shape of a normal heartbeat, because it was generated in the upper chambers of the heart.
PVC [
2] is described as a very early heartbeat in the ventricles that follows a normal beat, and it causes a small pause in the heart and then a strong heartbeat due to the amount of blood that was collected in the heart during the pause. A PVC can show two different ECG curves depending on the amount of blood collected in the heart and the timing of the generation of the affected heartbeat in the ventricle.
Figure 1b shows periodical Premature Ventricular Contractions (PVC) of two different shapes in the second, fifth, and the seventh heartbeats, whereas
Figure 1c shows a single PVC of the first shape in the third heartbeat.
4.1.2. Sinus Arrest
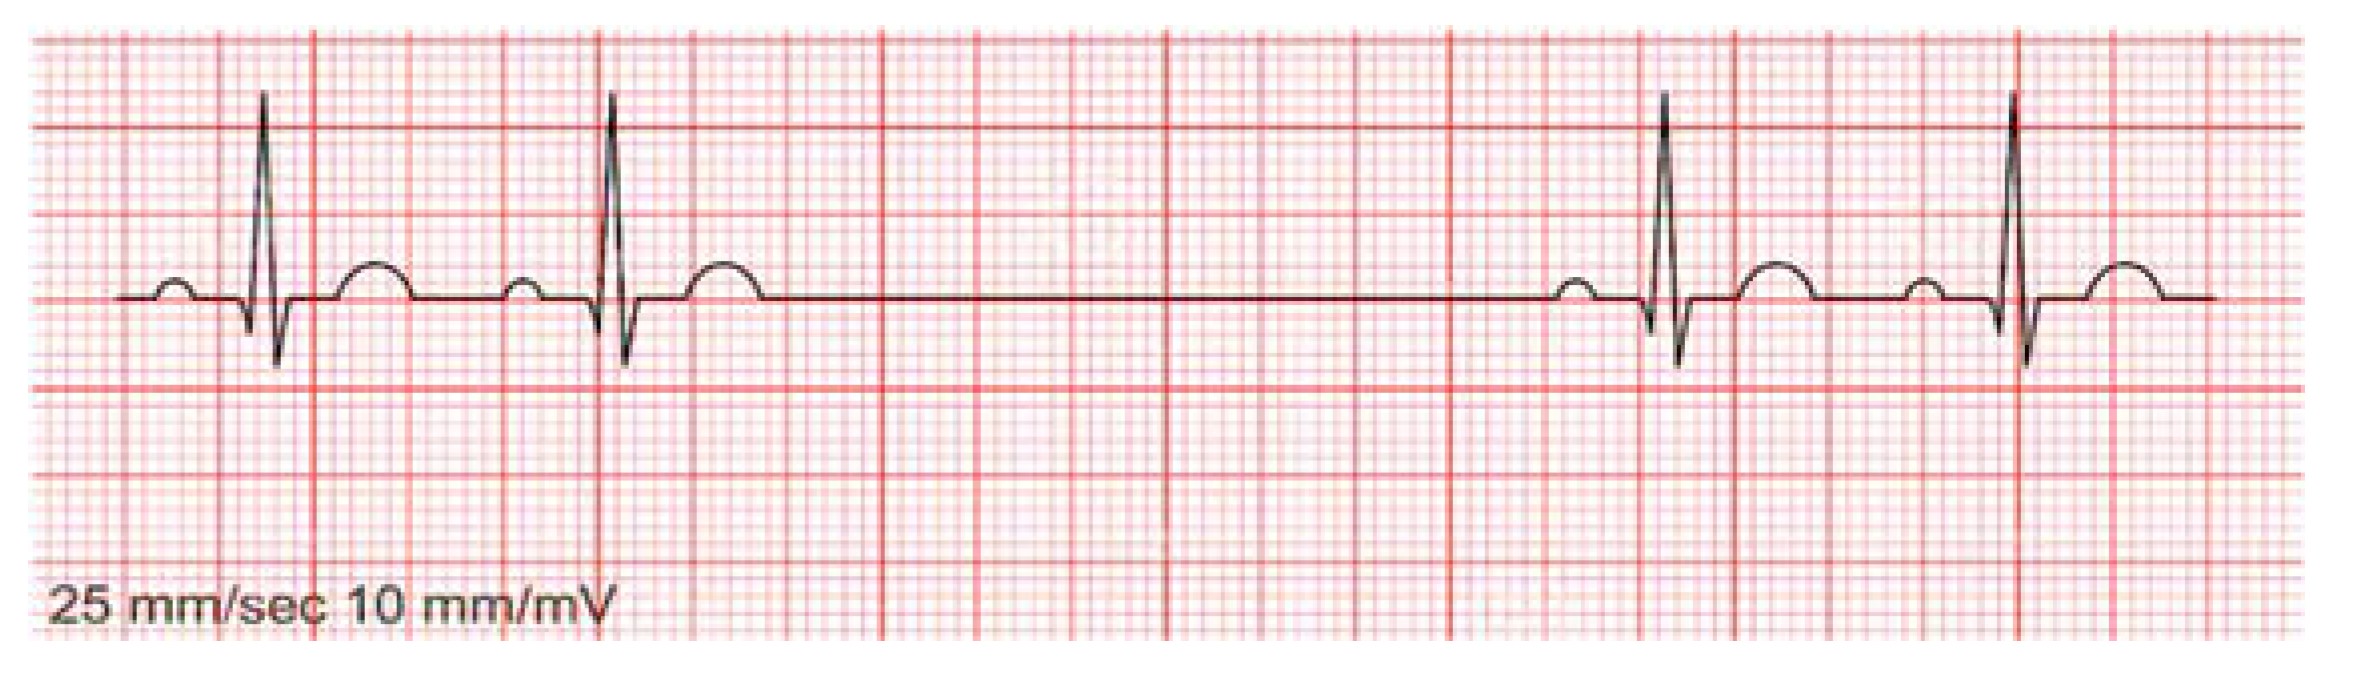
Sinus Arrest (also called Sinus Pause) is a pause in the heart’s sinus rhythm presented as a slightly longer period between two sequential heartbeats. The RR interval is used to detect Sinus Arrest. The RR interval in Normal Sinus Rhythm is the same as that for most of heartbeats; however, it looks very long (with a big RR value) in heartbeats affected by a Sinus Arrest.
Figure 2 shows an example of a Sinus Arrest presenting as a pause in the normal sinus rhythm between the second and third heartbeats, which would feel like a skipped heartbeat for the patient.
4.1.3. Sick Sinus Syndrome
A Normal Sinus Rhythm (NSR) [
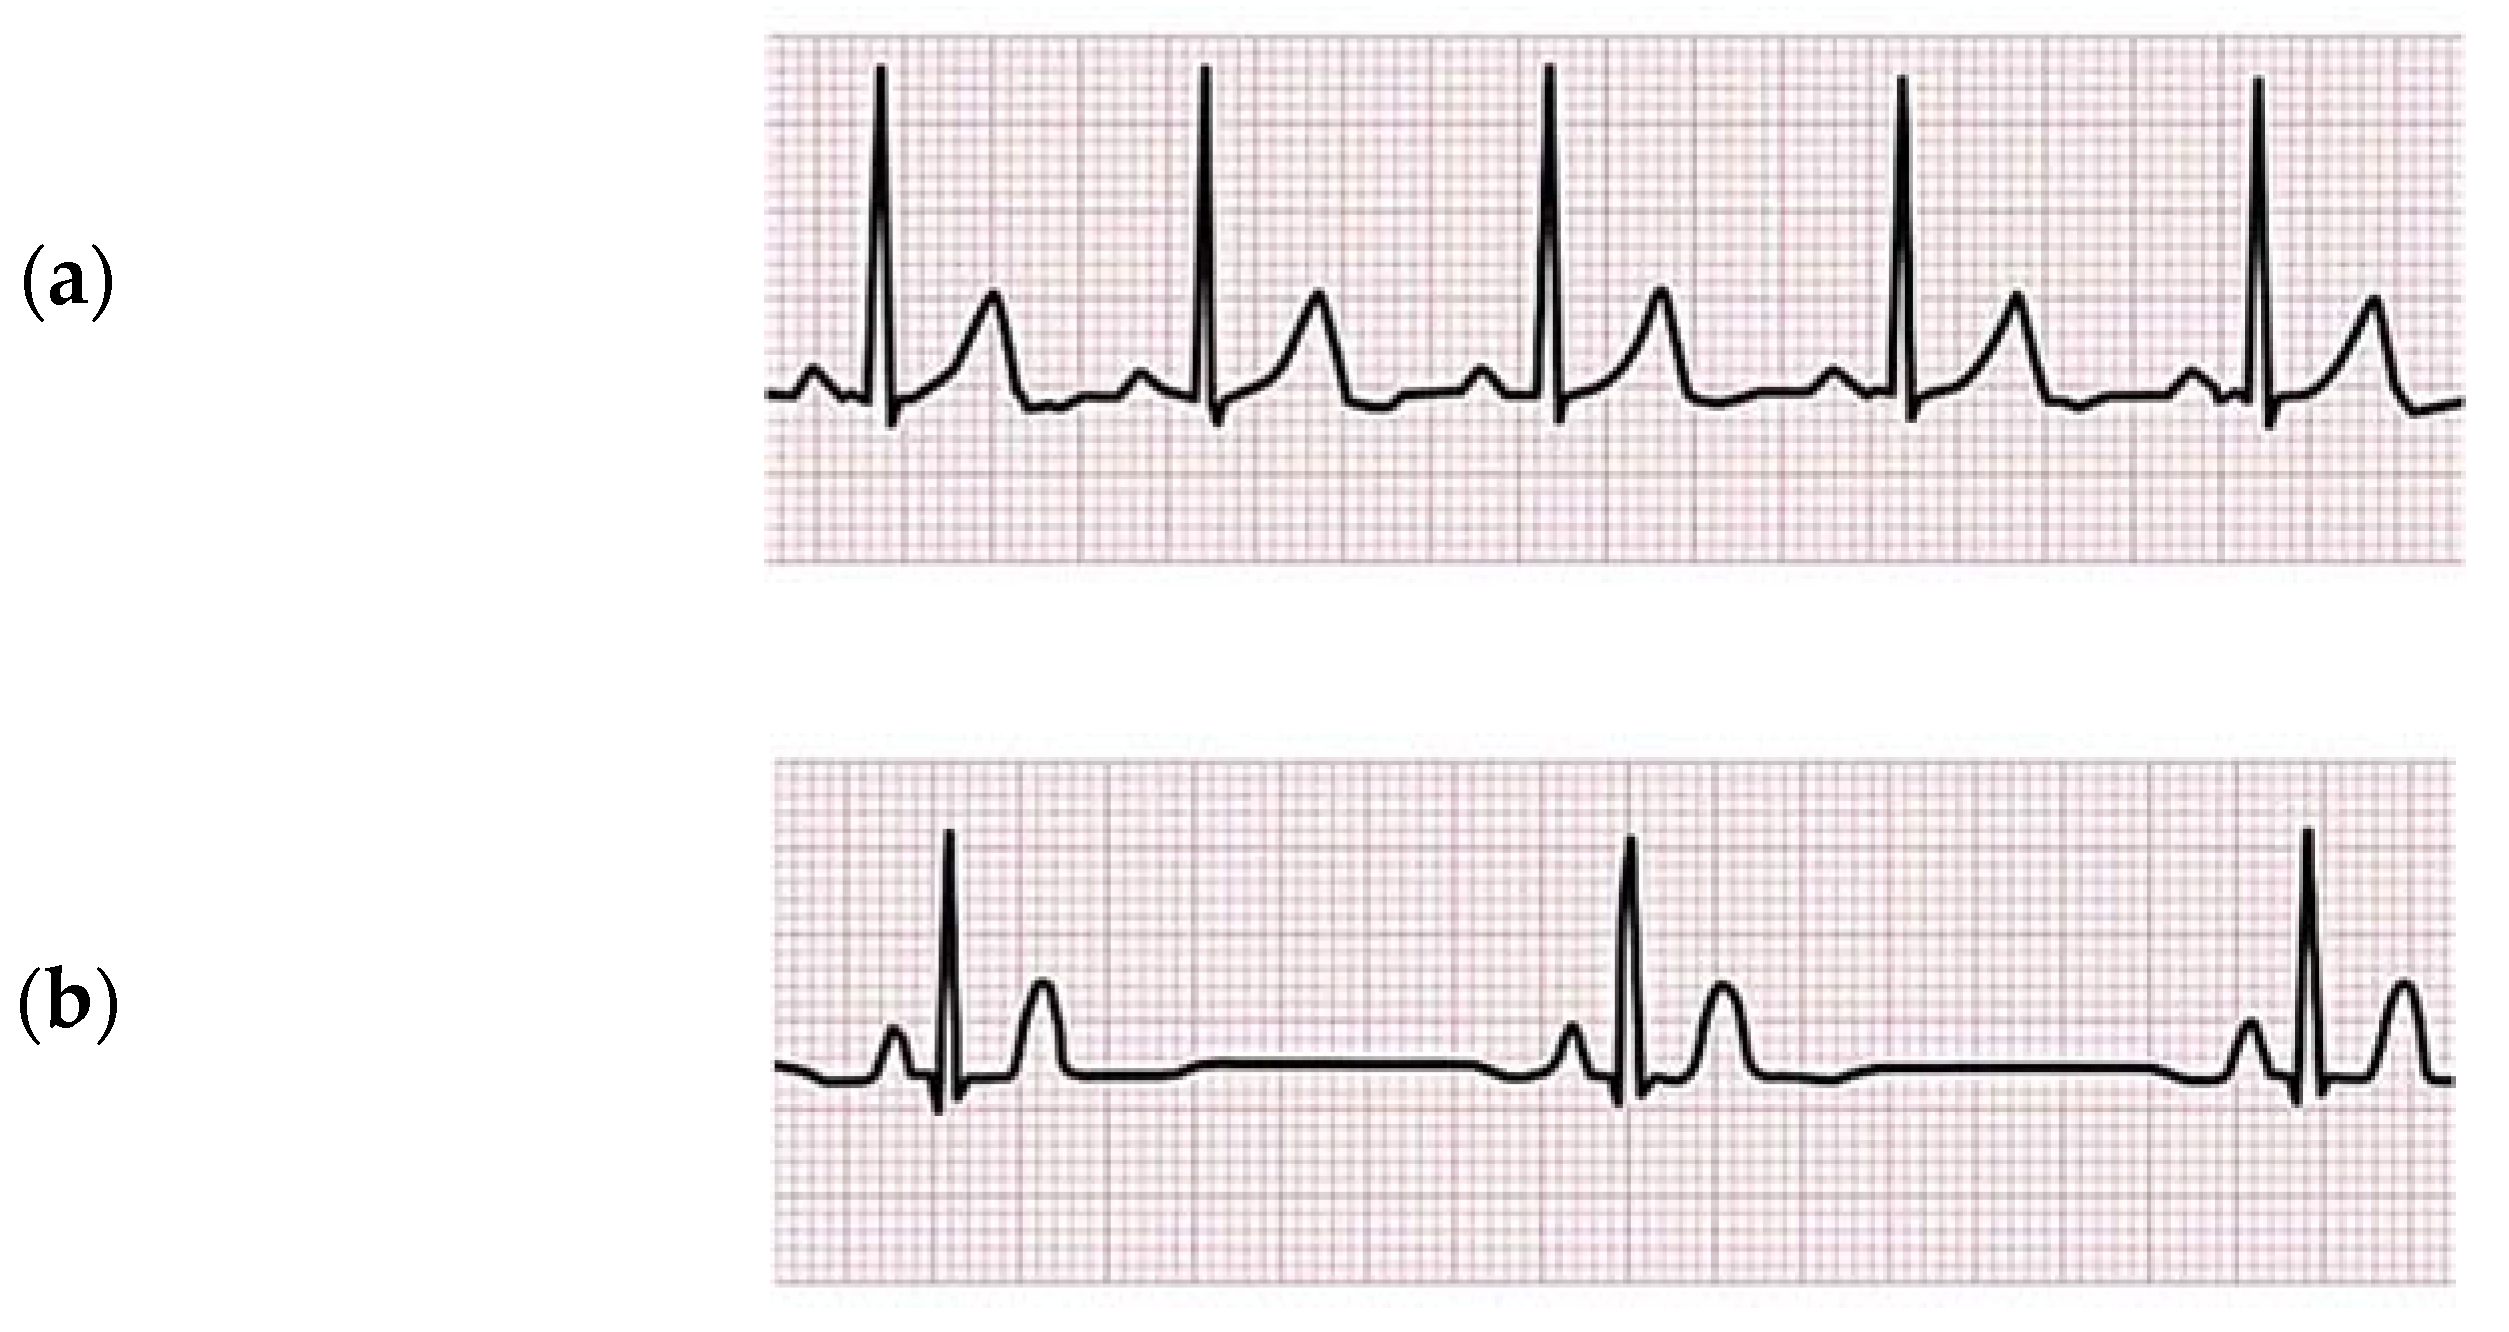
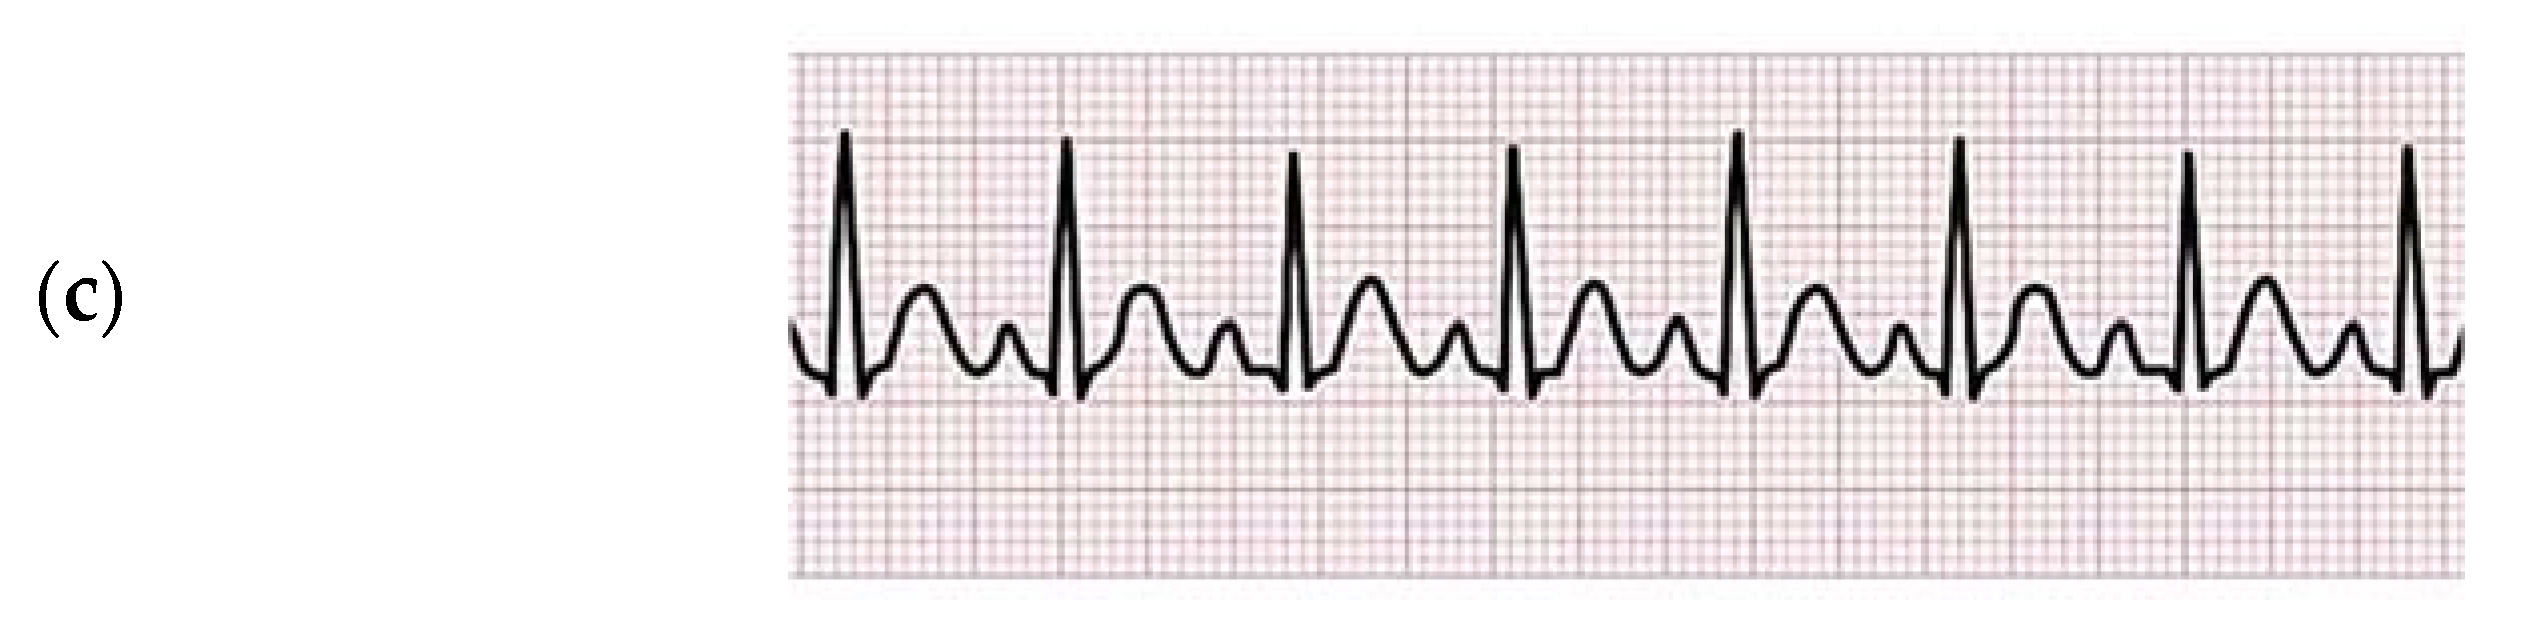
3] presents an ECG curve status that would normal for a healthy person, which will result in a normal pulse ranging from 60 bpm to 100 bpm and, in the normal case of daily activities without extra physical effort, will show almost equal values of RR intervals between all heartbeats, ranging from 0.6 s to 1 s.
Figure 3a shows the Normal Sinus Rhythm of a healthy person, where we can see all the PQRST peaks of all the heartbeats, in addition to the normal range of RR intervals between all heartbeats.
However, “Sick Sinus Syndrome” [
3], which could also be called “Abnormal Sinus Rhythm”, can basically be described as an abnormal signal of the sinus rhythm that will result in RR interval values that are out of the normal range. An Abnormal Sinus Rhythm could mean either a “Bradycardia” (
Figure 3b), presenting a slow sinus rhythm (where the pulse is less than 60 bpm and the RR value is more than 1 s), or a “Tachycardia” (
Figure 3c), presenting a fast sinus rhythm (the pulse is higher than 100 bpm and the RR value is less than 0.6 s). In order to determine that a given ECG signal is a Bradycardia or a Tachycardia, the signal should indicate a sinus rhythm with RR interval values all above 1 s or less than 0.6 s consecutively.
4.2. Proposed Algorithm
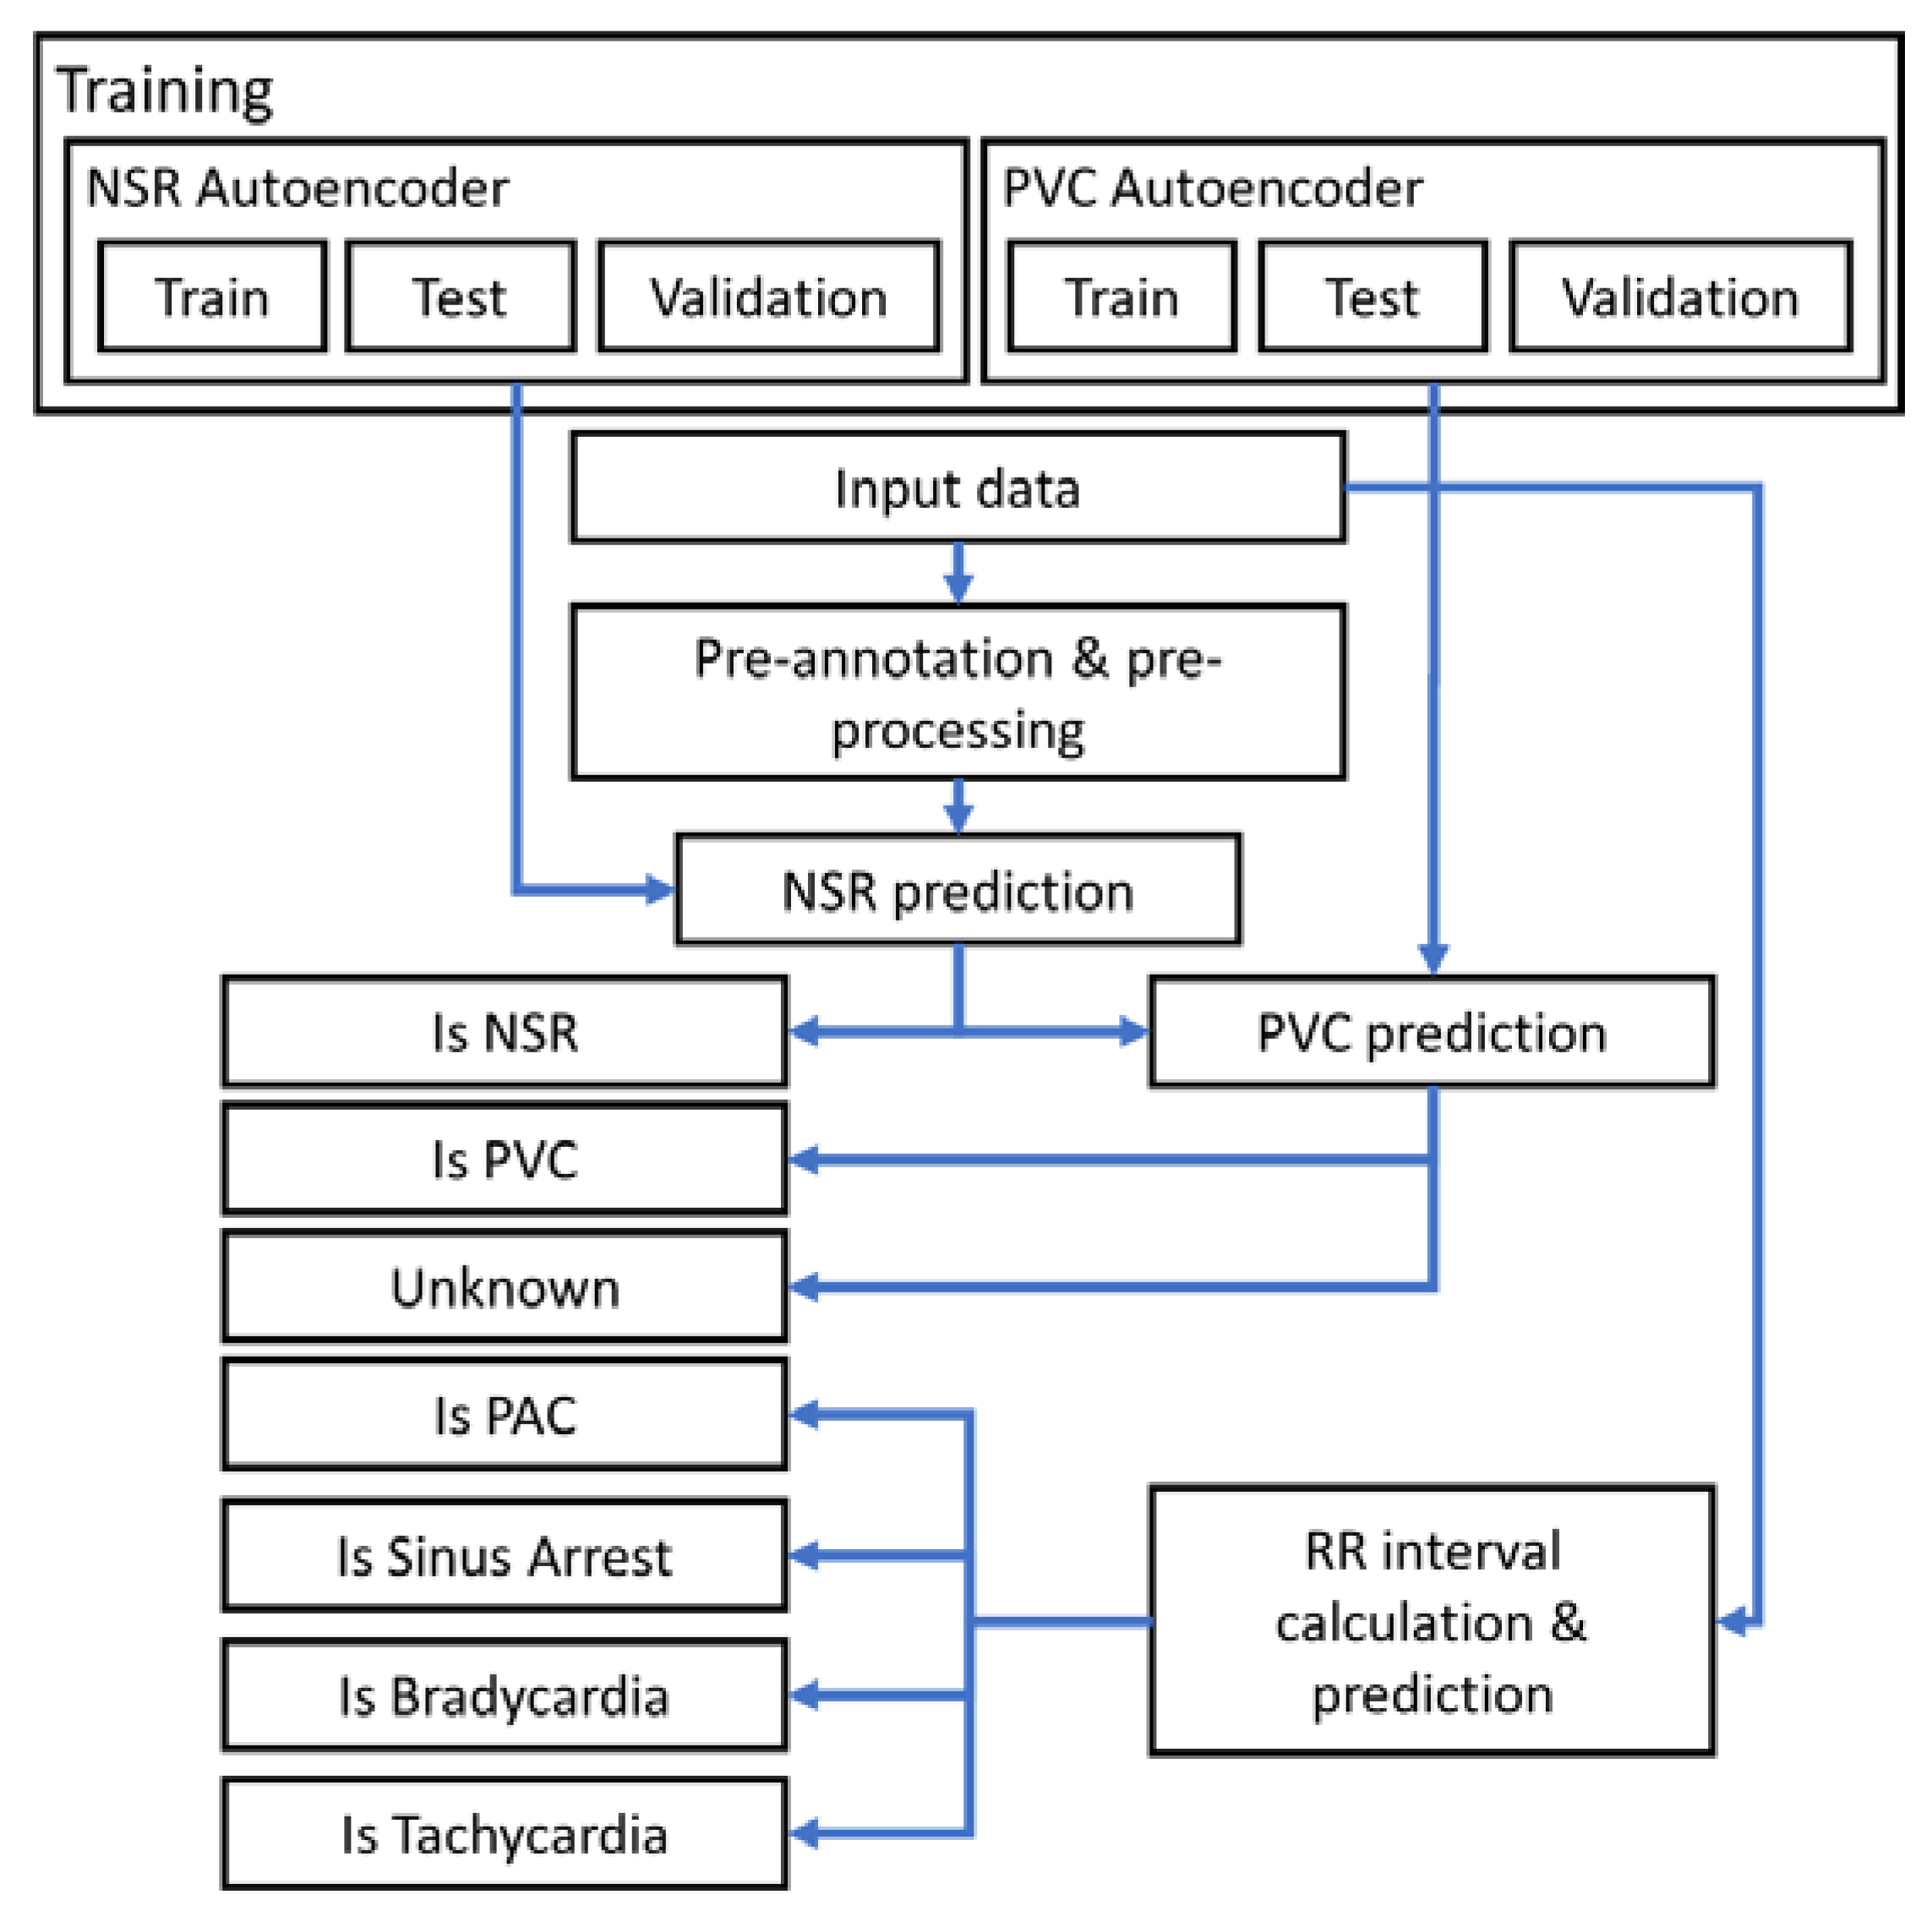
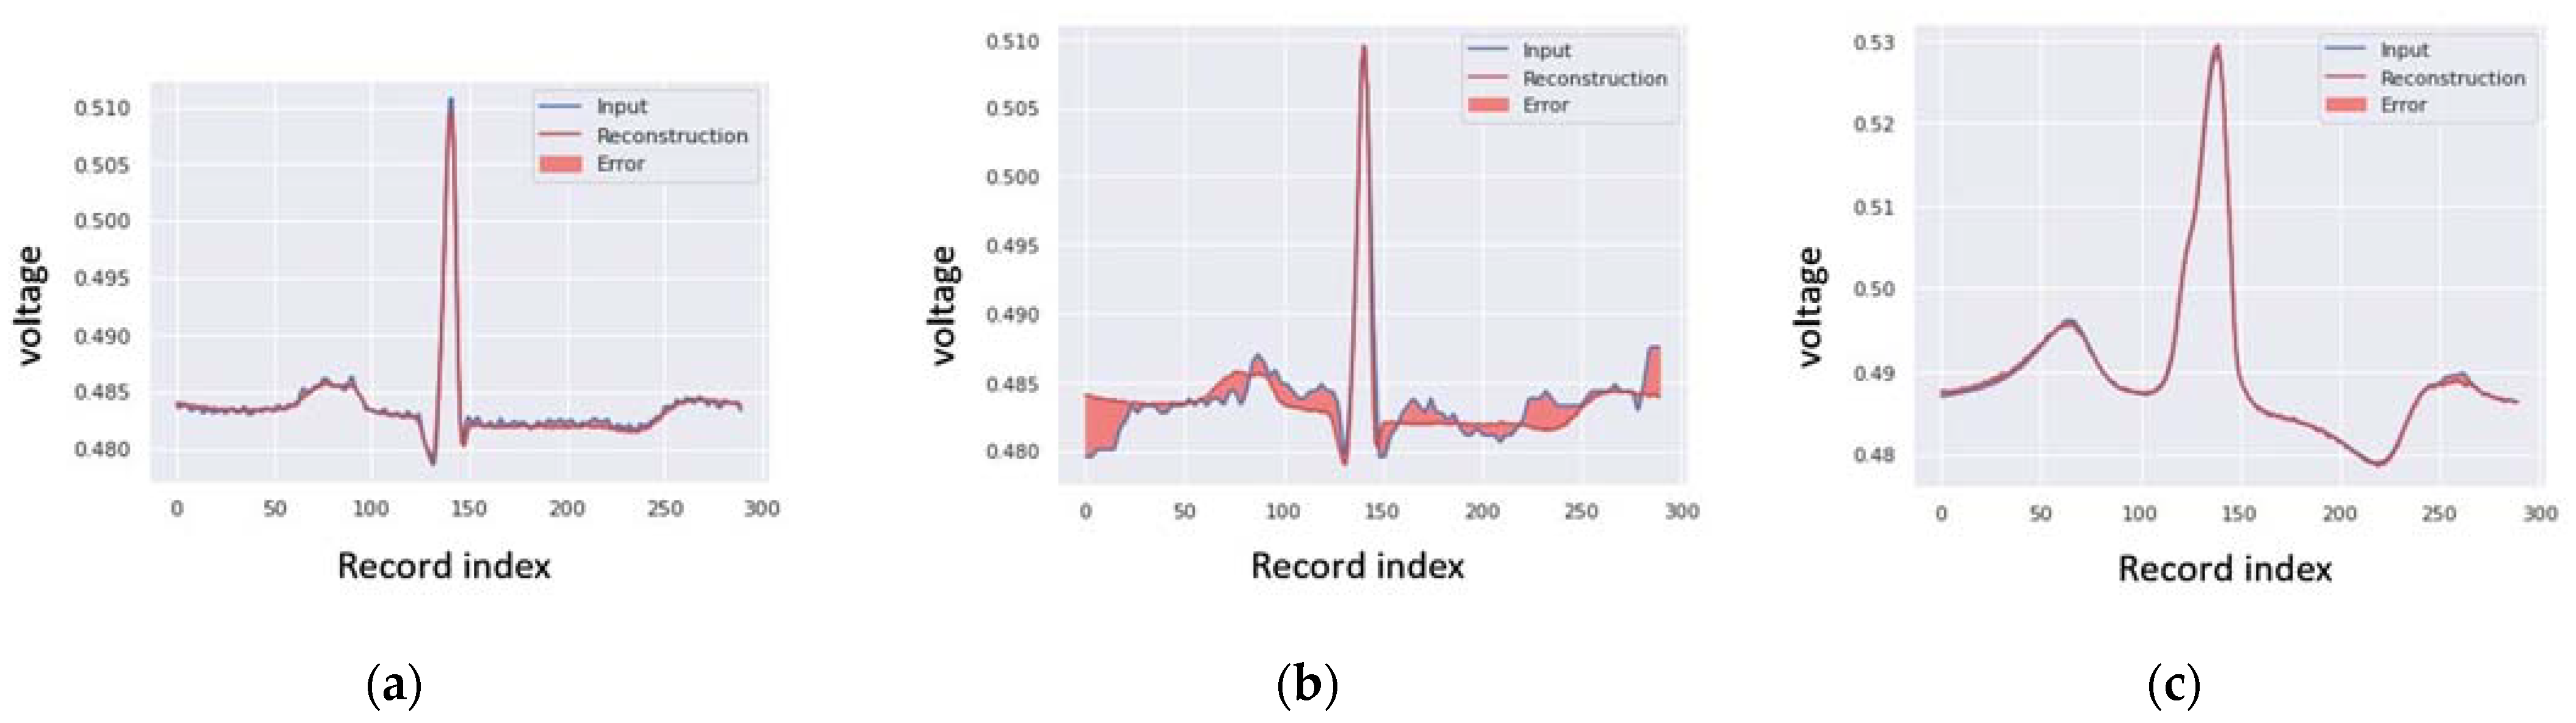
According to the description of the different types od ECG signals and arrhythmias, the following workflow is proposed to provide a generic solution for detecting abnormalities in ECG signals using Autoencoders. Autoencoders are used to determine the formal shape of a normal heartbeat ECG curve, reconstruct its shape, and then compare it to an input signal, which could be saved previously or even derived from real-time ECG data collected from patients during different daily activities, in order to check for similarities between the two input signals and then predict if this is a normal or abnormal heartbeat using the auto-calculated threshold derived in the training process.
Therefore, the proposed algorithm involves the following steps:
First, start with the preprocessing block to form a pre-annotation based on the first discrete derivative of the input signal, which is calculated as the difference between each two consecutive values of the signal;
Detect the spots where this derivative changes its polarity and shows a big value of change in a small time period—the change should be bigger than the threshold calculated automatically based on the input signal. These detected spots present the R peaks of the different heartbeats;
These annotations of R peaks are used to split the heartbeats based on the sensor sampling rate;
The different heartbeat types are then predicted using the trained Autoencoder model to determine if this presents a normal or abnormal beat;
If any arrhythmia is detected in any of these beats, the given heartbeat is checked again with another Autoencoder model, which is trained to detect anomalies such as different shapes in a PVC heartbeat;
The same process is used to detect other types of arrhythmias.
Figure 4 shows the overall structure of the proposed algorithm for the whole process of classification.
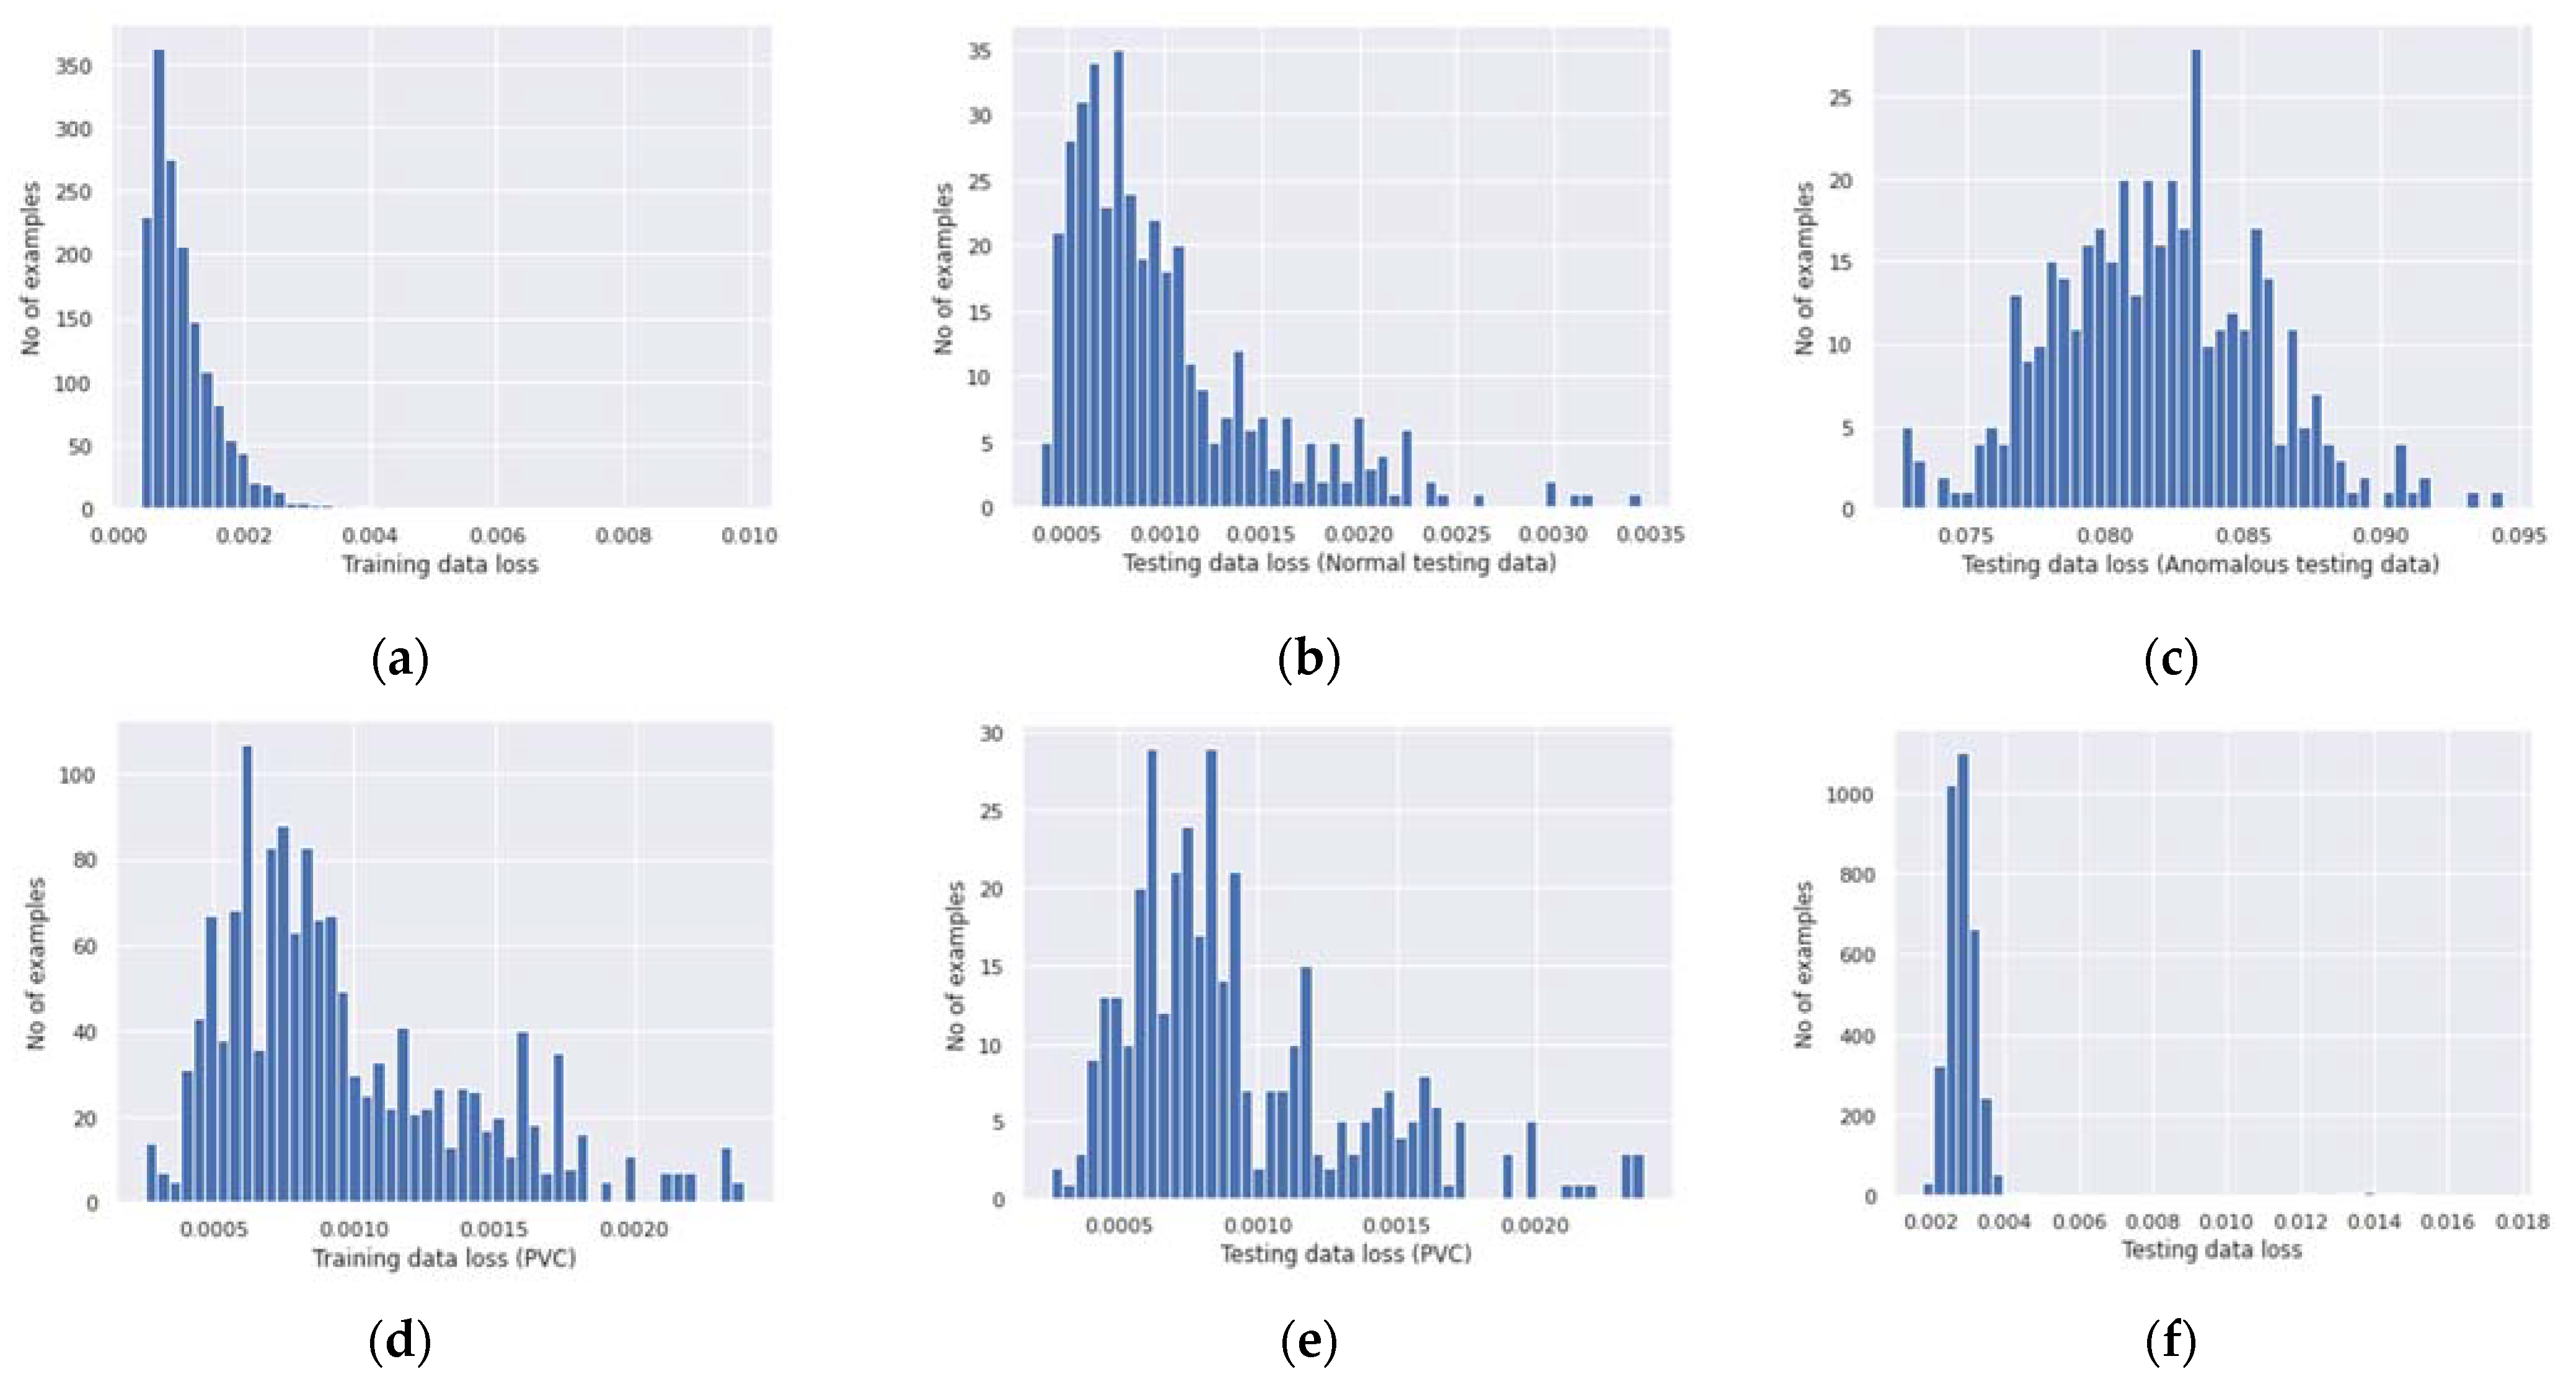
In the process of training the Autoencoders, we used over four thousand heartbeats from the MIT-BIH ECG data of different patients, of which 20% were used for testing and 80% for training, and the numbers of signals implying normal and abnormal ECG were almost equal. More than 1500 heartbeats were NSR (normal sinus rhythm), and an equal number were abnormal heartbeats containing APC, PVC, and noise data. However, in the case of the Autoencoder dedicated to NSR detection, we selected only the heartbeats annotated as NSR, while in the case of the Autoencoder dedicated to PVC detection, we used the “St Petersburg INCART 12-lead Arrhythmia Database” dataset, which provides a wide set of records with PVC annotations.
We used “Tensorflow” and “Keras” to build our model of the three main densely connected Neural Network (NN) layers for both the encoder part and the decoder part. The model was built to be trained using the “Adam” optimizer with 100 epochs and a batch size of 512. In the case of the encoder, we used the following layers:
Dense layer with a 32-unit output shape and rectified linear activation process (relu);
Dense layer with a 16-unit output shape and rectified linear activation process (relu);
Dense layer with an 8-unit output shape and rectified linear activation process (relu).
For the decoder, we used the following dense layers:
- 4.
Dense layer with a 16-unit output shape and rectified linear activation process (relu);
- 5.
Dense layer with a 32-unit output shape and rectified linear activation process (relu);
- 6.
Dense layer with an output shape of the minimum signal length units and the sigmoid activation function. The minimum signal length is calculated based on the sampling rate/frequency of the input data depending on the used ECG device.
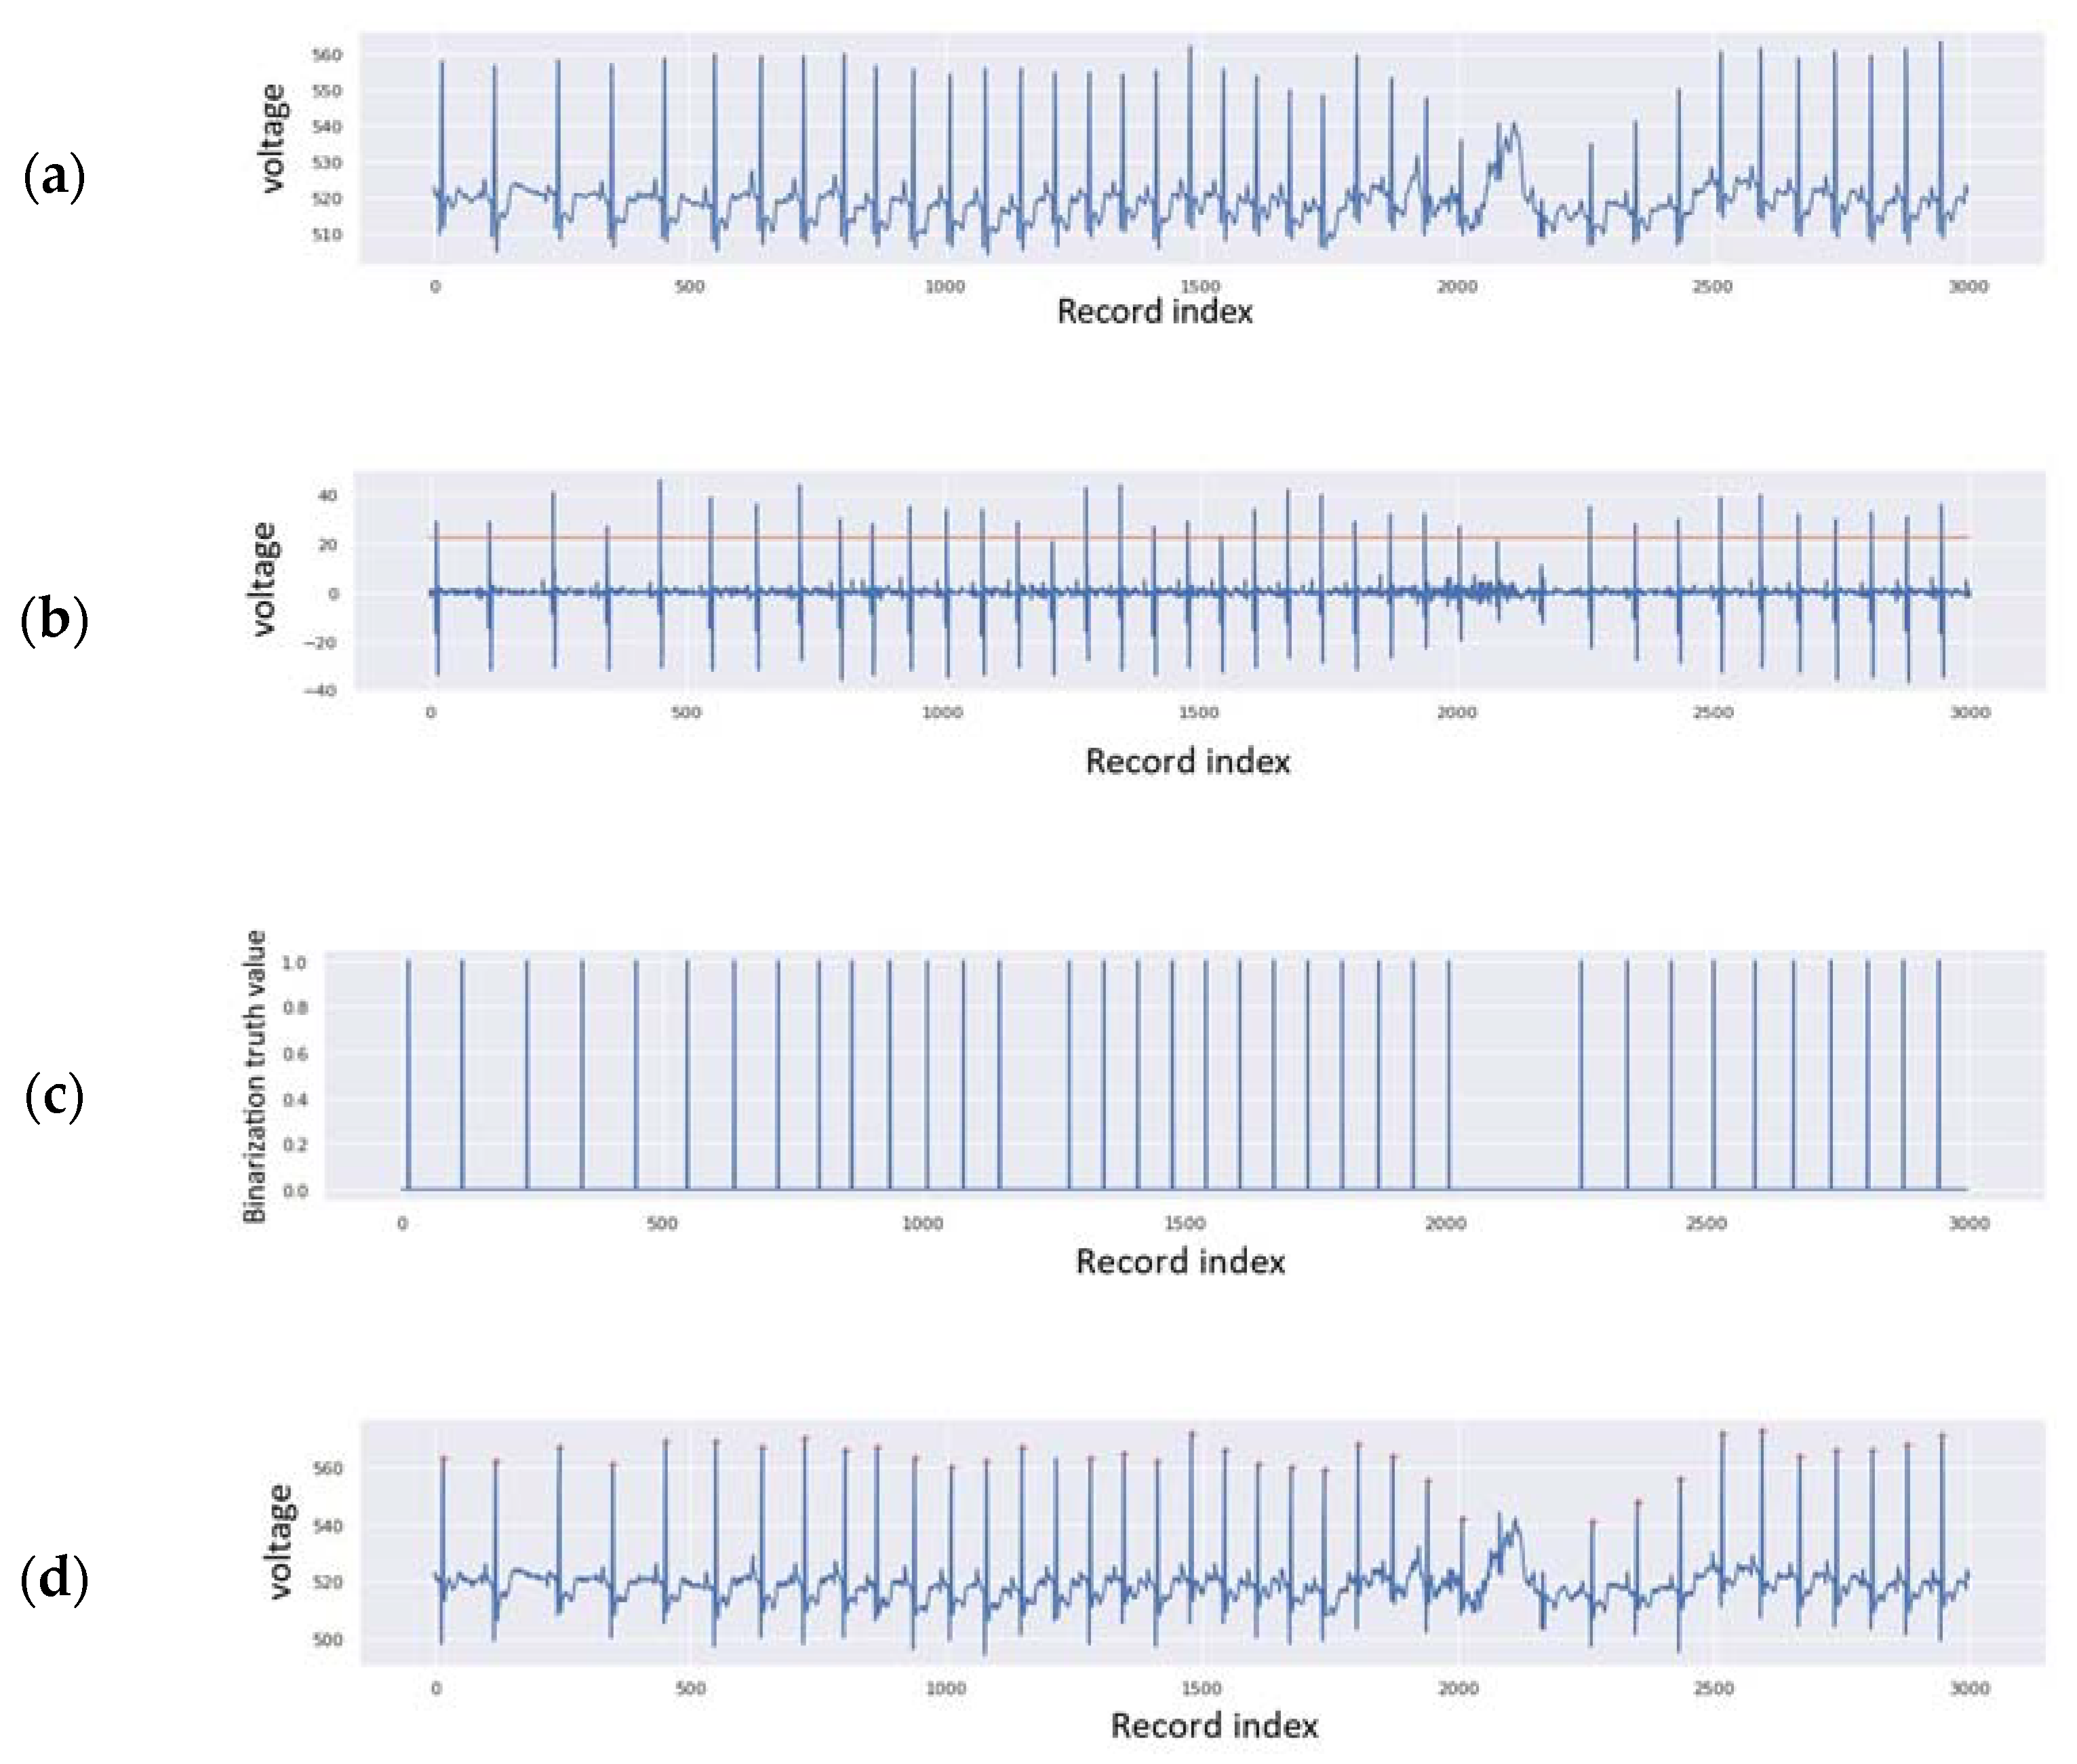
In the pre-annotation process, we aimed to detect the R peaks in order to use them to separate the heartbeats and thus later make the prediction using the trained Autoencoder models. This step consists of three main sub-parts:
The first is to get the first discrete derivative of the original signal, calculated as the difference between all consecutive values of the data. The proposed algorithm for the pre-annotation is shown in Algorithm 1, and the necessary formulae from the algorithm follow it.
| Algorithm 1: Pre-annotate ECG Data |
Data: X ← dataSignal # the whole ECG input signal
Result: R_annotations # the pre-annotated R peaks indices in the signal
dxdy ← diff(X); # calculate the first forward discrete derivative
th ← max(dxdy)/2; # the threshold could be changed, for instance using the standard deviation
dataLength ← sizeOf(dxdy);
dxdy_bin ← []; # to contain the detected spots for possible R peak
rm ← 5;
R_annotations ← []; # to contain the R peaks
for i ← 1, dataLength do:
if dxdy[i] ≥ th then:
dxdy_bin.append(1);
else:
dxdy_bin.append(0);
end
end
for i ← 1, dataLength do:
if dxdy_bin[i]=1 then:
R_annotations.append(max(X[(i+1-rm, i+1+rm)]); # append the index of the detected R peak
end
end
return R_annotations;
|
The signal values are saved in the array “X”, “t” is the time axis (in this case, the index of the data inside the data array, depending on the used sensor sampling rate), and “dx” is the first forward discrete derivative of the signal data (Equation (1)).
The second sub-part is to calculate the threshold based on the maximum value of the discrete derivative (Equation (2)).
where “
th” is the threshold. The third sub-part is finding the
R peaks. In our case, it is considered that the noise generated during the collection of data will have smaller values than the actual change in voltage caused by the QRS complex; therefore, the detection of the
R peak is made easier by using the first discrete derivative of the ECG signal. Since we are using the first forward discrete derivative, the selection of the
R peak demands finding the spots where the derivative changes its polarity with a value greater than the threshold; however, it should be found within a given range from the detected spot, where the margin of this range could be determined at the beginning (for instance, the range rm = 5).
The next task is what we call the “binarization” of the results by finding the points of interest (POI), where “
dx” surpasses the threshold “
th”.
The
R peaks are detected using the following formula:
After the detection of the R peaks, we split the beats by taking the same amount of signal data before and after each R peak, wherein the amounts of values taken before and after depend on the sampling rate of the used sensor or device, taking into account the fact that the normal pulse for a healthy person ranges from 60 bpm to 100 bpm, and in a normal case of daily activities without extra physical effort, it will show almost equal values of RR intervals between all heartbeats, ranging from 0.6 s to 1 s.
6. Discussion
The achieved results show high reliability compared to existing solutions in the field of Neural Networks applied in patient health monitoring in general, and in ECG monitoring specifically. This paper aims to present the whole workflow, not only an algorithm. All the proposed solutions have been developed and tested, showing high precision and performance. The workflow structure is well explained and anyone could reproduce the results when following the exact description and configuration given in this paper. During the implementation of this research, we used different sources of ECG data, and all the results and the necessary comparisons of the trained models are well presented; the MIT-BIH database showed good results for NSR heartbeat detection (with a normal low voltage value for the T peak), while the INCART database is more suitable for PVC detection.
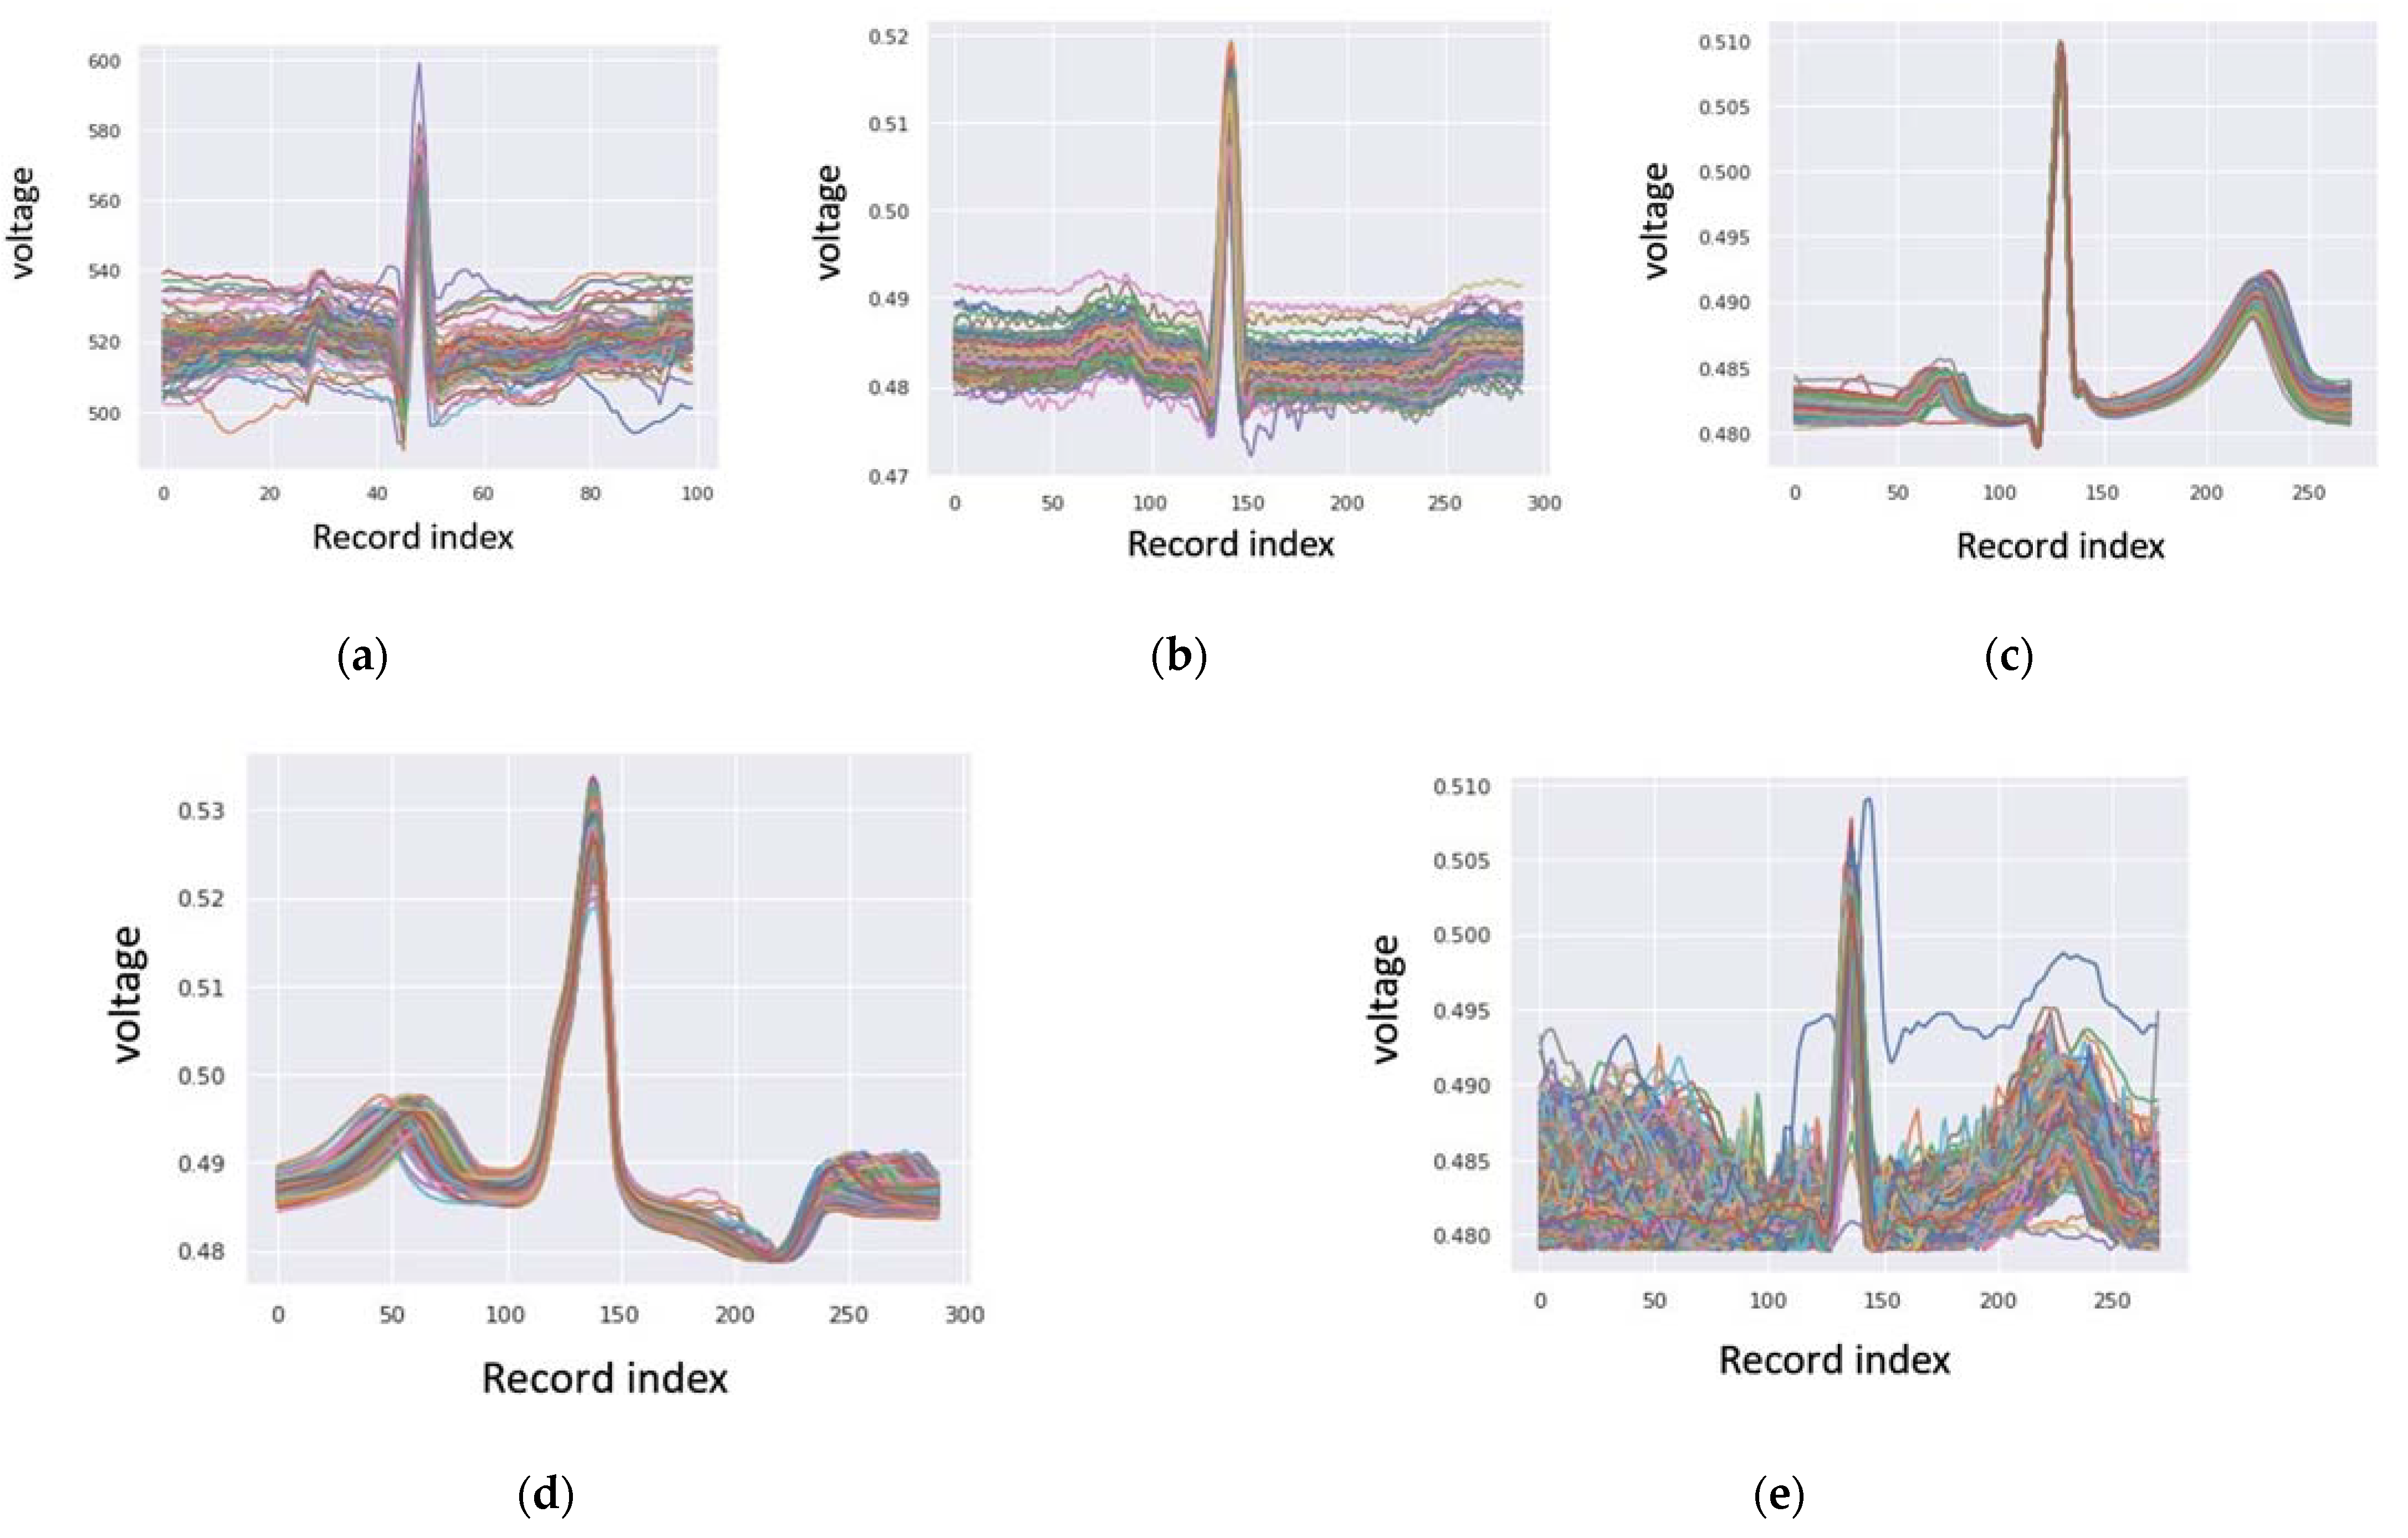
Regarding the pre-annotation solution, it is clear that the detection of the R peaks is precise, and can be used for beat-to-beat separation, by which the detected R peaks are well cropped and aligned, as presented in
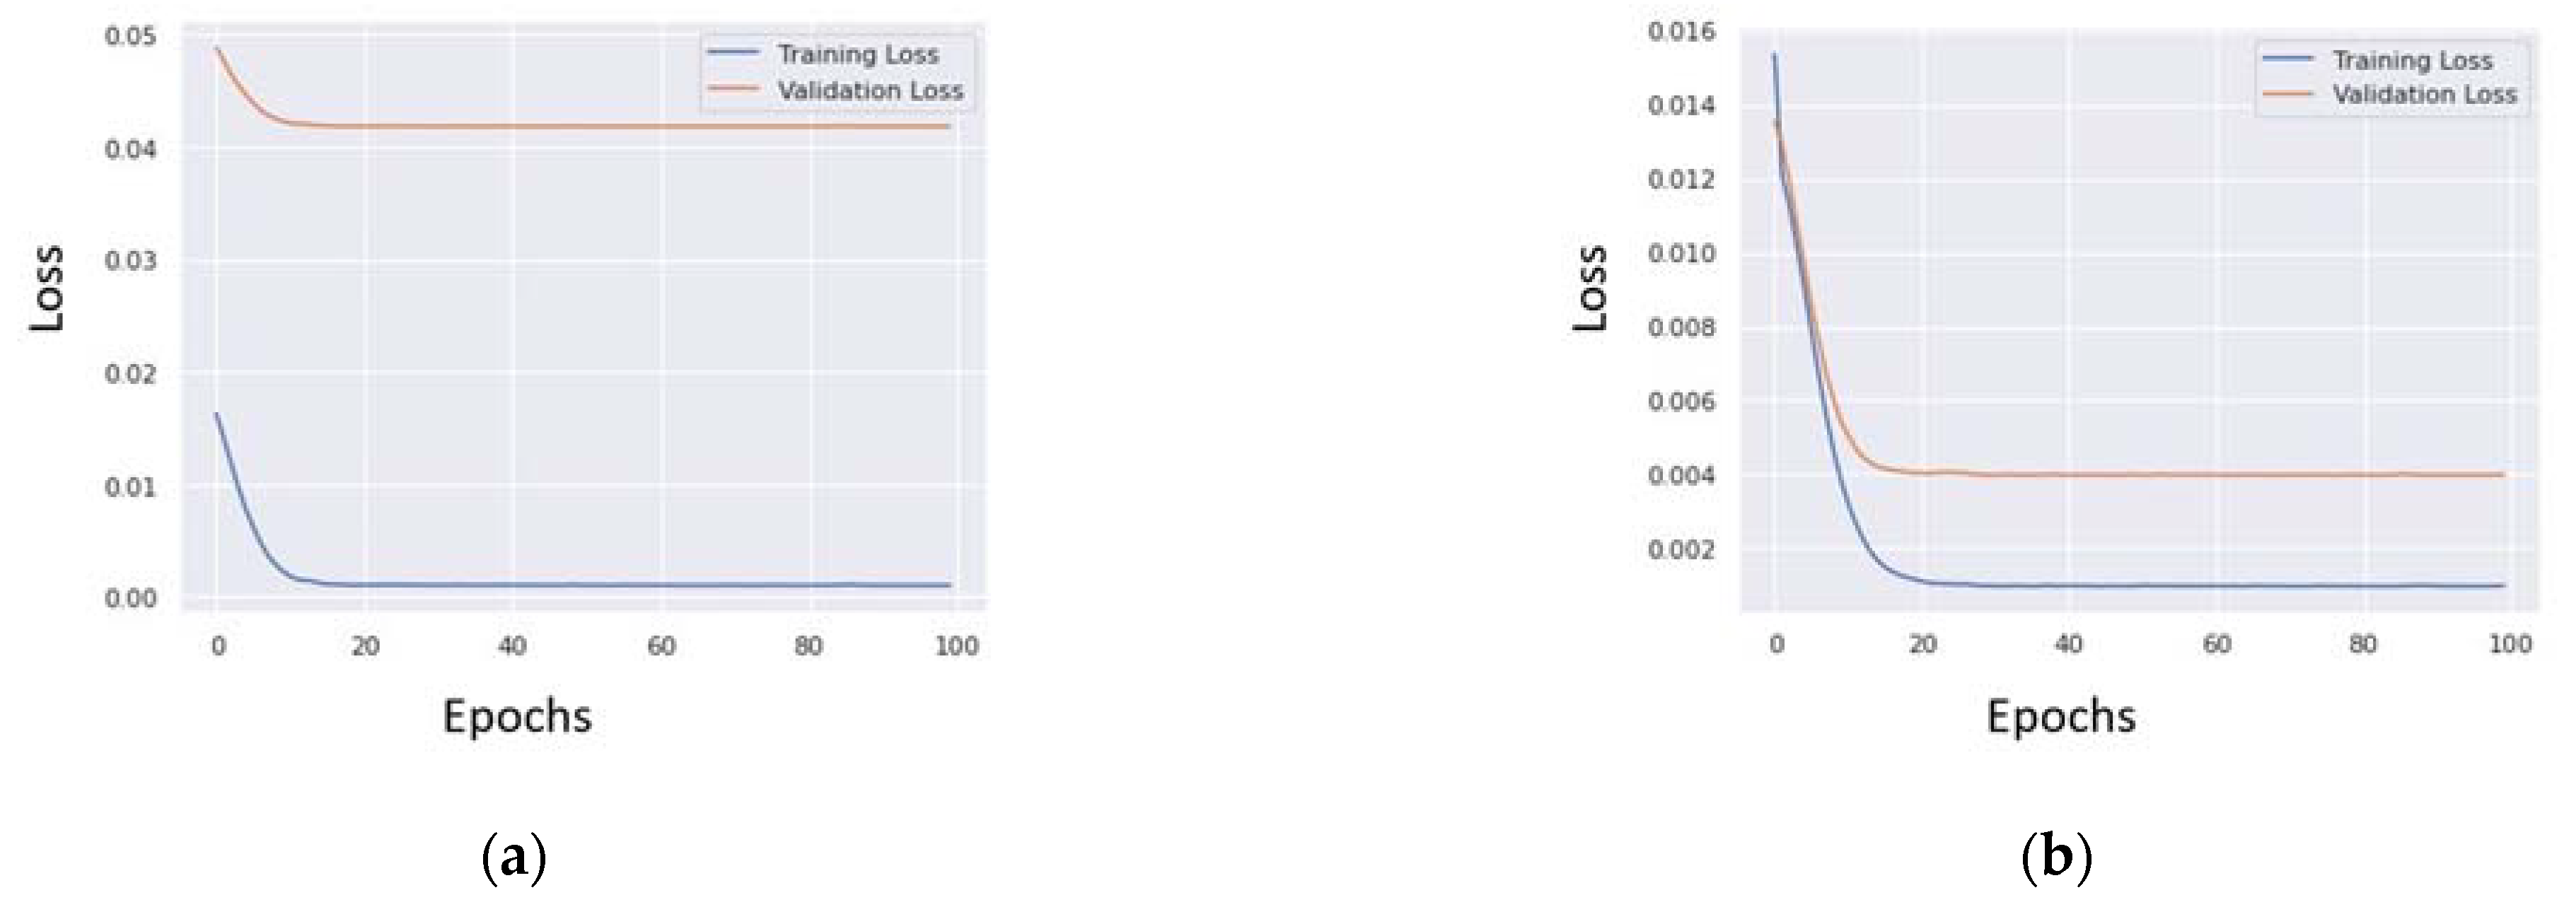
Section 5.1. The training process of the NSR and PVC Autoencoders finished with fairly low data loss for both models, as described in
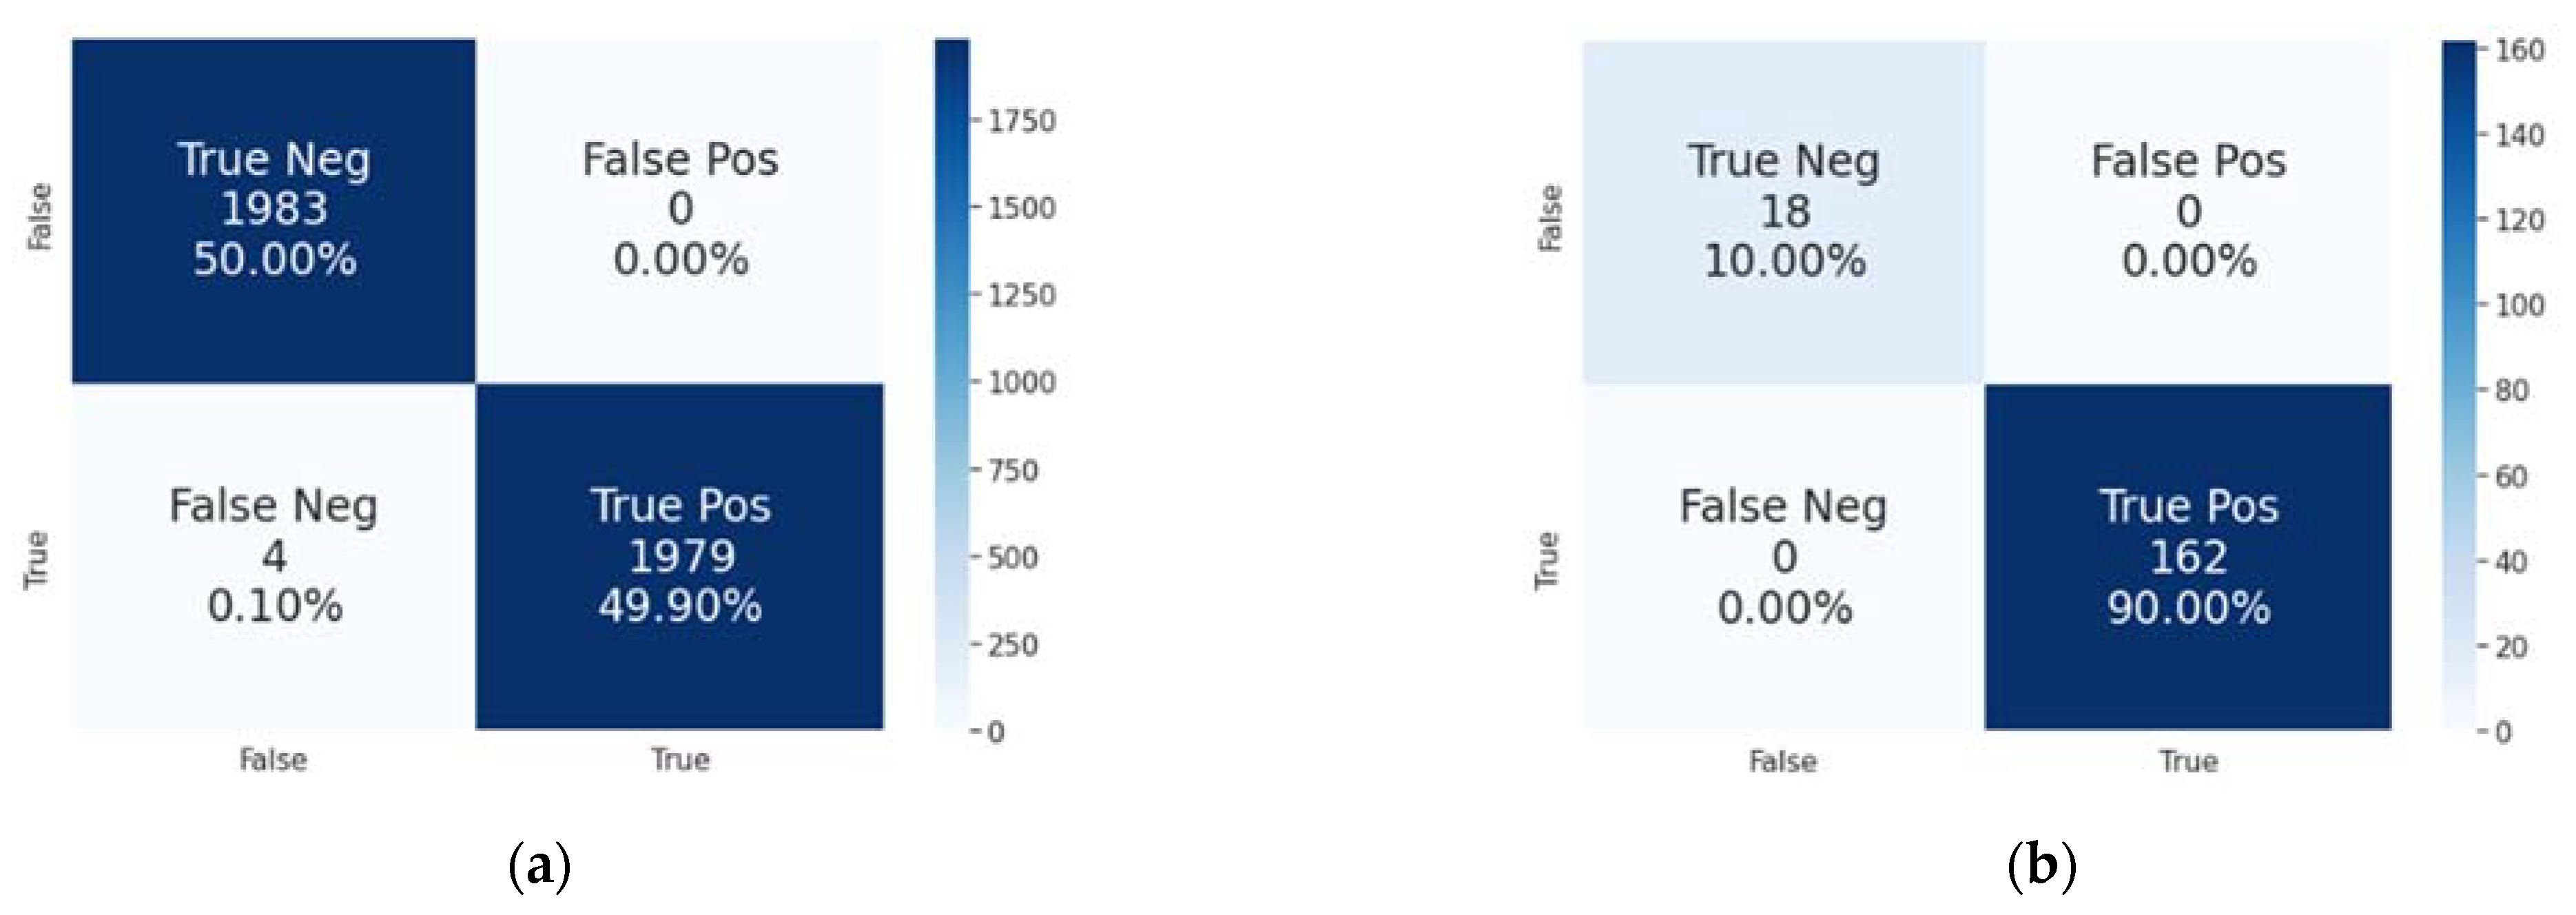
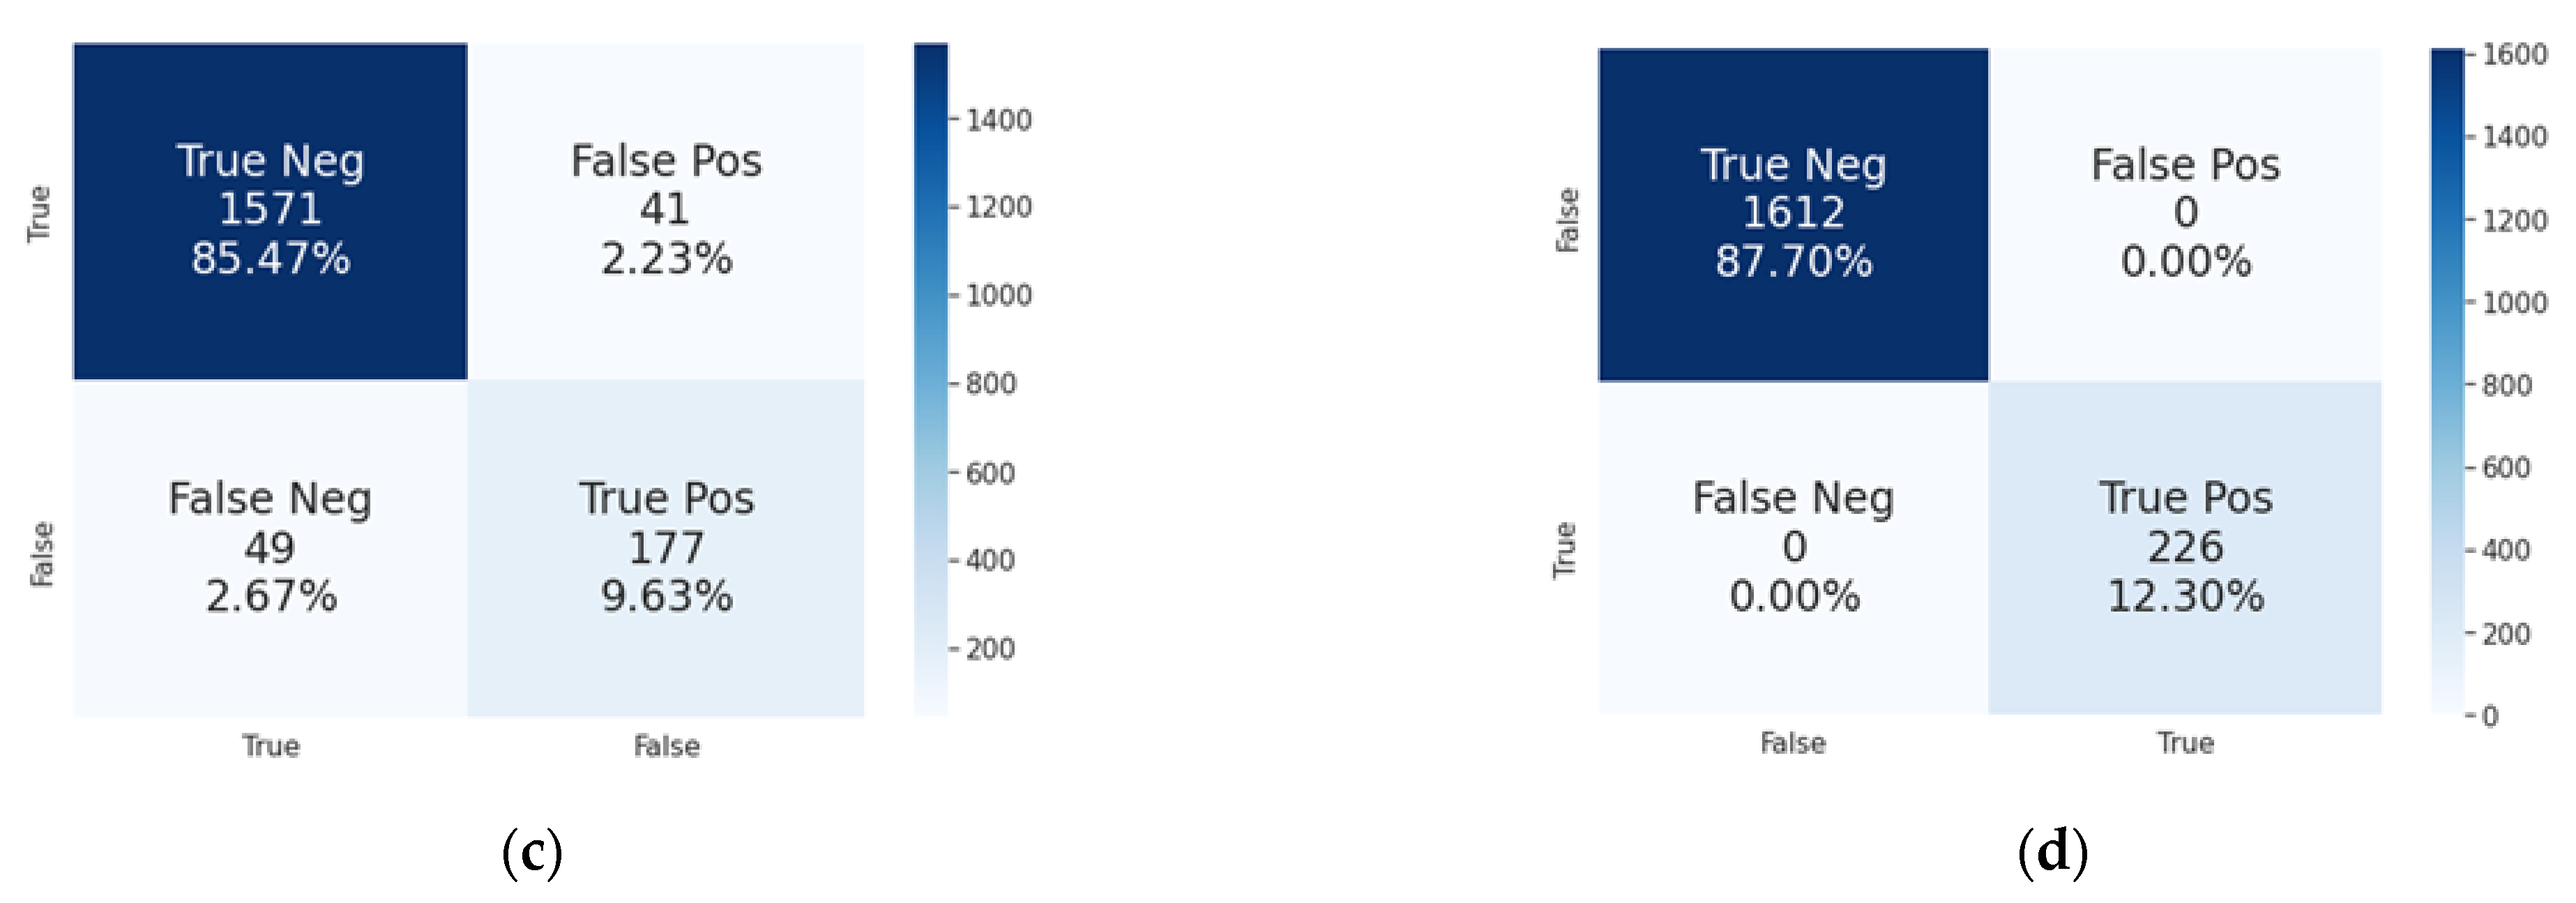
Section 5.2, and were used to attain high prediction accuracy, precision, and recall for all the different sources of data, as shown in
Section 5.3. In the case of any failure in the first trained model of NSR heartbeats, the PVC model will perform rechecking in order to validate the results and detect whether the given heartbeat is a PVC heartbeat. The achieved results are very good in comparison with pre-existing solutions, and could be prepared and validated further for real-world use.
Further work in this area will include the final validation of the achieved results with a bigger ECG dataset and with other available datasets. It is worth saying that the INCART and LTAFDB databases could also be used to retrain the first Autoencoder in order to yield a wider prediction rate for NSR heartbeats with high voltage of the T peak (in the case of the INCART data) and for noisy NSR heartbeats (in the case of the LTAFDB data). In addition, this research could be extended using the same proposed workflow to detect other types of heart arrhythmias in ECG signals, or even for other types of time series related to human bio-signals.
Table 3 gives a comparison of detection accuracy between the results of the proposed workflow, with its two Autoencoder models, and the single lead delineator presented in [
14], the CNN sing PhysioNet database [
15], the onset prediction system of atrial fibrillation [
19], the coronary heart disease diagnostic system [
24], the pediatric ventricular pre-excitation detector [
27], and the isovolumic moment (IM) peak detector [
31].


