
Automated—Mechanical Procedure Compared to Gentle Enzymatic Tissue Dissociation in Cell Function Studies

 ,
, 
 , , , , and
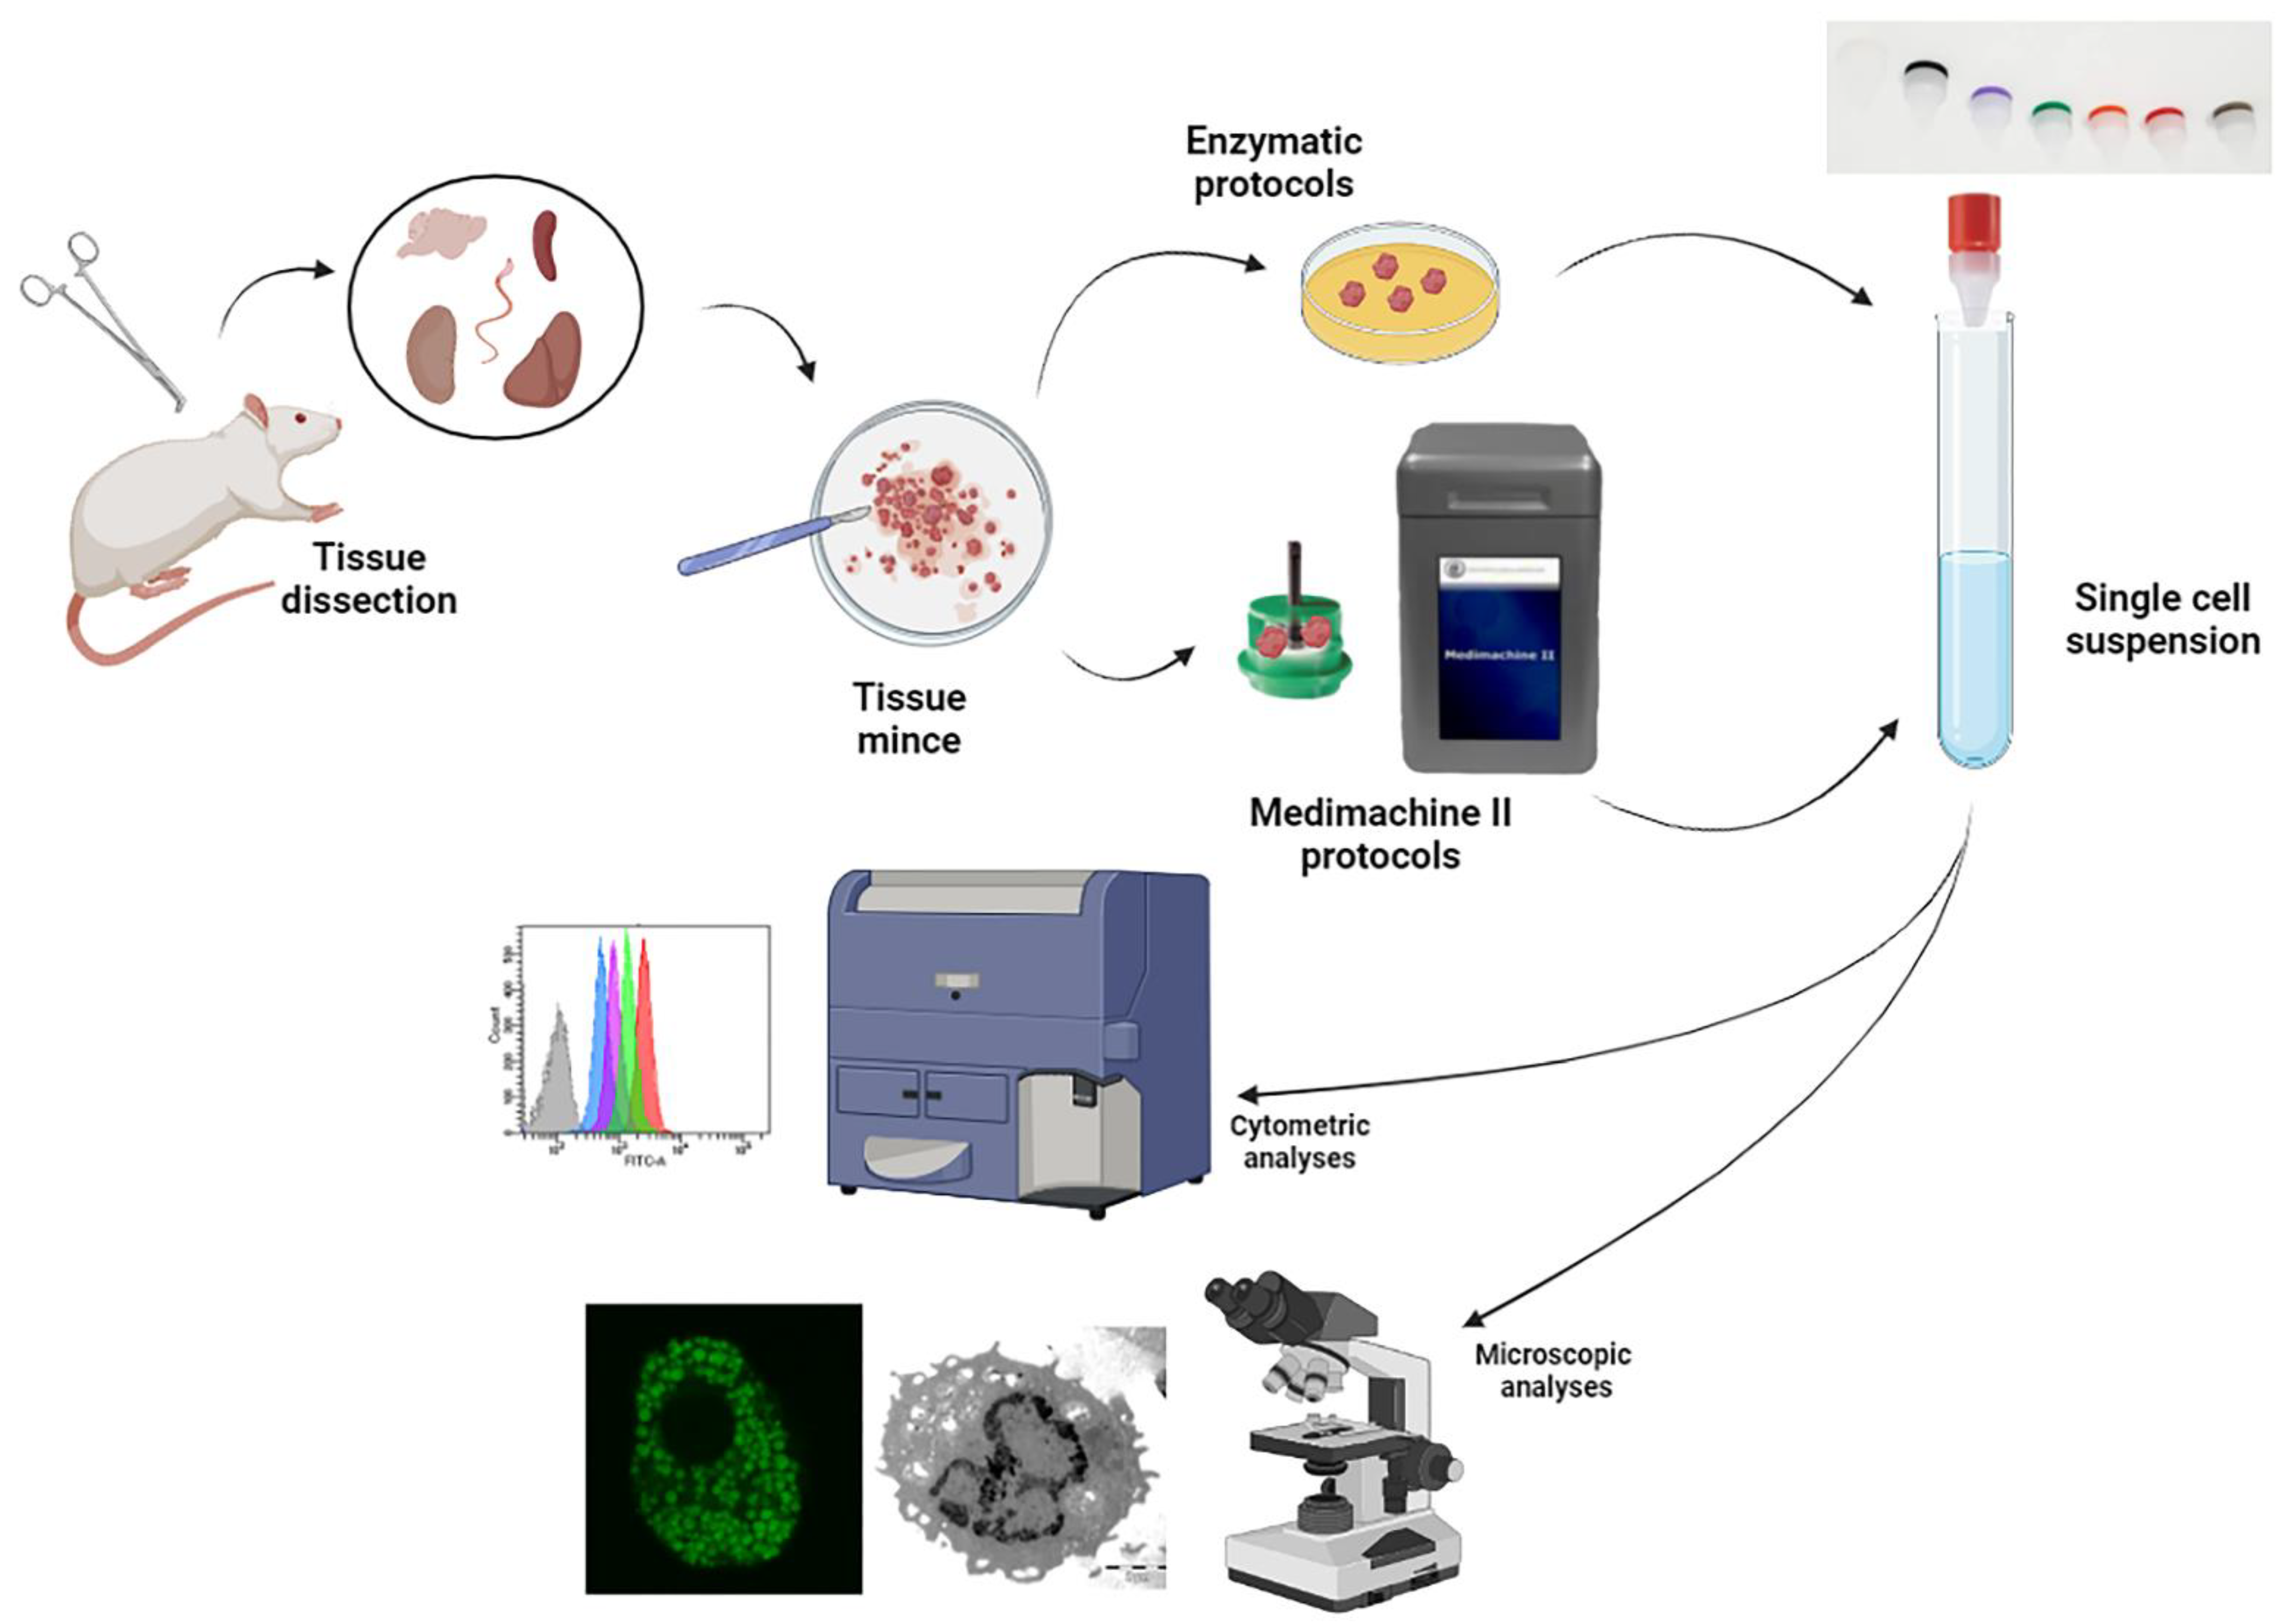
Abstract
:1. Introduction
2. Materials and Methods
2.1. Animals
2.2. Cell Suspension Preparation
2.3. Flow Cytometric Analyses on Fresh Samples
2.4. Flow Cytometric DNA Content Evaluation on Ethanol-Fixed Cells
2.5. Confocal Microscopy Analysis and Transmission Electron Microscopy (TEM)
2.6. Statistical Analysis
3. Results and Discussion
3.1. Overall Cell Yield
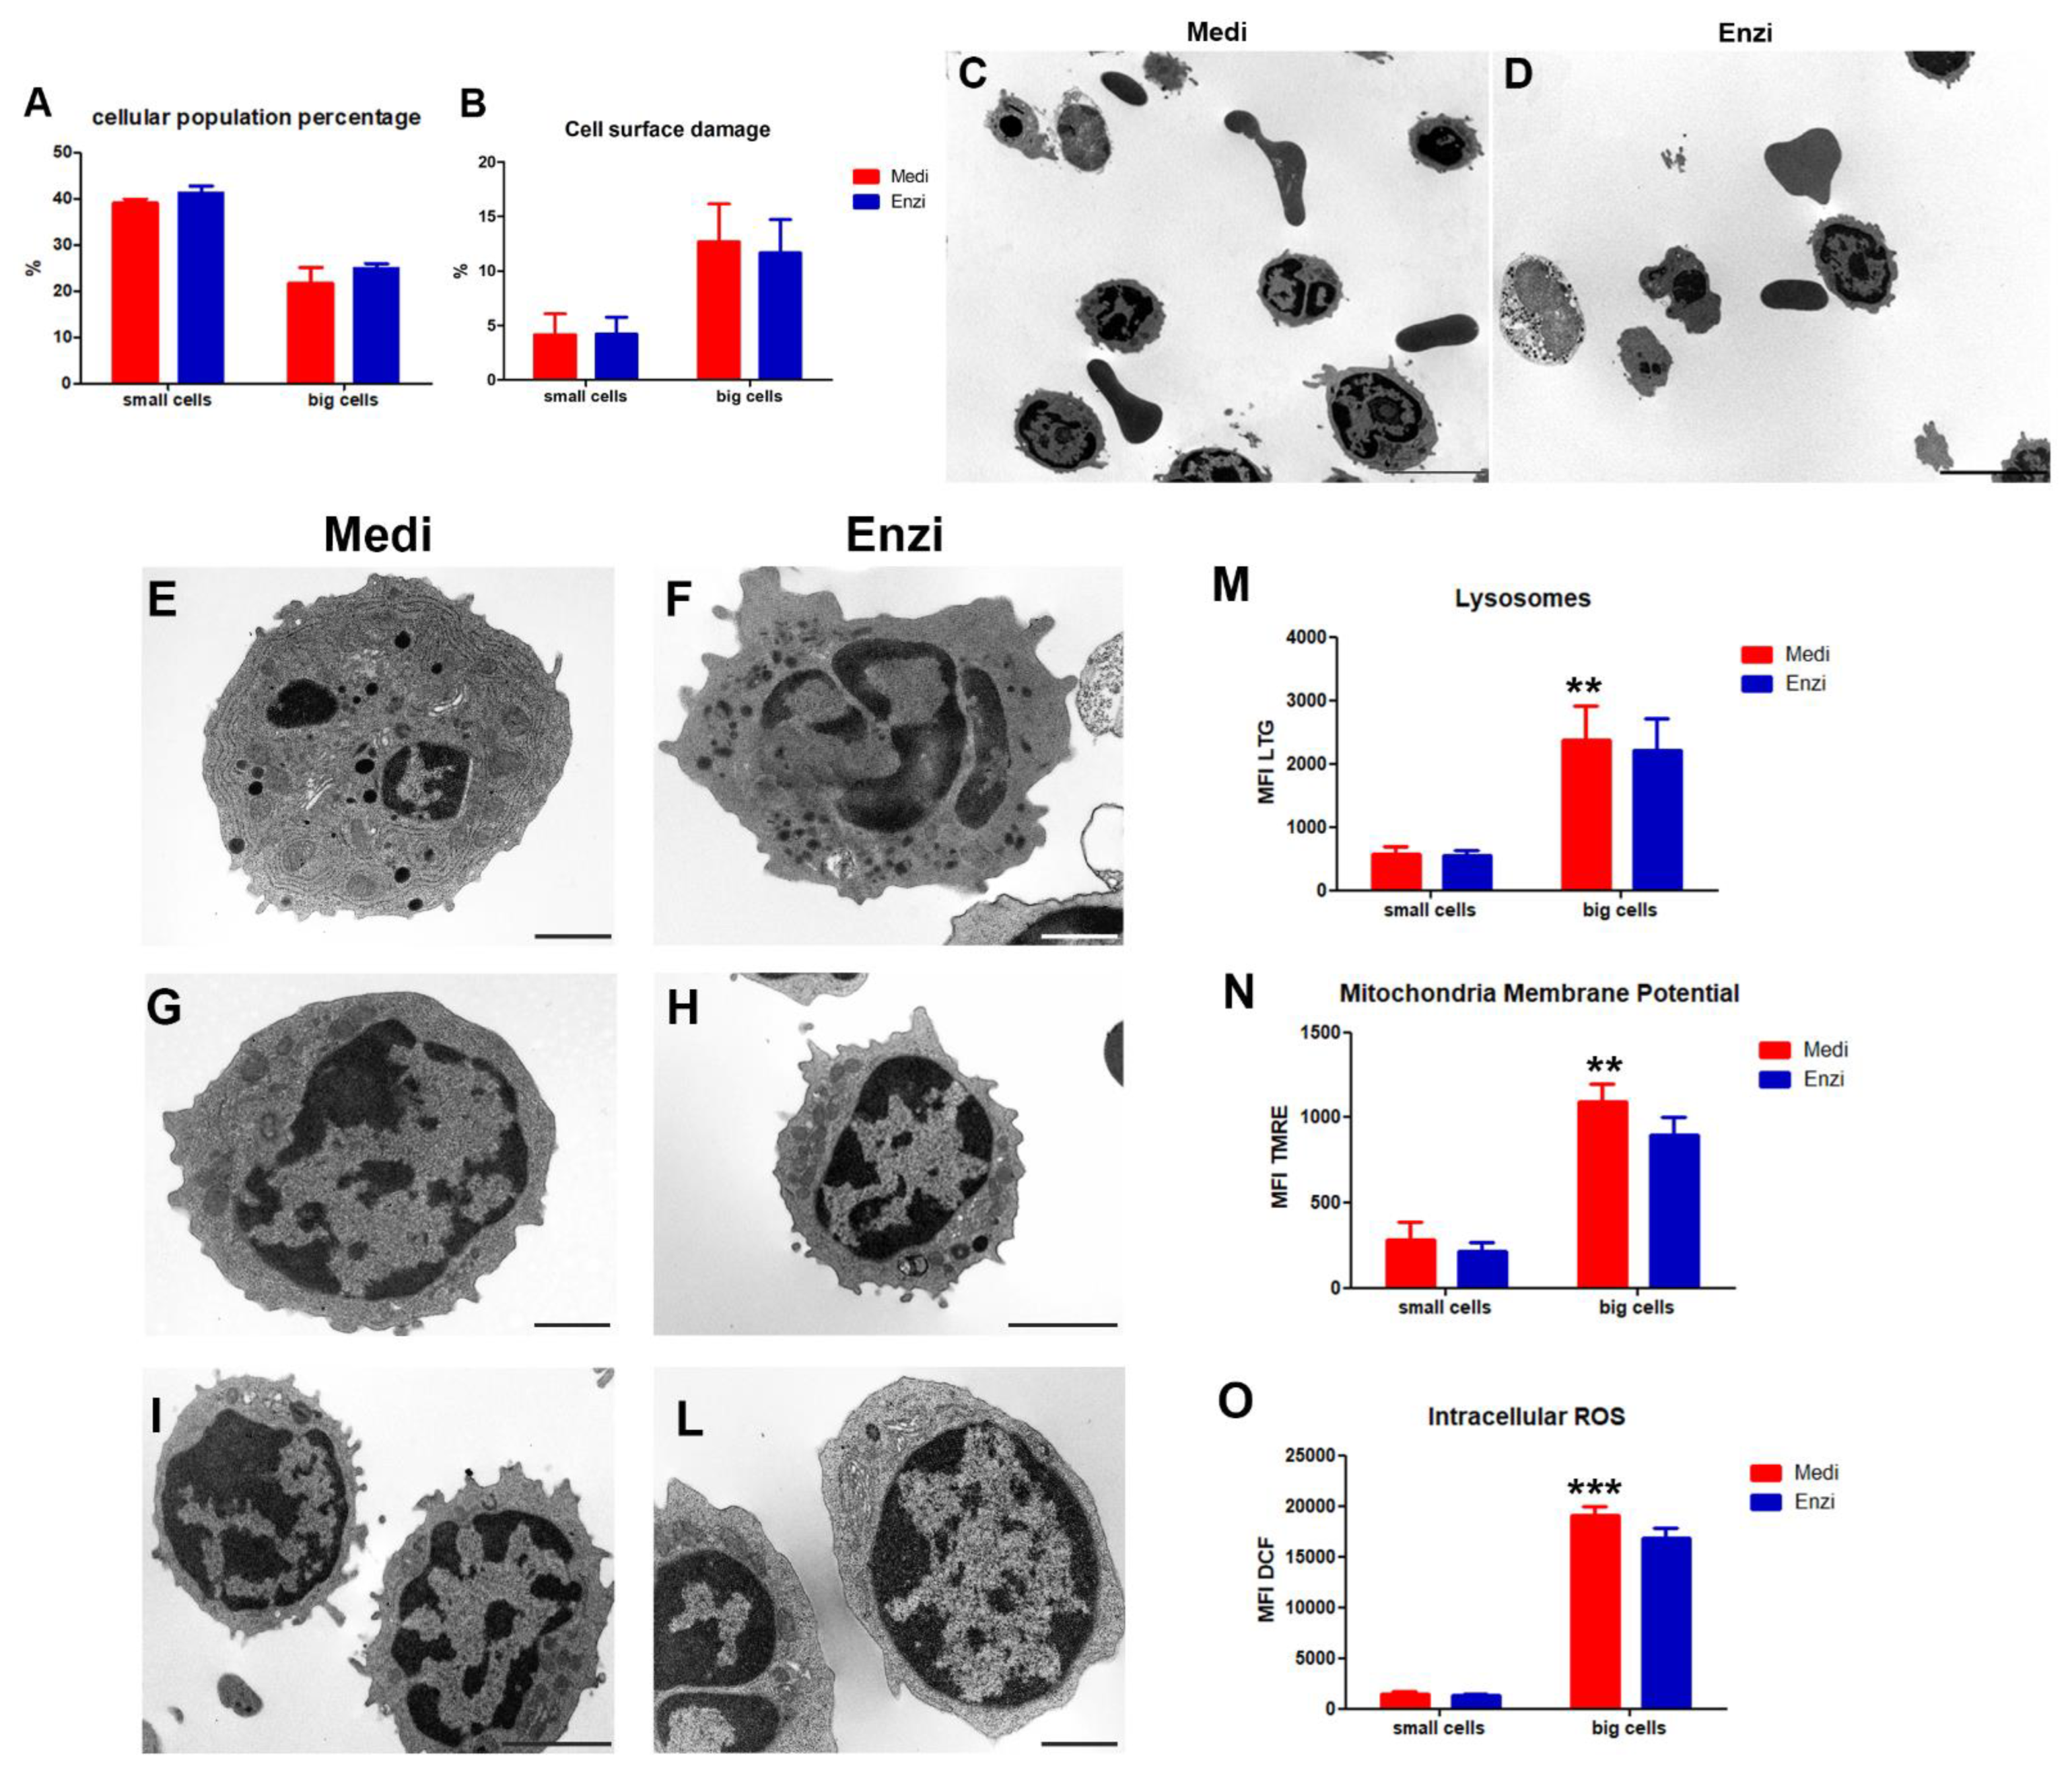
3.2. Spleen
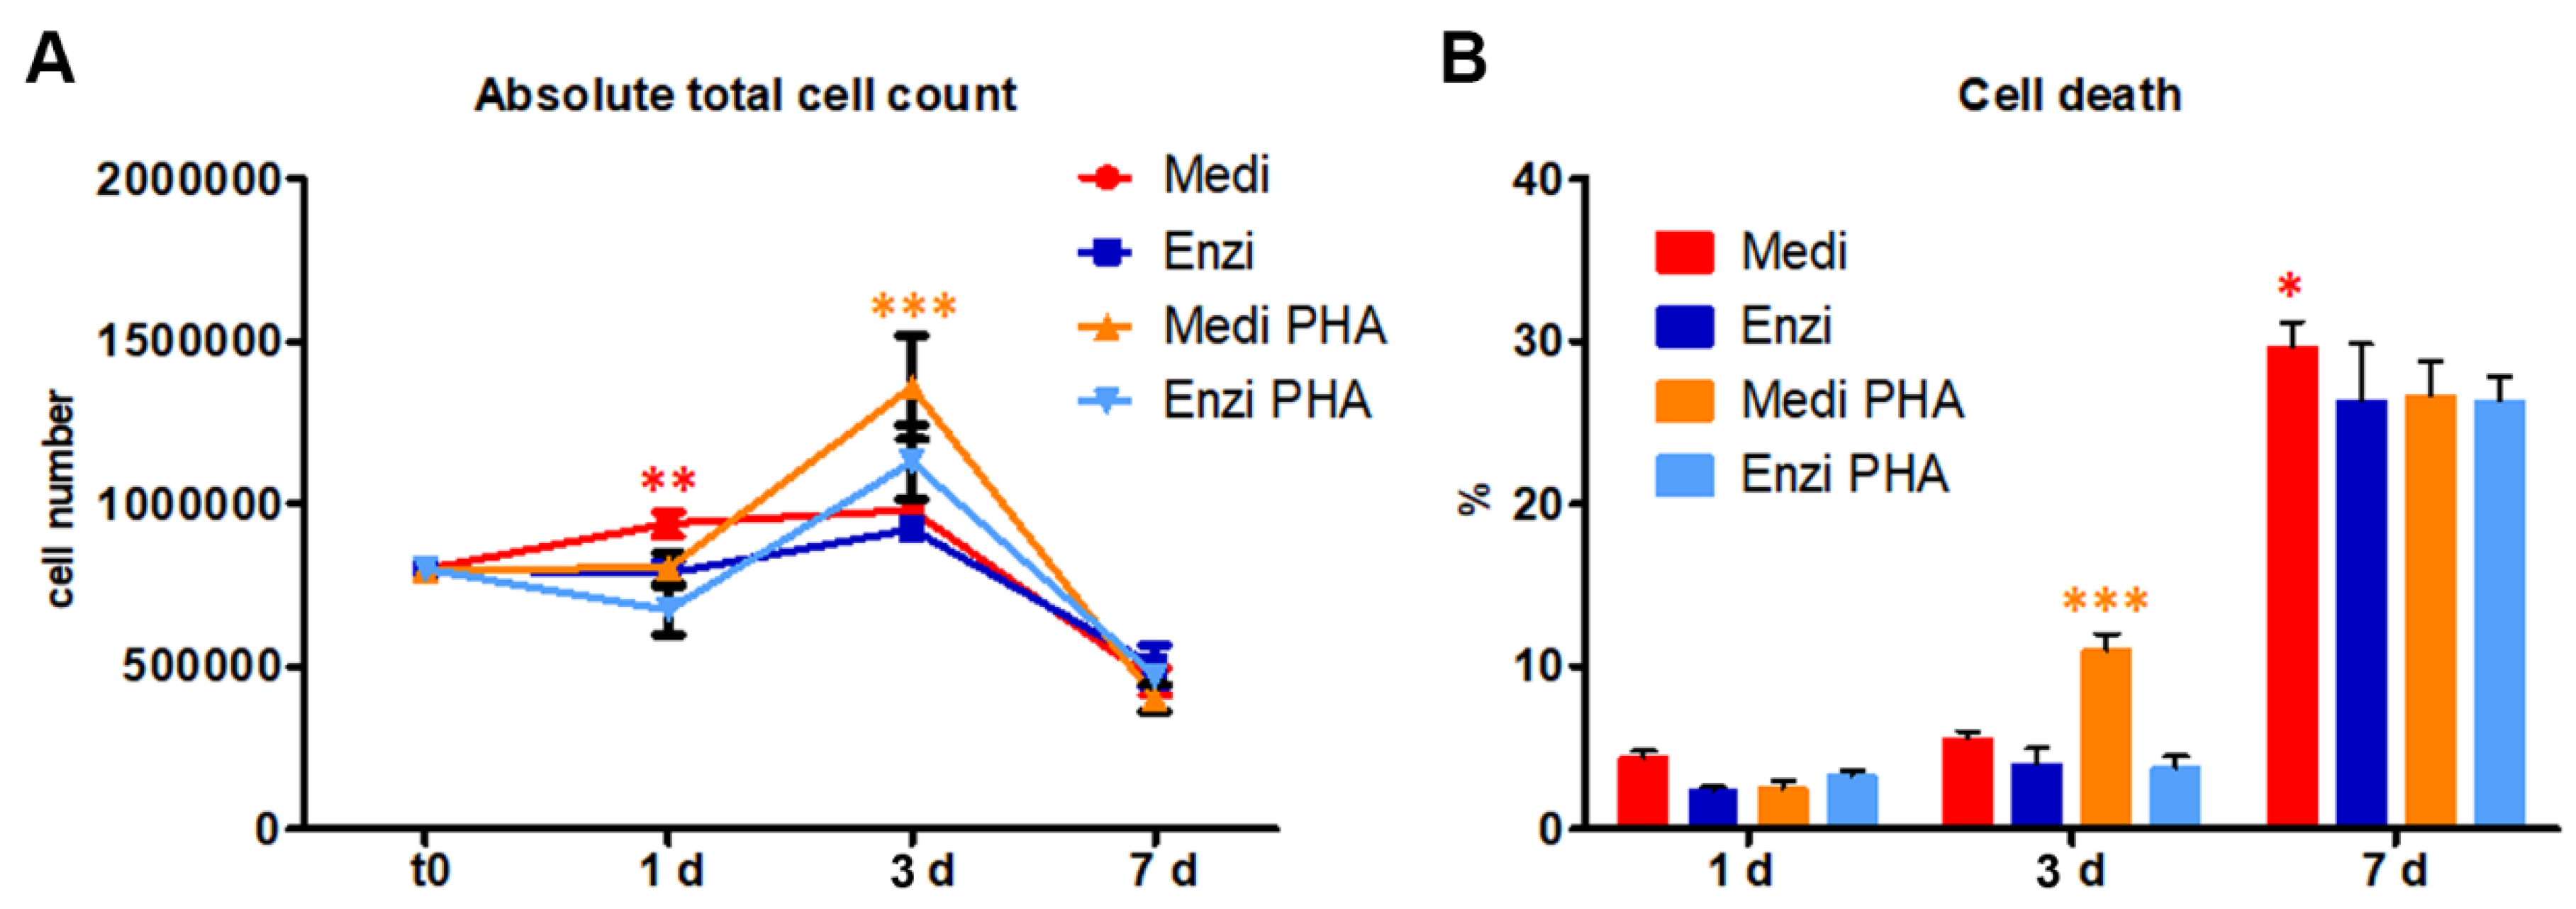
3.2.1. Cultural Assay of Differently Isolated Splenocytes
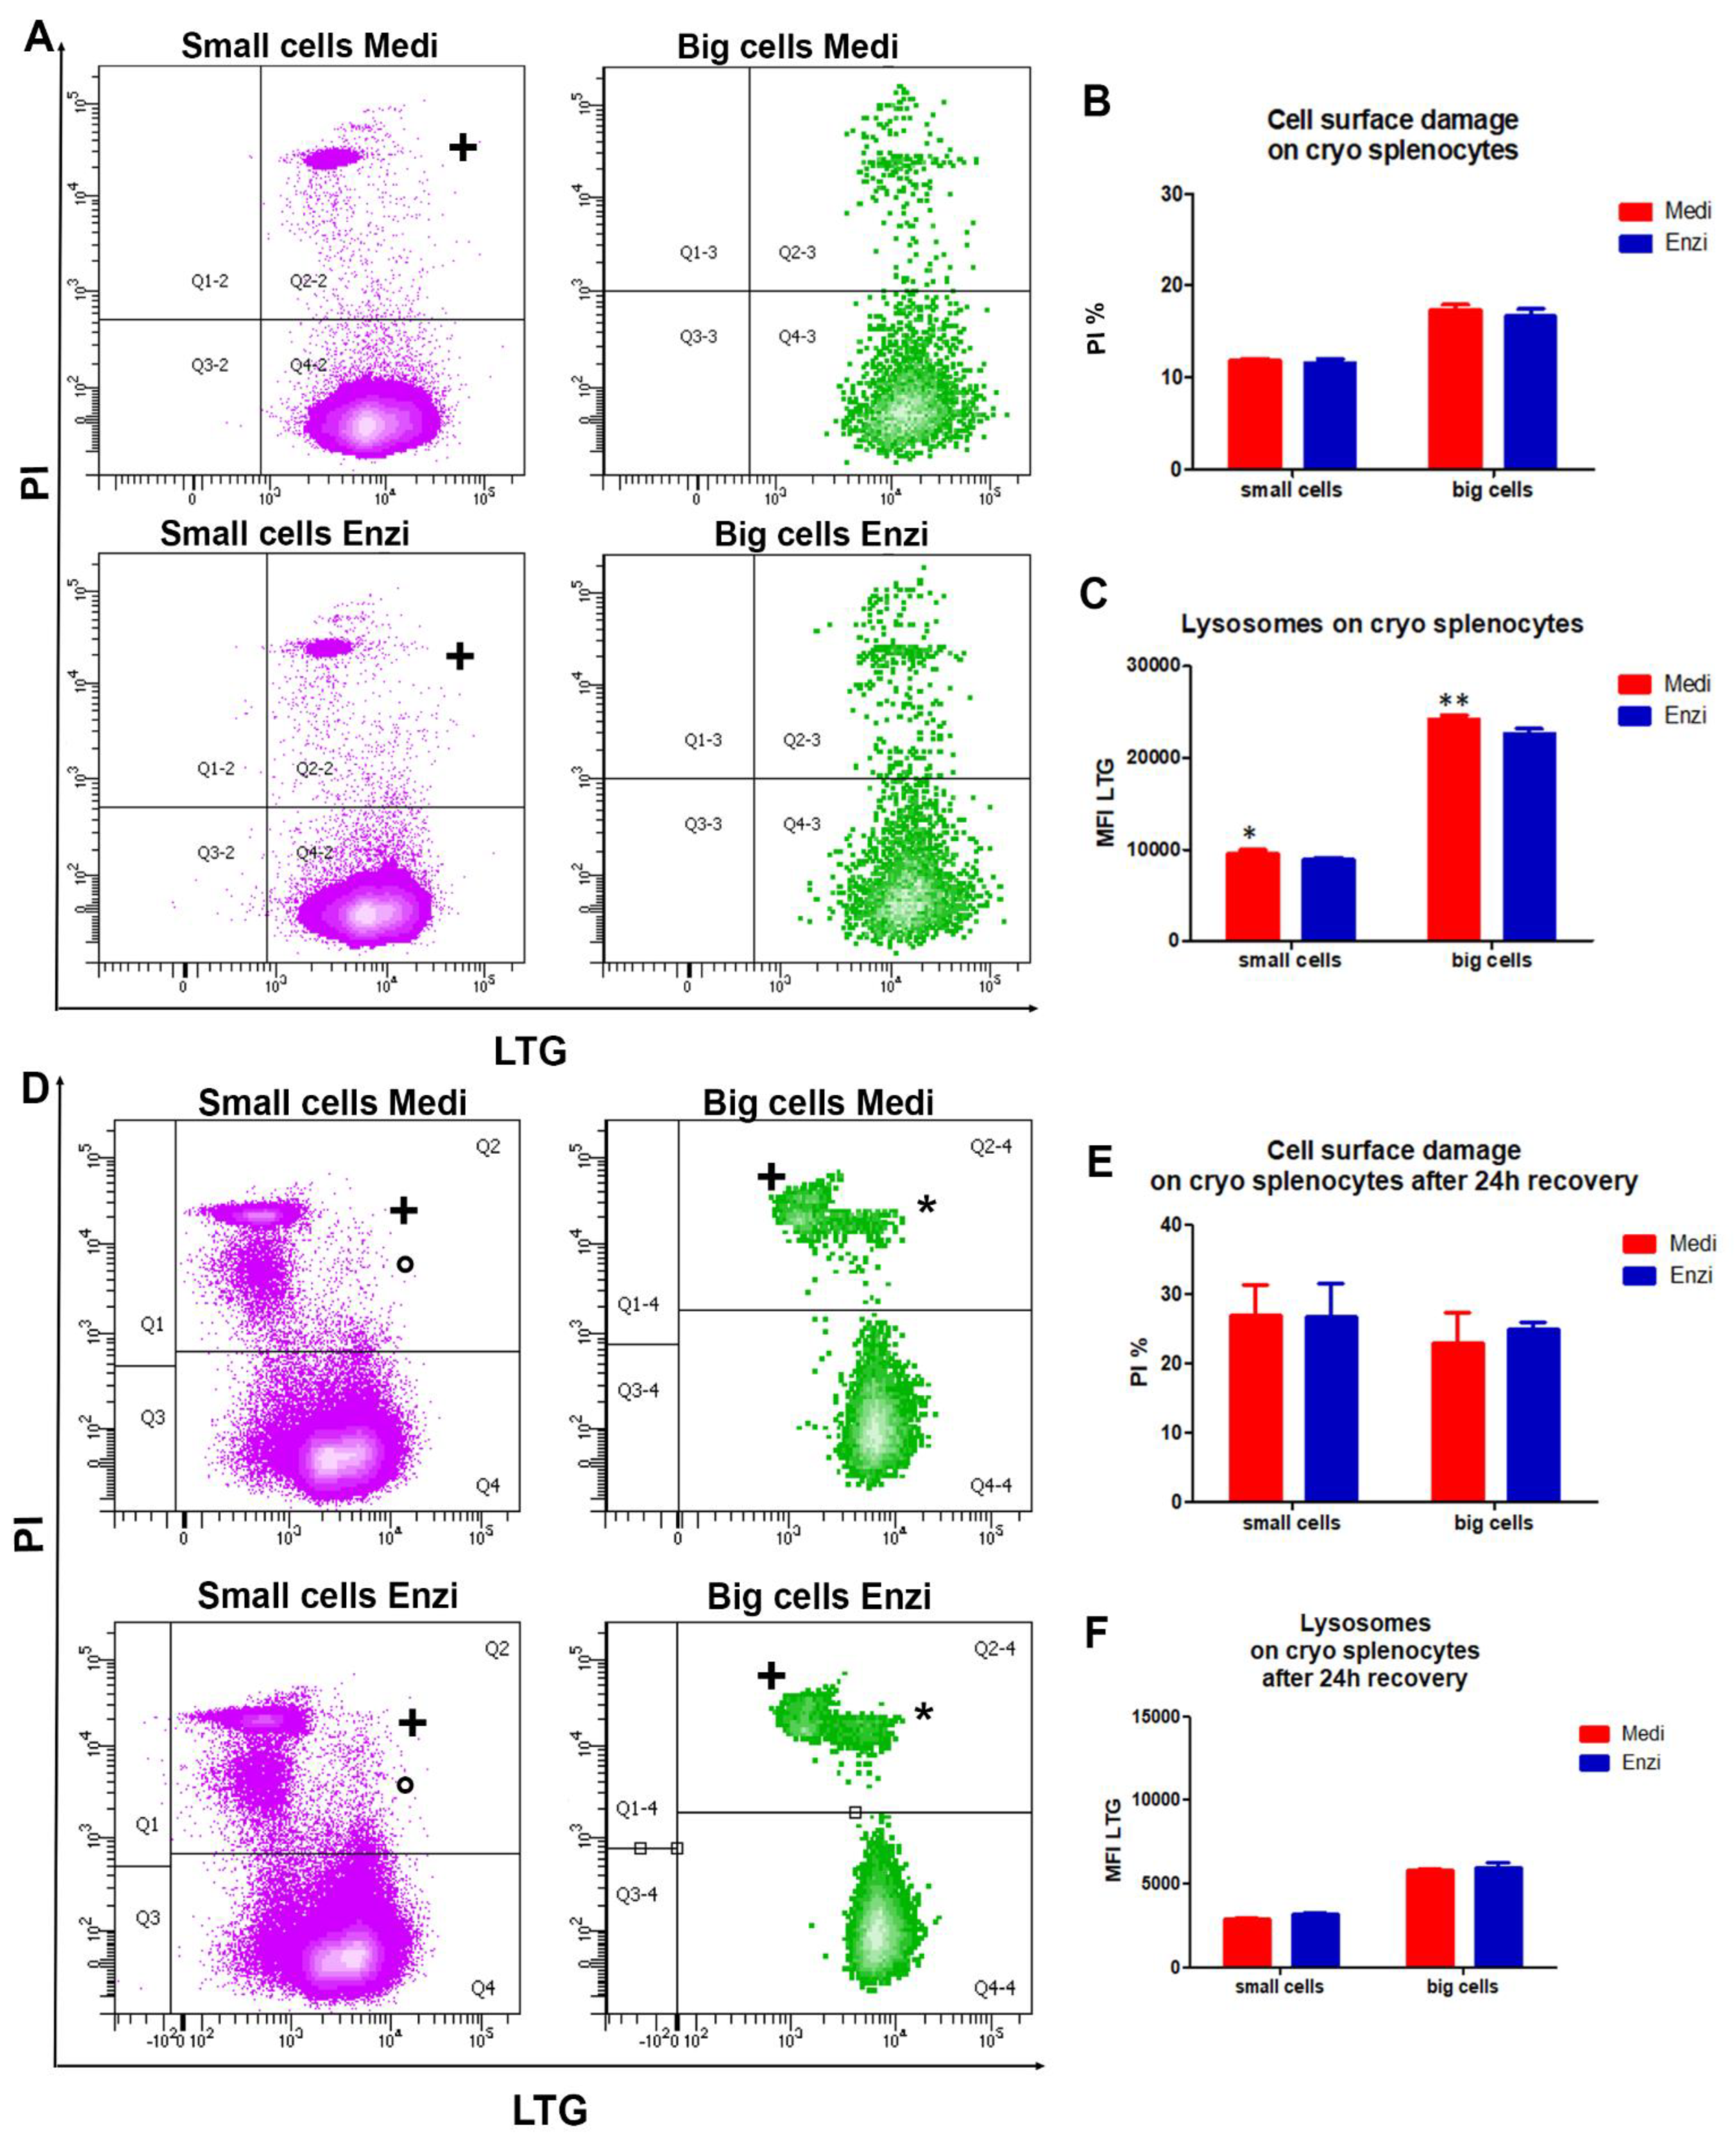
3.2.2. Cell Response of Differently Isolated Splenocytes to Cryopreservation and Thawing
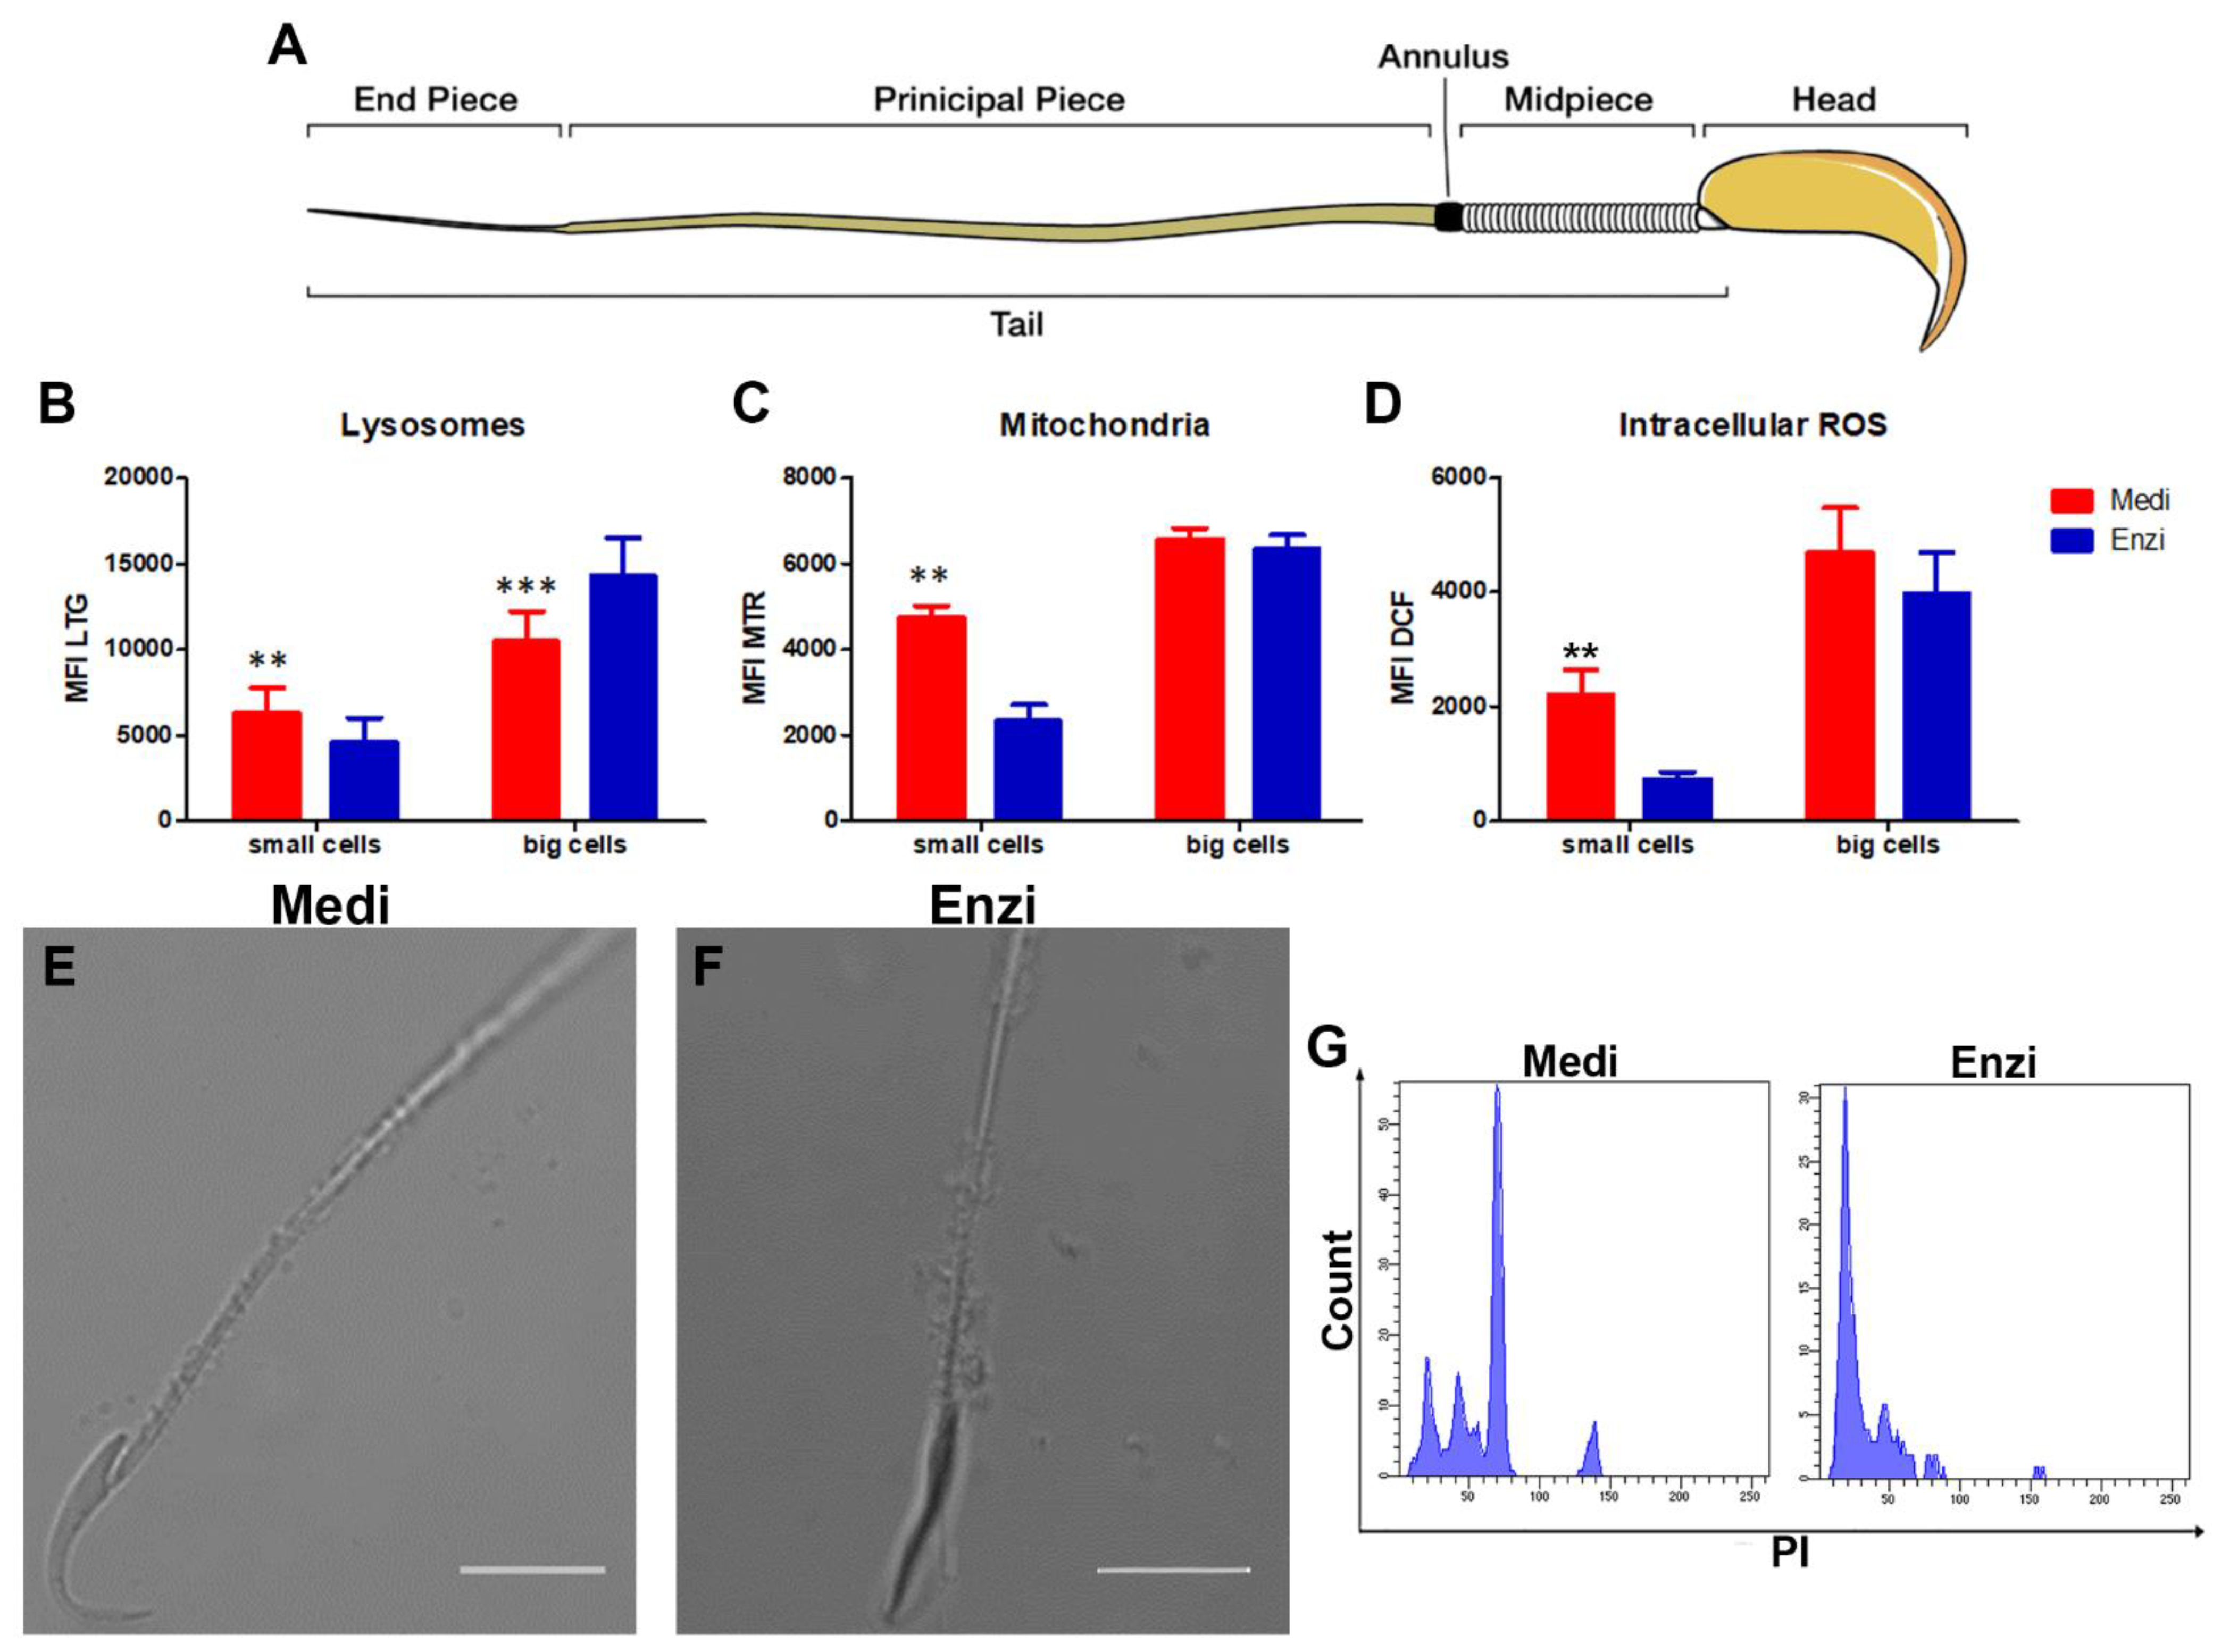
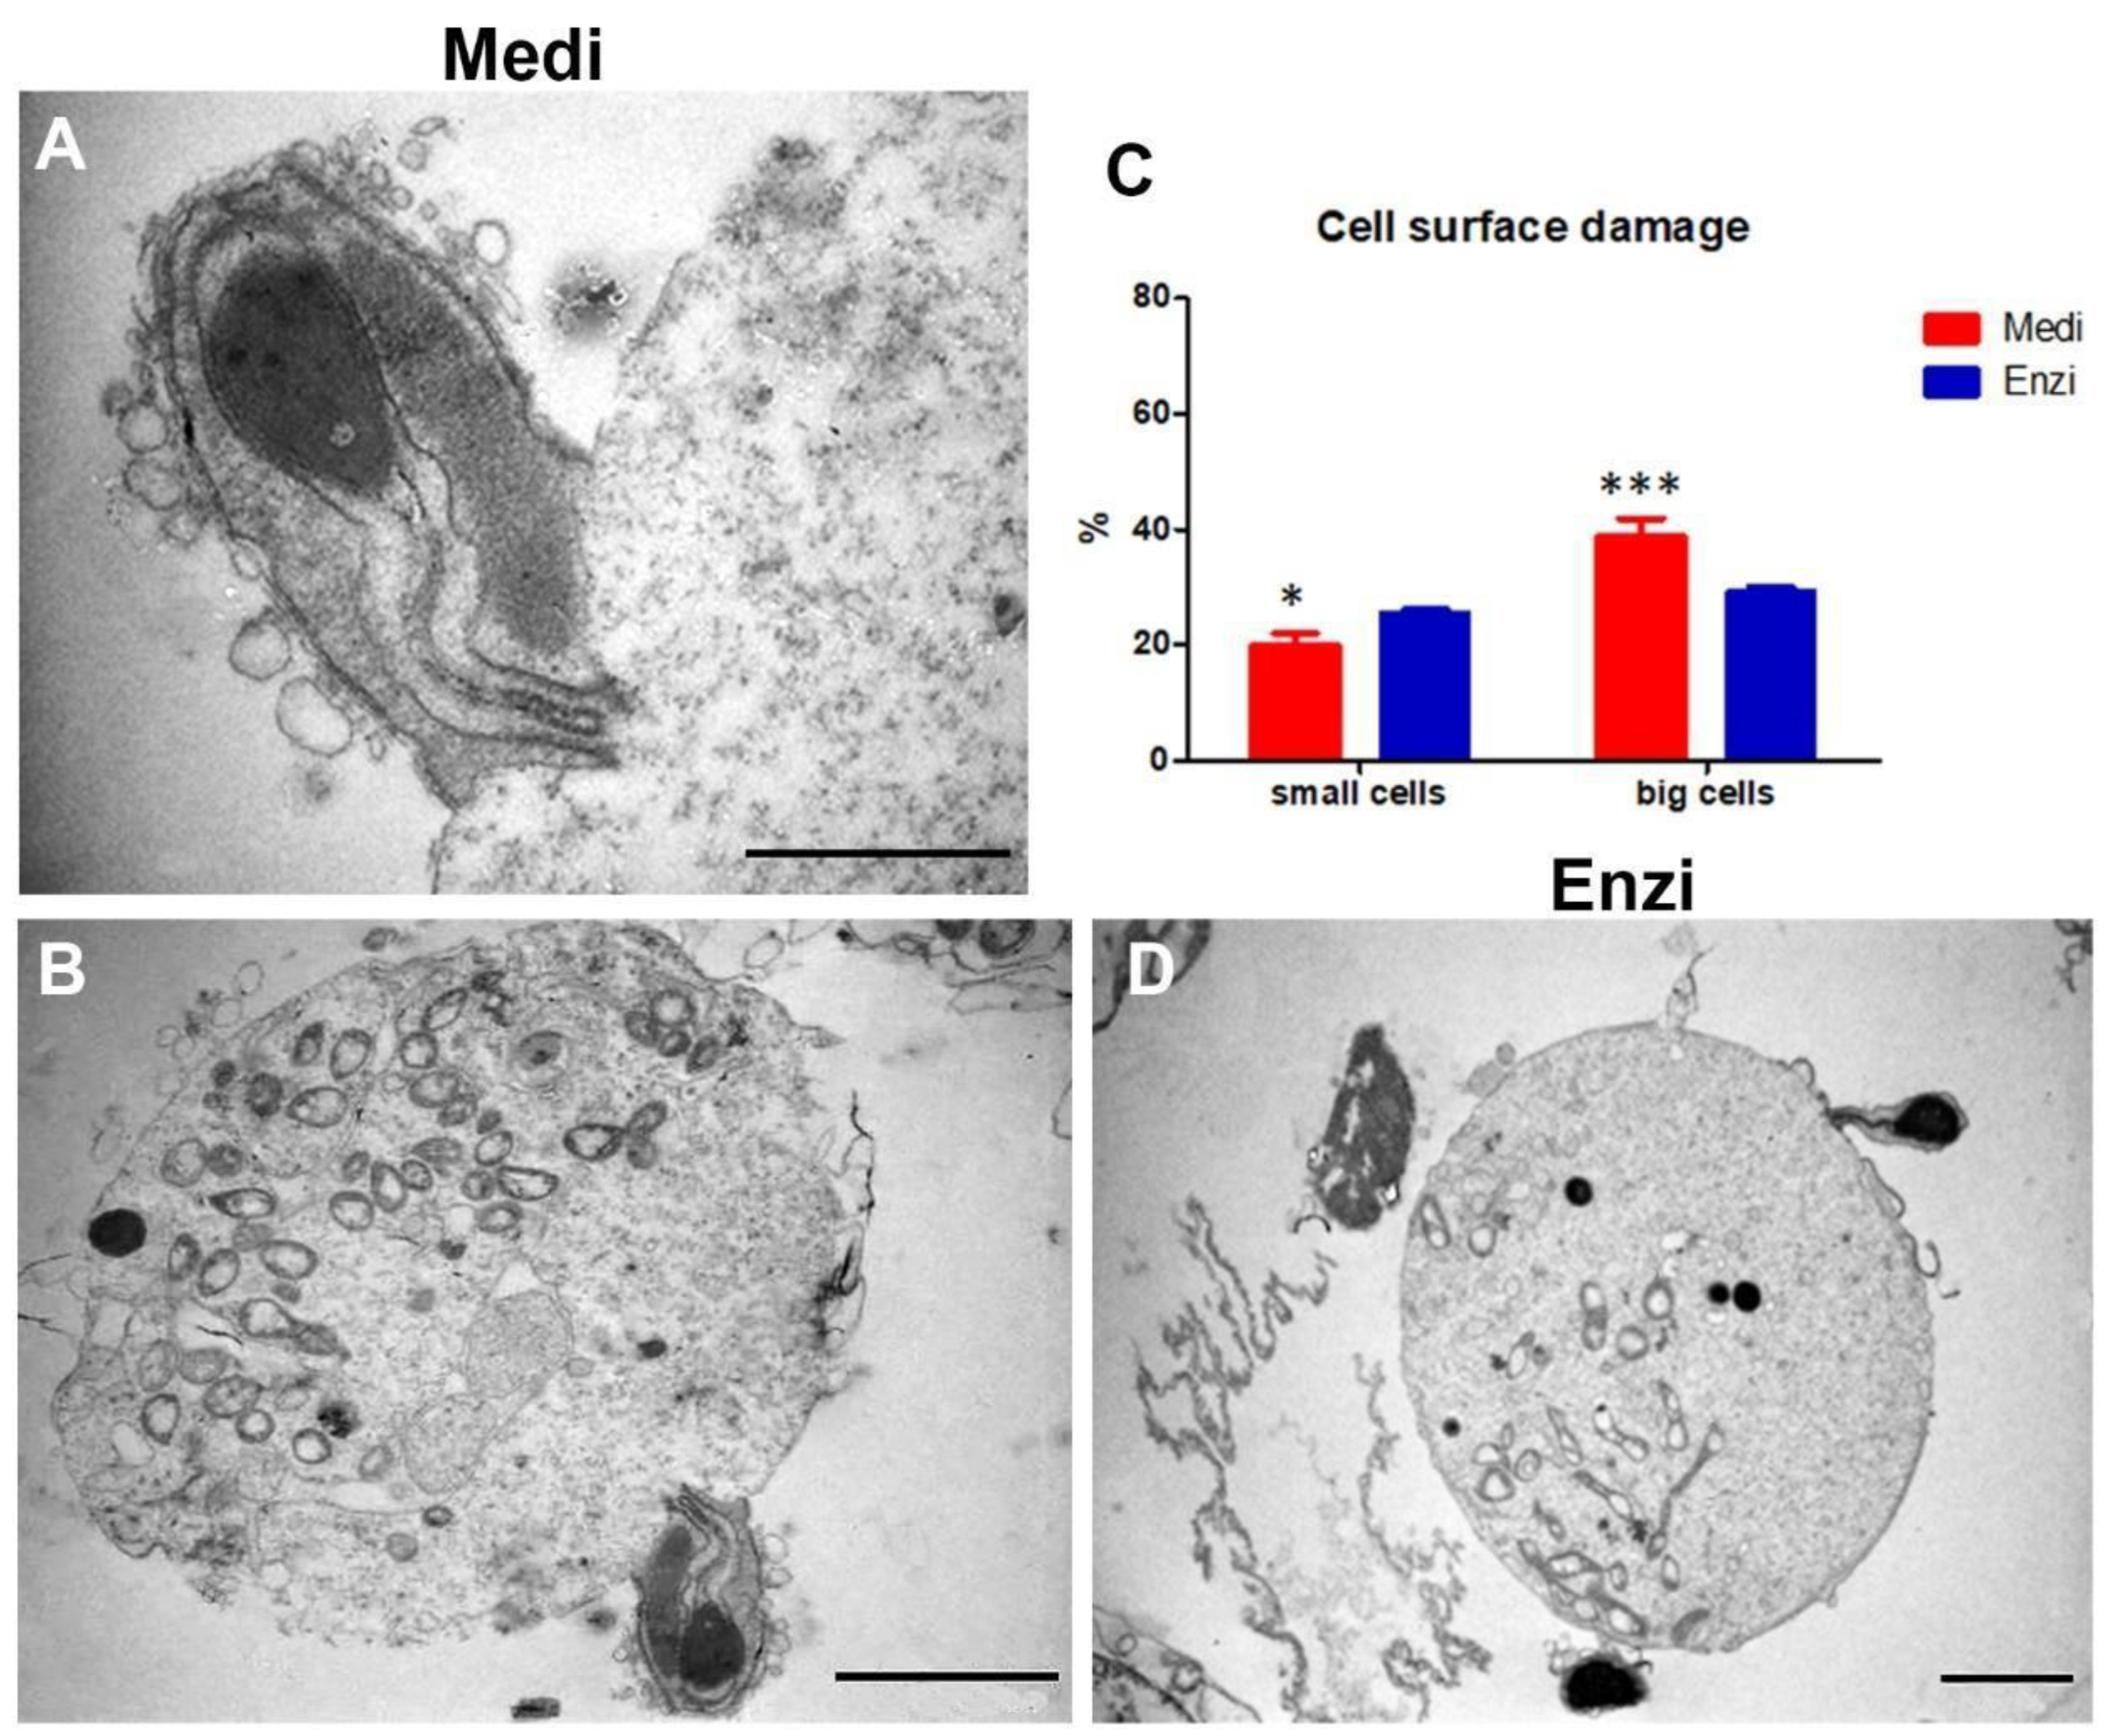
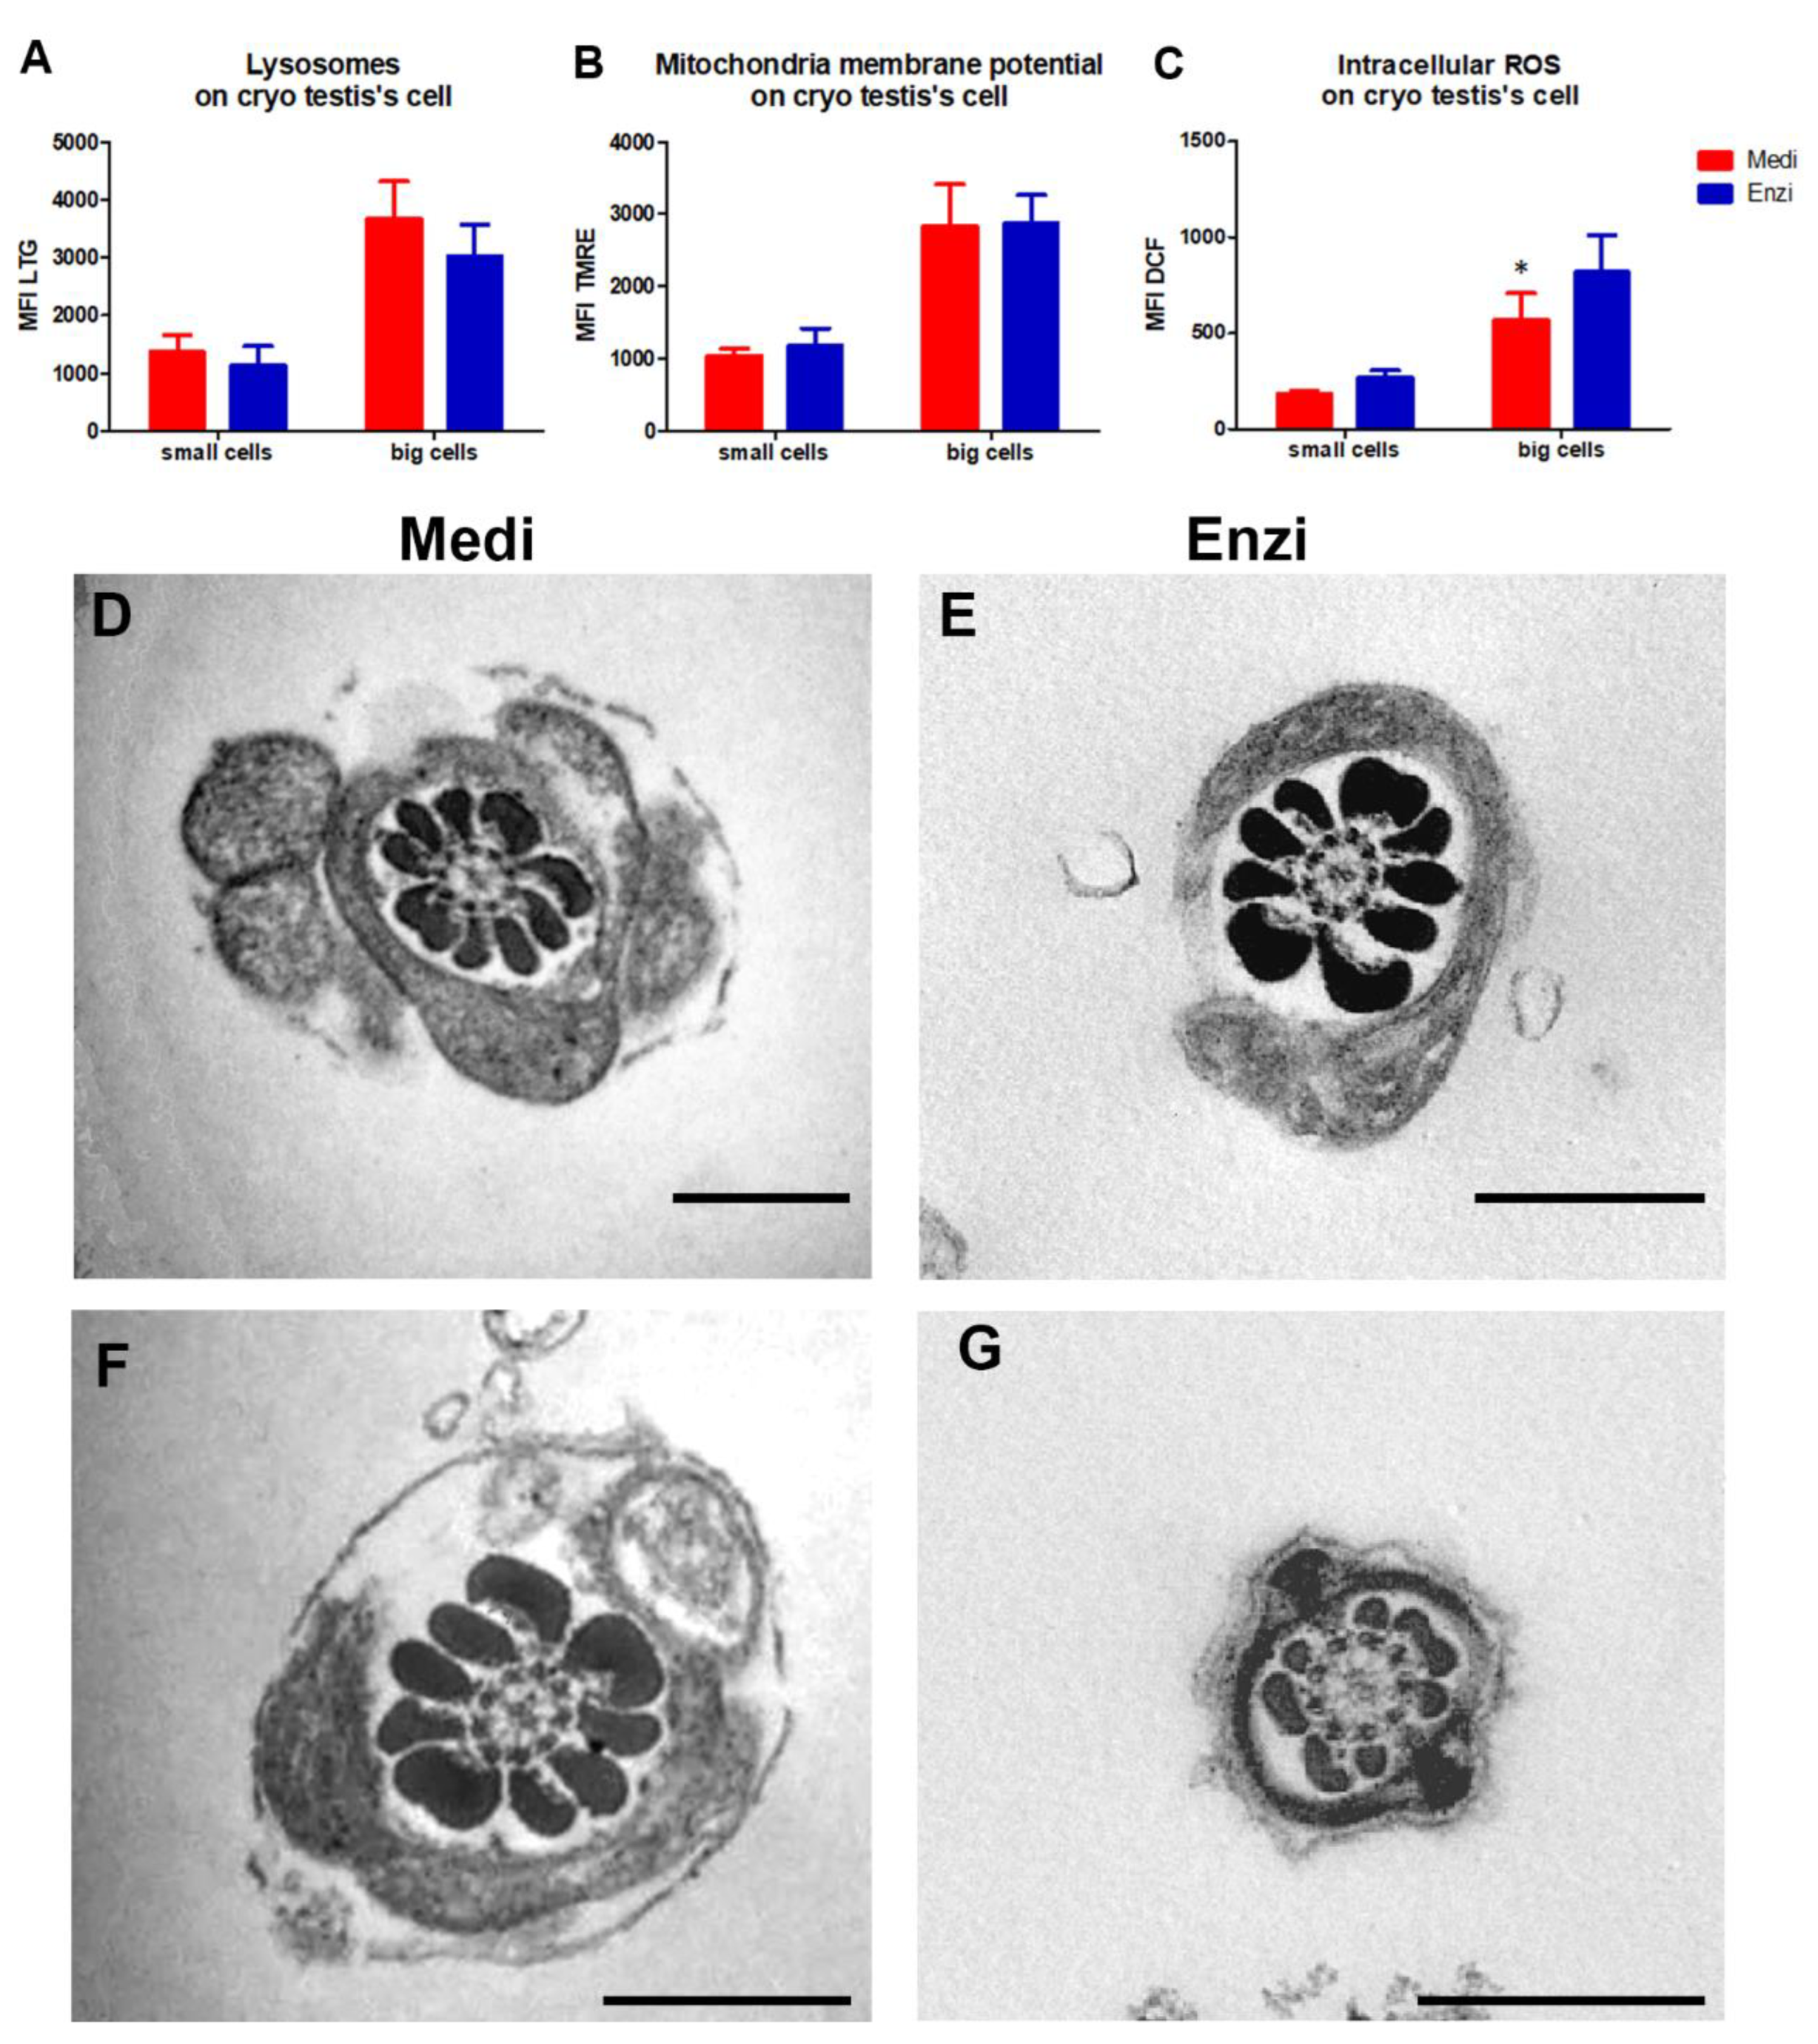
3.3. Testicle
Cell Response of Differently Isolated Testis Cells to Cryopreservation and Thawing
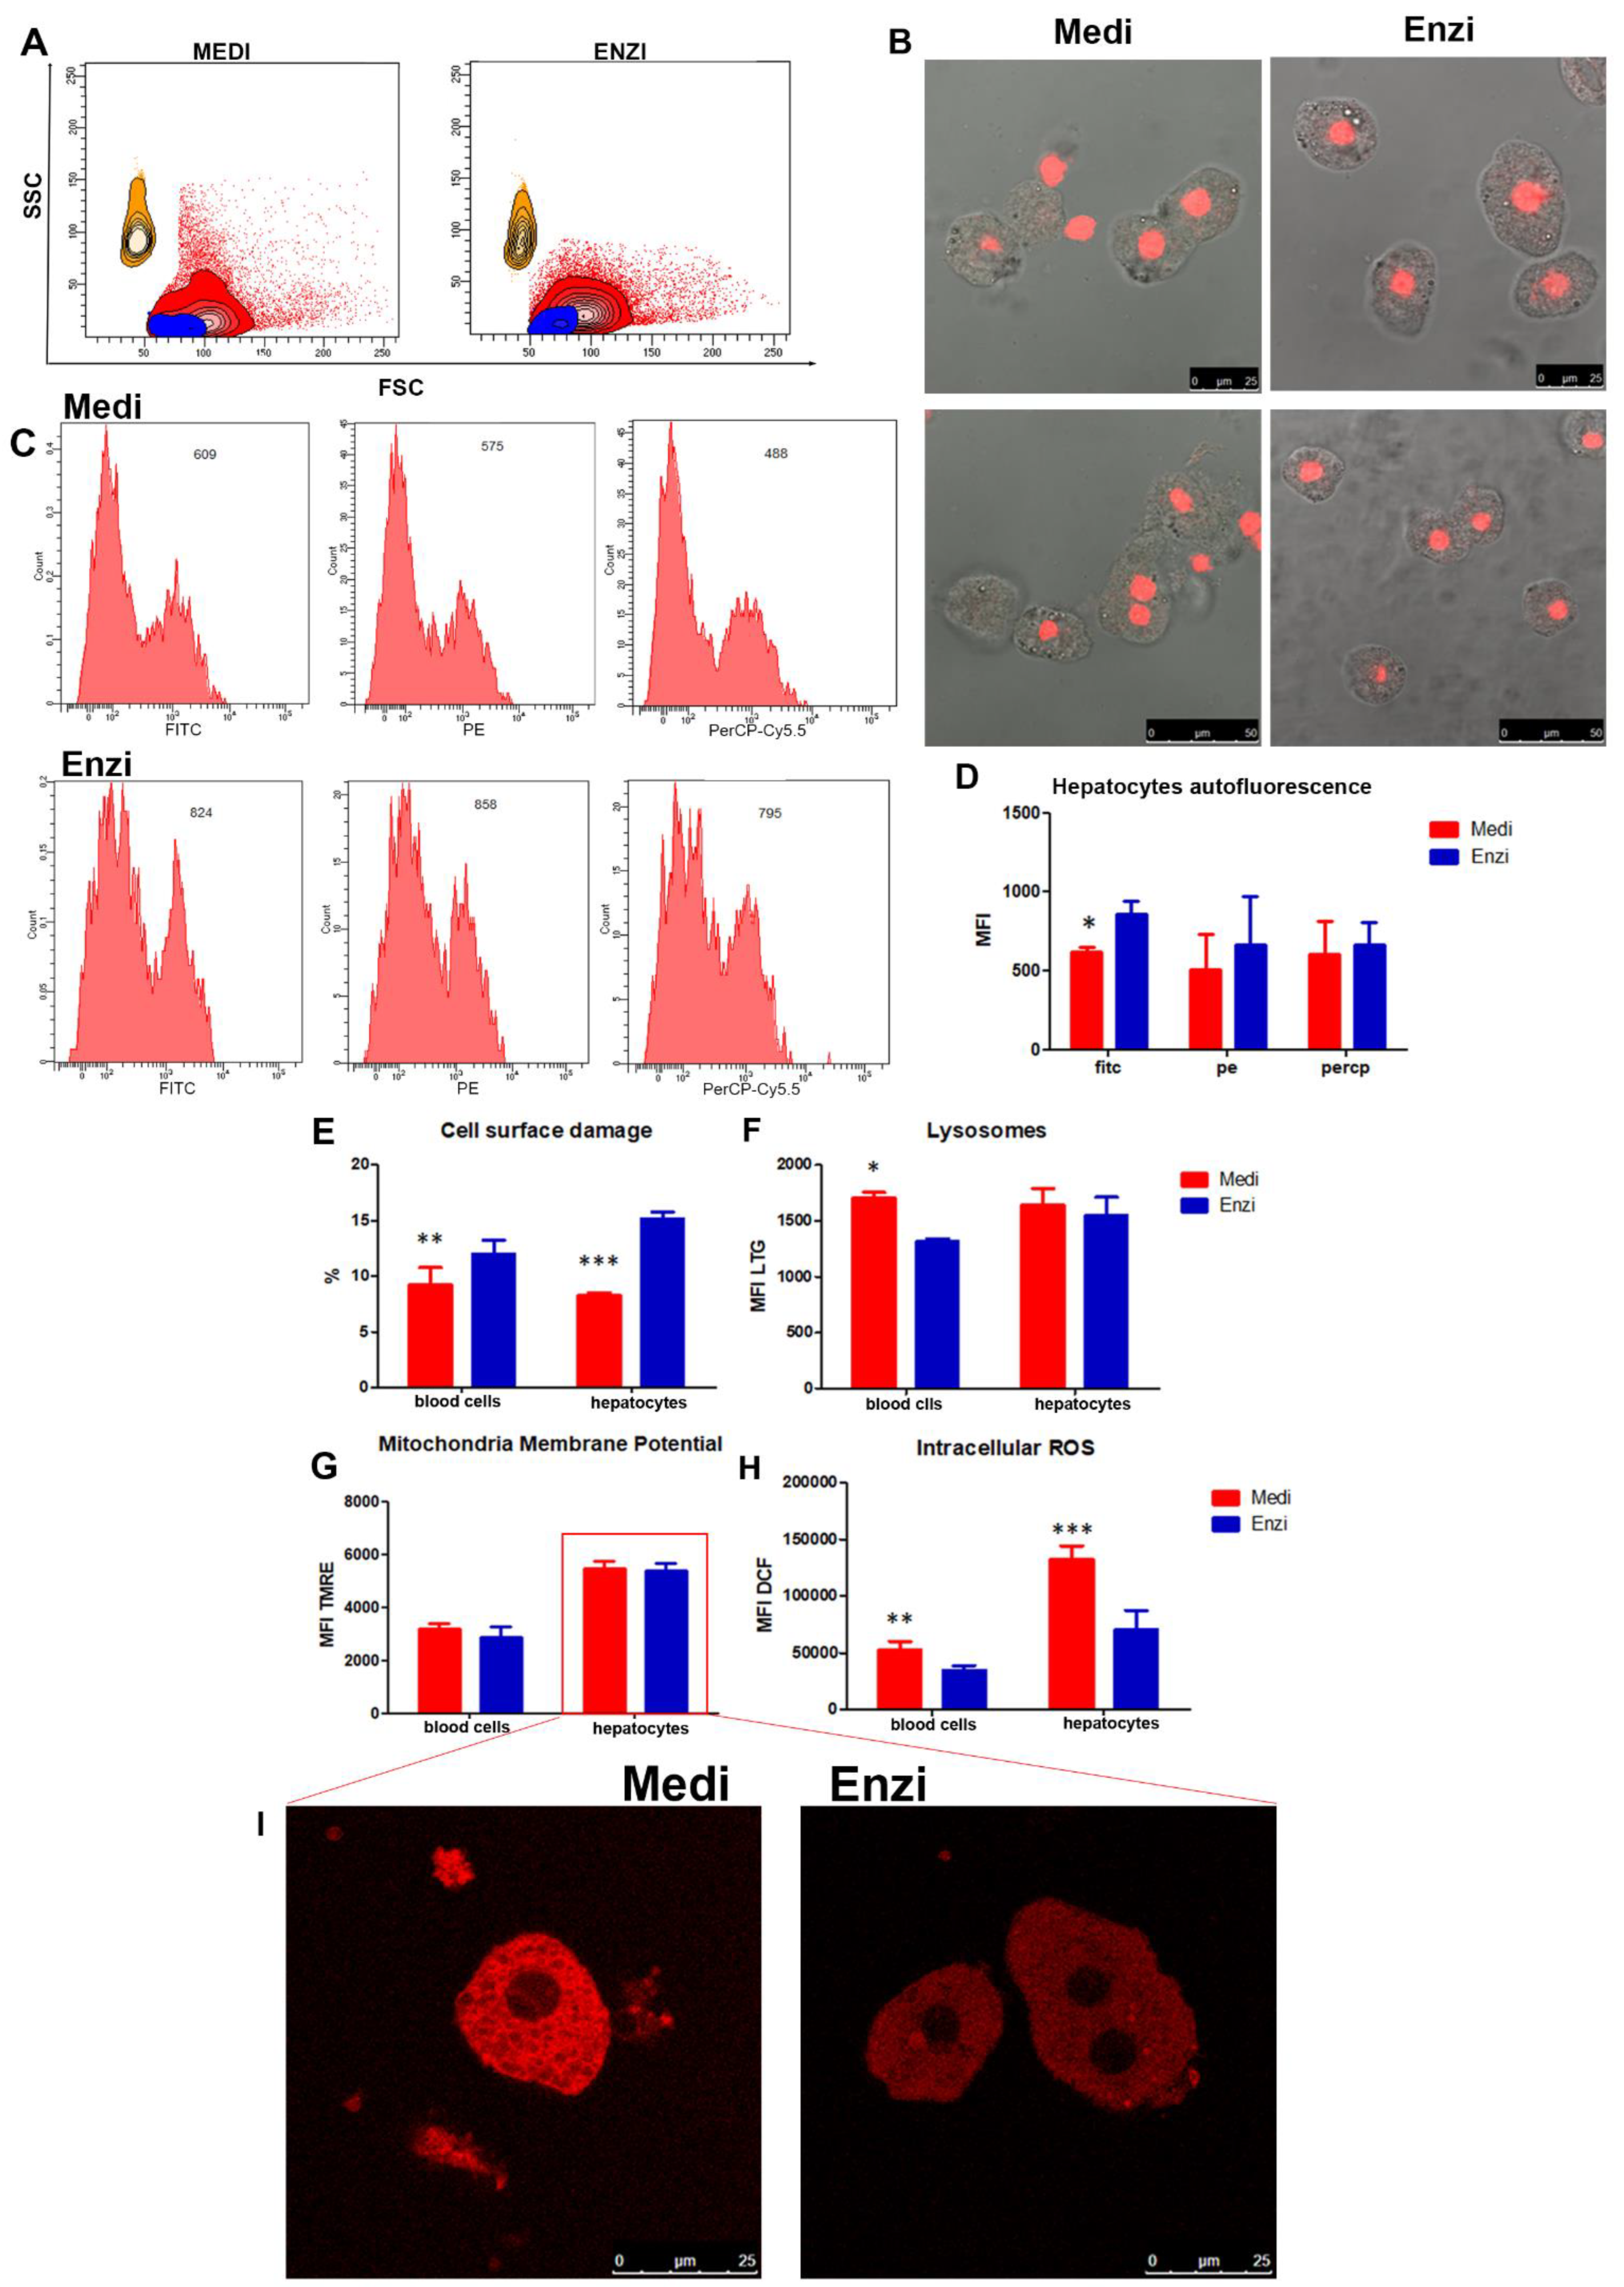
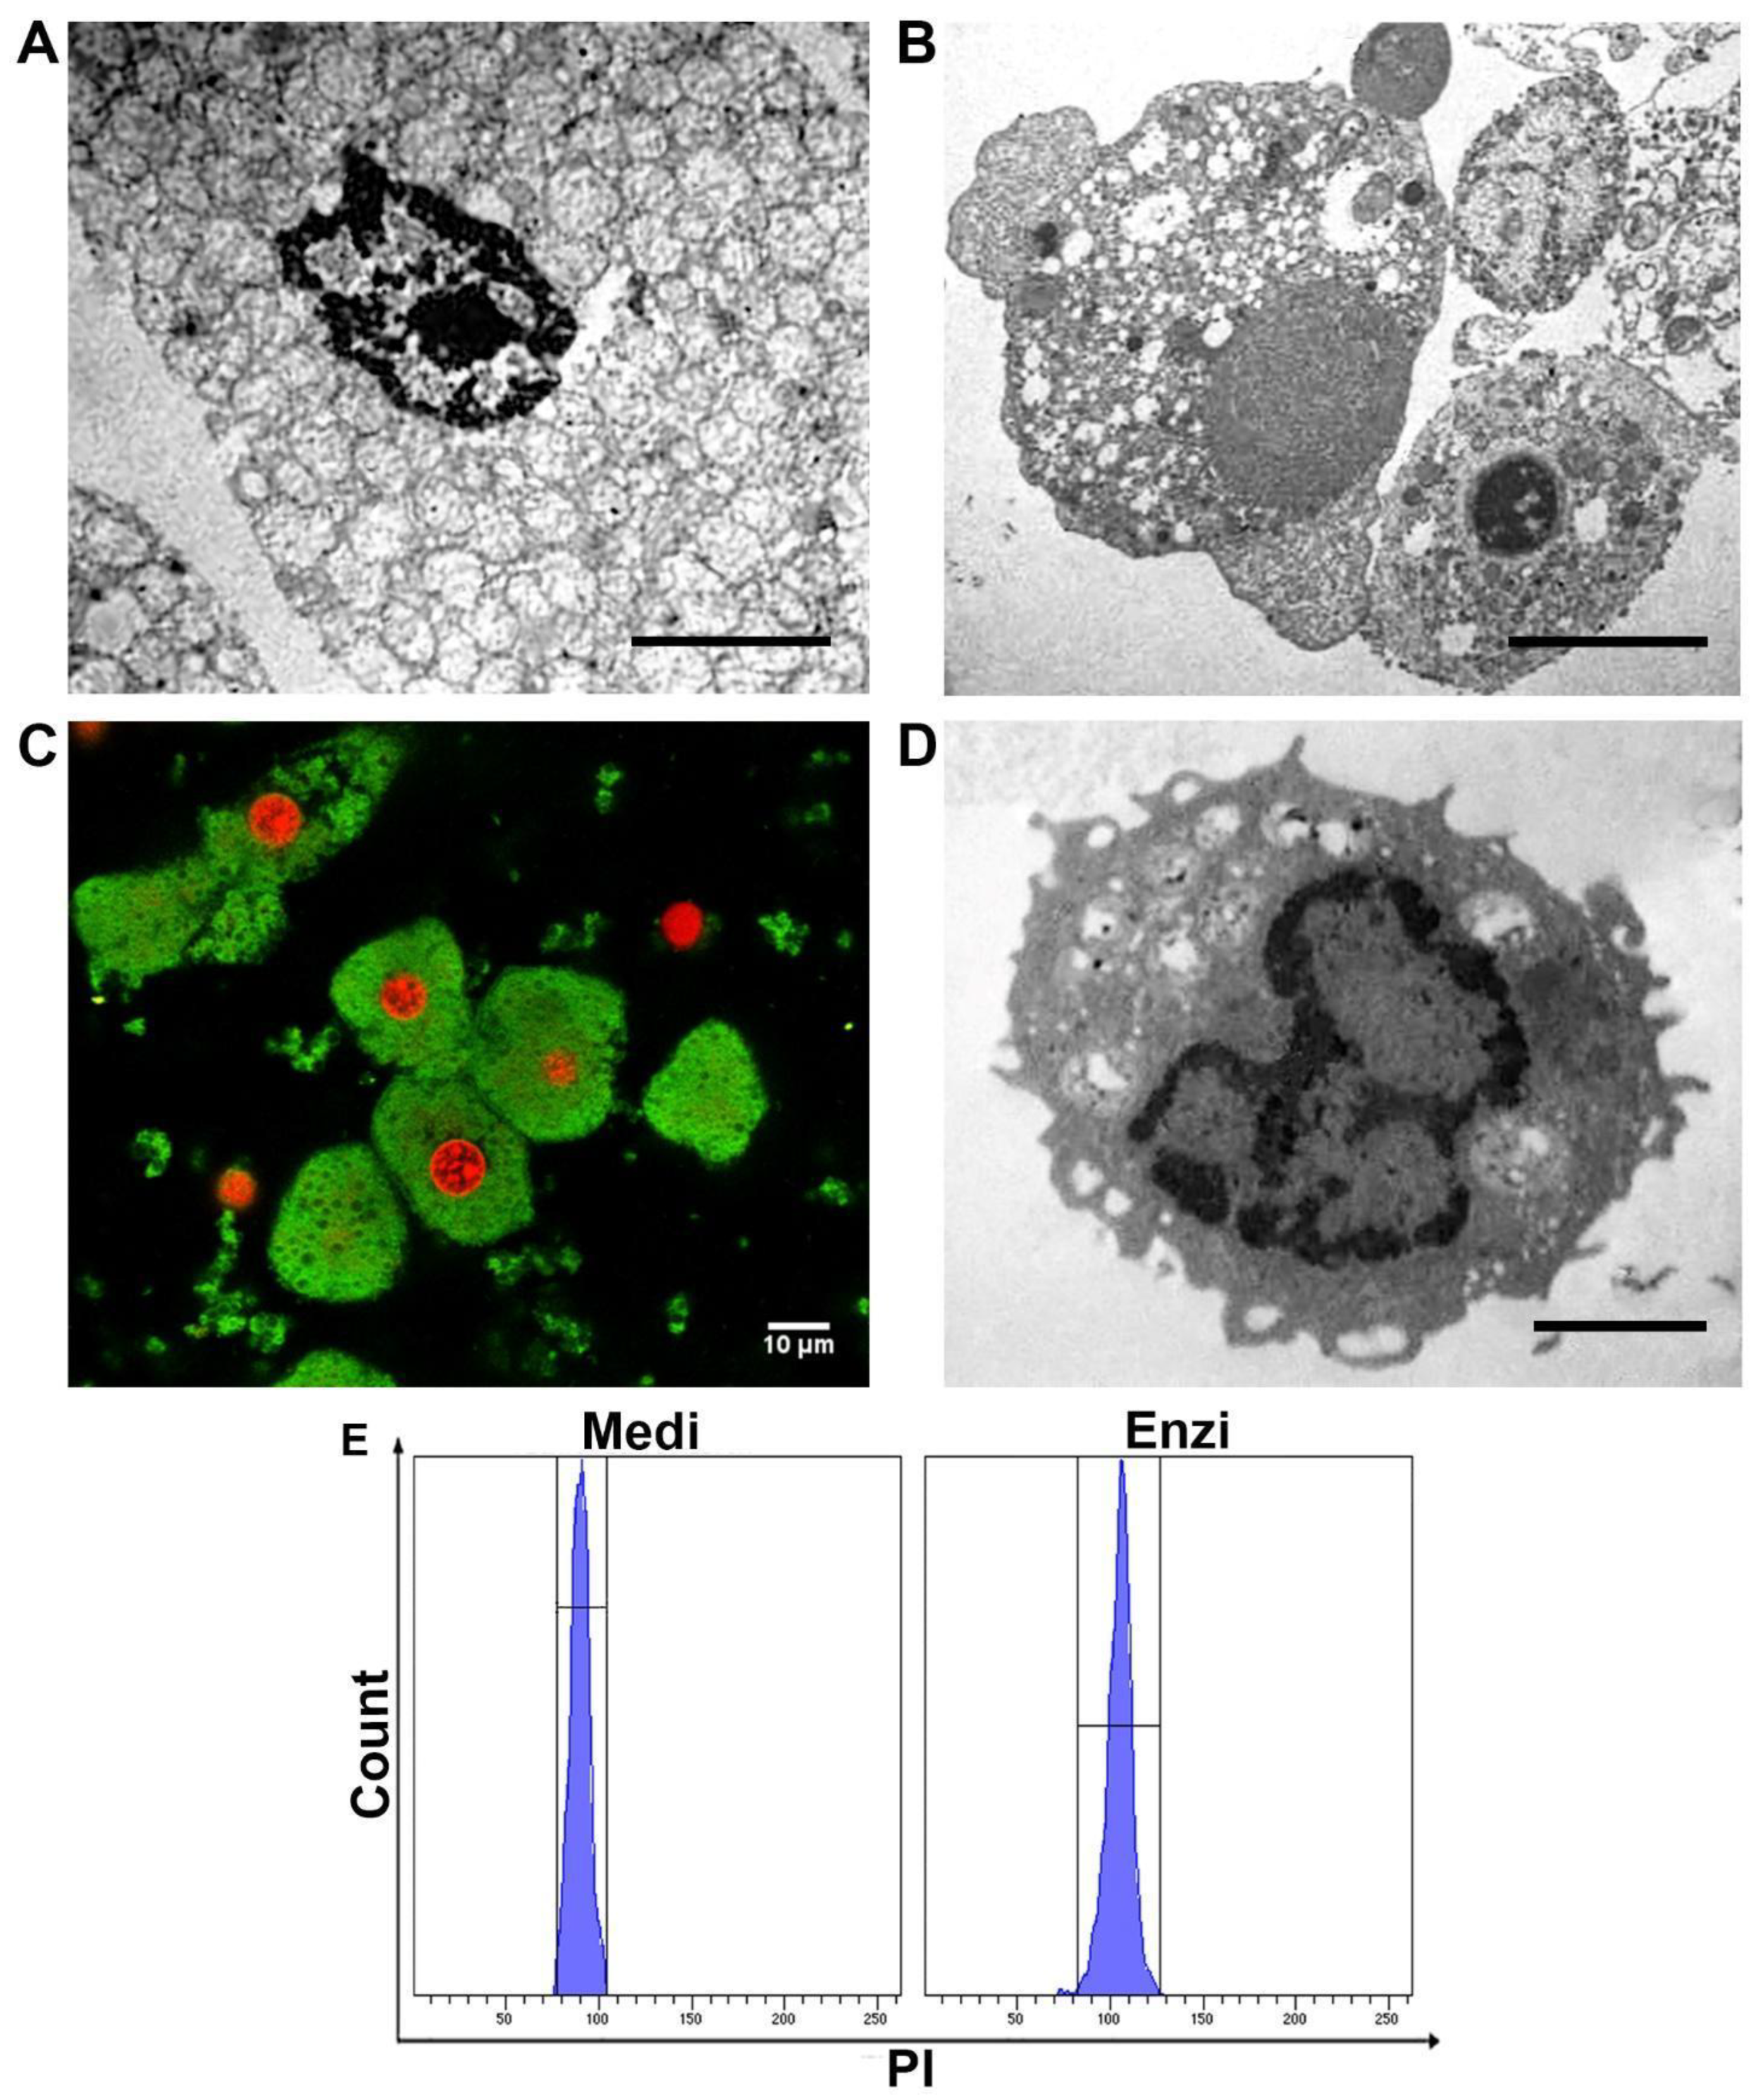
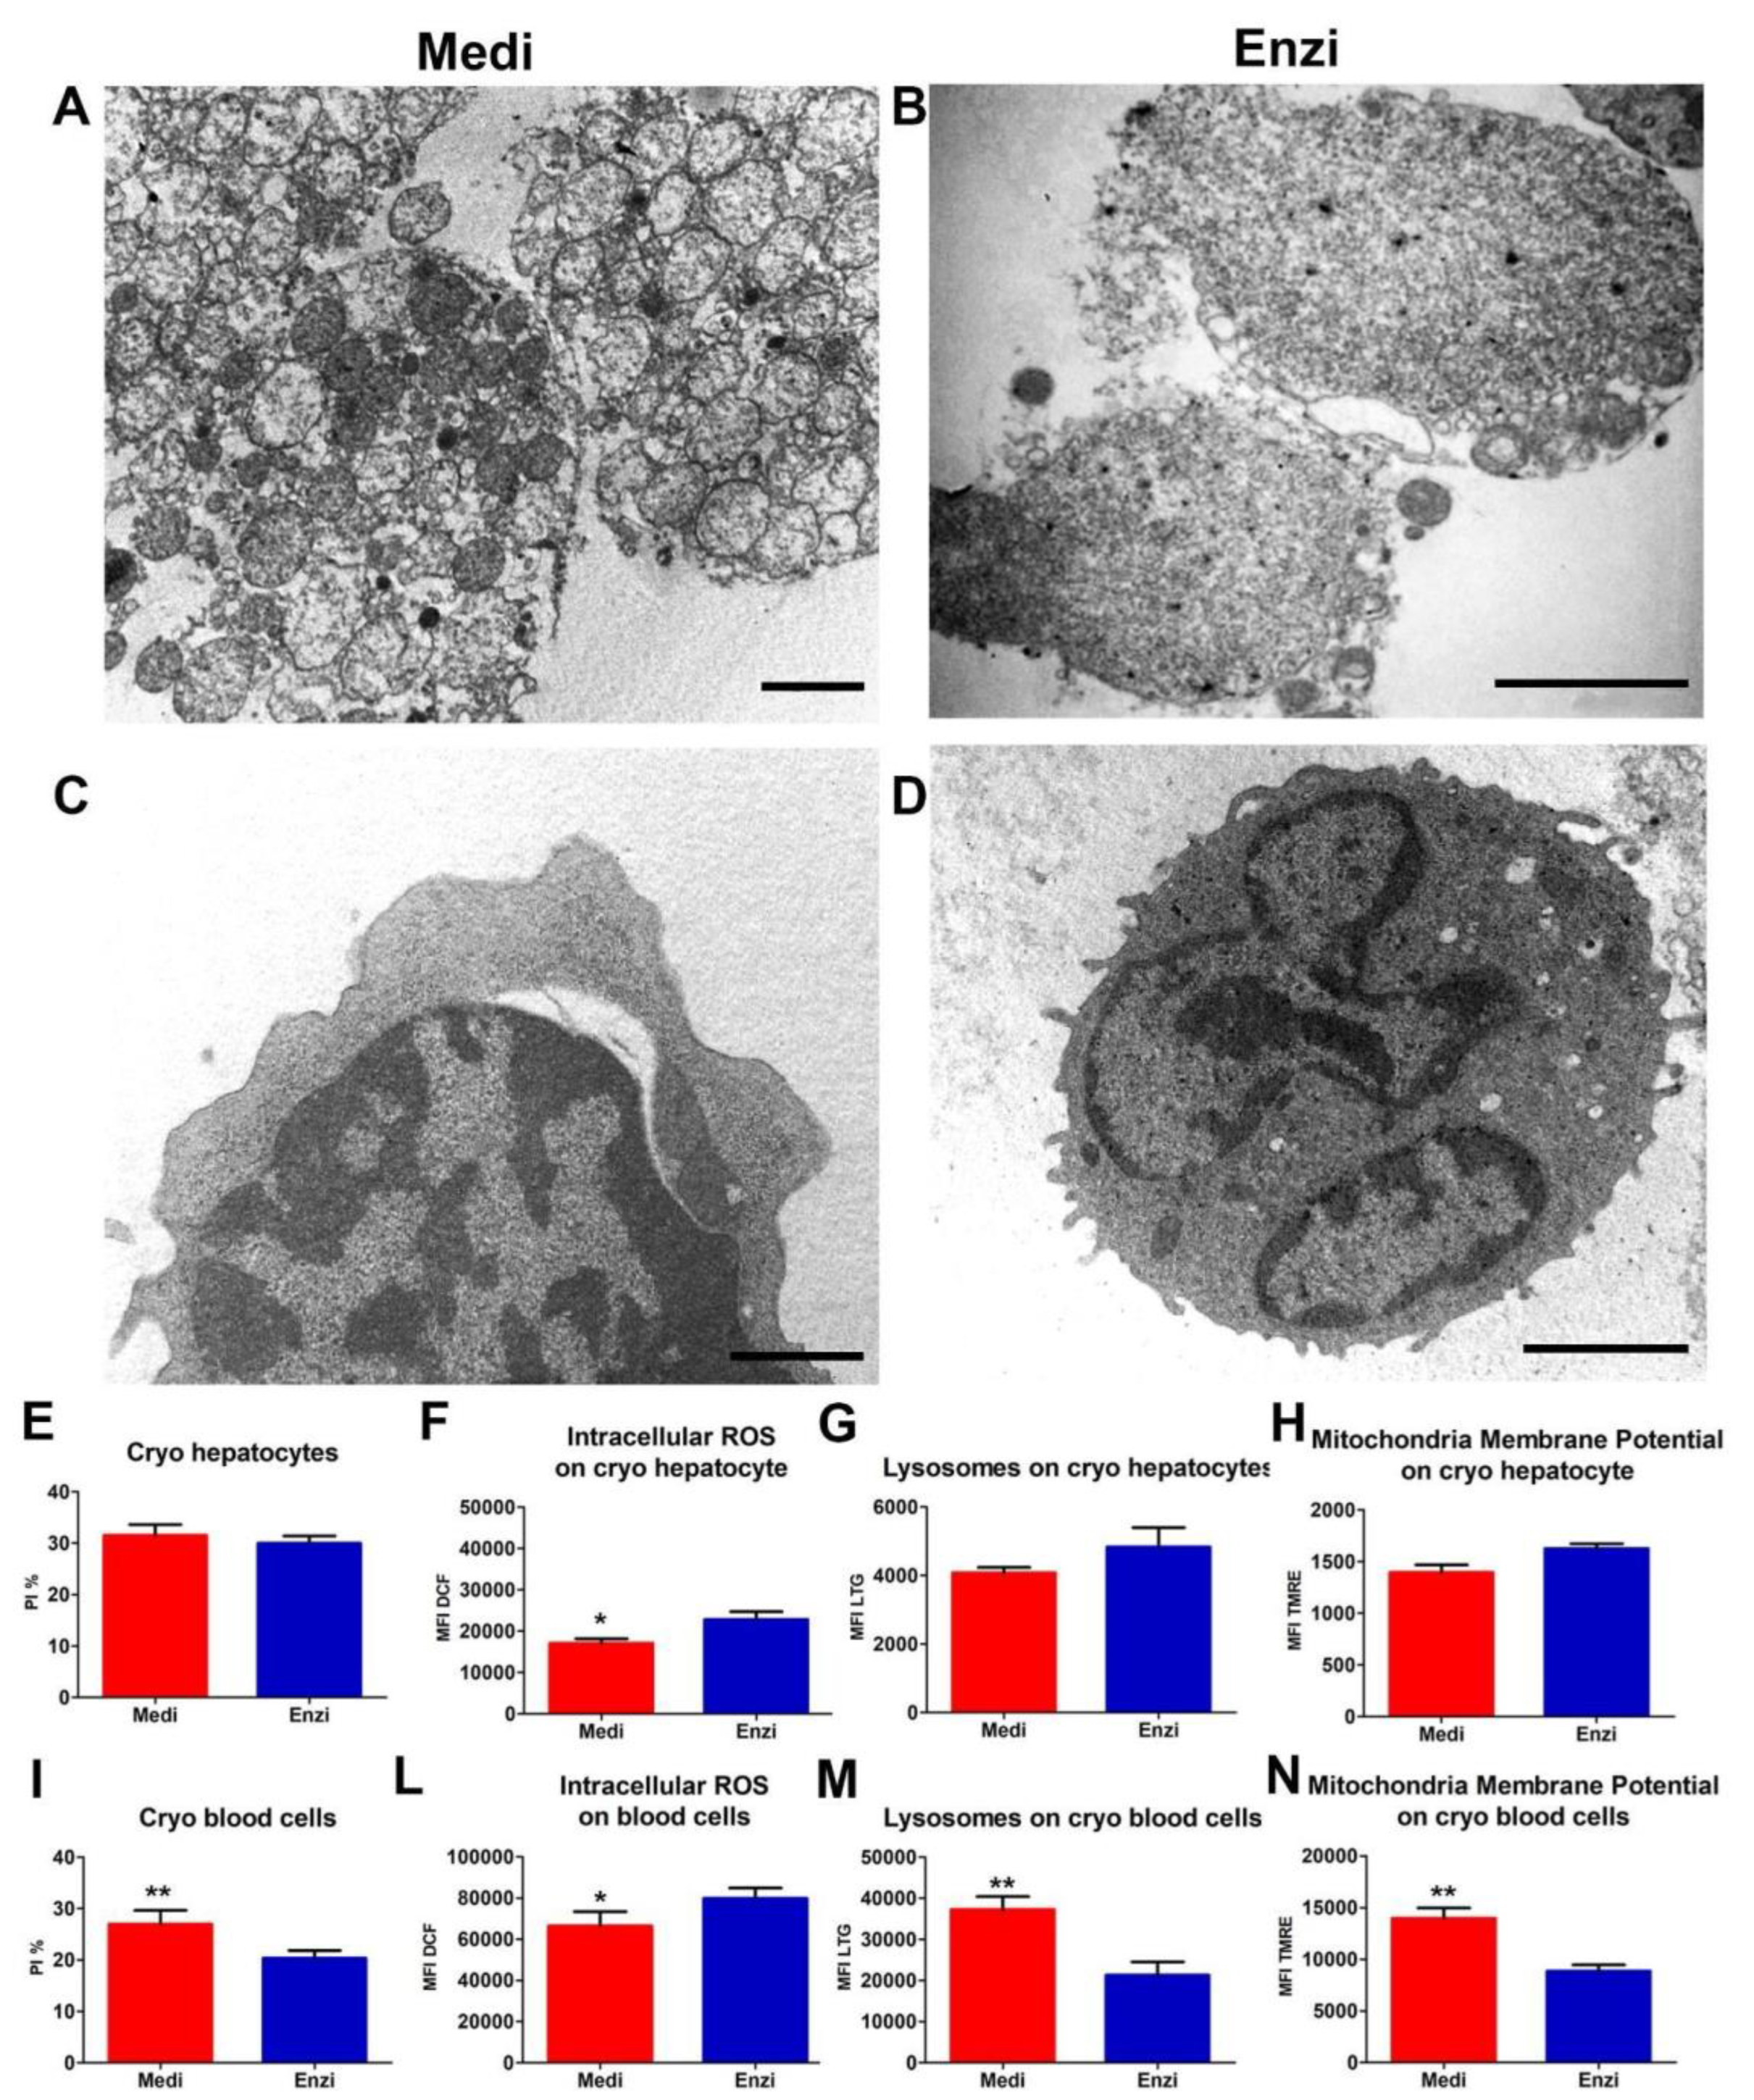
3.4. Liver
Cell Response of Differently Isolated Liver Cells to Cryopreservation and Thawing
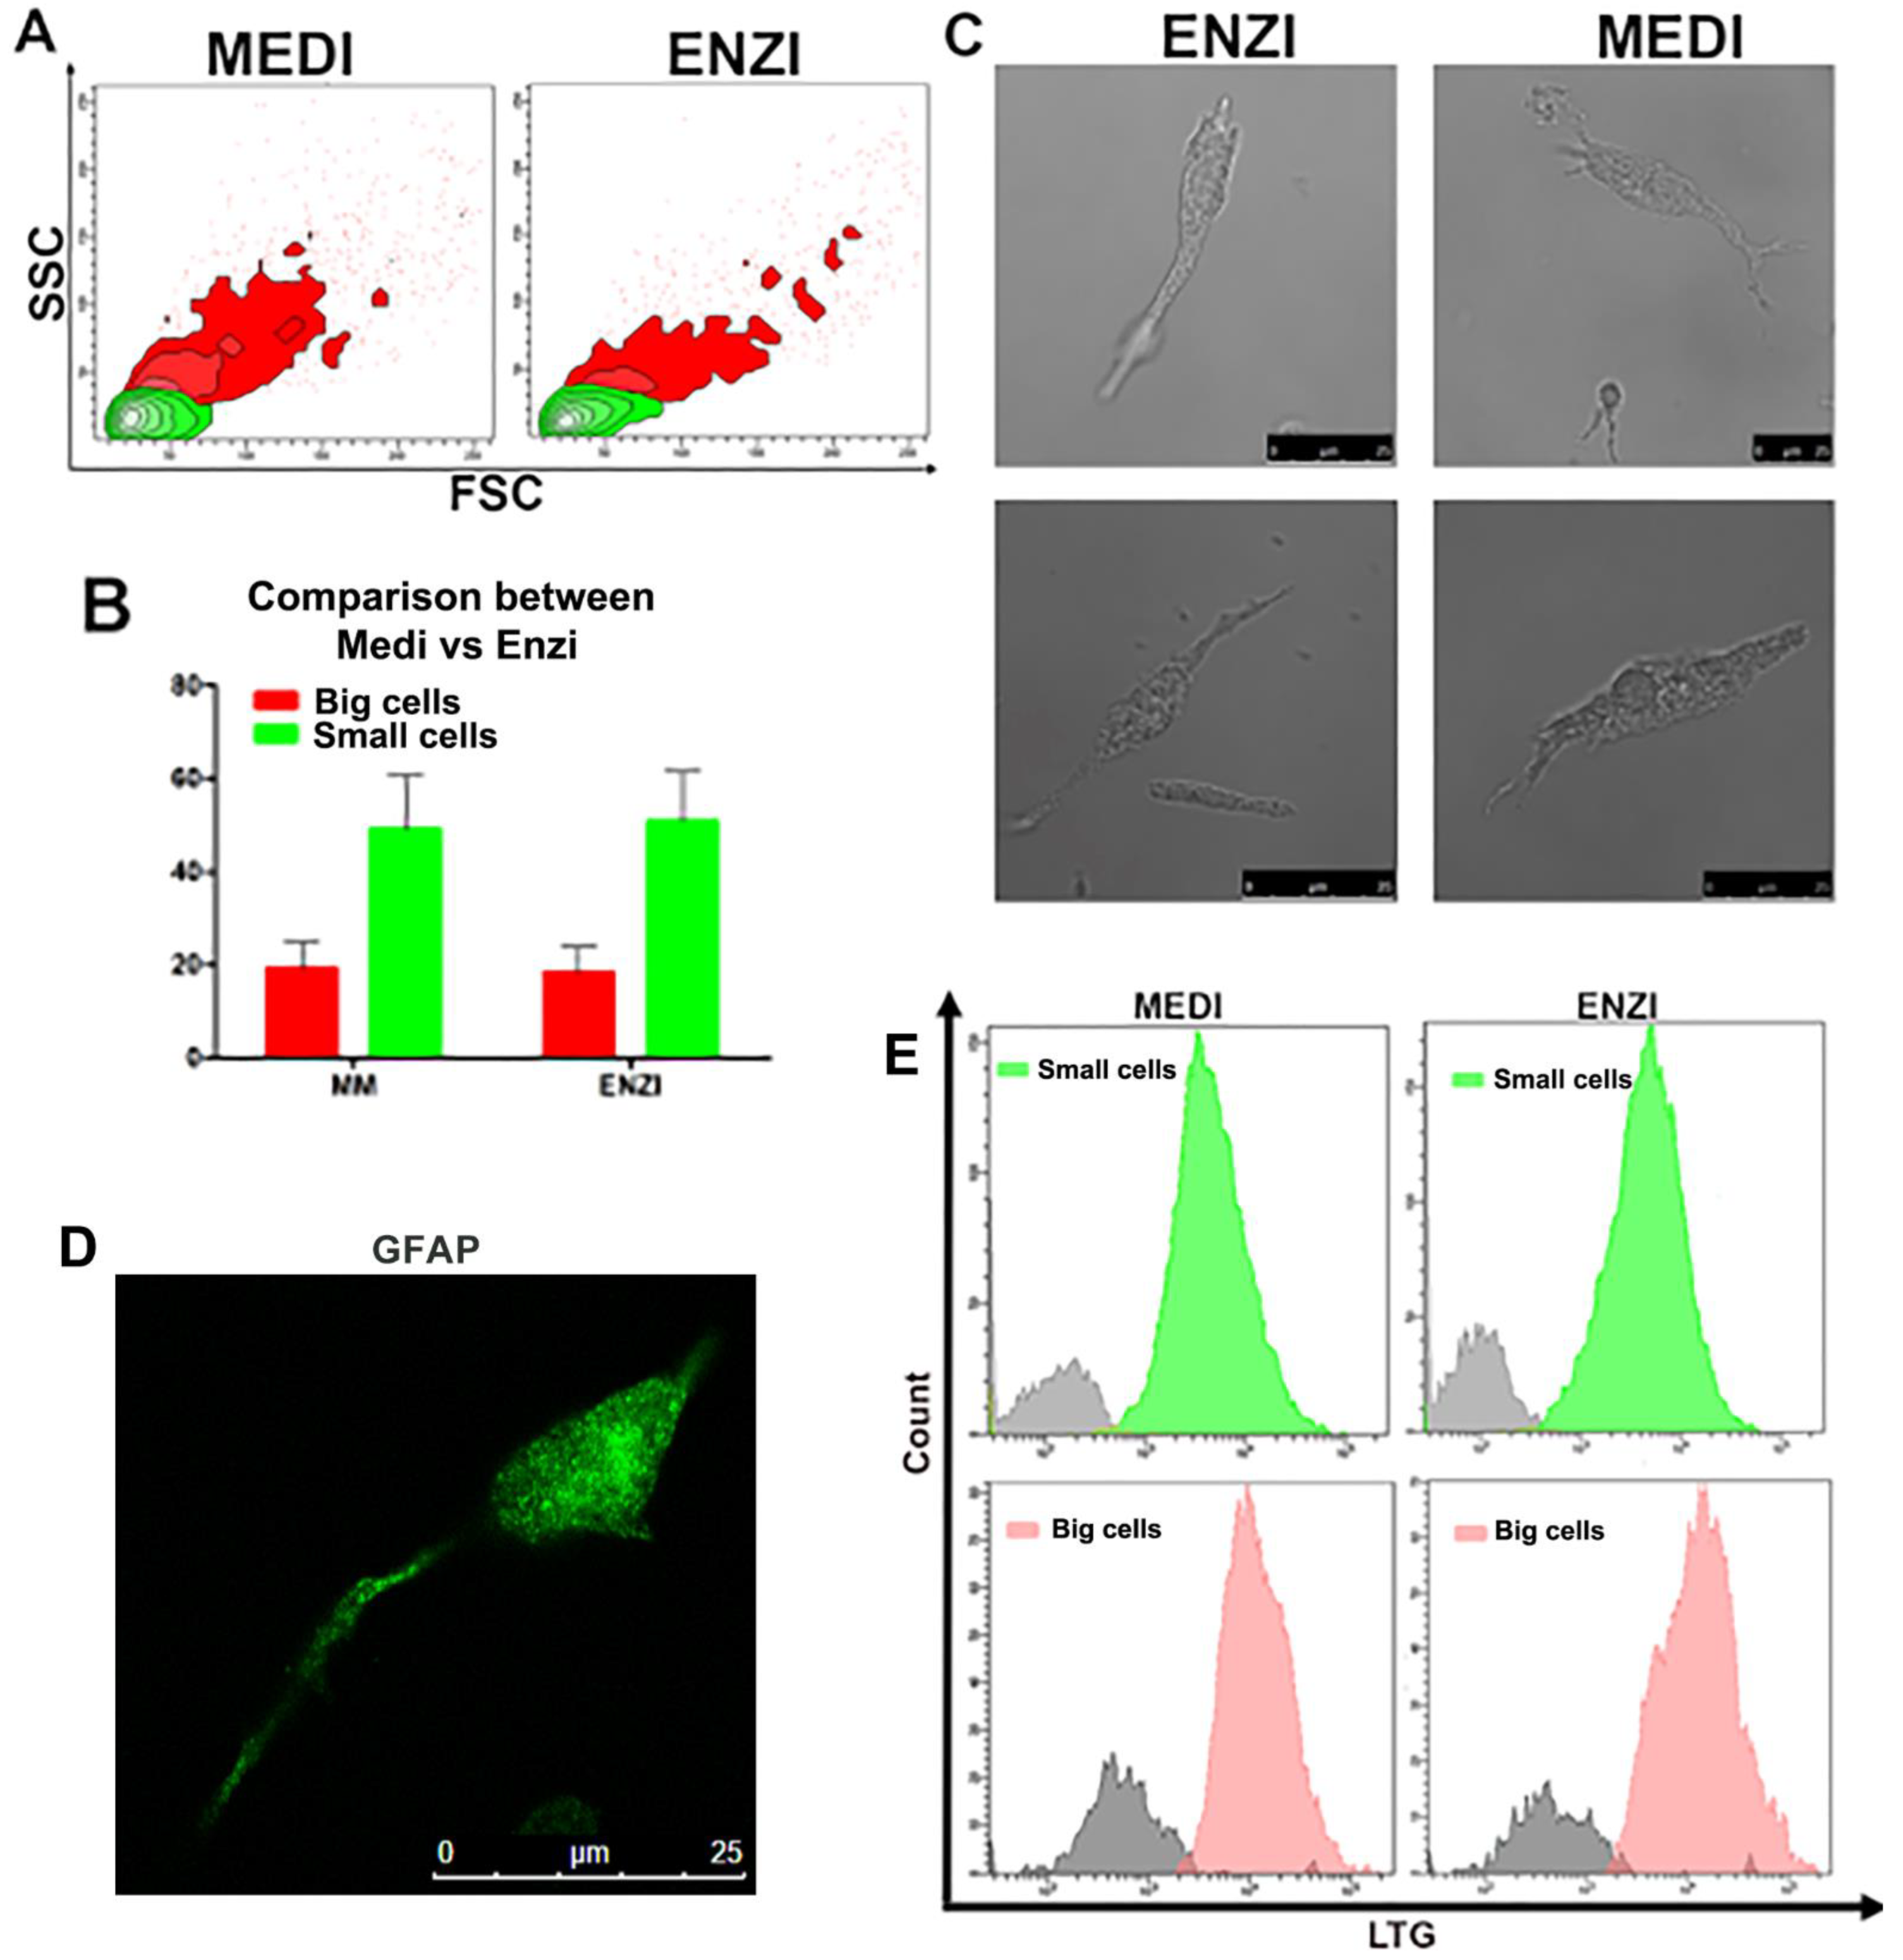
3.5. Other Tissues
Kidney and Organotypic Hippocampal Slice Cultures
4. Discussion
Supplementary Materials
Author Contributions
Funding
Institutional Review Board Statement
Acknowledgments
Conflicts of Interest
References
- Nguyen, Q.H.; Pervolarakis, N.; Blake, K.; Ma, D.; Davis, R.T.; James, N.; Phung, A.T.; Willey, E.; Kumar, R.; Jabart, E.; et al. Profiling human breast epithelial cells using single cell RNA sequencing identifies cell diversity. Nat. Commun. 2018, 9, 2028. [Google Scholar] [CrossRef] [PubMed]
- Muraro, M.J.; Dharmadhikari, G.; Grün, D.; Groen, N.; Dielen, T.; Jansen, E.; van Gurp, L.; Engelse, M.A.; Carlotti, F.; de Koning, E.J.P.; et al. A Single-Cell Transcriptome Atlas of the Human Pancreas. Cell Syst. 2016, 3, 385–394. [Google Scholar] [CrossRef] [Green Version]
- Rous, P.; Jones, F.S. A method for obtaining suspensions of living cells from the fixed tissues, and for the plating out of individual cells. Proc. Soc. Exp. Biol. Med. 1916, 23, 549–555. [Google Scholar] [CrossRef] [Green Version]
- Hamburger, A.W.; Salmon, S.E. Primary Bioassay of Human Tumor Stem Cells. Science 1977, 197, 461–463. [Google Scholar] [CrossRef] [PubMed]
- Salmon, S.E.; Hamburger, A.W.; Soehnlen, B.; Durie, B.G.M.; Alberts, D.S.; Moon, T.E. Quantitation of Differential Sensitivity of Human-Tumor Stem Cells to Anticancer Drugs. N. Engl. J. Med. 1978, 298, 1321–1327. [Google Scholar] [CrossRef] [PubMed]
- Rasey, J.S.; Nelson, N.J. Effect of tumor dissaggregation on results of in vitro cell survival assay after in vivo treatment of the EMT-6 tumor: X-rays, cyclophosphamide, and bleomycin. In Vitro 1980, 16, 547–553. [Google Scholar] [CrossRef]
- Cerra, R.; Zarbo, R.J.; Crissman, J.D. Chapter 1 Dissociation of Cells from Solid Tumors. Methods Cell Biol. 1990, 33, 1–12. [Google Scholar] [CrossRef]
- Cunningham, R.E. Tissue disaggregation. Methods Mol. Biol. 2010, 588, 327–330. [Google Scholar] [CrossRef]
- Waymouth, C. To disaggregate or not to disaggregate, injury and cell disaggregation, transient or permanent? In Vitro 1974, 10, 97–111. [Google Scholar] [CrossRef]
- Cornacchiari, A.; Grigolato, P.G.; Facchetti, F.; Morassi, M.L.; Cadei, M.; Alpi, F.; Battocchio, S.; Chirico, E. Usefulness of the scraping method for DNA flow cytometry in breast tumors. Cytometry 1995, 19, 263–266. [Google Scholar] [CrossRef]
- Ottesen, G.L.; Christensen, J.; Larsen, J.K.; Hansen, B.; Andersen, J.A. Tissue Disaggregation for Flow Cytometric DNA Analysis: Comparison of Fine-Needle Aspiration and an Automated Mechanical Procedure. Commun. Clin. Cytom. 1996, 26, 65–68. [Google Scholar] [CrossRef]
- Singh, N.P. A Rapid Method for the Preparation of Single-Cell Suspensions From Solid Tissues. Cytometry 1998, 31, 229–232. [Google Scholar] [CrossRef]
- Vos, J.A.; Simurdak, J.H.; Davis, B.J.; Myers, J.B.; Brissette, M.D. Vortex disaggregation for flow cytometry allows direct histologic correlation: A novel approach for small biopsies and inaspirable bone marrows. Cytom. Part B Clin. Cytom. 2003, 52, 20–31. [Google Scholar] [CrossRef] [PubMed]
- Meistrich, M.L. Separation of Spermatogenic Cells and Nuclei from Rodent Testes. Methods Cell Biol. 1977, 15, 15–54. [Google Scholar] [CrossRef]
- Malkov, M.; Fisher, Y.; Don, J. Developmental schedule of the postnatal rat testis determined by flow cytometry. Biol. Reprod. 1998, 59, 84–92. [Google Scholar] [CrossRef] [Green Version]
- Rodríguez-Casuriaga, R.; Geisinger, A.; López-Carro, B.; Porro, V.; Wettstein, R.; Folle, G.A. Ultra-fast and optimized method for the preparation of rodent testicular cells for flow cytometric analysis. Biol. Proced. Online 2009, 11, 184–195. [Google Scholar] [CrossRef] [Green Version]
- Brockhoff, G.; Fleischmann, S.; Meier, A.; Wachs, F.P.; Hofstaedter, F.; Knuechel, R. Use of a mechanical dissociation device to improve standardization of flow cytometric cytokeratin DNA measurements of colon carcinomas. Commun. Clin. Cytom. 2002, 38, 184–191. [Google Scholar] [CrossRef]
- De Francesco, F.; Mannucci, S.; Conti, G.; Prè, E.D.; Sbarbati, A.; Riccio, M. A non-enzymatic method to obtain a fat tissue derivative highly enriched in adipose stem cells (ASCs) from human lipoaspirates: Preliminary results. Int. J. Mol. Sci. 2018, 19, 2061. [Google Scholar] [CrossRef] [Green Version]
- Schneider, F.; Redmann, K.; Wistuba, J.; Schlatt, S.; Kliesch, S.; Neuhaus, N. Comparison of enzymatic digestion and mechanical dissociation of human testicular tissues. Fertil. Steril. 2015, 104, 302–311. [Google Scholar] [CrossRef] [Green Version]
- Freshney, R. Culture of Animal Cells: A Manual of Basic Technique and Specialized Applications, 7th ed.; Wiley Blackwell, Ed.; John Wiley & Sons: Hoboken, NJ, USA, 2015. [Google Scholar]
- Reichard, A.; Asosingh, K. Best Practices for Preparing a Single Cell Suspension from Solid Tissues for Flow Cytometry. Cytom. A 2019, 95, 219–226. [Google Scholar] [CrossRef] [Green Version]
- Kakebeen, A.D.; Chitsazan, A.D.; Wills, A.E. Tissue disaggregation and isolation of specific cell types from transgenic Xenopus appendages for transcriptional analysis by FACS. Dev. Dyn. 2020, 250, 1381–1392. [Google Scholar] [CrossRef] [PubMed]
- Rodbell, M. Metabolism of Isolated Fat Cells: I. effects of hormones on glucose metabolism and lipolysis. J. Biol. Chem. 1964, 239, 375–380. [Google Scholar] [CrossRef]
- Hyder, A. Effect of the pancreatic digestion with liberase versus collagenase on the yield, function and viability of neonatal rat pancreatic islets. Cell Biol. Int. 2005, 29, 831–834. [Google Scholar] [CrossRef] [PubMed]
- Baptista, L.S.; Do Amaral, R.J.F.C.; Carias, R.B.V.; Aniceto, M.; Claudio-Da-Silva, C.; Borojevic, R. An alternative method for the isolation of mesenchymal stromal cells derived from lipoaspirate samples. Cytotherapy 2009, 11, 706–715. [Google Scholar] [CrossRef] [PubMed]
- Liu, K.; Wang, K.; Yan, H. Incomplete digestion preserves chondrocytes from dedifferentiating in long-termed culture on plastic substrate. Tissue Cell 2009, 41, 1–11. [Google Scholar] [CrossRef] [PubMed]
- Patel, M.; Smith, A.J.; Sloan, A.J.; Smith, G.; Cooper, P.R. Phenotype and behaviour of dental pulp cells during expansion culture. Arch. Oral Biol. 2009, 54, 898–908. [Google Scholar] [CrossRef]
- Charan, K.S.; Kumari, M.; Gayathri, V. Regenerative capacity of the dental mesenchymal stem cells and their implications in dentistry. SRM J. Res. Dent. Sci. 2022, 13, 32–37. [Google Scholar] [CrossRef]
- Butova, X.A.; Myachina, T.A.; Khokhlova, A.D. A combined Langendorff-injection technique for simultaneous isolation of single cardiomyocytes from atria and ventricles of the rat heart. MethodsX 2021, 8, 101189. [Google Scholar] [CrossRef]
- Feng, T.Y.; Li, Q.; Ren, F.; Xi, H.M.; Lv, D.L.; Li, Y.; Hu, J.H. Melatonin Protects Goat Spermatogonial Stem Cells against Oxidative Damage during Cryopreservation by Improving Antioxidant Capacity and Inhibiting Mitochondrial Apoptosis Pathway. Oxid. Med. Cell. Longev. 2020, 2020, 5954635. [Google Scholar] [CrossRef]
- McKinnon, K.M. Flow Cytometry: An Overview. Curr. Protoc. Immunol. 2018, 120, 5.1.1–5.1.11. [Google Scholar] [CrossRef]
- Shichkin, V.P.; Gorbach, O.I.; Zuieva, O.A.; Grabchenko, N.I.; Aksyonova, I.A.; Todurov, B.M. Effect of cryopreservation on viability and growth efficiency of stromal-epithelial cells derived from neonatal human thymus. Cryobiology 2017, 78, 70–79. [Google Scholar] [CrossRef] [PubMed]
- Carloni, S.; Facchinetti, F.; Pelizzi, N.; Buonocore, G.; Balduini, W. Melatonin Acts in Synergy with Hypothermia to Reduce Oxygen-Glucose Deprivation-Induced Cell Death in Rat Hippocampus Organotypic Slice Cultures. Neonatology 2018, 114, 364–371. [Google Scholar] [CrossRef] [PubMed]
- Novelli, M.; Savoia, P.; Cambieri, I.; Ponti, R.; Comessatti, A.; Lisa, F.; Bernengo, M.G. Collagenase digestion and mechanical disaggregation as a method to extract and immunophenotype tumour lymphocytes in cutaneous T-cell lymphomas. Clin. Exp. Dermatol. 2000, 25, 423–431. [Google Scholar] [CrossRef] [PubMed]
- Canonico, B.; Campana, R.; Luchetti, F.; Arcangeletti, M.; Betti, M.; Cesarini, E.; Ciacci, C.; Vittoria, E.; Galli, L.; Papa, S.; et al. Campylobacter jejuni cell lysates differently target mitochondria and lysosomes on HeLa cells. Apoptosis 2014, 19, 1225–1242. [Google Scholar] [CrossRef]
- Chazotte, B. Labeling lysosomes in live cells with lysotracker. Cold Spring Harb. Protoc. 2011, 6, pdb.prot5571. [Google Scholar] [CrossRef]
- Canonico, B.; Cesarini, E.; Salucci, S.; Luchetti, F.; Falcieri, E.; Di Sario, G.; Palma, F.; Papa, S. Defective autophagy, mitochondrial clearance and lipophagy in niemann-pick type B lymphocytes. PLoS ONE 2016, 11, e0165780. [Google Scholar] [CrossRef]
- Salucci, S.; Burattini, S.; Battistelli, M.; Buontempo, F.; Canonico, B.; Martelli, A.M.; Papa, S.; Falcieri, E. Tyrosol prevents apoptosis in irradiated keratinocytes. J. Dermatol. Sci. 2015, 80, 61–68. [Google Scholar] [CrossRef]
- Salucci, S.; Battistelli, M.; Burattini, S.; Sbrana, F.; Falcieri, E. Holotomographic microscopy: A new approach to detect apoptotic cell features. Microsc. Res. Tech. 2020, 83, 1464–1470. [Google Scholar] [CrossRef]
- Brando, B.; Barnett, D.; Janossy, G.; Mandy, F.; Autran, B.; Rothe, G.; Scarpati, B.; D’Avanzo, G.; D’Hautcourt, J.-L.; Lenkei, R.; et al. Cytofluorometric Methods for Assessing Absolute Numbers of Cell Subsets in Blood. Cytometry 2000, 42, 327–346. [Google Scholar] [CrossRef]
- Grange, C.; Létourneau, J.; Forget, M.A.; Godin-Ethier, J.; Martin, J.; Liberman, M.; Latour, M.; Widmer, H.; Lattouf, J.B.; Piccirillo, C.A.; et al. Phenotypic characterization and functional analysis of human tumor immune infiltration after mechanical and enzymatic disaggregation. J. Immunol. Methods 2011, 372, 119–126. [Google Scholar] [CrossRef]
- Binnewies, M.; Roberts, E.W.; Kersten, K.; Chan, V.; Fearon, D.F.; Merad, M.; Coussens, L.M.; Gabrilovich, D.I.; Ostrand-Rosenberg, S.; Hedrick, C.C.; et al. Understanding the tumor immune microenvironment (TIME) for effective therapy. Nat. Med. 2018, 24, 541–550. [Google Scholar] [CrossRef] [PubMed]
- Swirski, F.K.; Nahrendorf, M.; Etzrodt, M.; Wildgruber, M.; Cortez-Retamozo, V.; Panizzi, P.; Figueiredo, J.L.; Kohler, R.H.; Chudnovskiy, A.; Waterman, P.; et al. Identification of splenic reservoir monocytes and their deployment to inflammatory sites. Science 2009, 325, 612–616. [Google Scholar] [CrossRef] [PubMed] [Green Version]
- Van Der Laan, A.M.; Ter Horst, E.N.; Delewi, R.; Begieneman, M.P.V.; Krijnen, P.A.J.; Hirsch, A.; Lavaei, M.; Nahrendorf, M.; Horrevoets, A.J.; Niessen, H.W.M.; et al. Monocyte subset accumulation in the human heart following acute myocardial infarction and the role of the spleen as monocyte reservoir. Eur. Heart J. 2014, 35, 376–385. [Google Scholar] [CrossRef] [PubMed] [Green Version]
- Kotzé, H.F.; Heyns, A.D.P.; Wessels, P.; Pieters, H.; Badenhorst, P.N.; Lötter, M.G. Evidence that 111In-labelled platelets pool in the spleen, but not in the liver of normal humans and baboons. Scand. J. Haematol. 1986, 37, 259–264. [Google Scholar] [CrossRef] [PubMed]
- Heyns, A.D.; Lötter, M.G.; Kotzè, H.F.; Wessels, P.; Pieters, H.; Badenhorst, P.N. Kinetics, distribution, and sites of destruction of indium-111 oxine labelled red cells in haemolytic anaemia. J. Clin. Pathol. 1985, 38, 128–132. [Google Scholar] [CrossRef] [Green Version]
- Mamani-Matsuda, M.; Cosma, A.; Weller, S.; Faili, A.; Staib, C.; Garçon, L.; Hermine, O.; Beyne-Rauzy, O.; Fieschi, C.; Pers, J.O.; et al. The human spleen is a major reservoir for long-lived vaccinia virus–specific memory B cells. Blood 2008, 111, 4653–4659. [Google Scholar] [CrossRef] [Green Version]
- Seifert, M.F.; Marks, S.C. The regulation of hemopoiesis in the spleen. Experientia. 1985, 41, 192–199. [Google Scholar] [CrossRef]
- Hendricks, J.; Visser, A.; Dammers, P.M.; Burgerhof, J.G.M.; Bos, N.A.; Kroese, F.G.M. Class-switched marginal zone B cells in spleen have relatively low numbers of somatic mutations. Mol. Immunol. 2011, 48, 874–882. [Google Scholar] [CrossRef] [Green Version]
- Yang, Y.; Bazhin, A.V.; Werner, J.; Karakhanova, S. Reactive oxygen species in the immune system. Int. Rev. Immunol. 2013, 32, 249–270. [Google Scholar] [CrossRef]
- Matsushita, M.; Freigang, S.; Schneider, C.; Conrad, M.; Bornkamm, G.W.; Kopf, M. T cell lipid peroxidation induces ferroptosis and prevents immunity to infection. J. Exp. Med. 2015, 212, 555–568. [Google Scholar] [CrossRef] [Green Version]
- Ogura, M.; Inoue, T.; Yamaki, J.; Homma, M.K.; Kurosaki, T.; Homma, Y. Mitochondrial reactive oxygen species suppress humoral immune response through reduction of CD19 expression in B cells in mice. Eur. J. Immunol. 2017, 47, 406–418. [Google Scholar] [CrossRef] [PubMed]
- Zamani Taghizadeh Rabe, S.; Iranshahi, M.; Mahmoudi, M. In vitro anti-inflammatory and immunomodulatory properties of umbelliprenin and methyl galbanate. J. Immunotoxicol. 2016, 13, 209–216. [Google Scholar] [CrossRef] [PubMed] [Green Version]
- Autengruber, A.; Gereke, M.; Hansen, G.; Hennig, C.; Bruder, D. Impact of enzymatic tissue disintegration on the level of surface molecule expression and immune cell function. Eur. J. Microbiol. Immunol. 2012, 2, 112–120. [Google Scholar] [CrossRef] [Green Version]
- Canonico, B.; Betti, M.; Luchetti, F.; Battistelli, M.; Falcieri, E.; Ferri, P.; Zamai, L.; Barnett, D.; Papa, S. Flow cytometric profiles, biomolecular and morphological aspects of transfixed leukocytes and red cells. Cytom. Part B Clin. Cytom. 2010, 78, 267–278. [Google Scholar] [CrossRef] [PubMed]
- Caillot, M.; Dakik, H.; Mazurier, F.; Sola, B. Targeting reactive oxygen species metabolism to induce myeloma cell death. Cancers 2021, 13, 2411. [Google Scholar] [CrossRef]
- Quatromoni, J.G.; Singhal, S.; Bhojnagarwala, P.; Hancock, W.W.; Albelda, S.M.; Eruslanov, E. An optimized disaggregation method for human lung tumors that preserves the phenotype and function of the immune cells. J. Leukoc. Biol. 2015, 97, 201–209. [Google Scholar] [CrossRef] [Green Version]
- Sato, T.; Katagiri, K.; Gohbara, A.; Inoue, K.; Ogonuki, N.; Ogura, A.; Kubota, Y.; Ogawa, T. In vitro production of functional sperm in cultured neonatal mouse testes. Nature 2011, 471, 504–507. [Google Scholar] [CrossRef]
- Zhou, Q.; Wang, M.; Yuan, Y.; Wang, X.; Fu, R.; Wan, H.; Xie, M.; Liu, M.; Guo, X.; Zheng, Y.; et al. Complete Meiosis from Embryonic Stem Cell-Derived Germ Cells In Vitro. Cell Stem Cell 2016, 18, 330–340. [Google Scholar] [CrossRef] [Green Version]
- Baskaran, S.; Finelli, R.; Agarwal, A.; Henkel, R. Reactive oxygen species in male reproduction: A boon or a bane? Andrologia 2021, 53, e13577. [Google Scholar] [CrossRef]
- Selvam, M.K.P.; Agarwal, A.; Sharma, R.; Samanta, L. Treatment of semen samples with a-chymotrypsin alters the expression pattern of sperm functional proteins-a pilot study. Andology 2018, 6, 345–350. [Google Scholar] [CrossRef] [Green Version]
- Thakur, M.; Gupta, H.; Singh, D.; Mohanty, I.R.; Maheswari, U.; Vanage, G.; Joshi, D. Histopathological and ultra structural effects of nanoparticles on rat testis following 90 days (Chronic study) of repeated oral administration. J. Nanobiotechnol. 2014, 12, 42. [Google Scholar] [CrossRef] [PubMed] [Green Version]
- Wang, F.; Han, D. Sertoli Cell Phagocytosis: An Essential Event for Spermatogenesis; IntechOpen: London, UK, 2019. [Google Scholar]
- Barbagallo, F.; La Vignera, S.; Cannarella, R.; Aversa, A.; Calogero, A.E.; Condorelli, R.A. Evaluation of Sperm Mitochondrial Function: A Key Organelle for Sperm Motility. J. Clin. Med. 2020, 9, 363. [Google Scholar] [CrossRef] [PubMed] [Green Version]
- La Vignera, S.; Condorelli, R.A.; Duca, Y.; Mongioi, L.M.; Cannarella, R.; Giacone, F.; Calogero, A.E. FSH therapy for idiopathic male infertility: Four schemes are better than one. Aging Male 2019, 23, 750–755. [Google Scholar] [CrossRef] [PubMed]
- Lundwall, Å.; Bjartell, A.; Olsson, A.Y.; Malm, J. Semenogelin I and II, the predominant human seminal plasma proteins, are also expressed in non-genital tissues. Mol. Hum. Reprod. 2002, 8, 805–810. [Google Scholar] [CrossRef] [PubMed] [Green Version]
- De Lamirande, E.; Lamothe, G. Levels of semenogelin in human spermatozoa decrease during capacitation: Involvement of reactive oxygen species and zinc. Hum. Reprod. 2010, 25, 1619–1630. [Google Scholar] [CrossRef] [PubMed] [Green Version]
- Kwitny, S.; Klaus, A.V.; Hunnicutt, G.R. The annulus of the mouse sperm tail is required to establish a membrane diffusion barrier that is engaged during the late steps of spermiogenesis. Biol. Reprod. 2010, 82, 669–678. [Google Scholar] [CrossRef]
- Onofre, J.; Baert, Y.; Faes, K.; Goossens, E. Cryopreservation of testicular tissue or testicular cell suspensions: A pivotal step in fertility preservation. Hum. Reprod. Update 2016, 22, 744–761. [Google Scholar] [CrossRef] [Green Version]
- Rodríguez-Casuriaga, R.; Santiñaque, F.F.; Folle, G.A.; Souza, E.; López-Carro, B.; Geisinger, A. Rapid preparation of rodent testicular cell suspensions and spermatogenic stages purification by flow cytometry using a novel blue-laser-excitable vital dye. MethodsX 2014, 1, 239–243. [Google Scholar] [CrossRef]
- Croce, S.; Peloso, A.; Zoro, T.; Avanzini, M.A.; Cobianchi, L. A Hepatic Scaffold from Decellularized Liver Tissue: Food for Thought. Biomolecules 2019, 9, 813. [Google Scholar] [CrossRef] [Green Version]
- Surre, J.; Saint-Ruf, C.; Collin, V.; Orenga, S.; Ramjeet, M.; Matic, I. Strong increase in the autofluorescence of cells signals struggle for survival. Sci. Rep. 2018, 8, 12088. [Google Scholar] [CrossRef]
- Stéphenne, X.; Najimi, M.; Sokal, E.M. Hepatocyte cryopreservation: Is it time to change the strategy? World J. Gastroenterol. 2010, 16, 1–14. [Google Scholar] [CrossRef] [PubMed]
- Mattei, D.; Ivanov, A.; van Oostrum, M.; Pantelyushin, S.; Richetto, J.; Mueller, F.; Beffinger, M.; Schellhammer, L.; Berg, J.; Vom Wollscheid, B.; et al. Enzymatic Dissociation Induces Transcriptional and Proteotype Bias in Brain Cell Populations. Int. J. Mol. Sci. 2020, 21, 7944. [Google Scholar] [CrossRef] [PubMed]
- Nayar, S.; Campos, J.; Steinthal, N.; Barone, F. Tissue Digestion for Stromal Cell and Leukocyte Isolation. Methods Mol. Biol. 2017, 1591, 225–234. [Google Scholar] [CrossRef] [PubMed]
- Marsh, S.E.; Walker, A.J.; Kamath, T.; Dissing-Olesen, L.; Hammond, T.R.; de Soysa, T.Y.; Young, A.M.H.; Murphy, S.; Abdulraouf, A.; Nadaf, N.; et al. Dissection of artifactual and confounding glial signatures by single-cell sequencing of mouse and human brain. Nat. Neurosci. 2022, 25, 306–316. [Google Scholar] [CrossRef]
- McBeth, C.; Gutermuth, A.; Ochs, J.; Sharon, A.; Sauer-Budge, A.F. Automated Tissue Dissociation for Rapid Extraction of Viable Cells. Procedia CIRP 2017, 65, 88–92. [Google Scholar] [CrossRef]
- Scheuermann, S.; Schäfer, A.; Langejürgen, J.; Reis, C. A step towards enzyme-free tissue dissociation. Curr. Dir. Biomed. Eng. 2019, 5, 545–548. [Google Scholar] [CrossRef]
- Denisenko, E.; Guo, B.B.; Jones, M.; Hou, R.; De Kock, L.; Lassmann, T.; Poppe, D.; Poppe, D.; Clément, O.; Simmons, R.K.; et al. Systematic assessment of tissue dissociation and storage biases in single-cell and single-nucleus RNA-seq workflows. Genome Biol. 2020, 21, 130. [Google Scholar] [CrossRef]
- Donnenberg, V.S.; Donnenberg, A.D.; Cancer, H.; Ave, C. Flow Cytometry on Disaggregated Solid Tissues. Int. Drug Discov. 2011, 6, 14–18. [Google Scholar]
- Lombardo, J.A.; Aliaghaei, M.; Nguyen, Q.H.; Kessenbrock, K.; Haun, J.B. Microfluidic platform accelerates tissue processing into single cells for molecular analysis and primary culture models. Nat. Commun. 2021, 12, 2858. [Google Scholar] [CrossRef]
- Sun, Y.; Lu, Y.; Saredy, J.; Wang, X.; Drummer C., I.V.; Shao, Y.; Saaoud, F.; Xu, K.; Liu, M.; Yang, W.Y.; et al. ROS systems are a new integrated network for sensing homeostasis and alarming stresses in organelle metabolic processes. Redox Biol. 2020, 37, 101696. [Google Scholar] [CrossRef]
- Corpas, F.J.; Gupta, D.K.; Palma, J.M. Production Sites of Reactive Oxygen Species (ROS) in Organelles from Plant Cells. In Reactive Oxygen Species Oxidative Damage Plants Under Stress; Gupta, D., Palma, J., Corpas, F., Eds.; Springer: Cham, Switzerland, 2015; pp. 1–22. [Google Scholar] [CrossRef]
- Fransen, M.; Nordgren, M.; Wang, B.; Apanasets, O. Role of peroxisomes in ROS/RNS-metabolism: Implications for human disease. Biochim. Biophys. Acta-Mol. Basis Dis. 2012, 1822, 1363–1373. [Google Scholar] [CrossRef] [Green Version]
- Li, J.M.; Shah, A.M. Endothelial cell superoxide generation: Regulation and relevance for cardiovascular pathophysiology. Am. J. Physiol.-Regul. Integr. Comp. Physiol. 2004, 287, R1014–R1030. [Google Scholar] [CrossRef]
- Zorov, D.B.; Juhaszova, M.; Sollott, S.J. Mitochondrial reactive oxygen species (ROS) and ROS-induced ROS release. Physiol. Rev. 2014, 94, 909–950. [Google Scholar] [CrossRef] [Green Version]
- Rinnerthaler, M.; Bischof, J.; Streubel, M.K.; Trost, A.; Richter, K. Oxidative stress in aging human skin. Biomolecules 2015, 5, 545–589. [Google Scholar] [CrossRef] [Green Version]
- Ahsan, H.; Ali, A.; Ali, R. Oxygen free radicals and systemic autoimmunity. Clin. Exp. Immunol. 2003, 131, 398–404. [Google Scholar] [CrossRef]
- Shi, Y.; Buffenstein, R.; Pulliam, D.A.; Van Remmen, H. Comparative studies of oxidative stress and mitochondrial function in aging. Integr. Comp. Biol. 2010, 50, 869–879. [Google Scholar] [CrossRef]
- Du Plessis, S.S.; Agarwal, A.; Halabi, J.; Tvrda, E. Contemporary evidence on the physiological role of reactive oxygen species in human sperm function. J. Assist. Reprod. Genet. 2015, 32, 509–520. [Google Scholar] [CrossRef] [Green Version]
- O’Flaherty, C.; de Lamirande, E.; Gagnon, C. Positive role of reactive oxygen species in mammalian sperm capacitation: Triggering and modulation of phosphorylation events. Free Radic. Biol. Med. 2006, 41, 528–540. [Google Scholar] [CrossRef]
- Rivlin, J.; Mendel, J.; Rubinstein, S.; Etkovitz, N.; Breitbart, H. Role of hydrogen peroxide in sperm capacitation and acrosome reaction. Biol. Reprod. 2004, 70, 518–522. [Google Scholar] [CrossRef]
- Trivisonno, A.; Alexander, R.W.; Baldari, S.; Cohen, S.R.; Di Rocco, G.; Gentile, P.; Magalon, G.; Magalon, J.; Miller, R.B.; Womack, H.; et al. Intraoperative Strategies for Minimal Manipulation of Autologous Adipose Tissue for Cell- and Tissue-Based Therapies: Concise Review. Stem Cells Transl. Med. 2019, 8, 1265–1271. [Google Scholar] [CrossRef] [Green Version]


Publisher’s Note: MDPI stays neutral with regard to jurisdictional claims in published maps and institutional affiliations. |
© 2022 by the authors. Licensee MDPI, Basel, Switzerland. This article is an open access article distributed under the terms and conditions of the Creative Commons Attribution (CC BY) license (https://creativecommons.org/licenses/by/4.0/).
Share and Cite
Montanari, M.; Burattini, S.; Ciacci, C.; Ambrogini, P.; Carloni, S.; Balduini, W.; Lopez, D.; Panza, G.; Papa, S.; Canonico, B. Automated—Mechanical Procedure Compared to Gentle Enzymatic Tissue Dissociation in Cell Function Studies. Biomolecules 2022, 12, 701. https://doi.org/10.3390/biom12050701
Montanari M, Burattini S, Ciacci C, Ambrogini P, Carloni S, Balduini W, Lopez D, Panza G, Papa S, Canonico B. Automated—Mechanical Procedure Compared to Gentle Enzymatic Tissue Dissociation in Cell Function Studies. Biomolecules. 2022; 12(5):701. https://doi.org/10.3390/biom12050701
Chicago/Turabian StyleMontanari, Mariele, Sabrina Burattini, Caterina Ciacci, Patrizia Ambrogini, Silvia Carloni, Walter Balduini, Daniele Lopez, Giovanna Panza, Stefano Papa, and Barbara Canonico. 2022. "Automated—Mechanical Procedure Compared to Gentle Enzymatic Tissue Dissociation in Cell Function Studies" Biomolecules 12, no. 5: 701. https://doi.org/10.3390/biom12050701