Phylogeny and Comparative Analysis of Chinese Chamaesium Species Revealed by the Complete Plastid Genome


1
Key Laboratory of Bio-Resources and Eco-Environment of Ministry of Education, College of Life Sciences, Sichuan University, Chengdu 610065, China
2
Sichuan Key Laboratory of Conservation Biology on Endangered Wildlife, College of Life Sciences, Sichuan University, Chengdu 610065, China
*
Authors to whom correspondence should be addressed.
†
Equal contributions to this work.
Plants 2020, 9(8), 965; https://doi.org/10.3390/plants9080965
Submission received: 30 June 2020
/
Revised: 27 July 2020
/
Accepted: 28 July 2020
/
Published: 30 July 2020
(This article belongs to the Special Issue Plant Molecular Phylogenetics and Evolutionary Genomics)
Abstract
:Chamaesium H. Wolff (Apiaceae, Apioideae) is a small genus mainly distributed in the Hengduan Mountains and the Himalayas. Ten species of Chamaesium have been described and nine species are distributed in China. Recent advances in molecular phylogenetics have revolutionized our understanding of Chinese Chamaesium taxonomy and evolution. However, an accurate phylogenetic relationship in Chamaesium based on the second-generation sequencing technology remains poorly understood. Here, we newly assembled nine plastid genomes from the nine Chinese Chamaesium species and combined these genomes with eight other species from five genera to perform a phylogenic analysis by maximum likelihood (ML) using the complete plastid genome and analyzed genome structure, GC content, species pairwise Ka/Ks ratios and the simple sequence repeat (SSR) component. We found that the nine species’ plastid genomes ranged from 152,703 bp (C. thalictrifolium) to 155,712 bp (C. mallaeanum), and contained 133 genes, 34 SSR types and 585 SSR loci. We also found 20,953–21,115 codons from 53 coding sequence (CDS) regions, 38.4–38.7% GC content of the total genome and low Ka/Ks (0.27–0.43) ratios of 53 aligned CDS. These results will facilitate our further understanding of the evolution of the genus Chamaesium.
1. Introduction
Chamaesium H. Wolff is an endemic genus of Apiaceae, restricted to the Hengduan Mountains and the Himalayas. Chamaesium species mostly occur at high altitudes [1,2,3,4,5,6]. Ten species have been identified by distinctive fruits with primary and secondary ribs and 1-pinnate leaf blades (Figure 1). In China, nine species of Chamaesium have been described and studied based on morphological characteristics and molecular phylogeny [6,7,8]. Chamaesium is monophyletic and occurs at the basal group of Chinese Apiaceae, and we found there were distinct differences between species based on our previous studies [8,9,10]. Although clear inter-specific relationships were described, there are unresolved aspects about the genus, including accurate analysis of the plastid genome, micro-morphology and complex evolutionary issues.
Plastids are significant organelles in plants, and plastid DNA is often more conserved than the nuclear and the mitochondrial genomes [11]. A quadripartite circular structure including two copies of inverted repeat (IR) regions, a large single copy (LSC) region and a small copy region (SCR) usually occur in most angiosperm plastid genomes [12,13]. With the diffusion of next-generation sequencing, whole plastid genome sequences can be assembled with greater ease than with Sanger sequencing. This provides more opportunity for comparative analyses and much greater phylogenetic resolution than traditional gene fragments [14,15,16]. Regardless of the taxonomic level, plastid genome-scale data provide an effective and comprehensive approach to distinguishing species [17,18,19,20,21].
Since there is still uncertainty regarding certain aspects of Chamaesium’s phylogeny, our study aimed to investigate the plastid sequences of the nine Chamaesium species in China. We aimed to provide (1) eight complete plastid genome sequences, (2) comparative analyses of the nine plastid genome sequences and (3) phylogenetic analyses of nine plastid genome sequences. The complete plastid genome sequences of Chamaesium provide effective data to enhance understanding of these plants distributed in the Himalayas and the Hengduan Mountains.
2. Results
2.1. The Plastid Genome of Chamaesium Species
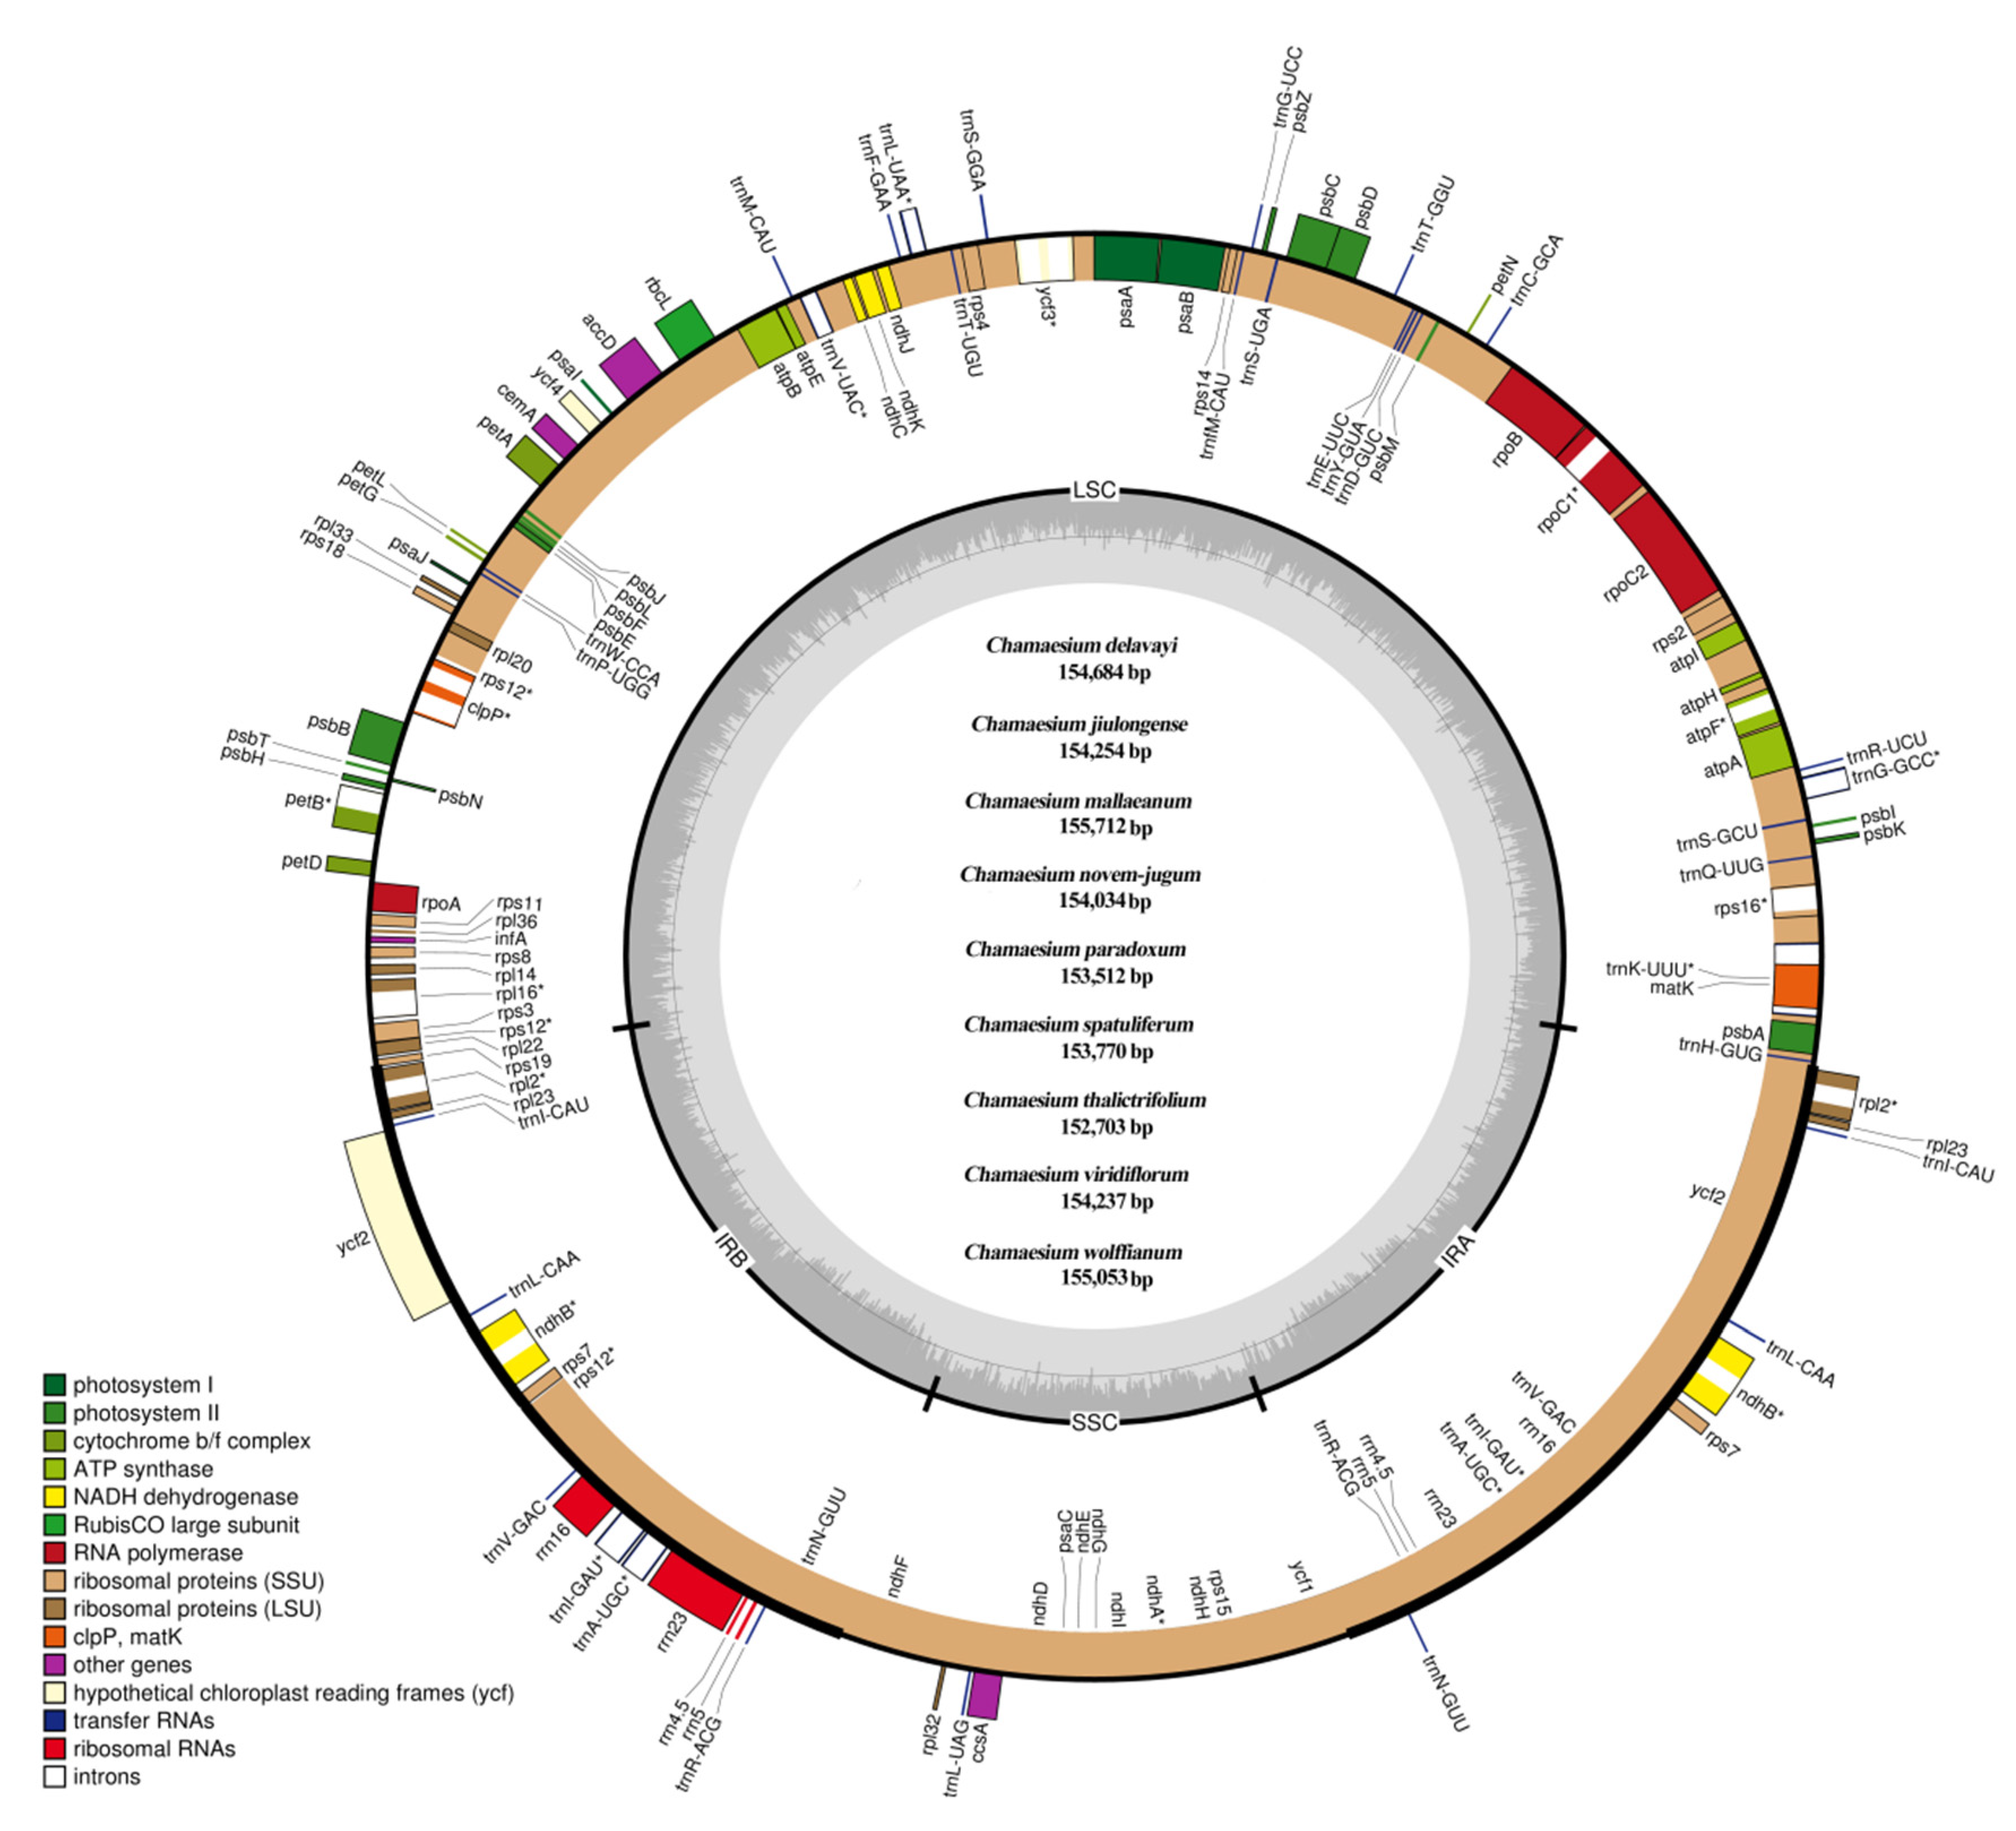
The complete plastid genome of Chamaesium spp. exhibited a single and typical quadripartite circular structure (Figure 2). The sizes of the nine species’ plastid genomes ranged from 152,703 bp (C. thalictrifolium) to 155,712 bp (C. mallaeanum). The Chamaesium plastid genome contained two identical IRs (IRa and IRb, with lengths 25,727–26,147 bp), which were separated by LSC (84,082–85,998 bp) and small single copy (SSC) (17,167–17,580 bp) regions. Different GC content occurs in the whole plastid genome, LSC, SSC and IR regions of the nine Chamaesium species. Higher GC content was detected in the IRs compared to the other regions, which was possibly caused by the presence of rRNA sequences (55.20%–55.30%) with high GC content in IRs (Supplementary Table S2).
The plastid genomes of all species contained 133 genes, including ca. 85 protein-coding genes (PCGs), 37 transfer RNA genes (tRNA) and eight ribosomal RNA genes (rRNA) (Table 1). Among these genes, 95 genes were unique, while 19 genes were duplicated in the IR regions, including eight protein-coding genes (ndhB, rpl2, rpl23, rps7, rps19, ycf1, ycf2, ycf15), seven tRNA genes (trnA-UGC, trnI-CAU, trnI-GAU, trnL-CAA, trnN-GUU, trnR-ACG and trnV-GAC) and four rRNA genes (rrn4.5, rrn5, rrn16 and rrn23). In addition, 11 genes (atpF, ndhA, petB, rpl16, rpoC1, rps12, rps16, trnG-GCC, trnK-UUU, trnL-UAA, trnV-UAC) contained one intron, and six genes (clpP, ndhB, rpl2, trnA-UGC, trnI-GAU, ycf3) contained two introns. Four pseudogenes (ψ rps19, ψ ycf1 and two ψ ycf15) were found in all nine species.
The PCGs in the Chamaesium plastid genome included five genes encoding photosystem I subunits (psaA, psaB, psaC, psaI, psaJ), while 15 genes were related to photosystem II subunits (psbA, psbB, psbC, psbD, psbE, psbF, psbH, psbI, psbJ, psbK, psbL, psbM, psbN, psbT, psbZ). We found nine genes encoding large ribosomal proteins (rpl2, rpl14, rpl16, rpl20, rpl22, rpl23, rpl32, rpl33, rpl36) and 12 genes encoding small ribosomal proteins (rps2, rps3, rps4, rps7, rps8, rps11, rps12, rps14, rps15, rps16, rps18, rps19). Additionally, we found six genes (atpA, atpB, atpE, atpF, atpH, atpI) that encoded ATP synthase and electron transport chain components.
2.2. Contraction and Expansion of IRs and Simple Sequence Repeat (SSR) Analysis
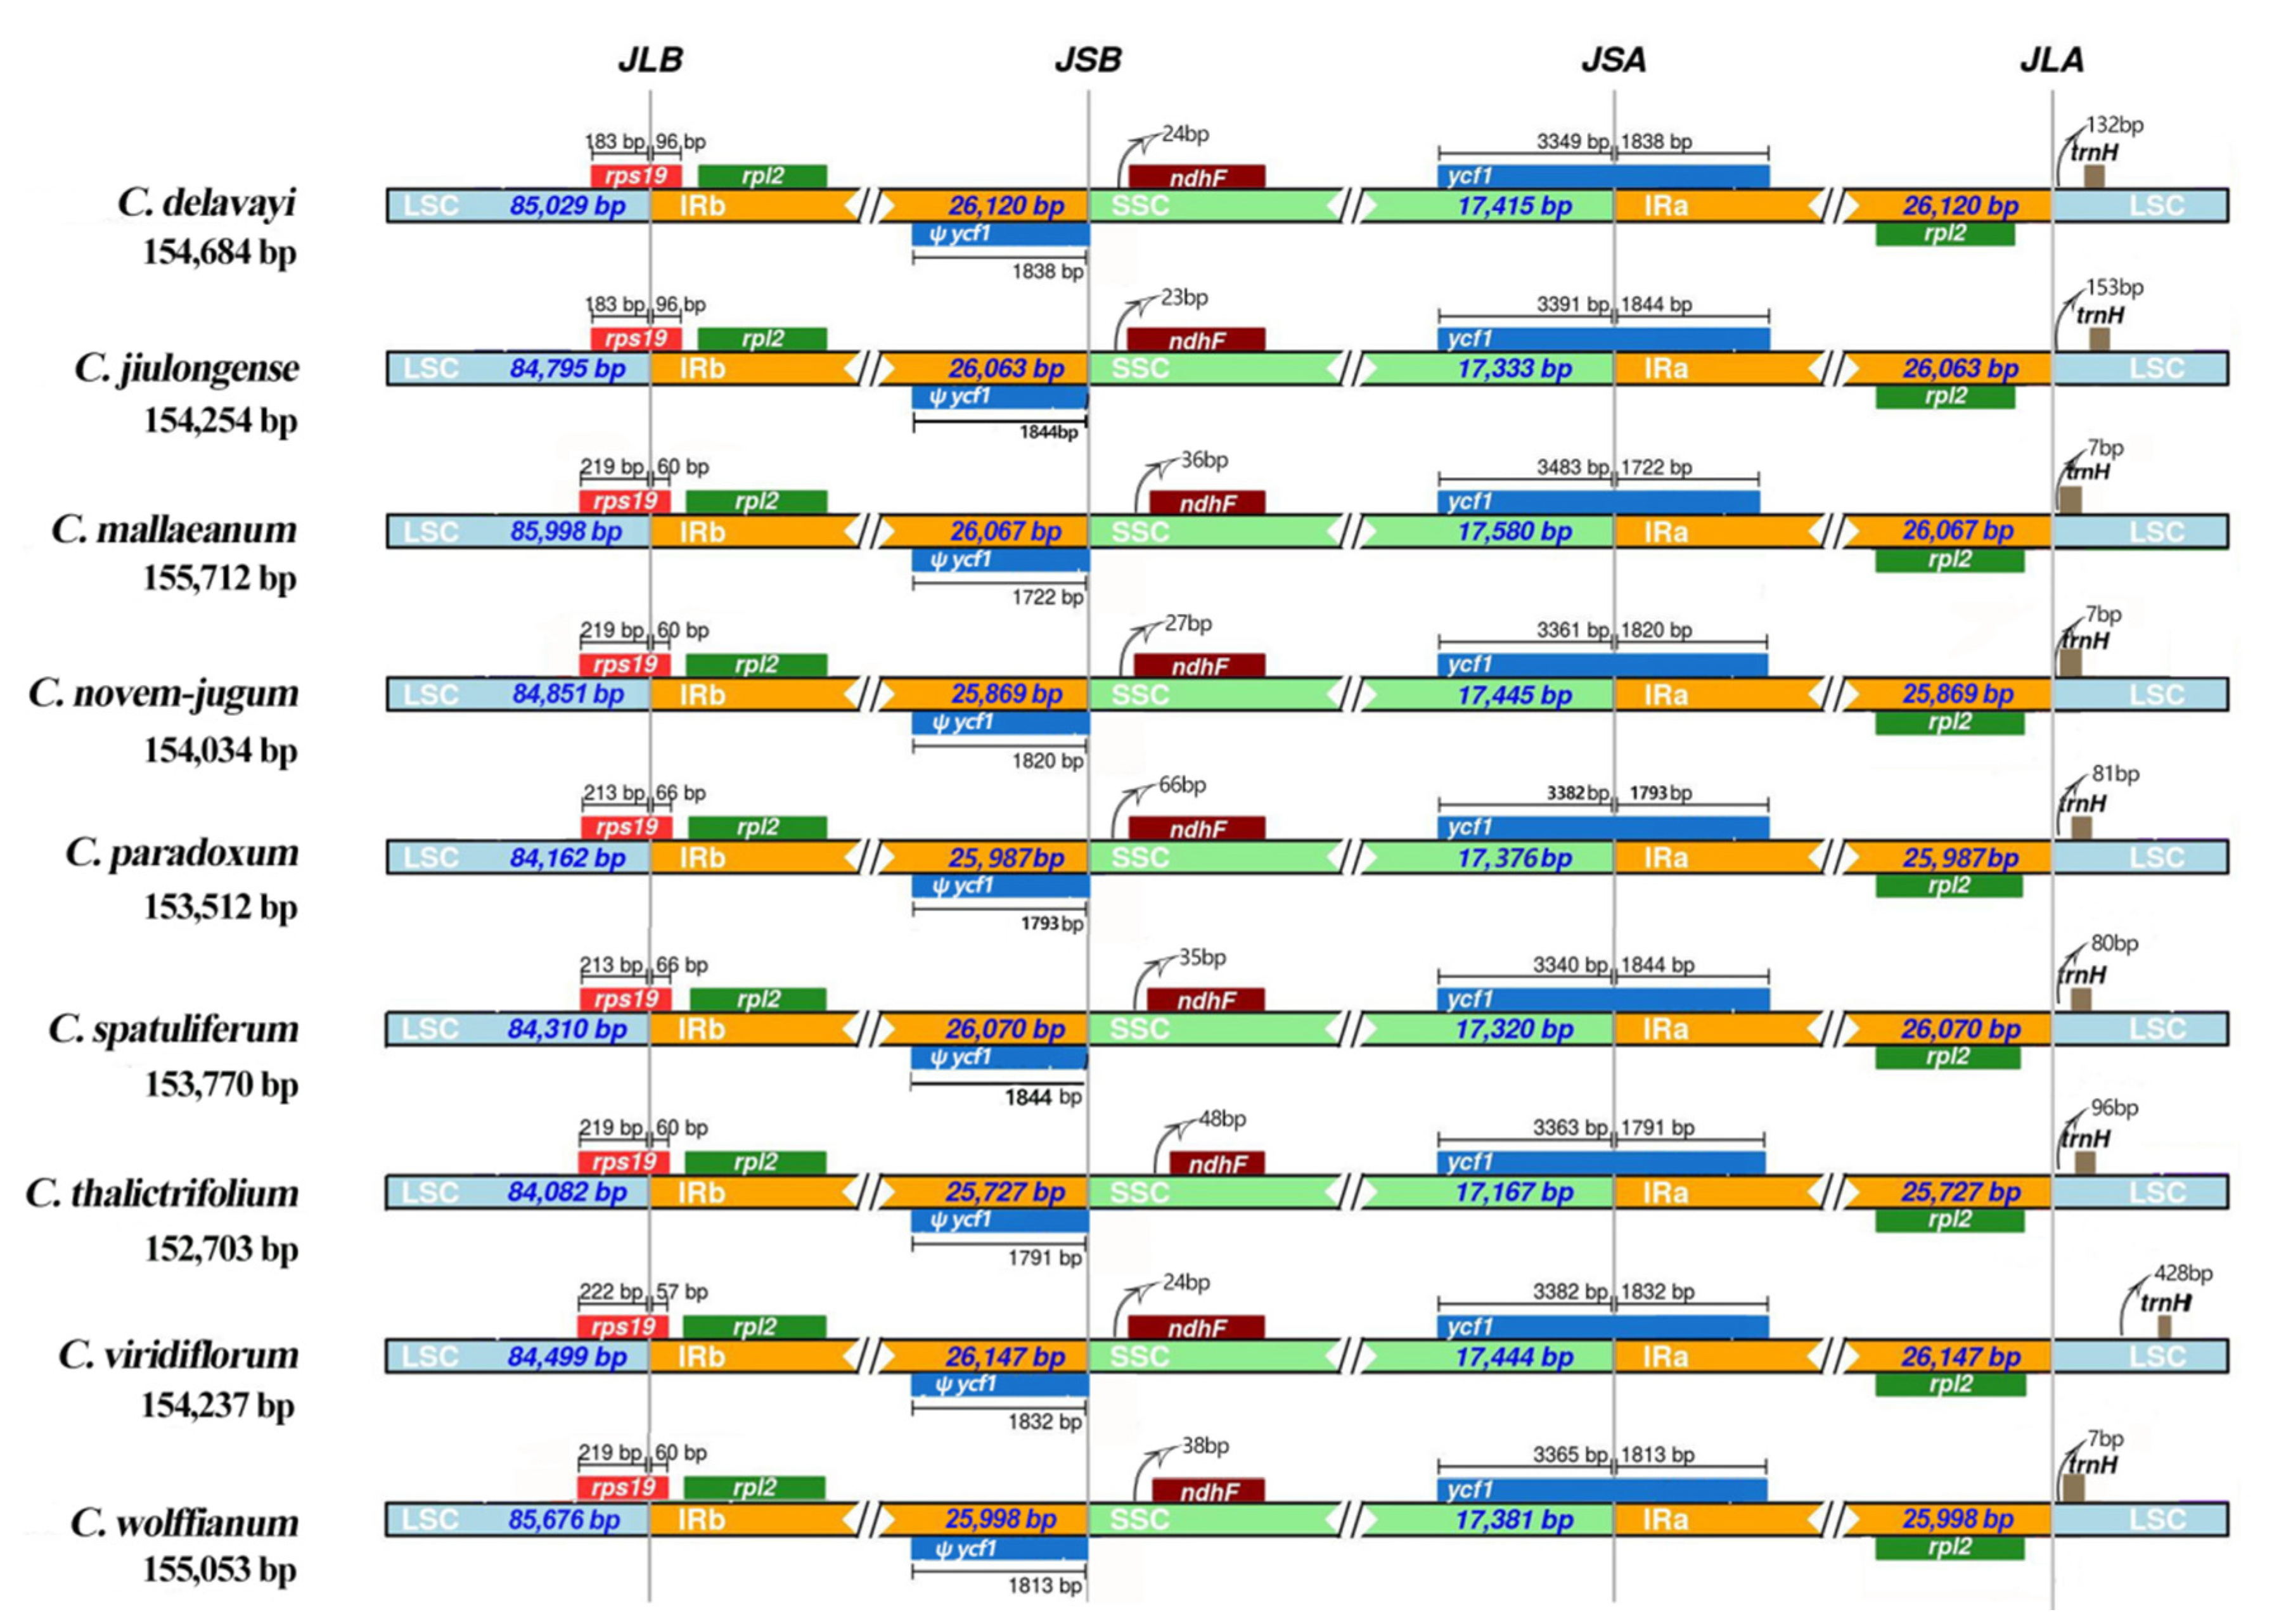
The IR boundaries of the nine Chamaesium plastid genomes were compared to observe the expansions and contractions in this region (Figure 3). Despite the plastid genome of these nine Chamaesium species showing a similar structure, some variations were identified. The IRb region expanded to the rps19 gene with 96 bp, 96 bp, 60 bp, 60 bp, 66 bp, 66 bp, 60 bp, 57 bp and 60 bp in Chamaesium delavayi, C. jiulongense, C. mallaeanum, C. novem-jugum, C. paradoxum, C. spatuliferum, C. thalictrifolium, C. viridiflorum and C. wolffianum, respectively. The ndhF genes of these nine species are encompassed entirely in the SSC region, and a 23–48 bp length of the intergenic region exists between the JSB line (the border between IRb and SSC) and the ndhF gene. The ycf1 gene occupies the SSC and IRa regions (JSA line), with a distance ranging from 1722 to 1844 bp, and is located in the IRa region across the nine species. This also created a corresponding ycf1 pseudogene at the JSB line. The JLA line was located near the region of the trnH gene. The lengths of intergenic space varied between species. C. viridiflorum had the longest intergenic space among these species with 428 bp, whereas C. mallaeanum, C. novem-jugum and C. wolffianum had only 80 bp.
We identified 34 SSR types and 585 SSR loci across the nine species, ranging from 63 SSRs (C. paradoxum, C. spatuliferum and C. thalictrifolium) to 80 SSRs (C. wolffianum) (Supplementary Table S3). Six compound formations of microsatellites (mono-, di-, tri-, tetra-, penta- and hexanucleotide repeats) were found in the plastid genome of the nine Chamaesium species. The most abundant SSRs were mononucleotide repeats, which accounted for 70.94% of all SSRs. Dinucleotide SSRs (15.90%) were the second most common repeat motif, followed by tetranucleotide repeats (8.21%) and trinucleotide repeats (3.59%). Pentanucleotide and hexanucleotide repeats were the least abundant (1.03% and 0.34%).
In C. mallaeanum and C. paradoxum, mononucleotide repeats were composed entirely of A/T, while other mononucleotide repeated motifs, G/C, were uncommon (0.96%, 1.93%). Most dinucleotide repeats were AT/TA (94.62%), and all dinucleotide repeats found in C. delavayi, C. jiulongense, C. spatuliferum and C. thalictrifolium were composed of A/T (Supplementary Table S3).
Across all SSR loci, 413 SSRs (70.60%), 102 SSRs (17.44%) and 70 SSRs (11.97%) were detected in the LSC, IRs and SSC regions of the plastid genome, respectively. It was found that 176 SSRs were located in 23 gene regions (atpB, atpF, cemA, clpP, ndhA, ndhE, ndhF, ndhJ, rpl16, rpoA, rpoB, rpoC1, rpoC2, rps16, ycf1, ycf2, ycf3, trnA-UGC, trnG-GCC, trnI-GAU, trnK-UUU, trnL-UAA, trnV-UAC) (Supplementary Table S3). SSRs were also detected in coding sequence (CDS) regions of the Chamaesium plastid genome. The CDS regions accounted for 49.80%–51.6% of the overall length. Approximately 69.91% of SSRs were found in non-coding regions, whereas only 17.78% of SSRs were in Chamaesium CDS regions (Figure 4).
2.3. Codon Usage Bias of Chamaesium Species and Ka/Ks Ratios of Species Pairwise
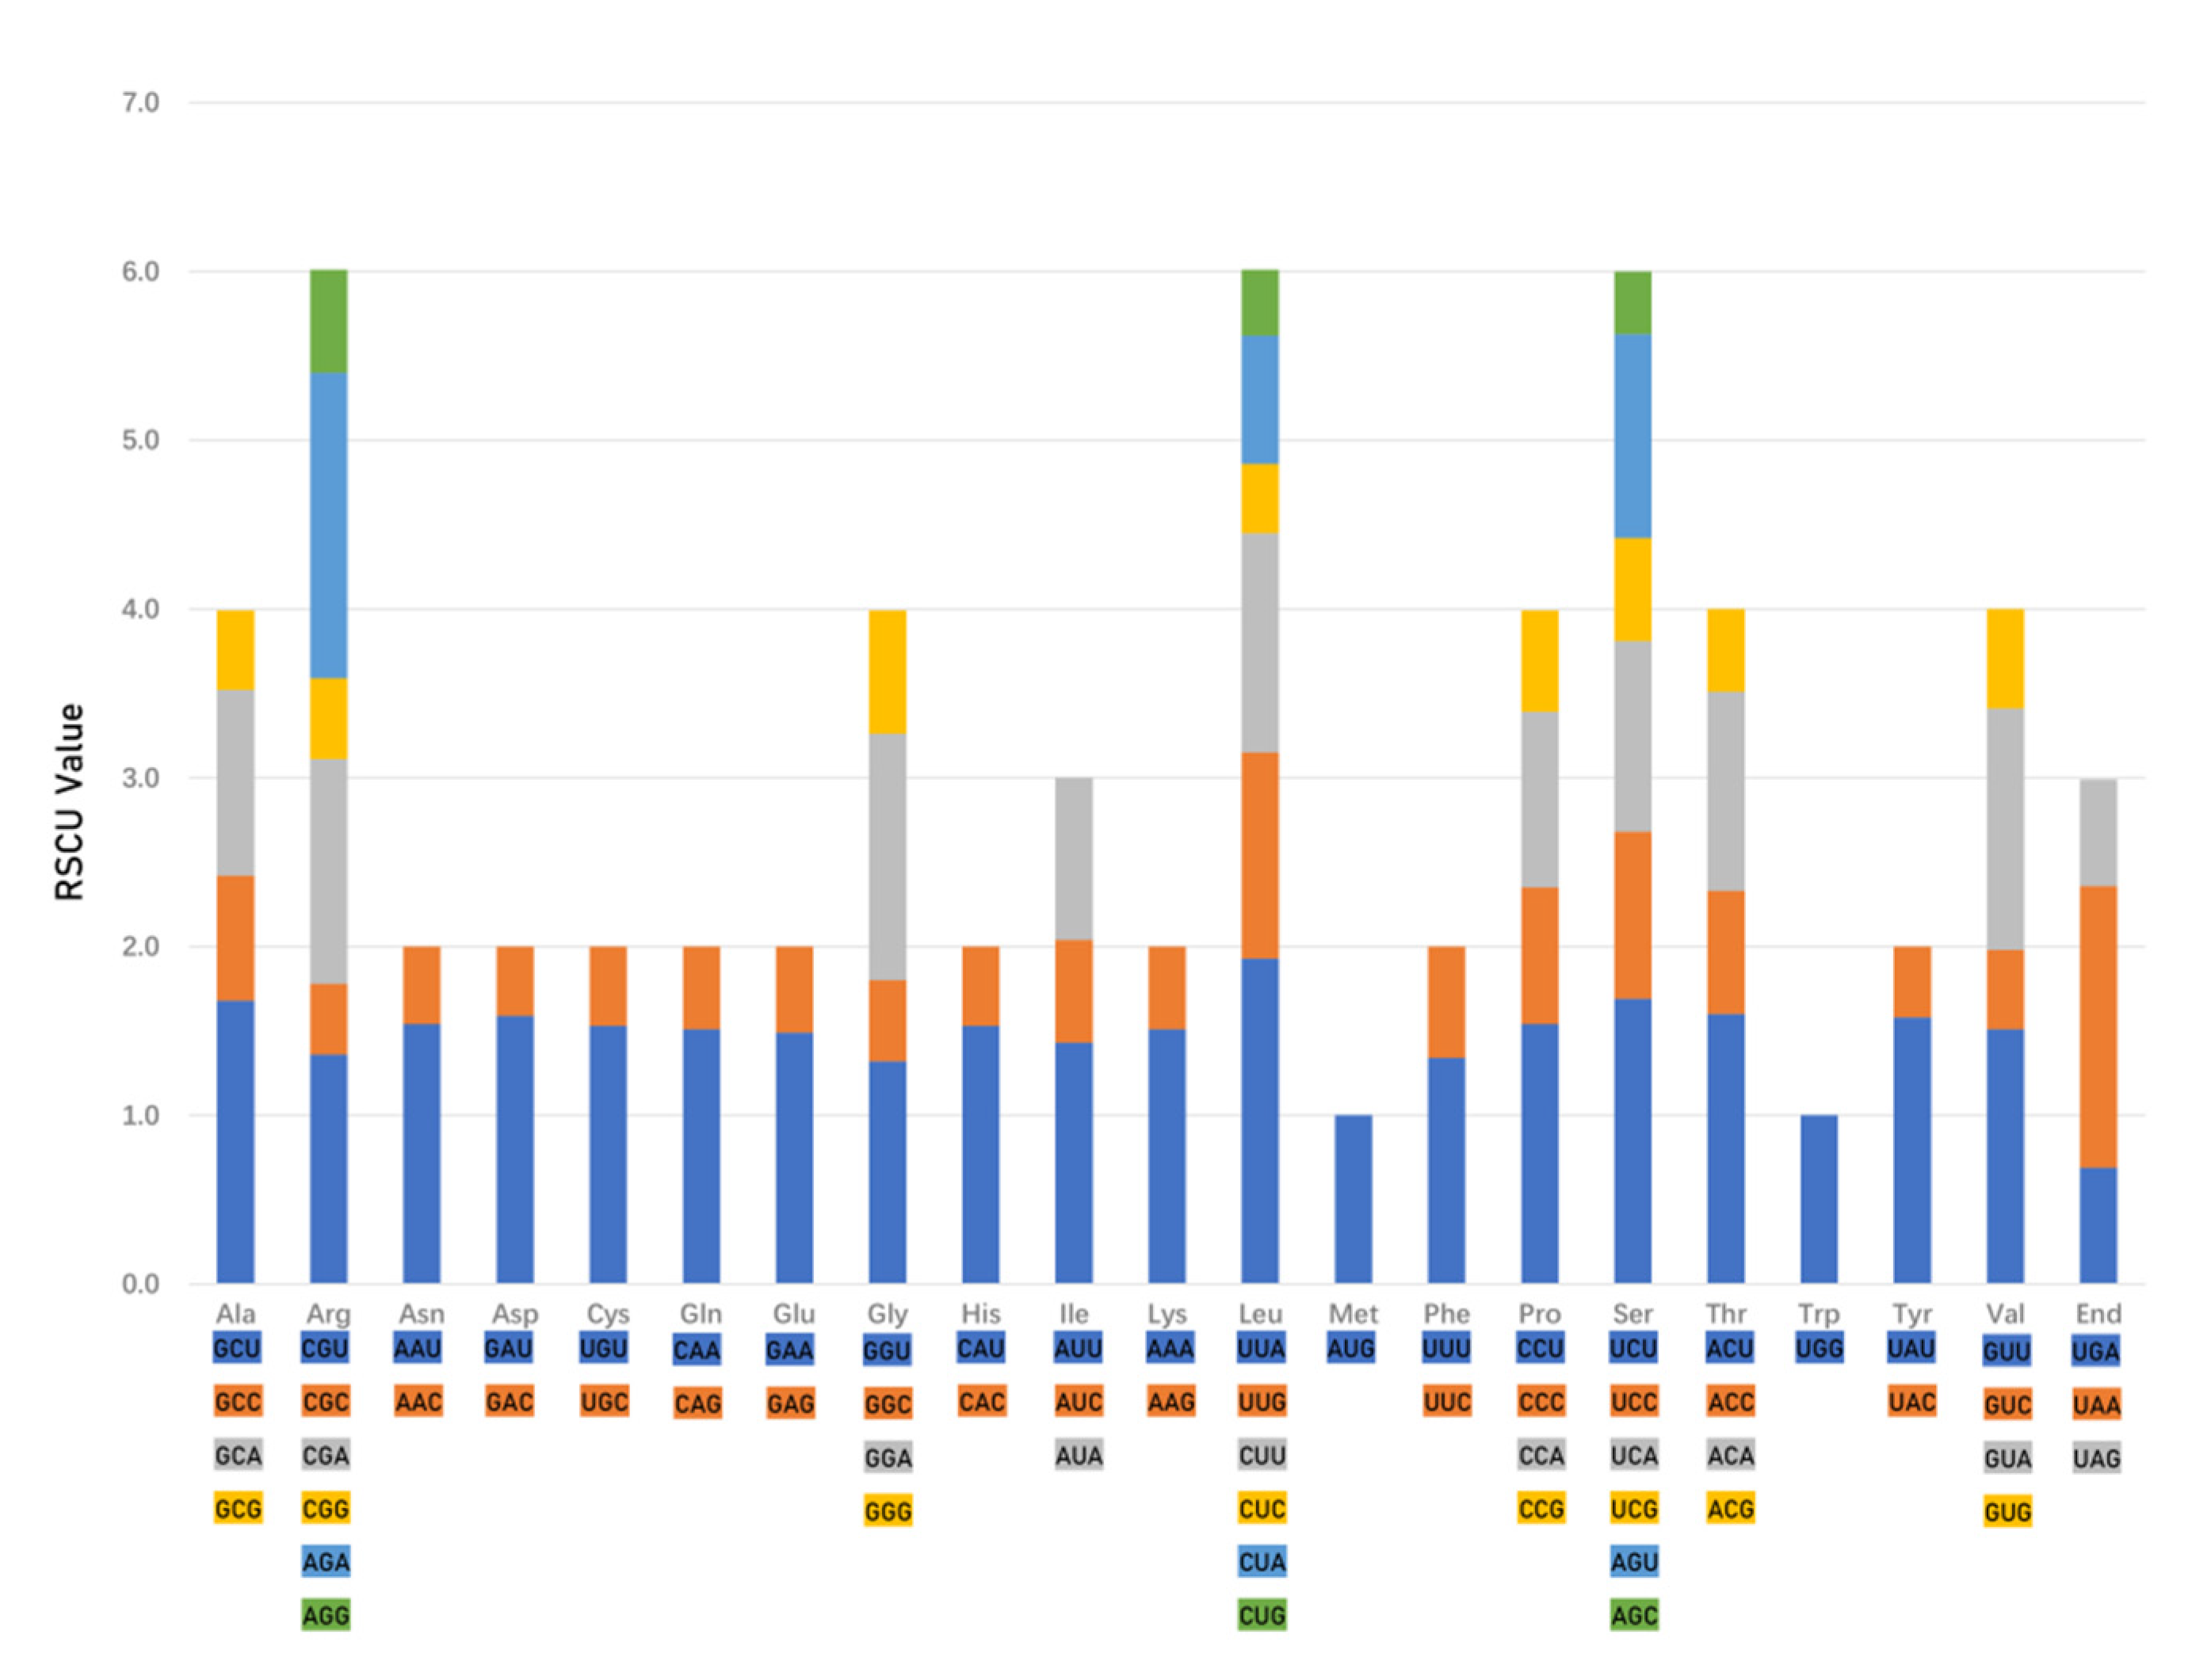
The codon usage frequency and relative synonymous codon usage (RSCU) were analyzed based on 53 protein-coding sequences in the nine Chamaesium species’ plastid genomes (Figure 5 and Supplementary Table S4). The frequency of codon usage in these nine species was similar. The number of codons in protein-coding regions ranged from 20,953 (C. thalictrifolium) to 21,115 (C. mallaeanum). Among these codons, leucine, encoded by 2204–2235, and cysteine, encoded by 218–225, occupied the maximum and minimum of coded amino acids. AUU (838–854) encoding isoleucine and UAG (11–13) encoding a termination codon were the most and least used codons. Codon usage was biased towards A and T at the third codon position in these nine species. Furthermore, 31 codons were detected with an RSCU value of more than 1, indicating that they were the preference codons in the Chamaesium plastid genome. Among these 31 codons, only UGG, AUG and UUG ended with guanine, whereas other codons terminated in A/T, and no cytosine was found in the third position.
The Ka/Ks ratios of the nine species (Supplementary Table S5) provided key information on selective pressure that had taken effect in protein-coding sequences. We found pairwise Ka/Ks ratios ranging from 0.27 to 0.43 in comparisons of the nine Chamaesium (Apiaceae) species (Figure 6). The highest ratio (0.43) was found when comparing C. paradoxum and C. jiulongense, while the lowest ratio (0.27) occurred between C. mallaeanum and C. spatuliferum. All the ratios involved were below 0.5. Therefore, the conservation of plastid protein-coding sequences was confirmed in the genus Chamaesium.
2.4. Phylogeny of Chamaesium
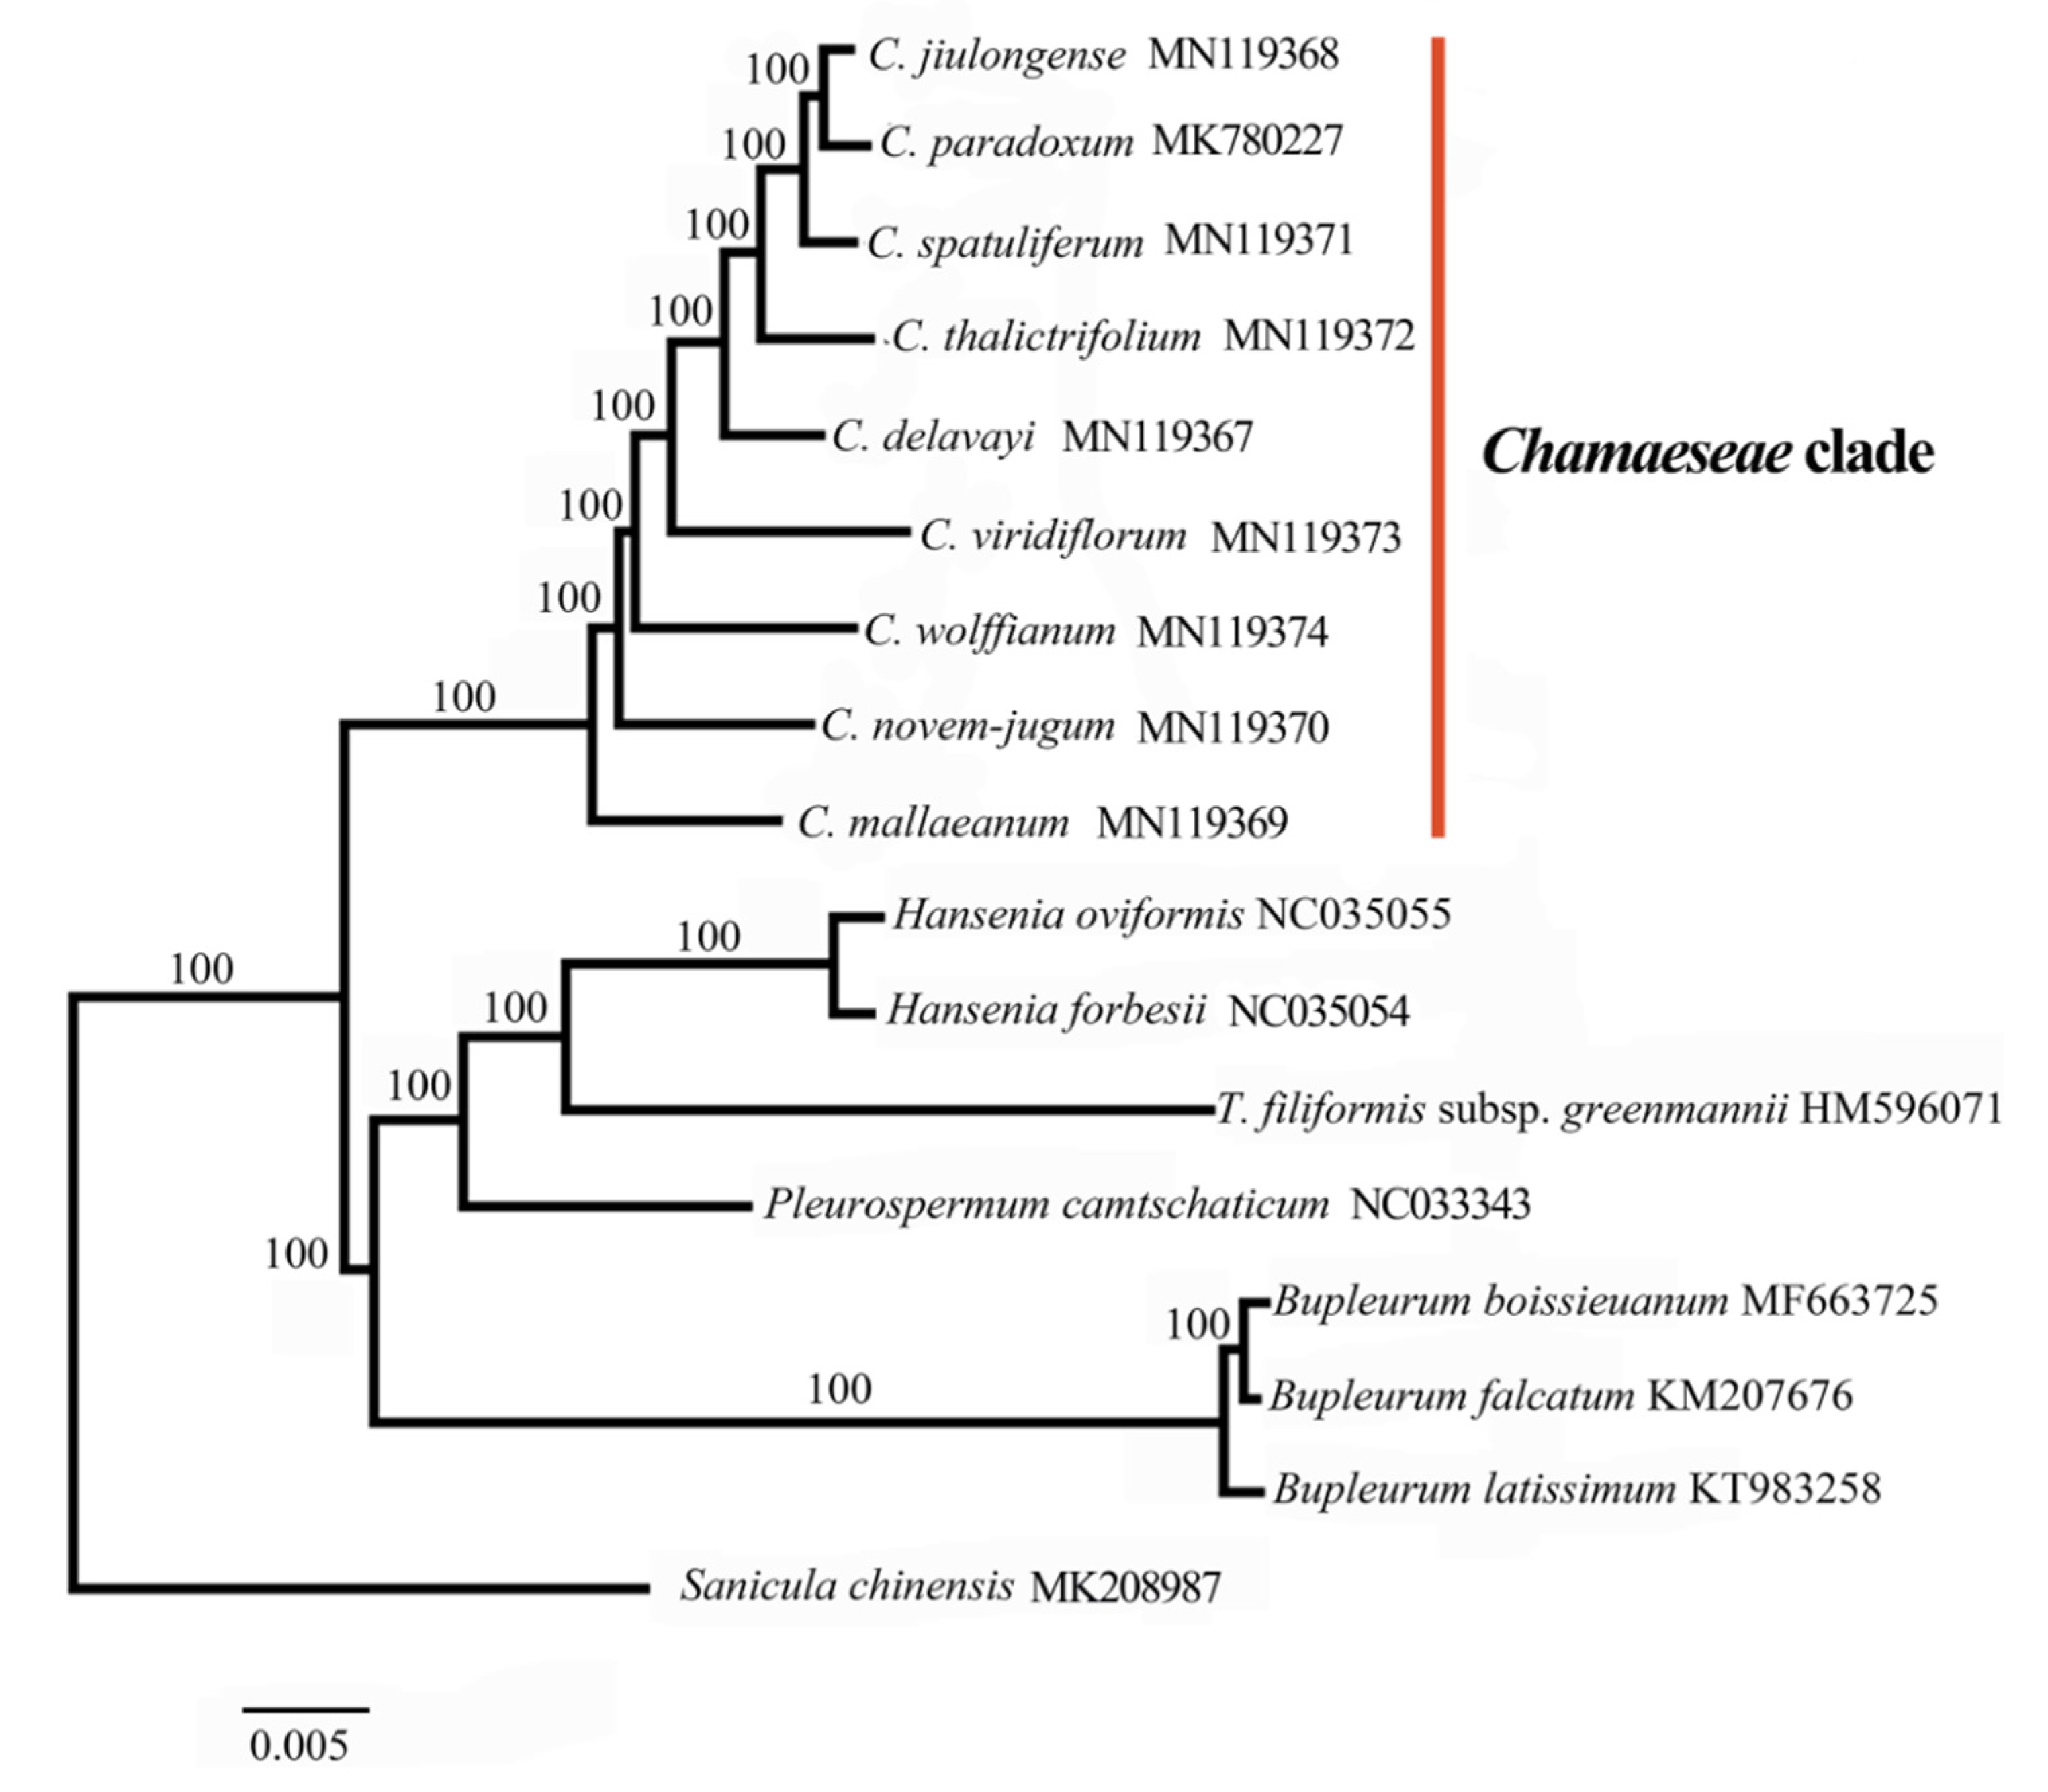
Our phylogenetic analysis confirmed that the nine species of Chamaesium formed a monophyletic clade (100%) within the Chamaeseae clade (Figure 7), which was consistent with the previous study [9,10]. The inter-specific relationships within Chamaesium were strongly supported by our analyses. Chamaesium mallaeanum was the earliest to speciate, followed by C. novem-jugum, C. wolffianum, C. viridiflorum and C. delavayi in order of separation. The latest differentiated taxa, C. thalictrifolium, C. spatuliferum, C. paradoxum and C. jiulongense, were very closely related. C. spatuliferum is sister to the clade comprising C. paradoxum and C. jiulongense with a strong support (100%). The topological structure of the maximum likelihood (ML) tree in this study was consistent with previous trees created using gene fragments by maximum parsimony and Bayesian inference [8].
3. Discussion
3.1. The Fluctuations of IR Regions, Genes and Pseudogenes (ψs) in the Plastid Genome
This study indicates that the lengths of the simple IR region in the nine Chamaesium species are very similar (25,727–26,147 bp). The IR region stabilizes and enhances the conserved form of the plastid genome. The high gene conversion ability exists in the plastid genome, ensuring the consistency and stability of the two IR regions [22,23,24]. Generally, IR boundaries between different species are diverse [25]. Fluctuations (expansions and contractions) of the IR regions are the main reasons for the differences in length of the plastid genome, which also causes several genes to enter the IR region or the single-copy sequence [26]. The IR regions of plants such as Pelargonium hortorum, Pisum sativum, Cryptomeria fortunei and Erodium spp. are notably inconsistent in length [27,28,29]. In the present study, there was little variation in the length of the two IR regions of the nine Chamaesium species, and the simple IR length of ca. 26,000 bp is typical in Apiaceae and other families [30,31,32,33,34].
The total number of Chamaesium plastid genes is 133, including pseudogenes. Pseudogenes (ψs) are disabled copies of PCGs and are often referred to as genomic fossils [35,36]. Protein-coding genes will become ψs if degenerated features are present, such as frameshifts, in-frame stop codons and truncations of full-length genes [37,38]. The pseudogene ψycf1 with ca. 1800 bp length was detected in all Chamaesium species in the JSB line, and it has been controversial whether ycf15, as a member of this family, has encoding protein properties [39,40,41]. We found that ycf15 was annotated as a pseudogene in Foeniculum vulgare and Daucus carota based on previous studies [42] for the existence of many terminators, and this similar structure was also detected in the nine species of Chamaesium. The pseudogenes may act on these species’ evolution. More comprehensive evidence is needed to support this hypothesis.
3.2. Codon Usage Analysis, Ka/Ks and Selection Pressure
A similar codon (AT) usage bias was found in all nine Chamaesium species. A higher AT content at the third codon position was detected in the nine Chamaesium species, which was also observed in other terrestrial plant plastid genomes [43,44,45,46]. Furthermore, codons ending with A/T were more common among codons with high RSCU values. These findings are consistent with other reported angiosperm genomes [47,48]. Codon usage biases are related to the carriage of genetic information and proteins with biochemical functions [48,49]. These results on codon usage bias may assist us in better understanding the molecular evolution mechanisms and gene expression in Chamaesium species [50,51,52,53].
We found a lack of a sufficient variety of sites at the simple gene level; thus, we aligned 53 CDSs of the nine Chamaesium species, and pairwise comparisons found that all ratios were below 0.5. The ratio of Ka/Ks refers to the ratio of the number of non-synonymous substitutions per non-synonymous site (Ka) to the number of synonymous substitutions per synonymous site (Ks) [54]. The ratio can be used as an indicator to measure the selection pressure of the protein-encoding gene [55]. This is equal to the neutral selection; that is, the ratio of observed non-synonymous mutations to synonymous mutations matches the ratio of the expected random mutation model. Therefore, amino acid changes are neither selected nor eliminated. A value greater than 1 indicates that amino acid changes are evolutionarily preferred, meaning that these mutations are more adapted [56,57]. This unusual state may reflect changes in gene function or changes in environmental conditions that force the body to adapt. Consequently, the conservative plastid protein-coding sequences were confirmed in Chamaesium, and little variety occurred among these species, especially in key genes.
3.3. Phylogenetic Analysis
Our results indicate that the nine species of Chamaesium form a monophyletic group (1/100%) in the Chamaeseae clade by maximum likelihood (ML) analysis. The inter-specific relationships within Chamaesium are strongly supported by our findings. We found that C. mallaeanum, which is distributed in the Himalayas, was the earliest differentiated taxon, and the Himalayas is close to the ancestral location of the ancestor Chamaesium species. Chamaesium novem-jugum, C. wolffianum, C. viridiflorum and C. delavayi are distributed narrowly in Tibet and North Yunnan, radiating out from the Himalayas in the next speciation event. The latest differentiated taxa, C. thalictrifolium, C. spatuliferum, C. paradoxum and C. jiulongense, are distributed widely in south Gansu, south Qinghai and west Sichuan. Originating from the Himalayas and spreading to the Hengduan Mountains is the most reliable explanation for the origin of this genus.
4. Materials and Methods
4.1. Plant Material and DNA Extraction
The nine species investigated in this study were Chamaesium delavayi, C. jiulongense, C. mallaeanum, C. novem-jugum, C. paradoxum, C. spatuliferum, C. thalictrifolium, C. viridiflorum and C. wolffianum. Voucher specimens of these species were deposited in the herbarium of Sichuan University (SZ) (Supplementary Table S1). Fresh leaves were collected from the wild, and they were desiccated and stored in silica gel. Total genomic DNA was extracted from leaf materials, using the modified CTAB procedure [58].
4.2. Illumina Sequencing, Assembly, and Annotation
Total genomic DNA was sequenced using an Illumina Novaseq 6000 platform (Illumina, San Diego, CA, USA) with Novaseq 150 sequencing strategy by Novogene (Beijing, China). The remaining clean data were assembled using NOVOPlasty 2.7.1 [59] with K-mer 39, where rbcL of Chuanminshen violaceum (GenBank accession No.: KU921430) was used as seed input and the reference sequence. The assembled nine whole plastid genomes were mapped against the reference plastid genome of Chuanminshen violaceum using GENEIOUS R11 [60].
4.3. Genome Annotation and Repeat Structure
Gene and IR regions annotation of the assembled genomes was undertaken using PGA [61]. Manual modifications for the uncertain start and stop codons were conducted based on comparison with homologous genes from other species’ plastid genomes using GENEIOUS R11. Circular gene maps for these annotated genomes were drawn using the online program of OGDRAW [62]. The nine Chamaesium species’ annotated genome sequences were submitted to GenBank, and their corresponding accession numbers are listed in Supplementary Table S1.
4.4. Contraction and Expansion of IRs, GC Content and SSR
The boundaries between the IR and SC regions of the nine Chamaesium species were compared using the program IRscope. (https://irscope.shinyapps.io/irapp/) [63]. The total GC content and GC content of each region (IR, LSC, SSC) were compared between the nine species based on the program GENEIOUS R11. The plastid SSRs were identified using Perl script MISA [64] with the following repeat threshold settings: 10 repeats for mononucleotide, 5 for dinucleotide, 4 for trinucleotide and 3 repeats for tetra-, penta- and hexanucleotide SSRs.
4.5. Phylogenetic Analyses
To infer phylogenetic relationships within Chamaesium, the nine plastid genomes were compared to Bupleurum boissieuanum, Bupleurum falcatum, Bupleurum latissimum, Hansenia forbesii, Hansenia oviformis, Pleurospermum camtschaticum, Tiedemannia filiformis subsp. greenmannii and Sancula chinense as outgroups. All plastid genome sequences were aligned using MAFFT v7.402 [65]. Maximum likelihood analyses were conducted using RAxML v7.2.8 [66] with GTR+G, the best-fit model selected by ModelFinder and 1000 bootstrap replicates.
4.6. Codon Usage and Ka/Ks Ratios of Species Pairwise Analysis
A total of 53 coding sequences (CDSs) (>300 bp) in the plastid genome of Chamaesium were used to analyze the ratios of the synonymous site (Ks) and non-synonymous site (Ka). These 53 CDSs were aligned with MAFFT v. 7 [65]. Manual alterations were performed by MEGA6 [67]. Pairwise Ka/Ks ratios of the nine species were calculated based on the 53 CDS alignments in KaKs Calculator 2.0 [68].
Supplementary Materials
The following are available online at https://www.mdpi.com/2223-7747/9/8/965/s1, Table S1: Voucher details and GenBank accession numbers of taxa used in this study. Table S2: Summary of complete plastid genome features. Table S3: Statistics of simple sequence repeats in Chamaesium. Table S4: Statistics of codon usage bias in Chamaesium. Table S5: Comparative analysis of Ka/Ks value in Chamaesium.
Author Contributions
Conceptualization, X.-L.G., H.-Y.Z., S.-D.Z. and X.-J.H.; Data curation, X.-L.G. and H.-Y.Z.; Formal analysis, X.-L.G. and H.-Y.Z.; Methodology, X.-L.G. and H.-Y.Z.; Resources, X.-L.G. and H.-Y.Z.; Software, X.-L.G. and H.-Y.Z.; Supervision, S.-D.Z. and X.-J.H.; Writing—original draft, X.-L.G. and H.-Y.Z.; Writing—review & editing, X.-L.G., H.-Y.Z., M.P., S.-D.Z. and X.-J.H. All authors have read and agreed to the published version of the manuscript.
Funding
This work was supported by the National Natural Science Foundation of China (Grant Nos. 31872647, 31570198). The Chinese Ministry of Science and Technology throng the National Science and Technology Infrastructure Platform Project (Grant No. 2005DKA21403-JK). The fourth national survey of traditional Chinese medicine resources (Grant No. 2019PC002).
Acknowledgments
We acknowledge Xin Yang, Dan-Mei Su and Fu-Min Xie for their help in materials collection. We would like to thank Deng-Feng Xie and Juan Li for their help in software use.
Conflicts of Interest
The authors declare no conflict of interest.
References
- Liu, S.L. Chamaesium. In Flora Reipublicae Popularis Sinicae; Shan, R.H., She, M.L., Eds.; Science Press: Beijing, China, 1979; Volume 55, pp. 124–133. [Google Scholar]
- Wu, Z.Y. Umbelliferae. In Flora Yunnanica; Science Press: Beijing, China, 1997; Volume 17, pp. 357–640. [Google Scholar]
- Pimenov, M.G.; Kljuykov, E.V.; Dickore, W.B.; Miehe, G. Four Himalayan Umbelliferae new to the flora of China, with critical notes on Tordyliopsis DC. and Keraymonia Farille. Willdenowia 2000, 30, 361–367. [Google Scholar] [CrossRef]
- Pimenov, M.G.; Kljuykov, E.V. What is Sium frigidum Hand.-Mazz. (Umbelliferae)? Feddes Repert. 2003, 114, 350–357. [Google Scholar] [CrossRef]
- She, M.L.; Pu, F.D.; Pan, Z.H.; Watson, M.F.; Cannon, J.F.M.; Holmes-Smith, I.; Kljuykov, E.V.; Phillippe, L.R.; Pimenov, M.G. Apiaceae (Umbelliferae). In Flora of China; Wu, Z.Y., Raven, R.H., Eds.; Science Press: Beijing, China; Missouri Botanical Garden Press: St. Louis, MO, USA, 2005; Volume 15, pp. 1–205. [Google Scholar]
- Pimenov, M.G. Updated checklist of Chinese Umbelliferea: Nomenclature, synonymy, typification, distribution. Turczaninowia 2017, 20, 106–239. [Google Scholar]
- Guo, X.L.; Xie, C.; Bai, J.; He, X.J. Chamaesium jiulongense sp. nov (Apiaceae), from Sichuan, China. Nord. J. Bot. 2017, 35, 676–680. [Google Scholar] [CrossRef]
- Guo, X.L.; Wang, C.B.; Wen, J.; Zhou, S.D.; He, X.J. Phylogeny of Chinese Chamaesium (Apiaceae: Apioideae) inferred from ITS, cpDNA and morphological characters. Phytotaxa 2018, 376, 1. [Google Scholar] [CrossRef]
- Zhou, J.; Peng, H.; Downie, S.R.; Liu, Z.W.; Gong, X.A. Molecular phylogeny of Chinese Apiaceae subfamily Apioideae inferred from nuclear ribosomal DNA internal transcribed spacer sequences. Taxon 2008, 57, 402–416. [Google Scholar]
- Zhou, J.; Gong, X.; Downie, S.R.; Peng, H. Towards a more robust molecular phylogeny of Chinese Apiaceae subfamily Apioideae: Additional evidence from nrDNA ITS and cpDNA intron (rpl16 and rps16) sequences. Molecul. Phylogenet. Evol. 2009, 53, 56–68. [Google Scholar] [CrossRef]
- Marechal, A.; Brisson, N. Recombination and the maintenance of plant organelle genome stability. New Phytol. 2010, 186, 299–317. [Google Scholar] [CrossRef]
- Jansen, R.K.; Raubeson, L.A.; Boore, J.L.; de Pamphilis, C.W.; Chumley, T.W.; Haberle, R.C.; Wyman, S.K.; Alverson, A.J.; Peery, R.; Herman, S.J.; et al. Methods for obtaining and analyzing whole chloroplast genome sequences. Methods Enzym. 2005, 395, 348–384. [Google Scholar]
- Jansen, R.K.; Ruhlman, T.A. Plastid genomes of seed plants. In Genomics of Chloroplasts and Mitochondria; Bock, R., Knoop, V., Eds.; Springer: Dordrecht, The Netherlands, 2012; Volume 35, pp. 103–126. [Google Scholar]
- Ravi, V.; Khurana, J.P.; Tyagi, A.K.; Khurana, P. An update on chloroplast genomes. Plant Syst. Evol. 2008, 271, 101–122. [Google Scholar] [CrossRef]
- Huang, J.; Chen, R.; Li, X. Comparative Analysis of the Complete Chloroplast Genome of Four Known Ziziphus Species. Genes 2017, 8, 340. [Google Scholar] [CrossRef] [PubMed] [Green Version]
- Zheng, H.Y.; Guo, X.L.; He, X.J.; Yu, Y.; Zhou, S.D. The complete chloroplast genome of Chamaesium paradoxum. Mitochondrial DNA B 2019, 4, 2069–2070. [Google Scholar] [CrossRef] [Green Version]
- Jansen, R.K.; Cai, Z.; Raubeson, L.A.; Daniell, H.; Depamphilis, C.W.; Leebens-Mack, J.; Müller, K.F.; Guisinger-Bellian, M.; Haberle, R.C.; Hansen, A.K.; et al. Analysis of 81 genes from 64 plastid genomes resolves relationships in angiosperms and identifies genome-scale evolutionary patterns. Proc. Natl. Acad. Sci. USA 2007, 104, 19369–19374. [Google Scholar] [CrossRef] [PubMed] [Green Version]
- Dong, W.P.; Liu, J.; Yu, J.; Wang, L.; Zhou, S.L. Highly variable chloroplast markers for evaluating plant phylogeny at low taxonomic levels and for DNA barcoding. PLoS ONE 2012, 7, e35071. [Google Scholar] [CrossRef]
- Wang, Y.; Zhan, D.F.; Jia, X.; Mei, W.L.; Dai, H.F.; Chen, X.T.; Peng, S.Q. Complete Chloroplast Genome Sequence of Aquilaria sinensis (Lour.) Gilg and Evolution Analysis within the Malvales Order. Front. Plant Sci. 2016, 7, 280. [Google Scholar] [CrossRef] [Green Version]
- Xu, C.; Dong, W.P.; Li, W.Q.; Lu, Y.Z.; Xie, X.M.; Jin, X.B.; Shi, J.P.; He, K.L.; Suo, Z.L. Comparative Analysis of Six Lagerstroemia Complete Chloroplast Genomes. Front. Plant Sci. 2017, 8, 15. [Google Scholar] [CrossRef] [Green Version]
- Xie, D.F.; Yu, H.X.; Price, M.; Xie, C.; Deng, Y.Q.; Chen, J.P.; Yu, Y.; Zhou, S.D.; He, X.J. Phylogeny of Chinese Allium Species inSection Daghestanica and Adaptive Evolution of Allium (Amaryllidaceae, Allioideae) Species Revealed by the Chloroplast Complete Genome. Front. Plant Sci. 2019, 10, 460. [Google Scholar] [CrossRef] [Green Version]
- Khakhlova, O.; Bock, R. Elimination of deleterious mutations in plastid genomes by gene conversion. Plant J. 2006, 46, 85–94. [Google Scholar] [CrossRef]
- Li, X.W.; Gao, H.H.; Wang, Y.T.; Song, J.Y.; Henry, R.; Wu, H.Z.; Hu, Z.G.; Yao, H.; Luo, H.M.; Luo, K.; et al. Complete chloroplast genome sequence of Magnolia grandiflora and comparative analysis with related species. Sci. China Life Sci. 2013, 56, 189–198. [Google Scholar] [CrossRef] [Green Version]
- Fu, J.; Liu, H.; Hu, J.; Liang, Y.; Liang, J.; Wuyun, T.; Tan, X. Five complete chloroplast genome sequences from diospyros: Genome organization and comparative analysis. PLoS ONE 2016, 11, e0159566. [Google Scholar] [CrossRef] [Green Version]
- Nie, X.; Lv, S.; Zhang, Y.; Du, X.; Wang, L.; Biradar, S.S.; Tan, X.; Wan, F.; Weining, S. Complete chloroplast genome sequence of a major invasive species, crofton weed (Ageratina adenophora). PLoS ONE 2012, 7, e36869. [Google Scholar] [CrossRef] [Green Version]
- Chung, H.-J.; Jung, J.D.; Park, H.-W.; Kim, J.-H.; Cha, H.W.; Min, S.R.; Jeong, W.-J.; Liu, J.R. The complete chloroplast genome sequences of Solanum tuberosum and comparative analysis with Solanaceae species identified the presence of a 241-bp deletion in cultivated potato chloroplast DNA sequence. Plant Cell Rep. 2006, 25, 1369–1379. [Google Scholar] [CrossRef]
- Chumley, T.W.; Palmer, J.D.; Mower, J.P.; Fourcate, H.R.; Calie, P.J.; Boore, J.L.; Jason, R.K. The complete chloroplast genome sequence of Pelargonium xhortorum: Organization and evolution of the largest and most highly rearranged chloroplast genome of land plants. Mol. Biol. Evol. 2006, 23, 2175–2190. [Google Scholar] [CrossRef]
- Hirao, T.; Watanabe, A.; Manabu, K.; Kondo, T.; Takata, K. Complete nucleotide sequence of the Cryptomeria japonica D. Don. chloroplast genome and comparative chloroplast genomics: Diversified genomic structure of coniferous species. BMC Plant Biol. 2008, 8, 70. [Google Scholar] [CrossRef] [Green Version]
- Guisinger, M.M.; Kuehl, J.V.; Boore, J.L.; Jansen, R.K. Extreme reconfiguration of plastid genomes in the angiosperm family Geraniaceae: Rearrangements, repeats, and codon usage. Mol. Biol. Evol. 2011, 28, 583–600. [Google Scholar] [CrossRef] [Green Version]
- Plunkett, G.M.; Downie, S.R. Expansion and Contraction of the Chloroplast Inverted Repeat in Apiaceae Subfamily Apioideae. Syst. Bot. 2000, 25, 648–667. [Google Scholar] [CrossRef]
- Hansen, D.R.; Dastidar, S.G.; Cai, Z.; Penaflor, C.; Kuehl, J.V.; Boore, J.L.; Jason, R.K. Phylogenetic and evolutionary implications of complete chloroplast genome sequences of four early diverging angiosperms: Buxus (buxaceae), chloranthus (chloranthaceae), dioscorea (dioscoreaceae), and illicium (schisandraceae). mol phylogenet evol. Mol. Phylogenetics Evol. 2007, 45, 547–563. [Google Scholar] [CrossRef]
- Peery, R. Understanding Angiosperm Genome Interactions and Evolution: Insights from Sacred Lotus (Nelumbo Nucifera) and the Carrot Family (Apiaceae). Ph.D. Thesis, University of Illinois at Urbana-Champaign, Champagne, IL, USA, 2015. [Google Scholar]
- Sun, Y.; Moore, M.J.; Zhang, S.; Soltis, P.S.; Soltis, D.E.; Zhao, T.; Meng, A.; Li, X.; Li, J.; Wang, H. Phylogenomic and structural analyses of 18 complete plastomes across all families of early-diverging eudicots, including an angiosperm-wide analysis of ir gene content evolution. Mol. Phylogenetics Evol. 2016, 96, 93–101. [Google Scholar] [CrossRef] [Green Version]
- Li, J.; Xie, D.F.; Guo, X.L.; Zheng, Z.Y.; He, X.J.; Zhou, S.D. Comparative Analysis of the Complete Plastid Genome of Five Bupleurum Species and New Insights into DNA Barcoding and Phylogenetic Relationship. Plants 2020, 9, 543. [Google Scholar] [CrossRef]
- Balasubramanian, S.; Zheng, D.; Liu, Y.-J.; Fang, G.; Frankish, A.; Carriero, N.; Robilotto, R.; Cayting, P.; Gerstein, M. Comparative analysis of processed ribosomal protein pseudogenes in four mammalian genomes. Genome Biol. 2009, 10, R2. [Google Scholar] [CrossRef] [Green Version]
- Sisu, C.; Pei, B.; Leng, J.; Frankish, A.; Zhang, Y.; Balasubramanian, S.; Harte, R.; Wang, D.; Rutenberg-Schoenberg, M.; Clark, W.; et al. Comparative analysis of pseudogenes across three phyla. Proc. Natl. Acad. Sci. USA 2014, 111, 13361–13366. [Google Scholar] [CrossRef] [Green Version]
- Zhang, Z.; Harrison, P.M.; Liu, Y.; Gerstein, M. Millions of years of evolution preserved: A comprehensive catalog of the processed pseudogenes in the human genome. Genome Res. 2003, 13, 2541–2558. [Google Scholar] [CrossRef]
- Zou, C.; Lehti-Shiu, M.D.; Thibaud-Nissen, F.; Prakash, T.; Buell, C.R.; Shiu, S.H. Evolutionary and expression sig-natures of pseudogenes in Arabidopsis and rice. Plant Physiol. 2009, 151, 3–15. [Google Scholar] [CrossRef] [Green Version]
- Schmitz-Linneweber, C.; Maier, R.M.; Alcaraz, J.-P.; Cottet, A.; Herrmann, R.G.; Mache, R. The plastid chromosome of spinach (Spinacia oleracea): Complete nucleotide sequence and gene organization. Plant Mol. Biol. 2001, 45, 307–315. [Google Scholar] [CrossRef]
- Goremykin, V.V.; Hirsch-Ernst, K.I.; Wölfl, S.; Hellwig, F.H. Analysis of the Amborella trichopoda chloroplast genome sequence suggests that Amborella is not a basal angiosperm. Mol. Biol. Evol. 2003, 20, 1499–1505. [Google Scholar] [CrossRef]
- Raubeson, L.A.; Peery, R.; Chumley, T.W.; Dziubek, C.; Fourcade, H.M.; Boore, J.L.; Jansen, R.K. Comparative chloroplast genomics: Analyses including new sequences from the angiosperms Nuphar advena and Ranunculus macranthus. BMC Genom. 2007, 8, 174. [Google Scholar] [CrossRef] [Green Version]
- Gao, N.N.; Zhao, Z.L.; Ni, L.H. Prospect: Identification of medicinal plant based on plastid gene ycf15. Chin. Tradit. Herb. Drugs 2017, 48, 3201–3217. [Google Scholar]
- Clegg, M.T.; Gaut, B.S.; Learn, G.H.; Morton, B.R. Rates and patterns of chloroplast DNA evolution. Proc. Natl. Acad. Sci. USA 1994, 91, 6795–6801. [Google Scholar] [CrossRef] [Green Version]
- Liu, Q.; Xue, Q. Codon usage in the chloroplast genome of rice (Oryza sativa L. ssp. japonica). Acta Agron. Sin. 2004, 30, 1220–1224. [Google Scholar]
- Zhou, M.; Long, W.; Li, X. Analysis of synonymous codon usage in chloroplast genome of Populus alba. For. Res. 2008, 19, 293–297. [Google Scholar] [CrossRef]
- Tangphatsornruang, S.; Sangsrakru, D.; Chanprasert, J.; Uthaipaisanwong, P.; Yoocha, T.; Jomchai, N.; Tragoonrung, S. The chloroplast genome sequence of mungbean (vigna radiata) determined by high-throughput pyrosequencing: Structural organization and phylogenetic relationships. DNA Res. 2010, 17, 11–22. [Google Scholar] [CrossRef] [Green Version]
- Sharp, P.M. An evolutionary perspective on synonymous codon usage in unicellular organisms. J. Mol. Evol. 1986, 24, 28–38. [Google Scholar] [CrossRef]
- Du, Y.; Bi, Y.; Chen, X.; Yang, F.; Xue, J.; Zhang, X. The complete chloroplast genome of Lilium cernuum: Genome structure and evolution. Conserv. Genet. Resour. 2016, 8, 375–378. [Google Scholar] [CrossRef]
- Morton, B.R. Selection on the codon bias of chloroplast and cyanelle genes in different plant and algal lineages. J. Mol. Evol. 1998, 46, 449–459. [Google Scholar] [CrossRef]
- Maier, R.M.; Neckermann, K.; Igloi, G.L.; Kössel, H. Complete sequence of the maize chloroplast genome: Gene content, hotspots of divergence and fine tuning of genetic information by transcript editing. J. Mol. Biol. 1995, 251, 614–628. [Google Scholar] [CrossRef]
- Meade, J.C.; Shah, P.H.; Lushbaugh, W.B. Trichomonas vaginalis: Analysis of Codon Usage. Exp. Parasitol. 1997, 87, 73–74. [Google Scholar] [CrossRef]
- Meng, J.; Li, X.P.; Li, H.T.; Yang, J.B.; Wang, H.; He, J. Comparative analysis of the complete chloroplast genomes of four aconitum medicinal species. Molecules 2018, 23, 1015. [Google Scholar] [CrossRef] [Green Version]
- Wang, L.; Xing, H.; Yuan, Y.; Wang, X.; Saeed, M.; Tao, J.; Feng, W.; Zhang, G.; Song, X.; Sun, X. Genome-wide analysis of codon usage bias in four sequenced cotton species. PLoS ONE 2018, 13, e0194372. [Google Scholar] [CrossRef] [Green Version]
- Hurst, L.D. The Ka/Ks ratio: Diagnosing the form of sequence evolution. Trends Genet. 2018, 18, 486. [Google Scholar] [CrossRef]
- Kimura, M. The Neutral Theory of Molecular Evolution. Sci. Am. 1979, 5, 98–100. [Google Scholar] [CrossRef]
- Makalowski, W.; Boguski, M.S. Evolutionary parameters of the transcribed mammalian genome: An analysis of 2,820 orthologous rodent and human sequences. Proc. Natl. Acad. Sci. USA 1998, 95, 9407–9412. [Google Scholar] [CrossRef] [PubMed] [Green Version]
- Kim, K.J.; Lee, H.L. Complete chloroplast genome sequences from Korean ginseng (Panax schinseng Nees) and comparative analysis of sequence evolution among 17 vascular plants. DNA Res. 2004, 11, 247–261. [Google Scholar] [CrossRef] [PubMed]
- Doyle, J. A rapid DNA isolation procedure for small quantities of fresh leaf tissue. Phytochem. Bull. 1987, 19, 11–15. [Google Scholar]
- Dierckxsens, N.; Mardulyn, P.; Smits, G. NOVOPlasty: De novo assembly of organelle genomes from whole genome data. Nucleic Acids Res. 2017, 45, gkw955. [Google Scholar]
- Kearse, M.; Moir, R.; Wilson, A.; Stones-Havas, S.; Cheung, M.; Sturrock, S.; Buxton, S.; Cooper, A.; Markowitz, S.; Duran, C.; et al. Geneious Basic: An integrated and extendable desktop software platform for the organization and analysis of sequence data. Bioinformatics 2012, 28, 1647–1649. [Google Scholar] [CrossRef]
- Qu, X.J.; Moore, M.J.; Li, D.Z.; Yi, T.S. PGA: A software package for rapid, accurate, and flexible batch annotation of plastomes. Plant Methods 2019, 15, 50. [Google Scholar] [CrossRef] [Green Version]
- Lohse, M.; Drechsel, O.; Kahlau, S.; Bock, R. Organellar genome DRAW-a suite of tools for generating physical maps of plastid and mitochondrial genomes and visualizing expression datasets. Nucleic Acids Res. 2013, 41, W575–W581. [Google Scholar] [CrossRef]
- Amiryousefi, A.; Hyvönen, J.; Poczai, P. Irscope: An online program to visualize the junction sites of chloroplast genomes. Bioinformatics 2018, 34, 3030–3031. [Google Scholar] [CrossRef]
- Thiel, T.; Michalek, W.; Varshney, R.; Graner, A. Exploiting est databases for the development and characterization of gene-derived ssr-markers in barley (hordeum vulgarel.). Appl. Genet. 2003, 106, 411–422. [Google Scholar] [CrossRef]
- Katoh, K.; Standley, D.M. MAFFT multiple sequence alignment software version 7: Improvements in performance and usability. Mol. Biol. Evol. 2013, 30, 772–780. [Google Scholar] [CrossRef] [Green Version]
- Stamatakis, A. RAxML-VI-HPC: Maximum likelihood-based phylogenetic analyses with thousands of taxa and mixed models. Bioinformatics 2006, 22, 2688–2690. [Google Scholar] [CrossRef] [PubMed]
- Tamura, K.; Stecher, G.; Peterson, D.; Filipski, A.; Kumar, S. MEGA6: Molecular Evolutionary Genetics Analysis Version 6.0. Mol. Biol. Evol. 2013, 30, 2725–2729. [Google Scholar] [CrossRef] [PubMed] [Green Version]
- Wang, D.; Zhang, Y.; Zhang, Z.; Jiang, Z.; Yu, J. KaKs_Calculator2.0: A tool kit incorporating gamma- series methods and sliding windows trategies. Genom. Proteom. Bioinform. 2010, 8, 77–80. [Google Scholar] [CrossRef] [Green Version]
Figure 1.
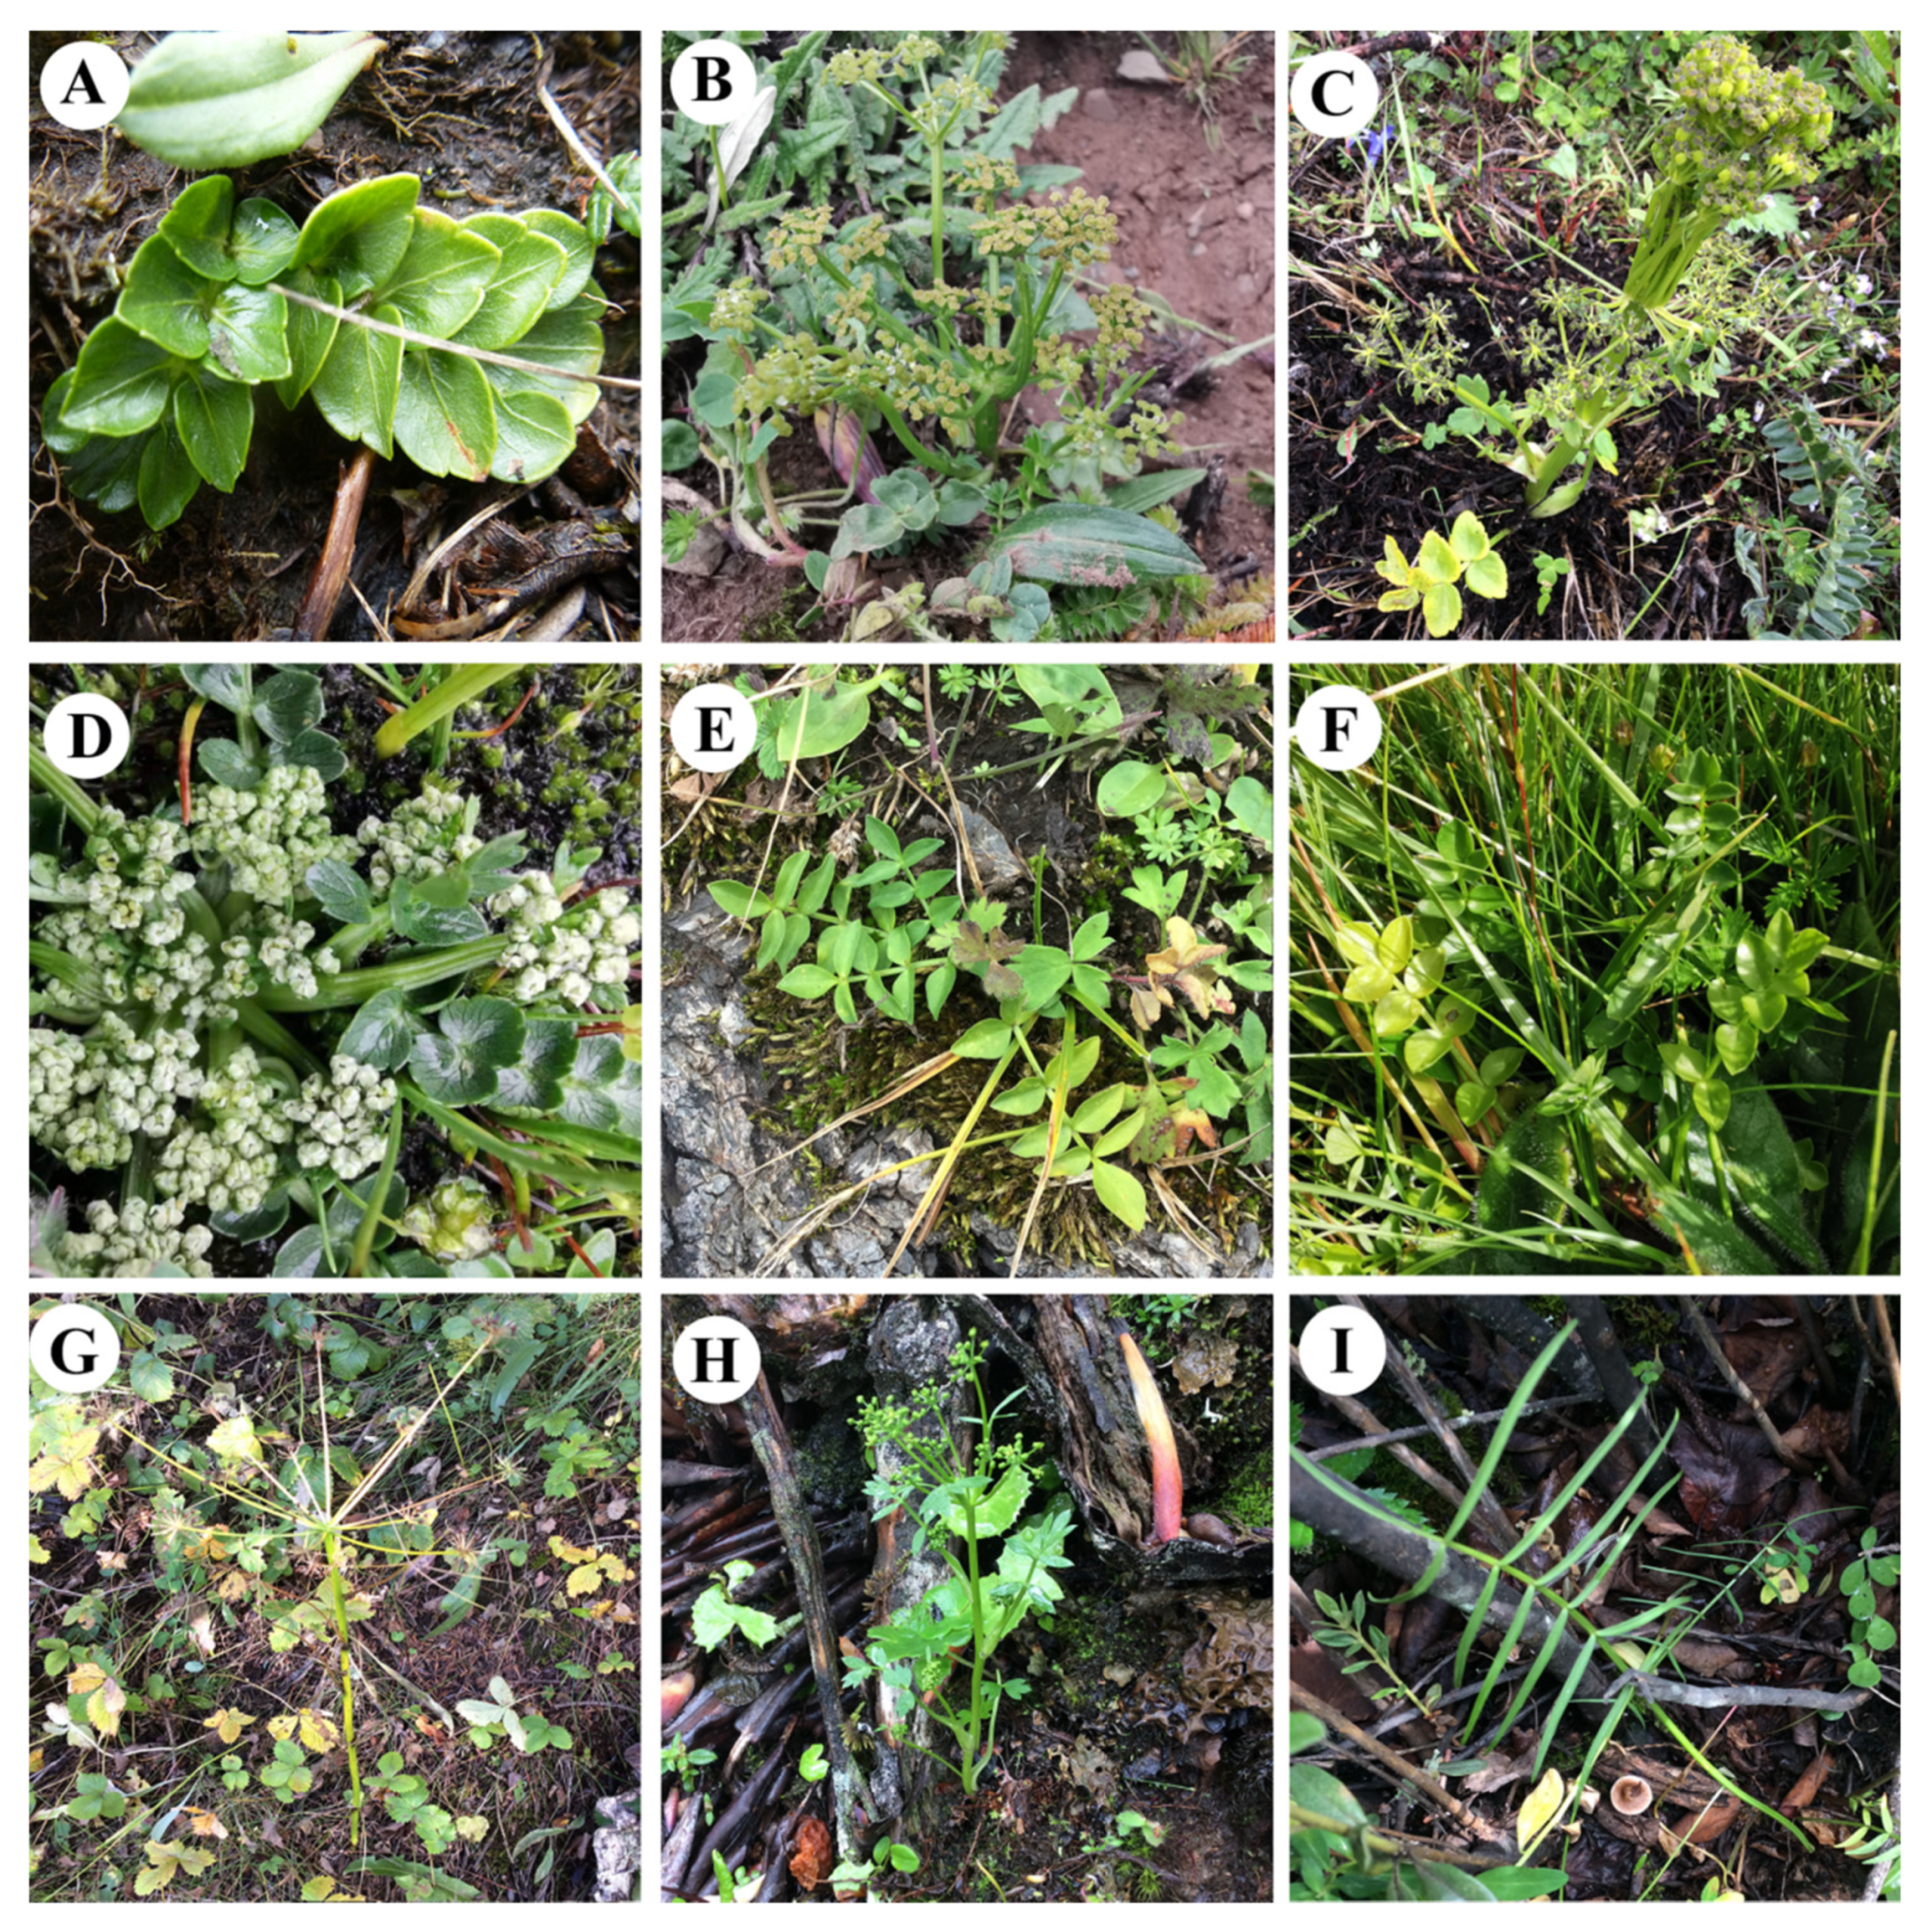
Plants of Chamaesium. (A) C. delavayi, (B) C. jiulongense, (C) C. mallaeanum, (D) C. novem-jugum, (E) C. paradoxum, (F) C. spatuliferum, (G) C. thalictrifolium, (H) C. viridiflorum, (I) C. wolffianum.
Figure 1.
Plants of Chamaesium. (A) C. delavayi, (B) C. jiulongense, (C) C. mallaeanum, (D) C. novem-jugum, (E) C. paradoxum, (F) C. spatuliferum, (G) C. thalictrifolium, (H) C. viridiflorum, (I) C. wolffianum.

Figure 2.
Plastid genome map of Chamaesium. The genes shown inside and outside of the circle are transcribed in the clockwise and counterclockwise directions, respectively. Genes belonging to different functional groups are drawn in different colors. The darker grey area in the inner circle indicates the GC content, while the lighter grey corresponds to the AT content. LSC, large single copy; SSC, small single copy; IR, inverted repeat.

Figure 3.
Comparisons of LSC, SSC and IR region borders among nine Chamaesium plastid genomes.

Figure 4.
Analysis of simple sequence repeats (SSRs) in nine Chamaesium plastid genomes. (A) Frequency of identified SSR motifs in different repeat type classes in nine species, (B) frequency of identified SSR motifs in LSC, IR, SSC of nine species, (C) proportion of repeats in LSC, IR, SSC in total, (D) proportion of repeats in tRNA or rRNA, CDS, intron and intergenic spacer (IGS) in total.

Figure 5.
Codon content of 20 amino acid and stop codon in 53 coding genes of the Chamaesium plastid genome. The color of the histogram corresponds to the color of codons.
Figure 5.
Codon content of 20 amino acid and stop codon in 53 coding genes of the Chamaesium plastid genome. The color of the histogram corresponds to the color of codons.

Figure 6.
Pairwise Ka/Ks ratios in Chamaesium (Apiaceae). CD: C. delavayi, CJ: C. jiulongense, CM: C. mallaeanum, CN: C. novem-jugum, CP: C. paradoxum, CS: C. spatuliferum, CT: C. thalictrifolium, CV: C. viridiflorum, CW: C. wolffianum.
Figure 6.
Pairwise Ka/Ks ratios in Chamaesium (Apiaceae). CD: C. delavayi, CJ: C. jiulongense, CM: C. mallaeanum, CN: C. novem-jugum, CP: C. paradoxum, CS: C. spatuliferum, CT: C. thalictrifolium, CV: C. viridiflorum, CW: C. wolffianum.

Figure 7.
Phylogenetic relationships of Chamaesium species with related species based on the whole plastid genomes by maximum likelihood (ML) with bootstrap values above the branches.
Figure 7.
Phylogenetic relationships of Chamaesium species with related species based on the whole plastid genomes by maximum likelihood (ML) with bootstrap values above the branches.


Table 1.
List of genes encoded in nine Chamaesium species.
| Group of Genes | Name of Genes |
|---|---|
| Self-replication | |
| transfer RNAs | trnA-UGC *, trnC-GCA, trnD-GUC, trnE-UUC, trnF-GAA, trnfM-CAU, |
| trnG-GCC, trnG-UCC, trnH-GUG, trnI-CAU *, trnI-GAU *, trnK-UUU, | |
| trnL-CAA *, trnL-UAA, trnL-UAG, trnM-CAU, trnN-GUU *, trnP-UGG, | |
| trnQ-UUG, trnR-ACG *, trnR-UCU, trnS-GCU, trnS-GGA, trnS-UGA, | |
| trnT-GGU, trnT-UGU, trnV-GAC *, trnV-UAC, trnW-CCA, trnY-GUA | |
| ribosomal RNAs | rrn4.5 *, rrna5 *, rrn16 *, rrn23 * |
| RNA polymerase | rpoA, rpoB, rpoC1, rpoC2 |
| Small subunit of ribosomal proteins (SSU) | rps2, rps3, rps4, rps7 *, rps8, rps11, rps12, rps14, rps15, rps16, rps18, rps19 * (rps19, ψrps19) |
| Large subunit of ribosomal proteins (LSU) | rpl2 *, rpl14, rpl16, rpl20, rpl22, rpl23 *, rpl32, rpl33, rpl36 |
| Genes for photosynthesis | |
| Subunits of NADH-dehydrogenase | ndhA, ndhB *, ndhC, ndhD, ndhE, ndhF, ndhG, ndhH, ndhI, ndhJ, ndhK |
| Subunits of photosystem I | psaA, psaB, psaC, psaI, psaJ |
| Subunits of photosystem II | psbA, psbB, psbC, psbD, psbE, psbF, psbH, psbI, psbJ, psbK, psbL, psbM, psbN, psbT, psbZ |
| Subunits of cytochrome b/f complex | petA, petB, petD, petG, petL, petN |
| Subunits of ATP synthase | atpA, atpB, atpE, atpF, atpH, atpI |
| Large subunit of rubisco | rbcL |
| Other genes | |
| Translational initiation factor | infA |
| Protease | clpP |
| Maturase | matK |
| Subunit of Acetyl-CoA-carboxylase | accD |
| Envelope membrane protein | cemA |
| C-type cytochrome synthesis gene | ccsA |
| Genes of unknown function | |
| Hypothetical chloroplast reading frames (ycf) | ycf1 * (ycf1,ψycf1), ycf2 *, ycf3, ycf4, ψycf15 * |
| Total | 133 |
* Duplicated genes, ψ shows pseudogenes.
© 2020 by the authors. Licensee MDPI, Basel, Switzerland. This article is an open access article distributed under the terms and conditions of the Creative Commons Attribution (CC BY) license (http://creativecommons.org/licenses/by/4.0/).
Share and Cite
MDPI and ACS Style
Guo, X.-L.; Zheng, H.-Y.; Price, M.; Zhou, S.-D.; He, X.-J. Phylogeny and Comparative Analysis of Chinese Chamaesium Species Revealed by the Complete Plastid Genome. Plants 2020, 9, 965. https://doi.org/10.3390/plants9080965
AMA Style
Guo X-L, Zheng H-Y, Price M, Zhou S-D, He X-J. Phylogeny and Comparative Analysis of Chinese Chamaesium Species Revealed by the Complete Plastid Genome. Plants. 2020; 9(8):965. https://doi.org/10.3390/plants9080965
Chicago/Turabian StyleGuo, Xian-Lin, Hong-Yi Zheng, Megan Price, Song-Dong Zhou, and Xing-Jin He. 2020. "Phylogeny and Comparative Analysis of Chinese Chamaesium Species Revealed by the Complete Plastid Genome" Plants 9, no. 8: 965. https://doi.org/10.3390/plants9080965
Note that from the first issue of 2016, this journal uses article numbers instead of page numbers. See further details here.