Article

A Conceptual Design and Optimization Approach for Distributed Electric Propulsion eVTOL Aircraft Based on Ducted-Fan Wing Unit

1
Institute of Unmanned System, Beihang University, Beijing 100191, China
2
Key Laboratory of Advanced Technology of Intelligent Unmanned Flight System, Ministry of Industry and Information Technology, Beijing 100191, China
3
School of Aeronautic Science and Engineering, Beihang University, Beijing 100191, China
4
Shanghai Electro-Mechanical Engineering Institute, Shanghai 201109, China
5
School of Transportation Science and Engineering, Beihang University, Beijing 102206, China
6
Science and Technology on Rotorcraft Aeromechanics Laboratory, China Helicopter Research and Development Institute, Jingdezhen 333001, China
*
Author to whom correspondence should be addressed.
Aerospace 2022, 9(11), 690; https://doi.org/10.3390/aerospace9110690
Submission received: 31 August 2022 / Revised: 25 October 2022 / Accepted: 1 November 2022 / Published: 5 November 2022

Abstract

:
The distributed electric propulsion (DEP) eVTOL aircraft has gained rising interest for its promising potential in high-speed cruise compared with conventional tilt-rotor configuration. The aerodynamic interference of the DEP units and wing could become more complicated with a variable thrust in multiple flight conditions. Thus, it requires considerable effort to trade off in the whole design process. Aimed at improving the design efficiency in iteration cycling of a ducted-fan DEP eVTOL aircraft, a conceptual design and optimization approach is proposed in this paper regarding the single-ducted fan and its surrounding wing section as the basic unit. The optimization of the ducted-fan wing (DFW) unit is targeted at improving both hover and cruise efficiencies. After the verification of the span independence of the lift-and-drag coefficients of the DFW unit, a novel DEP eVTOL aircraft conceptual design approach is established based on the vertical meridional plane DFW unit performance analysis. In the following case study, the optimized DFW unit and the conceptual method are applied on a canard configuration, achieving 720 km/h maximum speed, a hovering efficiency of 76.3%, and a 10.7 cruise lift-to-drag ratio. The remarkable performance and concise workflow in the case study both demonstrated the applicability and effectiveness of the proposed design schemes for DEP eVTOL aircraft.

1. Introduction

Vertical/Short Take-off and Landing (V/STOL) aircraft equipped with tiltable propulsion units typically have three flight modes: VTOL, conversion, and cruise mode [1]. One of the ideal application scenes for a V/STOL aircraft is the rapid arrival and long endurance deployment, but the state-of-the-art flight performance, including 75% hovering efficiency for jet VTOL or tilt-wing aircraft, and 600 km/h cruise speed for tilt-rotor and high-speed helicopters, are still insufficient to meet the mission requirements [2,3,4,5]. The hovering efficiency of the propulsion system is proportional to the disc power loading and inversely to the disc loading in VTOL mode. Consequently, the design is preferred to meet the large-diameter rotor. However, the blade tip Mach number severely restricts the cruise speed and efficiency in high-speed forward flight because of the caused shock waves on the forward blade and stalls on the backward blade [6].
Adopting the distributed electric propulsion (DEP) system is a practical way to improve the high-speed cruise for a VSTOL aircraft, and the electrification incorporation also solves various problems [7]. On the one hand, more than 70% of the electric power can be transferred to propulsion in an optimized electric propulsion system, far beyond the 40% energy transfer efficiency for a turbofan engine. On the other hand, the scale independence to the energy efficiency is a favorable characteristic of an electric system, making it feasible to replace a large motor by distributing small motors at an equivalent total power consumption [8]. As a result, the interest in DEP eVTOL aircraft design is growing, especially in reasonable DEP units arrangement near the fuselage or wings [4].
NASA and ESAero have designed the X-57 “Maxwell” distributed eVTOL demonstrator. Twelve sets of 10 kW motor-driven small-diameter discs are arranged at the wing’s leading edge instead of two sets of 60 kW motor-driven large-diameter discs at the wingtip. Based on the prototype, Stool et al. have studied the massive performance potential of the DEP concept in propulsion and aerodynamic efficiency [9,10]. DARPA also launched the project named “VTOL X-Plane”, which aims to develop a V/STOL that shares a similar hovering efficiency to a helicopter, meanwhile sharing a similar load capacity, cruise speed, and lift-to-drag ratio to a business airplane. A DEP eVTOL aircraft named “Lightning Strike” eventually won the contract for the subsequent development stage [11,12,13]. Lilium is a German startup building DEP eVTOL aircraft that adopts several ducted fans along the tailing edge of both canards and wings [14]. Ma et al. proposed a DEP eVTOL configuration, and the advantages in flight performance compared with the traditional V/STOL are also analyzed in detail [15].
An optimized distributed ducted fan system, which eliminated the power gap in aircraft design, was proposed by Guo and Zhou. They adjusted the contraction and expansion of the wake to ensure high efficiency in different flight modes [16]. Complex flow phenomena including internal and external flow can be generated when a ducted fan or propeller is located between the wings. The flow near the wings is accelerated by the slipstream, which results in different lift-and-drag contributions of the upper and lower wing surfaces. The suction effect of the discs causes the flow in front of the wings to turn and accelerate, which results in a decrease in the local angle of attack (AoA) of the wings. Other effects on cruising efficiency, stall characteristics, and control capability would also be influenced by this tight aerodynamics coupling, and it should be addressed in the conceptual design stage.
However, adopting the traditional fixed-wing conceptual design approach on DEP eVTOL aircraft separates the aerodynamics and propulsion system design, which can negatively impact the efficiency of the additional iterations. Consequently, it is of great necessity to establish a conceptual design approach for DEP eVTOL aircraft that involves the tight coupling of aerodynamics and propulsion. The promotion of cruise speed, hovering efficiency, cruise lift-to-drag ratio, and payload capacity should be considered simultaneously. Moreover, the approach should realize the rapid trade-off of conceptual design under various constraints and demonstrate the potential performance of the design as well.
In this paper, an optimization workflow of the ducted-fan wing (DFW) unit and a novel DEP eVTOL aircraft conceptual design approach are proposed. The approach incorporates the aerodynamic and propulsion performance of the DFW unit on the meridional plane as the basic lift-propulsion element (LPE). The definition of LPE, and its aerodynamic-propulsion characteristics on the meridional plane are introduced in detail in Section 2. Following that, in Section 3, the integral optimization methods of the DFW unit are expounded to meet the design requirements of DEP eVTOL aircraft. The optimal circulation theory instructed the initial blade design, and the optimized blade design is obtained by a multi-level optimization method. The sensitivity analysis on the duct wall shape and the relative position between the ducted fan and wings are also included.
Then, in Section 4, the conceptual design approach based on the LPE performance is proposed, based on the obvious span independence and consistency of the meridional plane aerodynamic coefficients. To demonstrate the effectiveness of the conceptual design approach, it was applied on a canard DEP eVTOL. Its remarkable performance that meets the requirement and the agreement with the simulation and experiments both declare the effectiveness and justice of the proposed approach. Finally, the characteristics of the approach and the knowledge learned from the study are concluded in Section 5.

2. The Ducted-Fan Wing (DFW) Unit and Lift-Propulsion Element (LPE)

The tiltable wing of a high-speed DEP eVTOL aircraft comprises several ducted fans arranged along the spanwise. The ducted fan slipstream leads to an impact on the aerodynamic performance of the wings. The traditional conceptual design method ascertains the propulsion requirement according to the wings’ aerodynamic characteristics, and it is difficult to obtain a practical DEP eVTOL scheme. The conceptual design approach for the DEP eVTOL aircraft needs to be improved to be capable of coupling with lift, drag, and thrust in various flight modes.
There is a prominent feature that the wings of the DEP eVTOL aircraft can be regarded as spanwise combinations of several DFW units, that is, ducted fans with the surrounding wing sections. Therefore, the spanwise periodic lift, drag, and thrust performance cycles largely determine the aerodynamics and propulsion performance of the aircraft. Consequently, a single DFW unit is taken as the research object, to represent the basic lift-propulsion element (LPE) of the DEP eVTOL aircraft. The typical composition of the DFW unit is shown in Figure 1.
From the perspective of function, LPE represents the basic performance of aerodynamics and propulsion of a DEP eVTOL design. The lift, drag, and thrust characteristics of LPE demonstrate the eVTOL performance in multiple flight modes, especially the hover efficiency in VTOL mode and cruising efficiency in cruise mode. Its performance data are the basis for the analysis of the conceptual design. Furthermore, engineers can analogically adopt LPE in the DEP eVTOL conceptual design workflow to the airfoil aerodynamics analysis in the conventional fixed-wing aircraft design. In light of this, after the DFW unit performance optimization, an efficient DEP eVTOL conceptual design approach based on the characteristics of LPE can finally be established.

3. DFW Unit Optimization in Multiple Flight Conditions

The DFW unit optimization is critical to obtaining an acceptable and integral conceptual design in multiple flight conditions. That is, the requirements for hovering efficiency in VTOL mode and lift-to-drag ratio in cruise mode should be satisfied, simultaneously. Therefore, a satisfying design and optimization workflow for DFW units in VTOL and cruise conditions is necessary.
Two goals are successively set in the DFW design workflow: improving the ducted fan hover efficiency and reducing the negative impact of aerodynamic interference between ducted fans and wings. The lift, drag, and thrust of the DFW unit can be converted to the LPE characteristics. After the feasibility of the DFW design is verified, the eVTOL design can be based on it.
The flow chart of the DFW unit optimization workflow in multiple flight conditions is shown in Figure 2.
The hover efficiency improvement of the DFW unit largely relies on the ducted fan design. Therefore, the ducted fan design can be a comparatively independent process from promoting aerodynamic efficiency from complex interferences between ducted fan and wings in the cruise condition. The DFW unit’s design efficiency and feasibility analysis can be improved by prioritizing the ducted fan optimization at high hovering efficiency.
In this section, the initial design of the ducted fan blade is figured out based on the Betz theory of optimal circulation. Then, the effective angle of attack (AoA) distribution of the radial blade elements is optimized by a multi-level optimization method. After the sensitivity analysis of the duct wall lip shape and the disc axial position, the ducted fan design is devised. Based on ducted fan optimization, the aerodynamic disadvantages induced by the interference between the ducted fan slipstream and the surrounding wings are analyzed and reduced in a high-speed cruise. Several CFD simulations of DFW units constructed with different relative positions between the surrounding wings and ducted fans are discussed in high-speed forward flight, which helps to reveal the trend of interference drag and lift loss. The DFW unit with the maximum lift-to-drag ratio is finally obtained by minimizing the interference drag under the high-speed cruise condition, which guarantees the high hover and cruising efficiencies of the DFW unit design.

3.1. Ducted Fan Optimization for Hovering Efficiency

The optimization of the ducted fan under these conditions should involve two aims. One is to achieve a high hovering efficiency by improving the aerodynamic efficiency of the fan disc and duct wall shape whilst hovering. The other is producing a sufficient thrust under the power constraints after adjusting the collective pitch angle and rotational speed of the fan discs in cruise.
The ducted fan optimization workflow can be divided into three steps according to its components. The first step is generating a good initial blade design, because it can be a solid basis for following multi-level optimization. This includes the blade airfoil selection, and the determinations of chord length and twist angle distribution, instructed by the Betz theory of optimal circulation. In the second step, the blade performance analysis with different parameters is conducted using the numerical method base on strip theory. The optimal effective AoA distribution of the radial blade elements is obtained from the global and local optimization processes. The third step is matching the duct wall and fan disc. The effect trend of the slipstream caused by the fan disc and duct wall is analyzed. According to the sensitivity analysis on duct lip shapes and disc axial positions, the thrust generated at the lip of the duct increases, which can utilize more energy in the slipstream. Finally, an optimized ducted fan design with a greater propulsion efficiency is generated.

3.1.1. The Blade Design Adopting the Optimal Circulation in the Betz Theory

From the investigations of several airfoils used in blade design research, the ARA-D shows a high lift-to-drag ratio in the AoA range of blade elements, which is favorable to the blades’ propulsion potential. Moreover, it has a large maximum lift coefficient and smooth decline of aerodynamic performance after stall, which is also preferred in the blade design with an extensive range of n s and collective pitch angle. Consequently, we choose the ARA-D airfoil as the blade element [17,18,19].
The Betz theory of optimal circulation is the initial blade design methodology at a specific condition, though it omits the blade element drag. Then a numerical method based on strip theory is applied to the blade performance analysis. Figure 3 presents the flow chart of the blade design process.
Within the initial blade parameters determination, the practice experience plays a vital role in the trade-off process. The parameters determination procedures in our study are introduced as follows. The chosen brushless motor, from the Thingap Company with a rated power of 250 kW, determined the fan hub radius and revolution speed, simultaneously. The fan disc radius is calculated from the rotational speed and a blade tip velocity of 0.7 Ma under both flight conditions. Pursuant to both a larger solidity than conventional propellers and a preferred slim shape in high-speed forward flight, the number of blades is determined to be 10. The hovering condition is set at the static sea-level atmosphere. The target thrust estimation at 2500 N referred to the state-of-the-art ducted fan performance and the requirement from conceptual design.
Under the blade constraints mentioned above, the Betz theory of optimal circulation distribution, omitting blade element drag, is specified in Figure 4. Two effective AoA distributions of blade elements will be discussed under standard sea-level atmospheric conditions. The first one is that all radial blade elements keep the maximum lift-to-drag ratio, and the second is that they reach the top lift coefficient.
Respectively, two blade distributions of chord length and twist angle are calculated, which are presented in Figure 5. Blade 1 is generated from the element distribution of the maximum lift-to-drag ratio, while the Blade 2 element distribution is correspondingly generated from the top lift coefficient. Their performance comparison in the hovering condition is presented in Table 1. From the table, it can be perceived that the power loading and hovering efficiency of Blade 1 are both better than Blade 2. Therefore, Blade 1 is selected as the initial design for the subsequent optimization.
The accuracy verification of the Blade 1 strip theory result takes the CFD simulation for reference. It involves 1/10th of the fan disc area with periodic boundaries, containing a single blade. This mesh is also adopted in the mesh independence study. In Figure 6, it can be demonstrated that the accuracy of the blade power consumption is under 0.5% when the mesh number exceeds 600 K cells number. Under consideration of the cost and accuracy, the subsequent CFD simulations circumferentially duplicate this 600 K mesh to generate the integral fan disc.
The results of the two methods are listed in Table 2. The thrust and torque from the strip theory both differ from the CFD high-fidelity result by less than 5%. Consequently, the blade performance from the strip theory can satisfy the accuracy requirements in the iterative optimization process. Meanwhile, this numerical method also remarkably improves the solving efficiency of the multi-level optimization.

3.1.2. The Multi-Level Optimization for Effective AoA Distribution

The global optimization of the Blade 1 geometric parameters adopts Multi-Island Genetic Algorithm (MIGA), which aims to achieve high blade aerodynamic efficiency. The optimization variables include the effective AoA distribution of radial blade elements. The iterative steps of MIGA are limited to avoid overfitting in global optimization. The local optimization near the global level result adopts Non-Linear Programming by the Quadratic Lagrangian Method (NLPQL) [20].
The minimum thrust of 2500 N and the maximum power consumption of 260 kw are the constraints in the optimization. These performance targets have been realized in Blade 1. The maximum hover efficiency of strip theory is taken as the objective of the multi-level optimization. The effective AoA distribution of the blade elements along the blade radial direction is represented as a quartic function, written in Equation (1):
f ( r ) = a 1 × r 4 + a 2 × r 3 + a 3 × r 2 + a 4 × r + a 5
By adjusting the values a 1 a 5 , the effective AoA distribution of the blade elements can be varied continuously. The range of each variable is listed in Table 3.
Some geometric parameters of Blade 1 are shown in Table 4.
All combinations of effective AOA distribution are evaluated via the numerical method based on strip theory. The blade geometric parameters comparison before and after optimization is shown in Figure 7. The optimized blade chord length decreases, and the twist angle of blade elements increases, which reduces the disc solidity significantly. The chord length from root to tip is gentler, similar to the traditional high-speed rectangular blade.
The performance of the optimized fan disc calculated by strip theory is presented in Table 5. After the optimization, an 8.3% increase in power loading and a 7.8% increase in hovering efficiency are achieved.
So far, at this point, the fan disc is designed through the instruction and optimization of the fan blade aiming at high hovering efficiency, and the multi-level optimization method of that has been introduced at the same time.

3.1.3. The Sensitivity Analysis on the Duct Wall Section Shape

The ducted fan thrust comes from the fan disc and the slipstream on the duct wall. The slipstream induced by the disc produces remarkable flow acceleration at the duct lip, which can be used to lift the whole thrust of the ducted fan. To limit the Mach number of blade tips, such fan discs equipped on the high-speed eVTOL, conventionally, have a small diameter, which correspondingly, causes large disc loading with a tremendous energy loss in the slipstream.
The efficient collection of the slipstream energy to generate thrust at the duct lip is the key to improving the propulsion efficiency of the ducted fan with large disc loading. The geometric parameters of the duct wall cross-section are shown in Figure 8.
The thrust generated by the duct wall mainly comes from the lip. The lip shape significantly affects the flow field and pressure distribution near the wall, which is most sensitive to the lip radius [21,22,23]. For with a large lip radius equipped, more thrust of the duct wall will be generated due to the reduction in the reverse pressure gradient near the lip. However, when the lip radius is oversized, the turbulence becomes more intense, which can easily cause a stall and loss of thrust. The influence of rotation flow on thrust is negligible compared with the axial turbulence induced by the fan disc [24].
In this consideration, for the sensitivity analysis on duct lip shape, the virtual disc with momentum sources is adopted to simulate the suction effect of the fan disc. Based on the impact of the changing flow field with different shapes, the cross-sectional shape of the duct lip can be selected appropriately. Because of the central symmetry of the duct wall, two-dimensional (2D) CFD simulation is used to obtain the sensitivity analysis of the lip radius among the four popular lip shapes. The four cross-sectional shapes are presented in Figure 9, and the schematics of the 2D-ducted fan CFD model are shown in Figure 10.
The fan disc represented by the virtual disc with momentum sources is set at 0.08 L backward from the foremost lip point. The lip shapes are described in the order of lip radius increasing. The R/L value is used to characterize the geometric characteristics of these shapes. NACA0012 and NACA4412 airfoils are selected in the former two profiles. The third one adopts the lip shape with R/L from 0.0375 to 0.0563, which has a 1/1.25/1.5 proportional amplification of the rd/L value. The fourth one is a semicircle lip.
The thrust generated on the duct wall is extracted with the same position and pressure step value of the fan boundary in the simulation model, as shown in Table 6.
The thrust on the duct wall raises with the radius increase accordingly. When the rd/L value exceeds 0.0469, the growth trend of wall thrust decreases. Subsequently, a rapid thrust decrease happens with the semicircle one. Based on the thrust sensitivity analysis on lip radius and geometric constraints of duct wall, the lip with the R/L value of 0.0469 is preferred.
After installing the duct wall, the fan disc slipstream rectifying effect is complex. Apart from the lip shape discussion, the fan disc axial position also influences the pre-disc suction flow quality. Optimizing the fan disc axial position is necessary for detailed aerodynamic efficiency promotion [25]. When the rectification of the ducted fan is analyzed, the integral design of the ducted fan, including the fan blade, the stator blade, and the duct wall, should be involved. That realizes a more realistic solution of the flow phenomenon around the ducted fan and provides more details for the sensitivity analysis of no fan disc axial position.
The cases of fan discs at 0.08 L and 0.2 L axial positions are discussed, and the mesh model is presented in Figure 11.
The results in Table 7 demonstrate that the thrust of the duct wall and fan disc decreases greatly when the axial disc position moves backward, resulting in a lower hovering efficiency.
From the extracted static pressure distribution of the flow field in Figure 12a, little backflow appears near the blade tip at the axial position of 0.08 L, which slightly influences the turbulence near the lip. On the contrary, in Figure 12b, the turbulence streamlines near the duct lip are further disturbed due to the weak axial flow induced at the rear axial position of 0.2 L. The blade tip vortex is not effectively controlled, resulting in a forward development to the duct lip, forming a so-called block effect. Consequently, a significant loss of thrust happens due to generating a stable circulation near the duct lip.
Based on the above analysis, the 0.08 L axial position of the fan disc is favorable. The sensitivity analysis and integral design of the duct wall and its fan disc are accomplished. Meanwhile, the ducted fan optimization objective of high hovering efficiency is also reached.

3.1.4. The Full-Scale Experiment of the Optimized Ducted Fan

The full-scale performance experiment of the optimized ducted fan is conducted to demonstrate the accuracy of the high-hovering-efficiency optimization results. It can further illustrate the correctness of the CFD simulation in the hovering condition and the multi-level optimization method. The motor revolutions speed is limited to sub 3000 RPM during the experiment due to the power limitation. The full-scale prototype of the optimized ducted fan is pictured in Figure 13.
The experimental results are shown in Figure 14. The relative thrust error between the experiment and simulation is under 8%, and that of hover efficiency is under 10%. This marginal difference and the trend consistency under 3000 RPM both support the ducted fan optimization results justice. The thrust experiment is slightly larger than the design at the same power consumption, which presents a higher hovering efficiency. Finally, the optimized ducted fan reaches a 76.3% hover efficiency in the full-scale experiment, which proves the feasibility of the optimization and the accuracy of performance evaluation.

3.2. DFW Unit Optimization on Aerodynamic Efficiency in Cruise Condition

For promoting the cruise economy of the DEP eVTOL aircraft, the aerodynamic efficiency of the DFW unit is critical during the high-speed cruise. Through the flow interference study of the ducted fan and the upper and lower wings, the negative aerodynamic impact can be reduced reasonably. The maximum lift-to-drag ratio is taken as the following optimization objective to explore a design satisfying the thrust and power constraints.
In a DFW unit, three geometric parameters can fully determine the relative position of the wings and the ducted fan. The three parameters, a, b, and c, are shown in Figure 15. The aerodynamic optimization of the DFW unit is based on the sensitivity analysis of these parameters.
CFD simulation is carried out at 650 km/h and 10 km altitude to simulate the flow field around the ducted fan and its surrounding wings. The DFW unit flow-field analysis aims to promote the cruise lift-to-drag ratio under mutual interference.
Due to the scale independence of the electric system, the DEP eVTOL benefits by spanwise arranging as many ducted fans as possible without a significant efficiency loss. However, the aerodynamic and propulsion efficiency of wings and the ducted fan would be apparently impacted in a small space. Therefore, the values of a, b and c are selected within one time of the disc fan diameter. The pressure contours of the ducted fan at c = 0 and −0.5 m are both given in Figure 16. The duct wall and the wings at both sides form a constricted and expanded flow channel along the flow direction clearly, and the suction of the fan disc accelerates the flow in the bypass channel. A low-pressure area forms between the duct wall and the inner surfaces of the wings.
The low-pressure area position moves with the change of c, and its effect on the wing and the duct wall varies. When c equals 0, the duct lip is flush with the leading edge of the wings. The low-pressure area is formed in the front of the wings, so the pressure differential drags of the wings decrease. Conversely, the low-pressure area appears in the rear of the duct wall, increasing the duct wall drag. When c decreases, the ducted fan moves to the trailing edge of the wings, and the position of the low-pressure area changes from the front to the rear. With a position closer to the rear, the wing’s drag increases, accompanied by a decreasing duct wall drag, and vice versa.
The influence of parameters a and b on aerodynamic characteristics appears monotonous. That is, the interference drag increases when the wings and ducted fan are closed. Expanding the distance between them as far as possible would reduce interference drag, improving the lift-to-drag ratio during the cruise. To keep the DFW unit size reasonable, parameter a is set at 0.4 m for a slight interference, and b is selected as 0.2 m for arranging more units in a limited span.
According to the aerodynamic trend of the relative position between the ducted fan and wings, the position in a = 0.4 m, b = 0.2 m, and c = 0.2 m is chosen as the optimal layout. The static pressure contour under the cruise condition is presented in Figure 17. The range and intensity of the low-pressure area are the smallest, which means a minimum drag of ducted fan and wings.
The thrust performance of the optimized DFW unit in hovering and cruising is simulated and listed in Table 8. The collective pitch angle of fan blades in hovering is 0, which is 20° in cruise. The data demonstrate that the DFW unit can satisfy the power and thrust constraints in both flight conditions. Therefore, a hover efficiency at 76.3% and 650 km/h cruise speed can be realized.

4. Conceptual Design of DEP eVTOL Aircraft Based on LPE

4.1. Performance Characteristics Analysis Based on LPE

The above content explains the design and optimization methods of the DFW unit in detail. Considering the eVTOL aircraft flight performance is closely tied with the DFW unit aerodynamics characteristics, in the conceptual design of the DEP eVTOL aircraft, the design workflow can be remarkably expedited if the optimized DFW unit characteristics are obtained. A rapid calculation method for the performance characteristics of the DFW unit with sufficient accuracy is, therefore, presented and verified, based on which the aerodynamic characteristics of LPE can be generated and involved in the conceptual design approach.
The simulation results of the DFW unit using the virtual disc with momentum sources are compared with that involving the actual blade thoroughly, and their strong consistency can be concluded. After that, the DFW unit simulation results can be converted to coefficients on the vertical meridian plane, that is, the characteristics of LPE. Then these coefficients are compared with that from the virtual disc with momentum sources, and their consistency can also be concluded. Consequently, the DEP eVTOL aircraft conceptual design approach can be improved by consulting the LPE aerodynamics results from the virtual disc momentum source method.
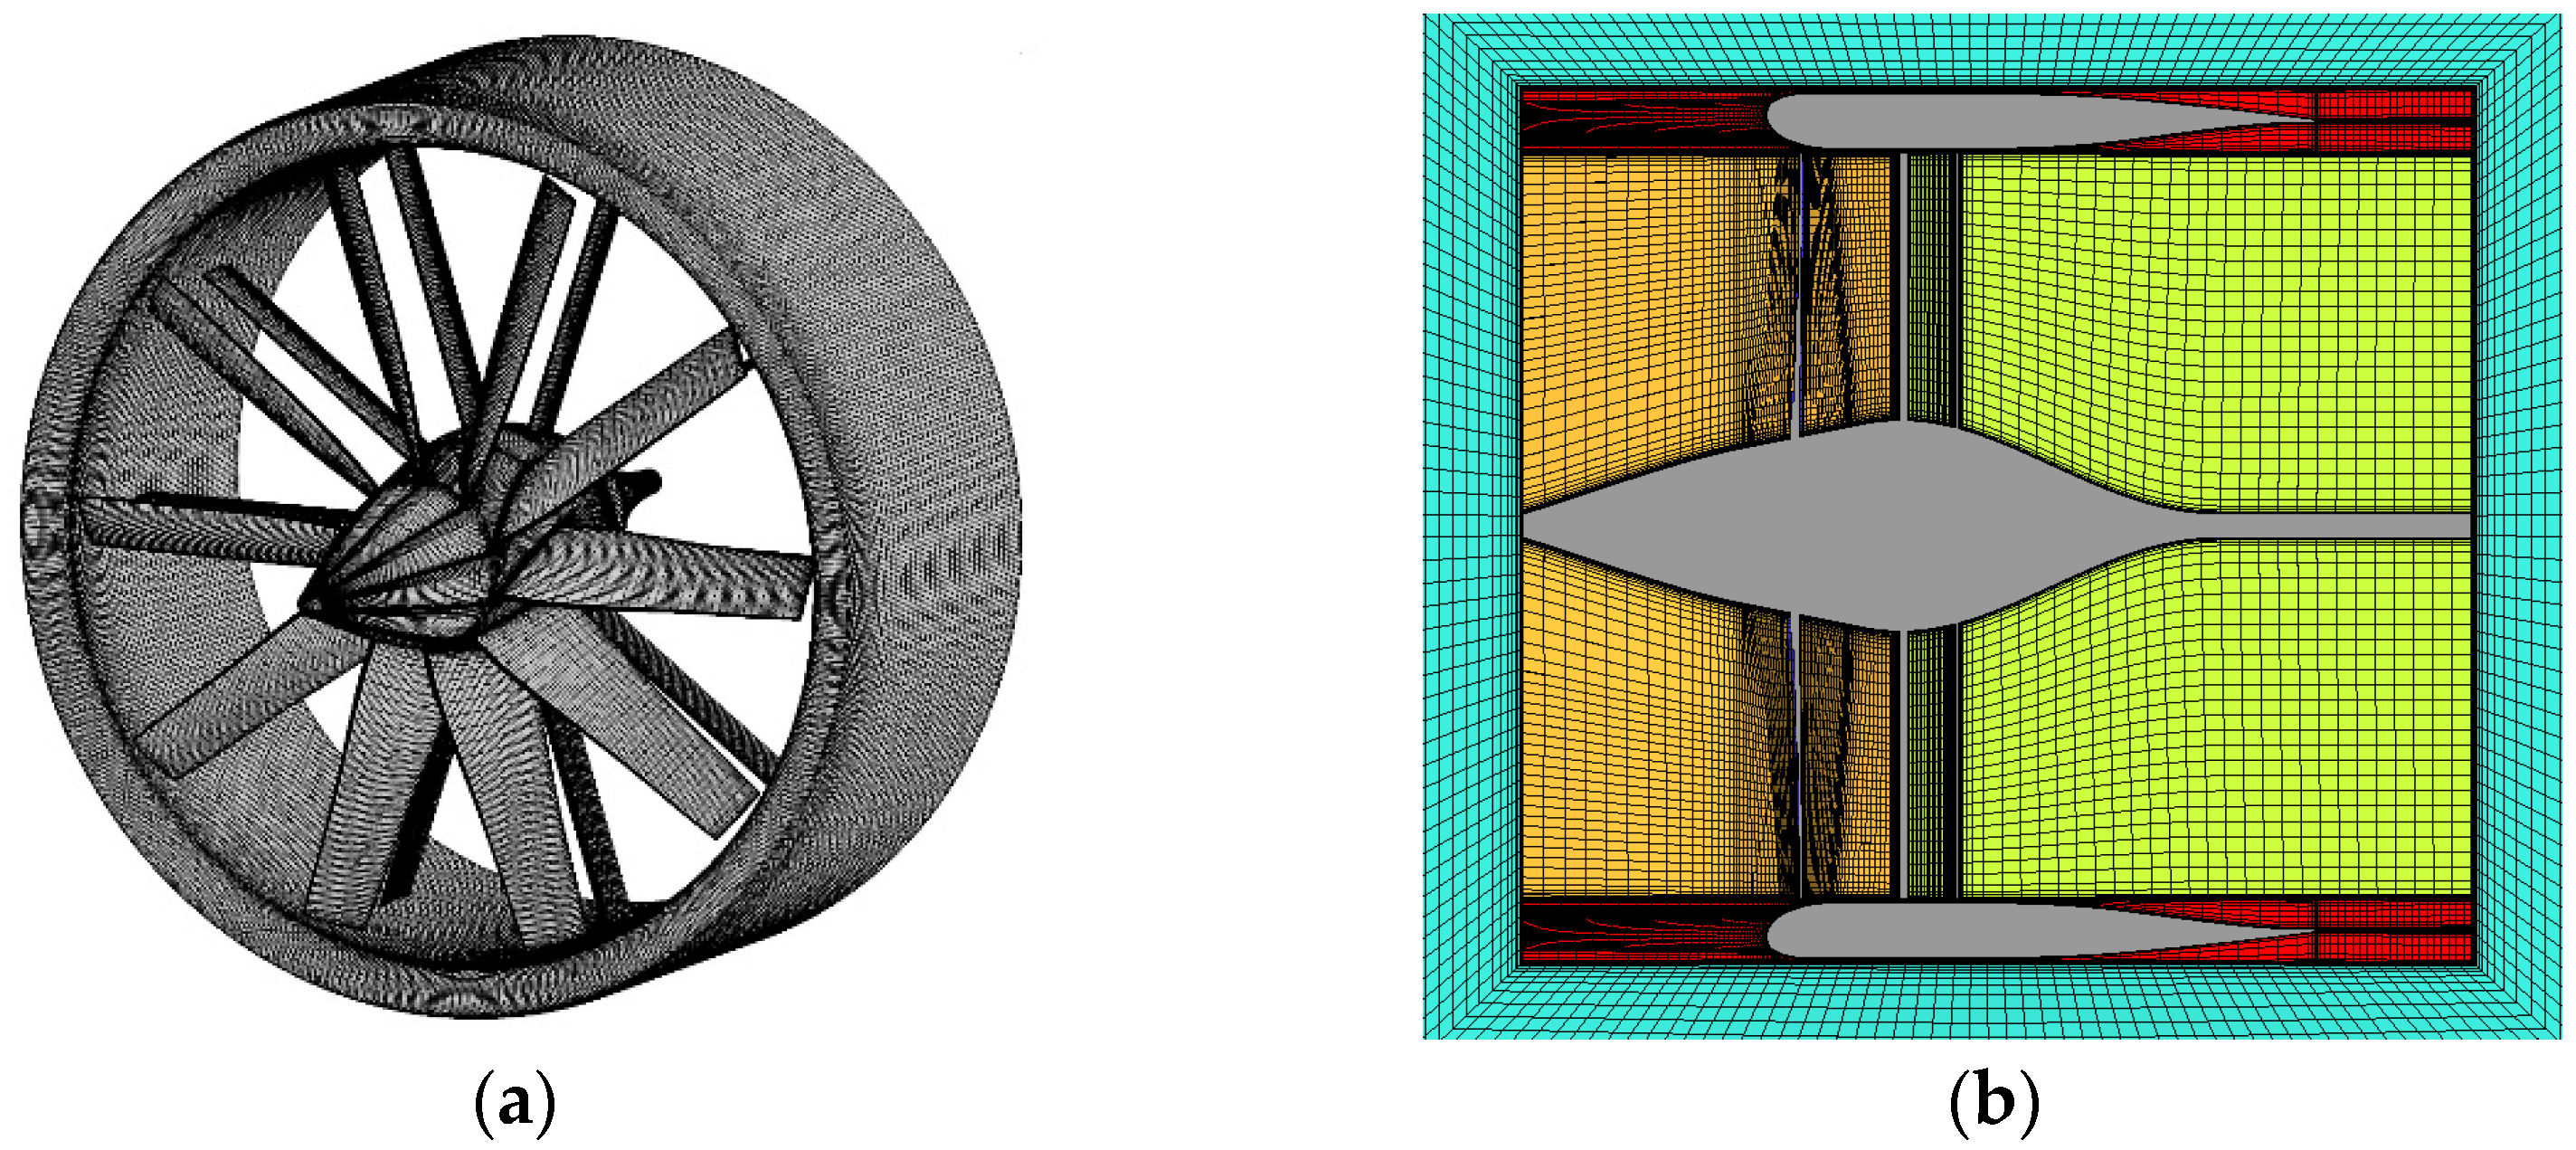
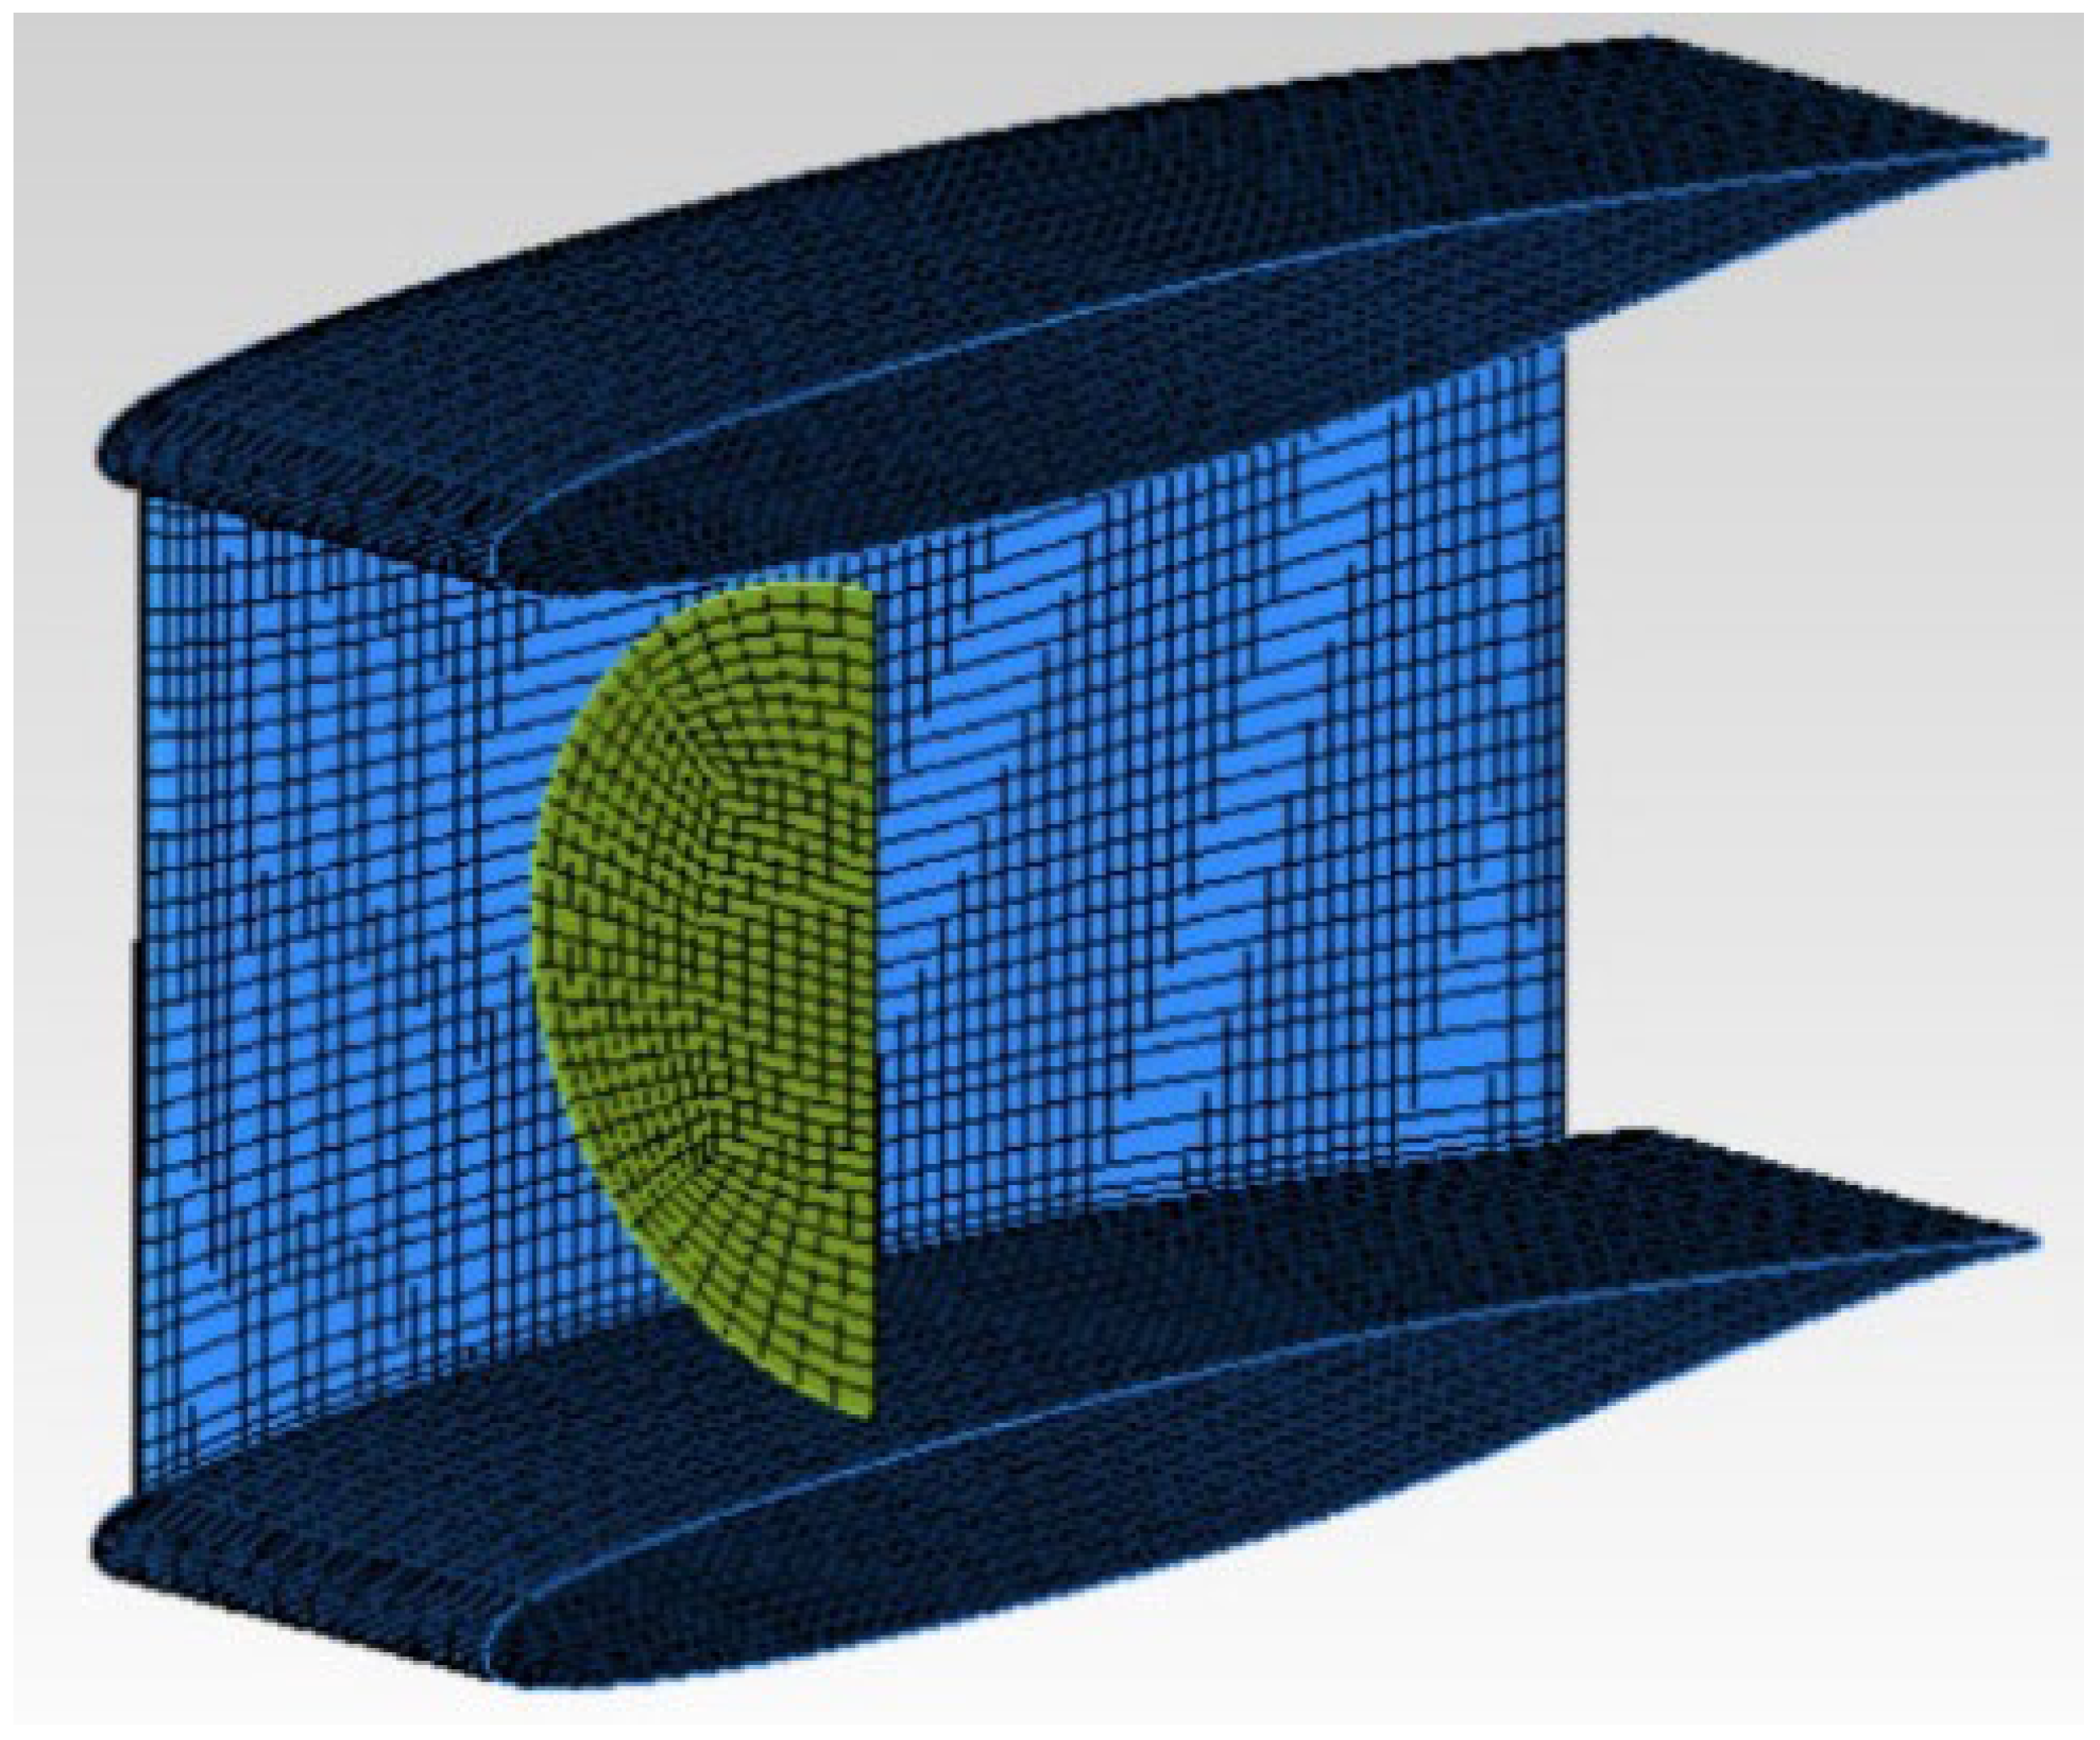
The lift and drag of the half DFW unit using the virtual disc are solved. The virtual disc with momentum sources replaces the effects of the ducted fan. The other simulation parameters are consistent with the former simulation using actual blades. The mesh of half DFW unit simulation using the virtual disc is shown in Figure 18. The standard atmospheric model parameters at an altitude of 10 km are adopted. The flight velocity is 600 km/h, and the value of the pressure step is set to 818Pa on the momentum disc mesh.
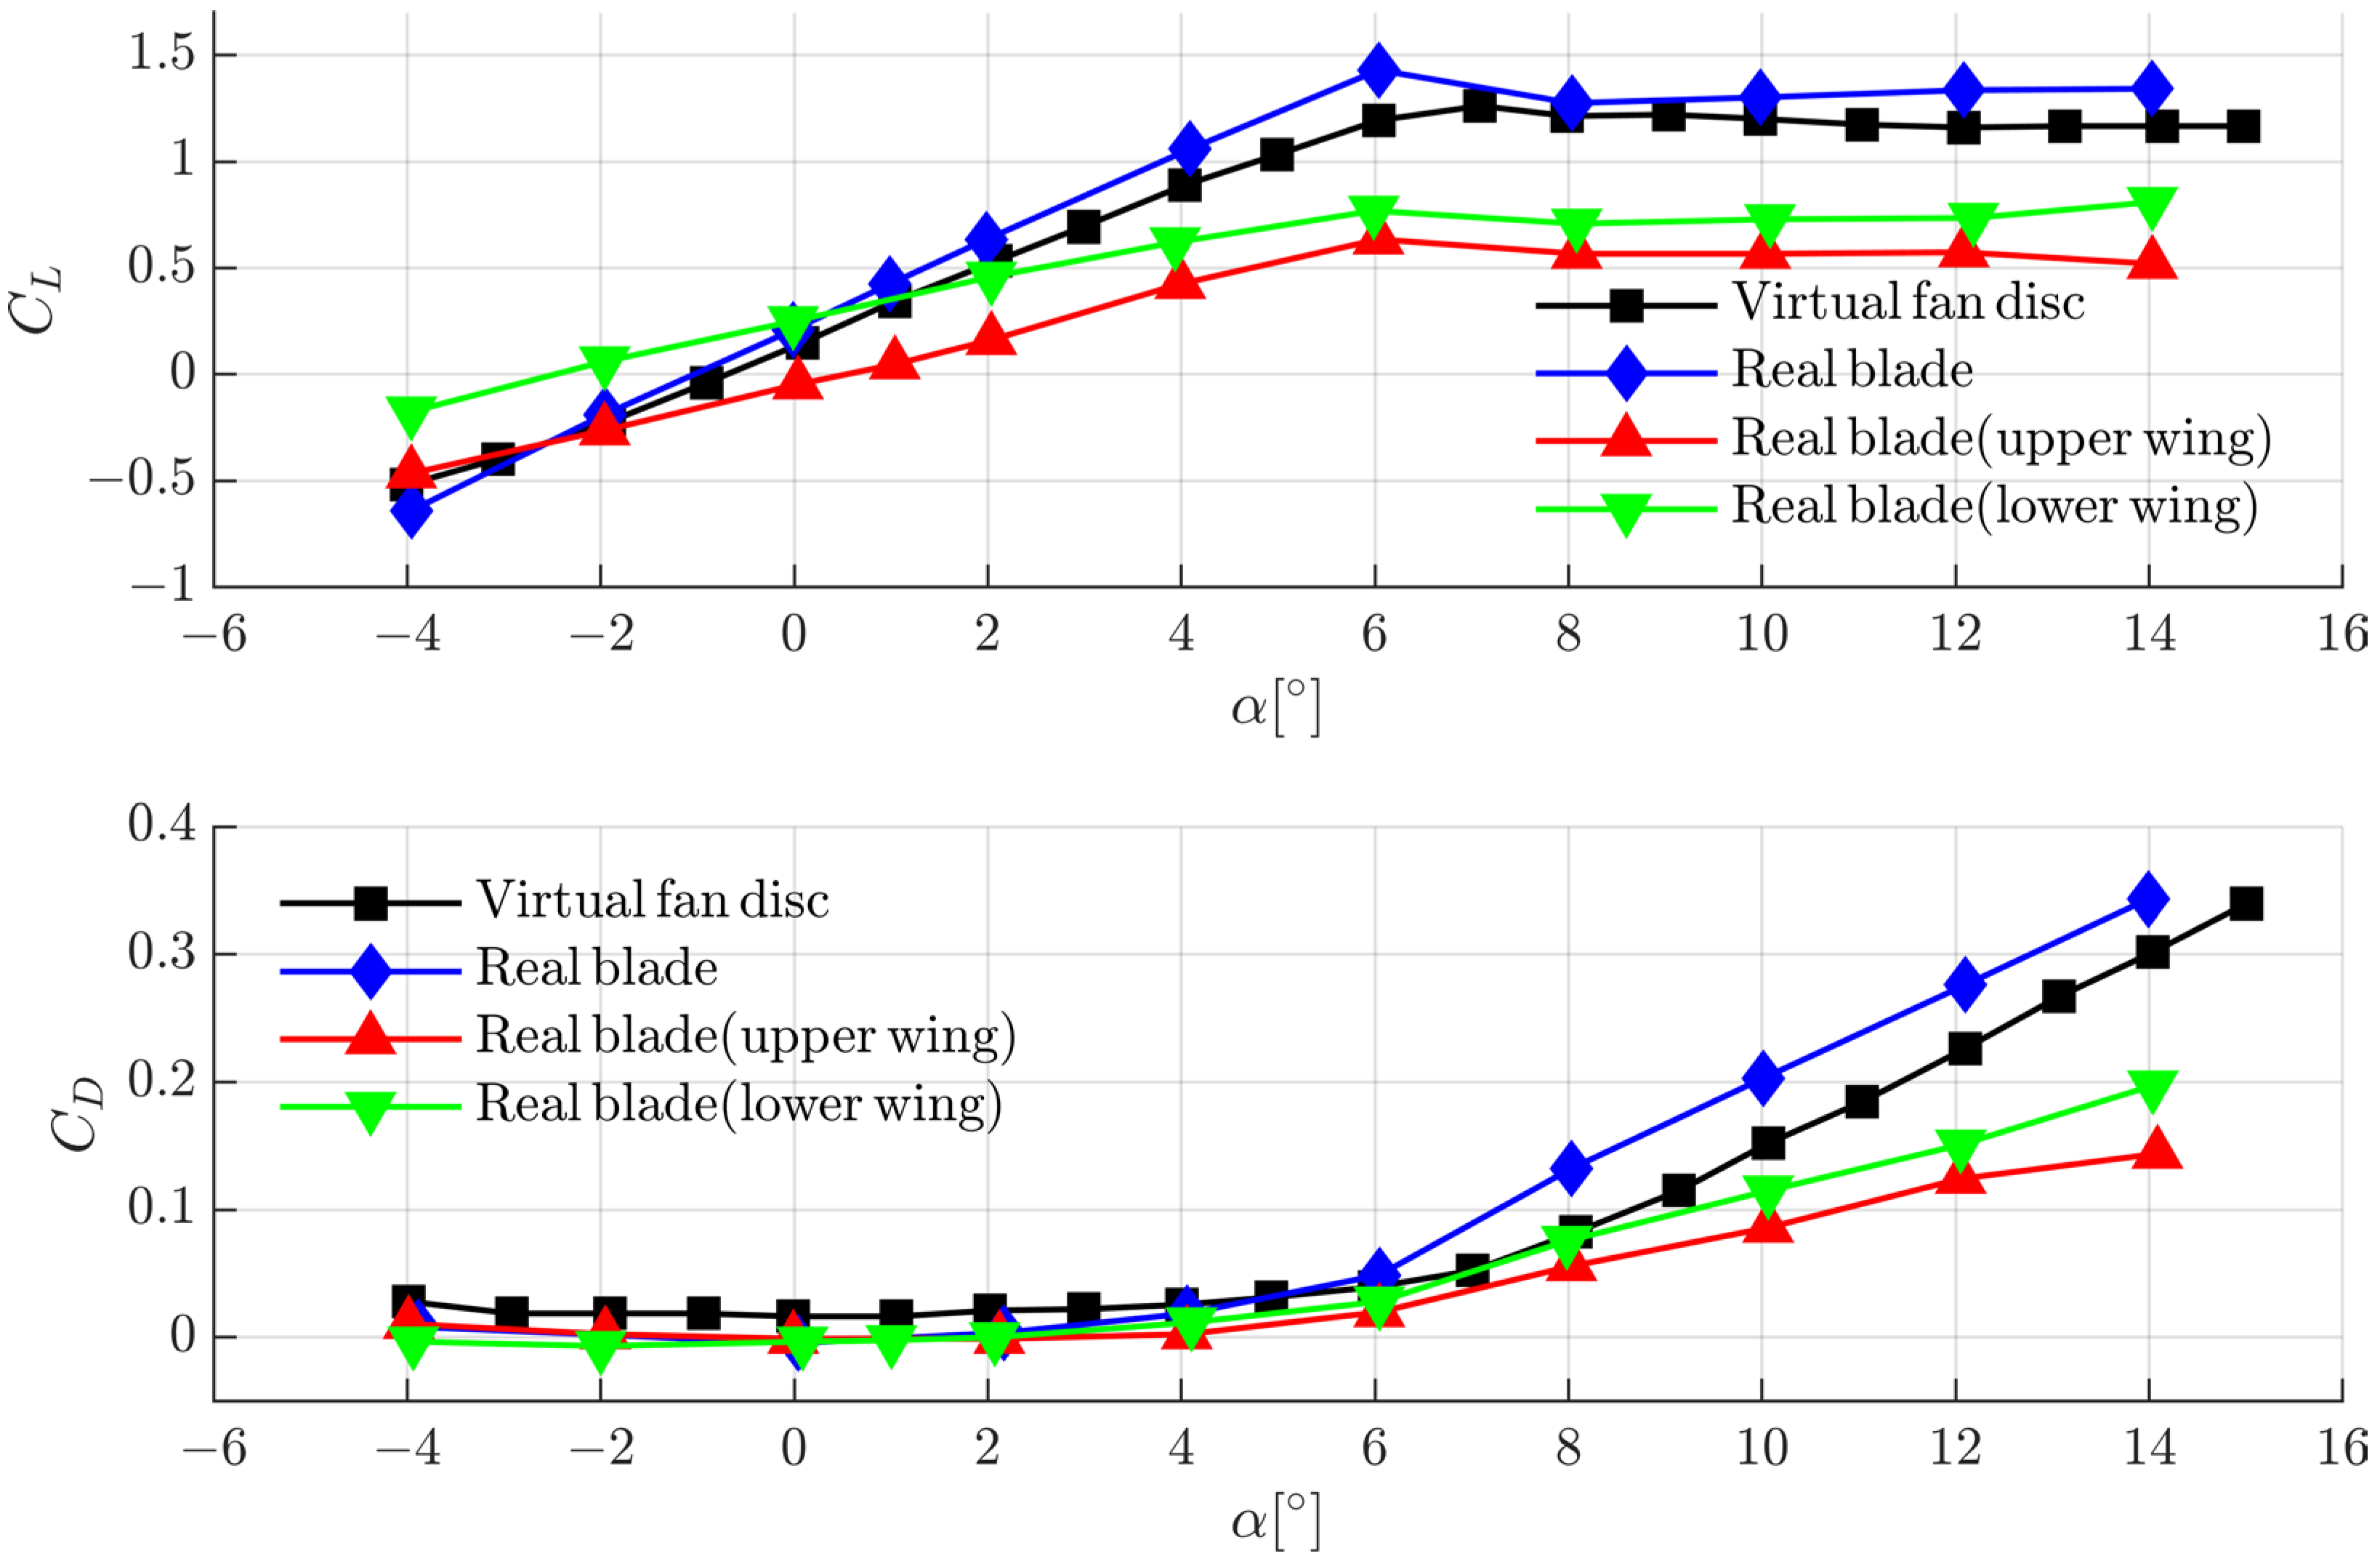
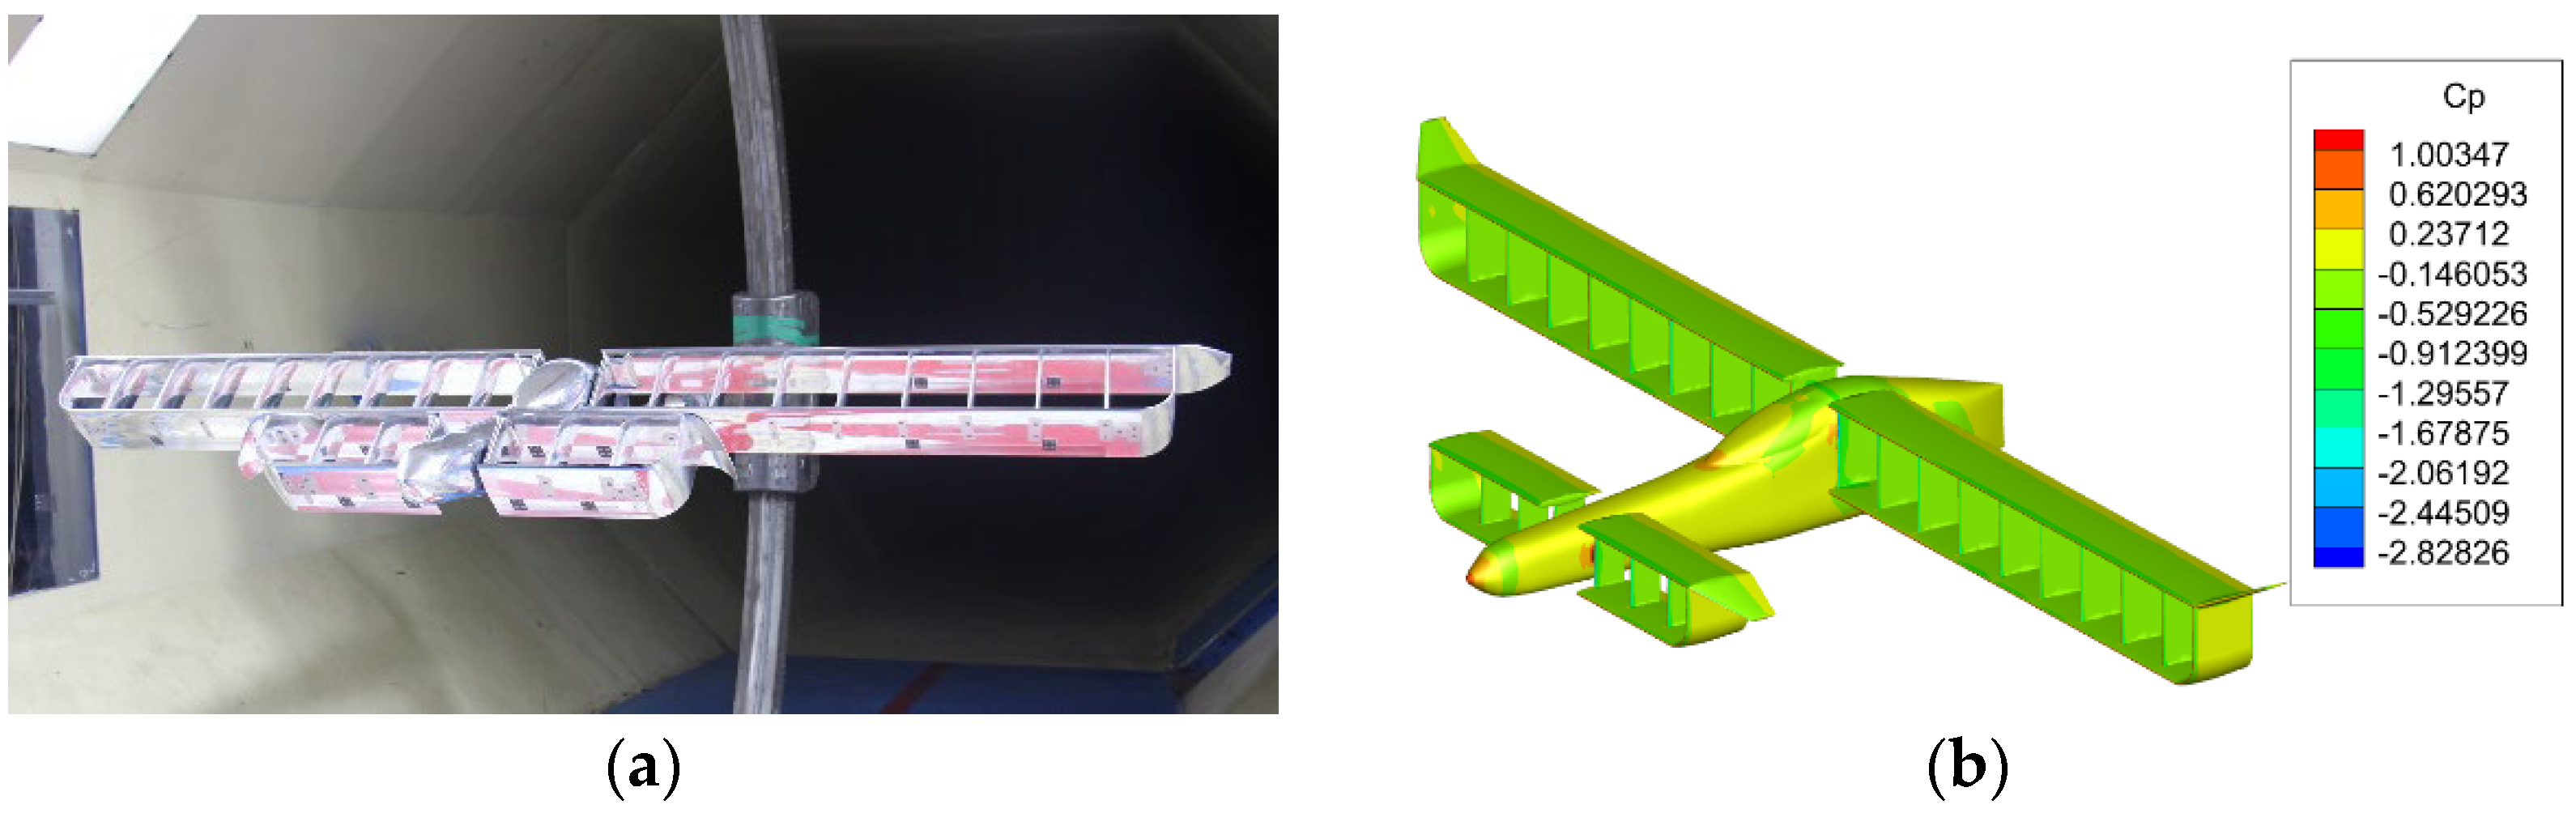
In the cruise conditions of the DFW unit simulation, the lift-and-drag coefficients comparison between the actual blade and the momentum disc are shown in Figure 19. The close trend and the marginal numerical difference of the coefficients demonstrate the consistency of the actual blade and the momentum disc.
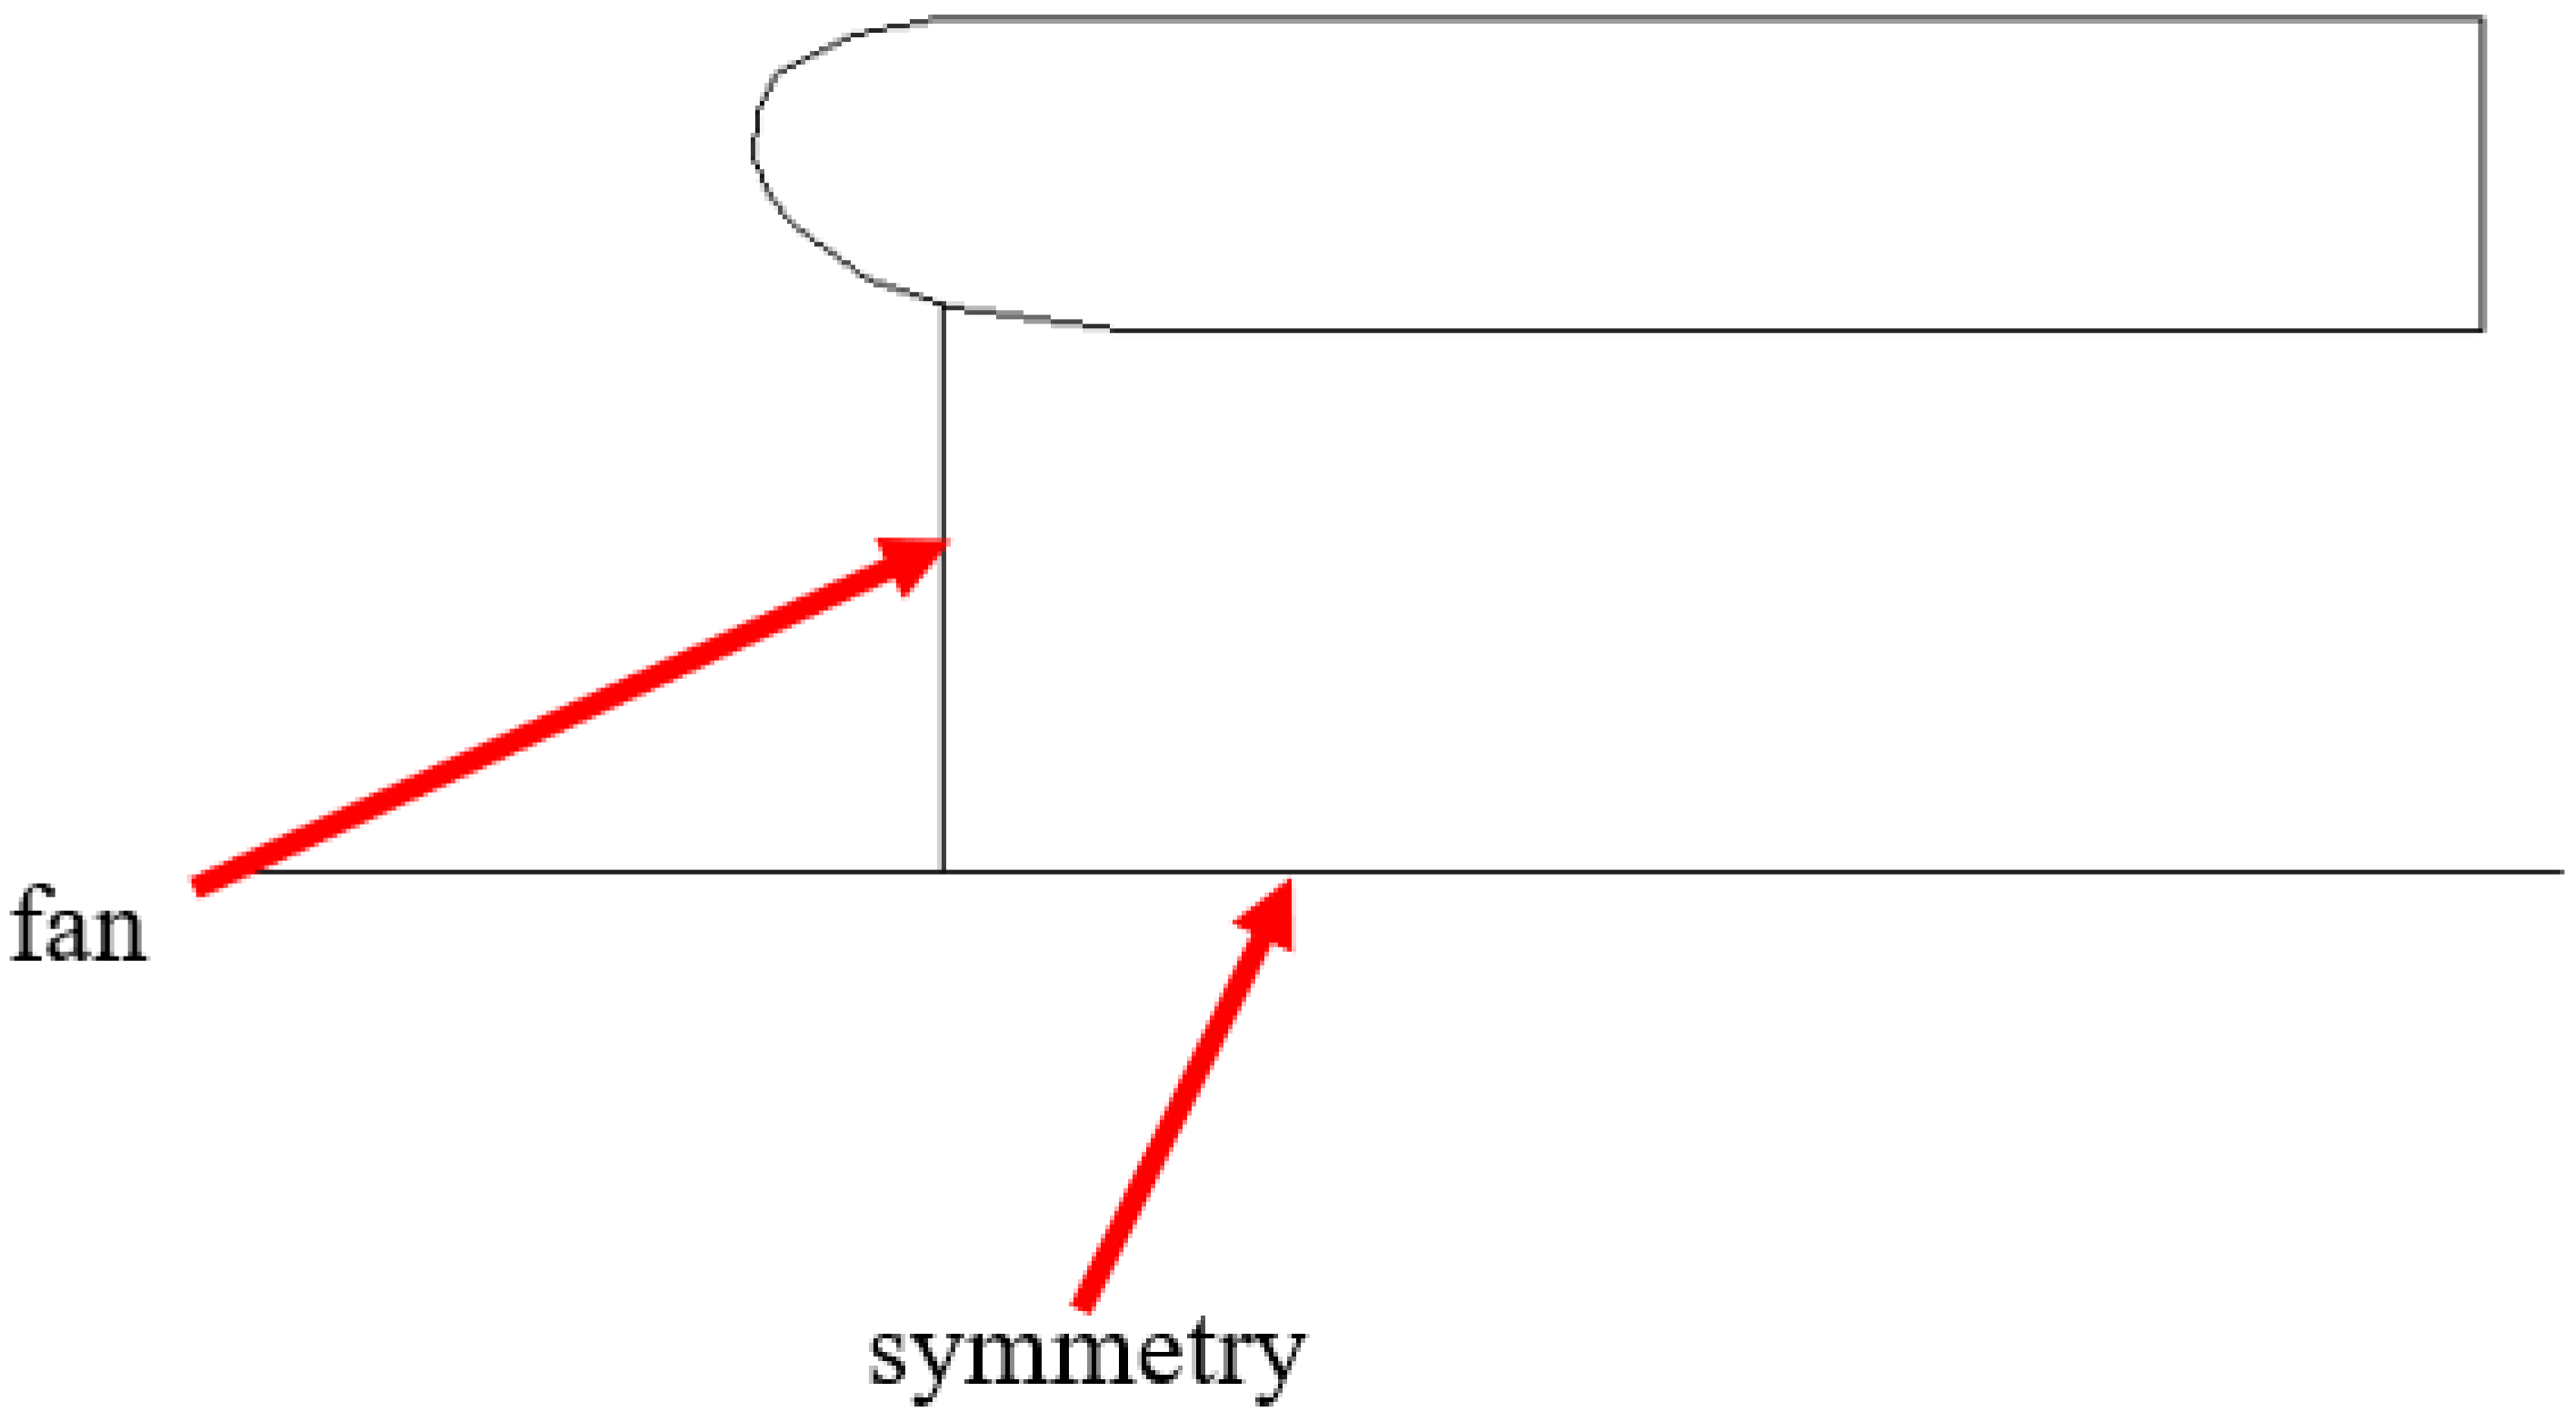
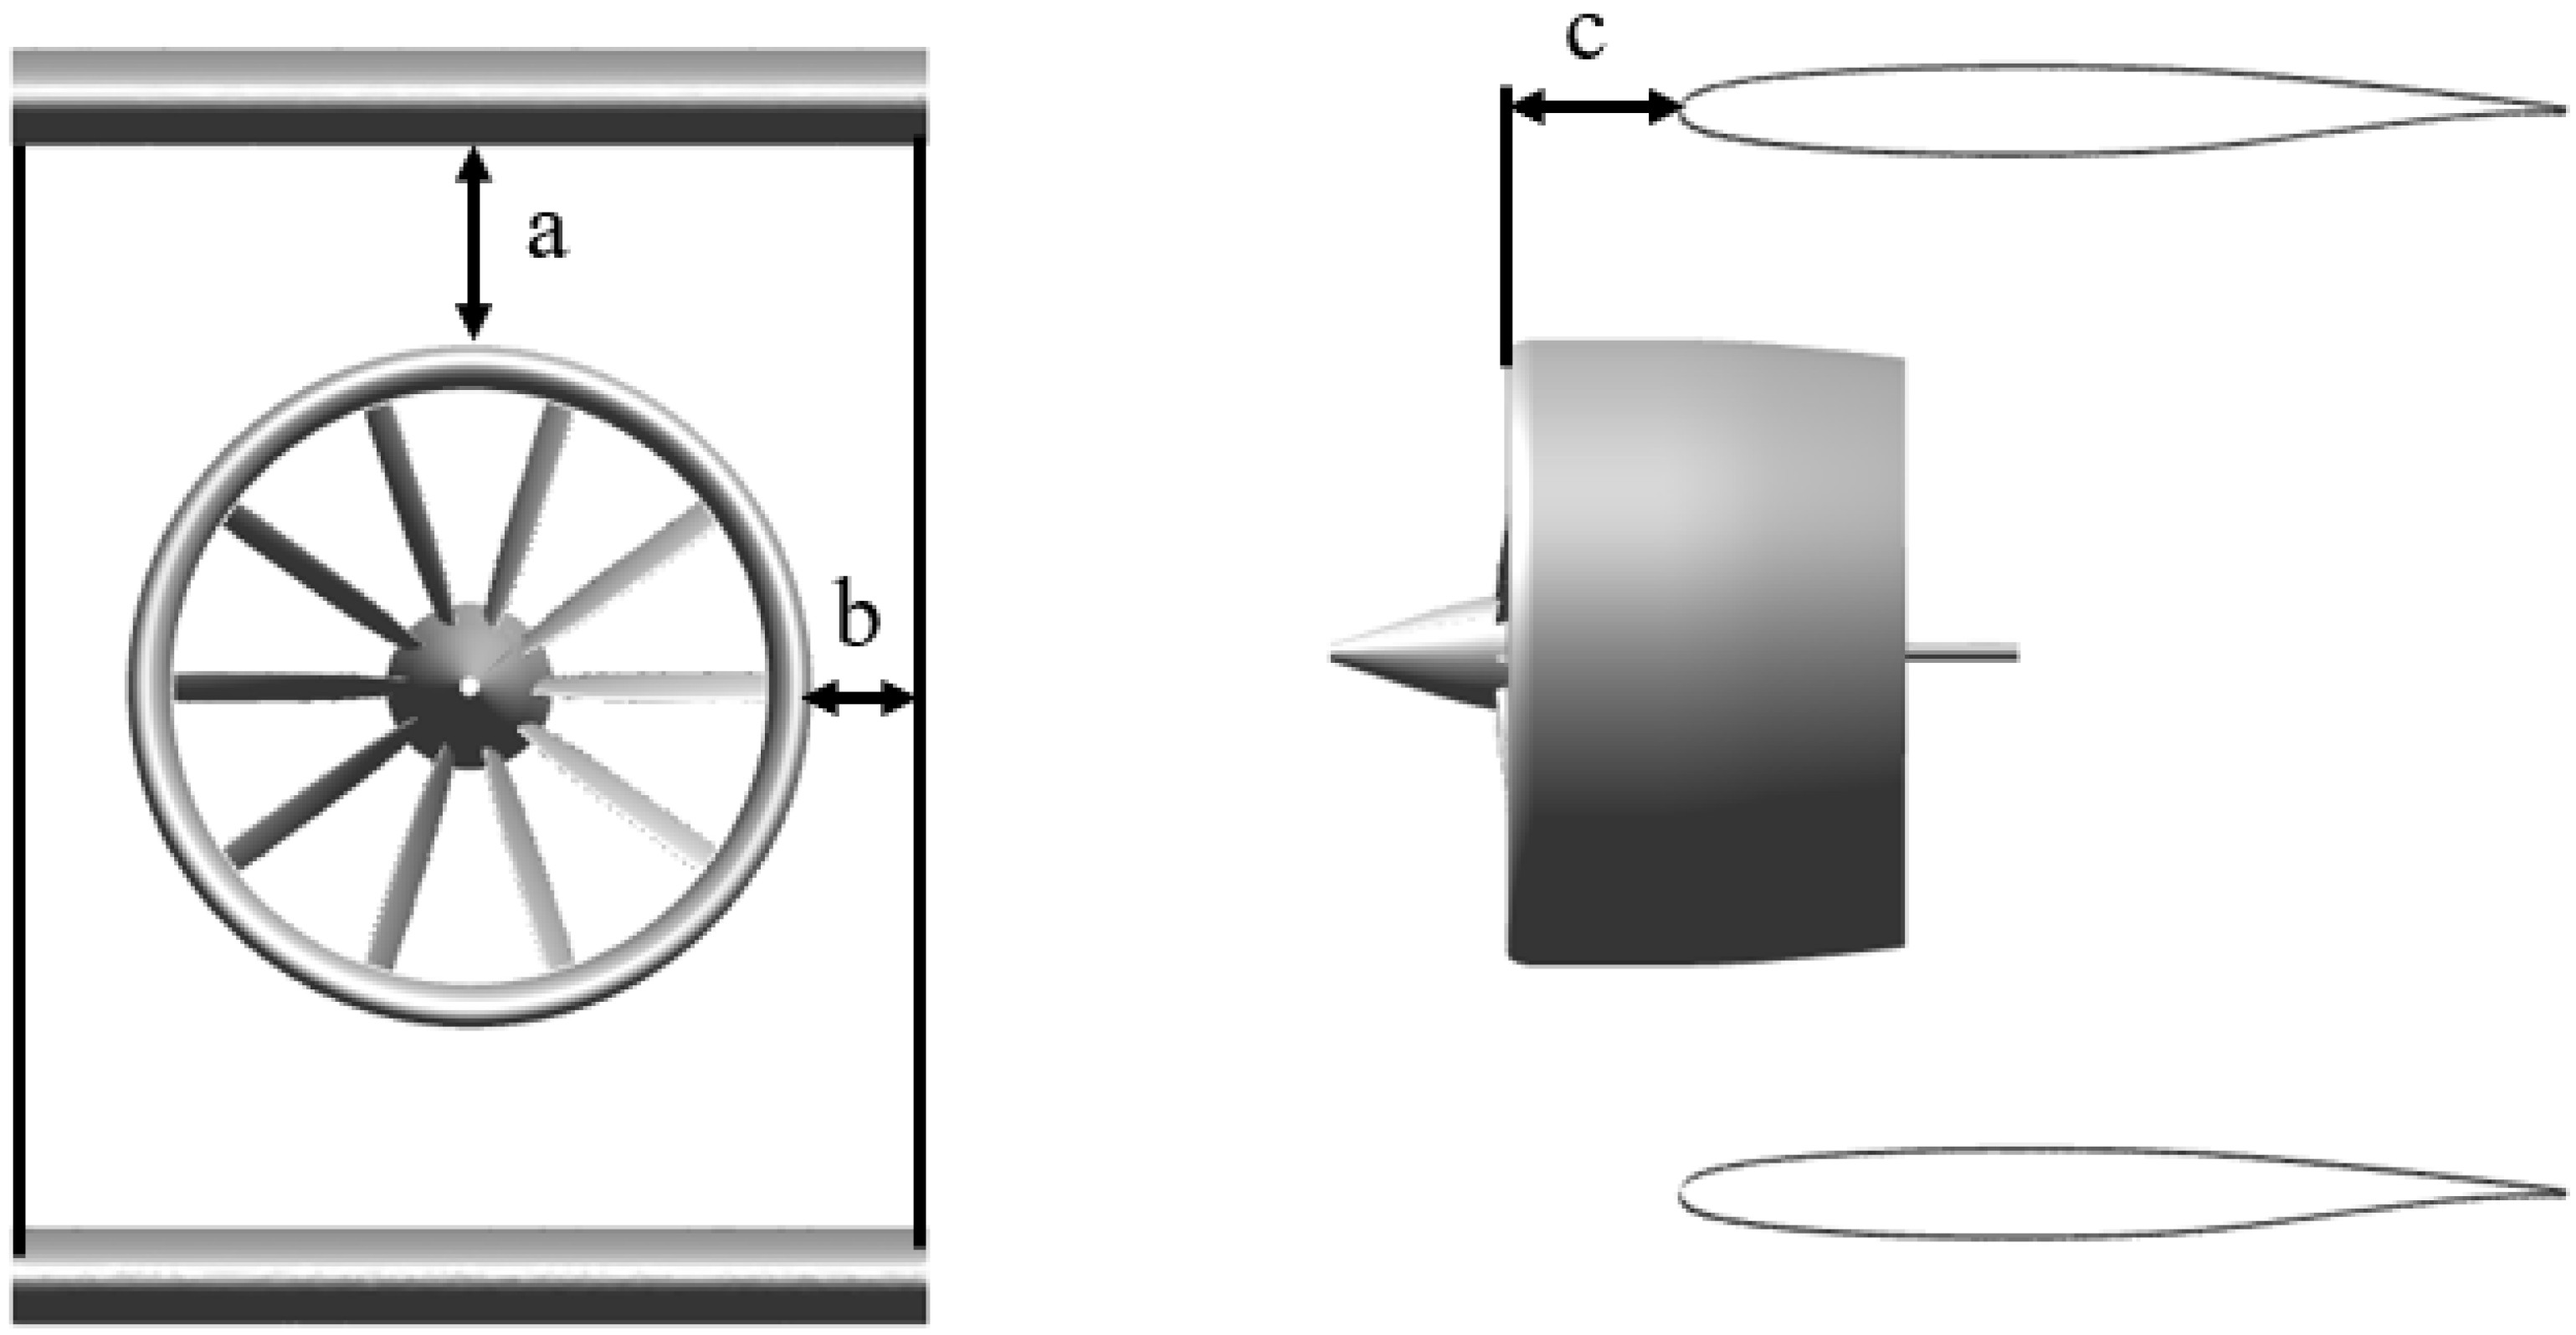
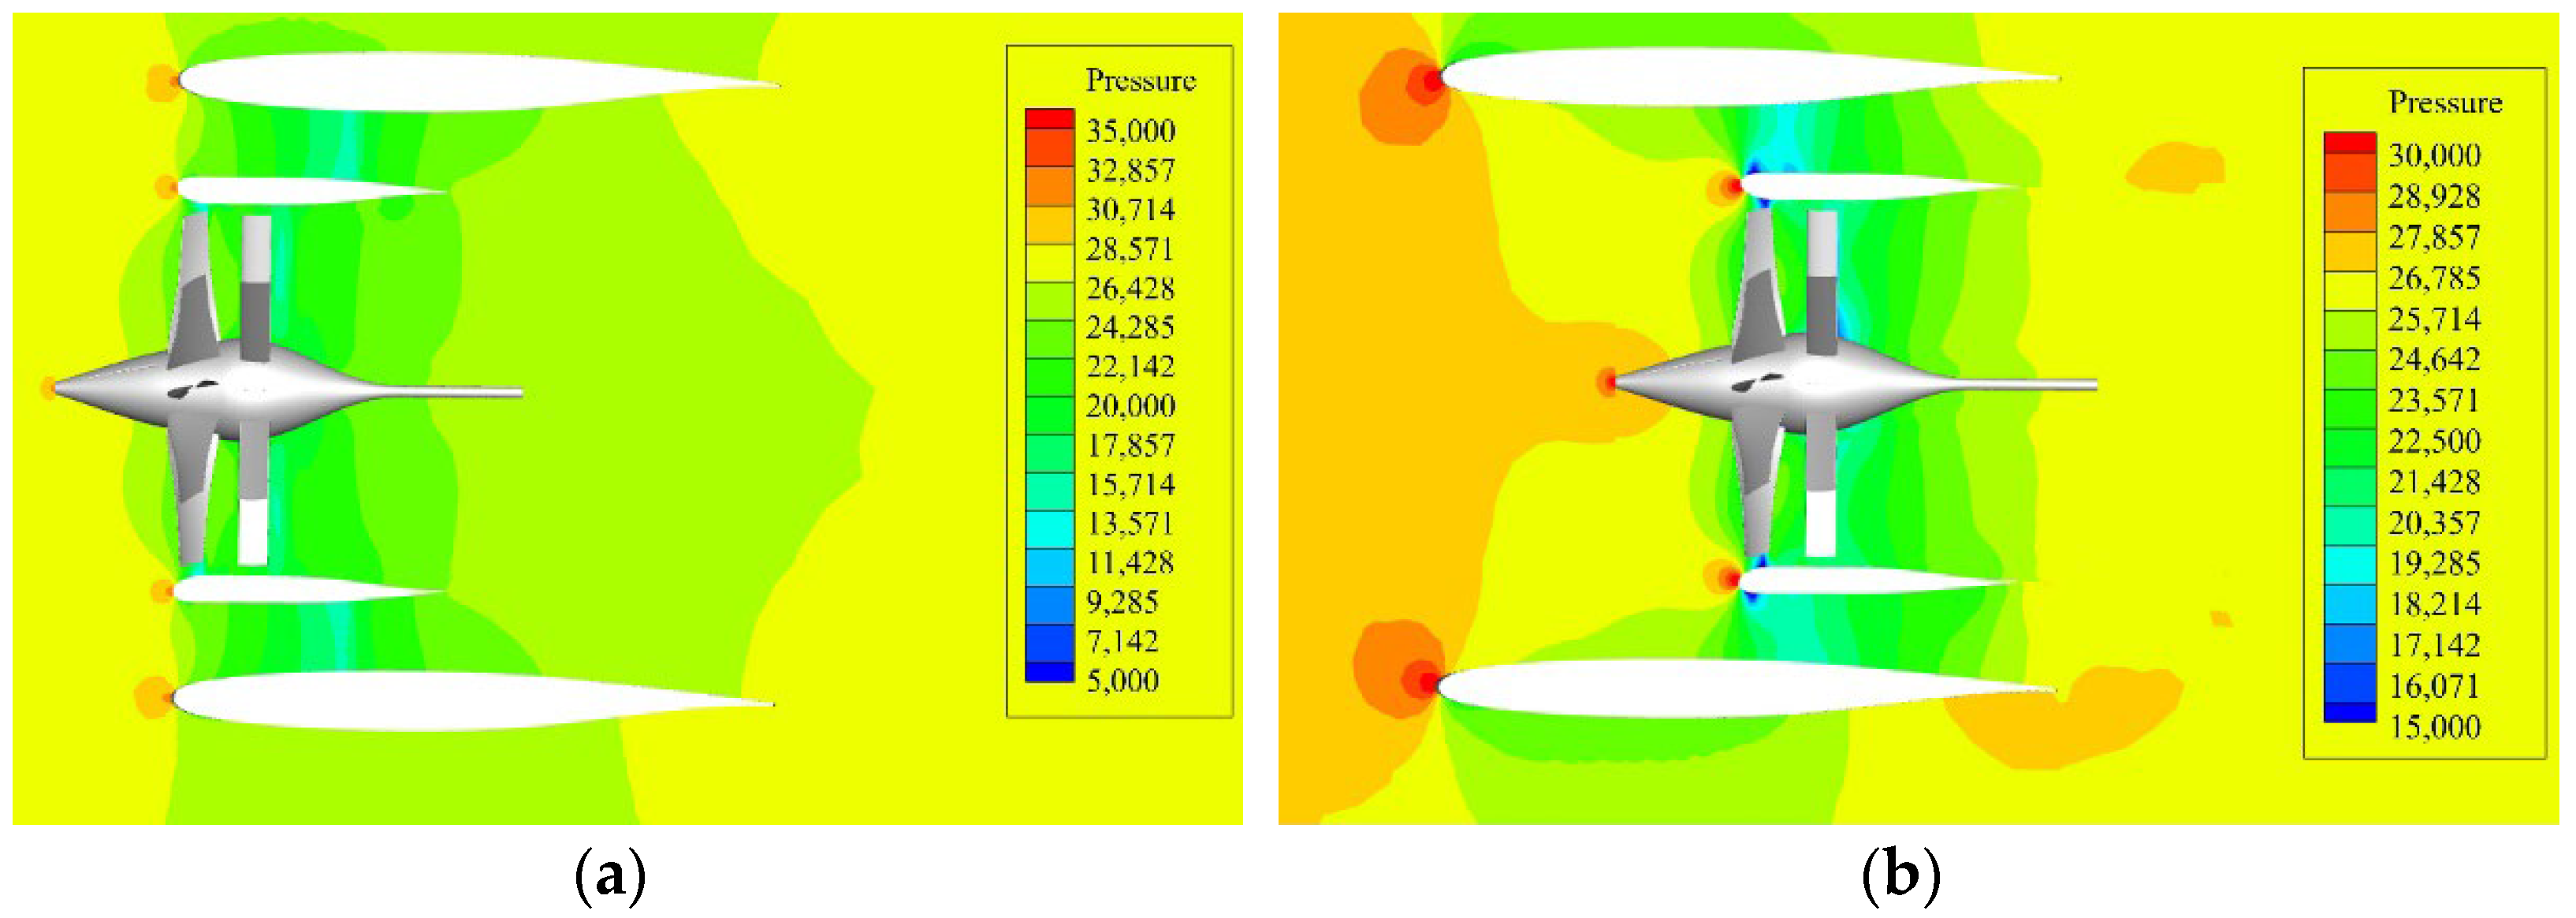
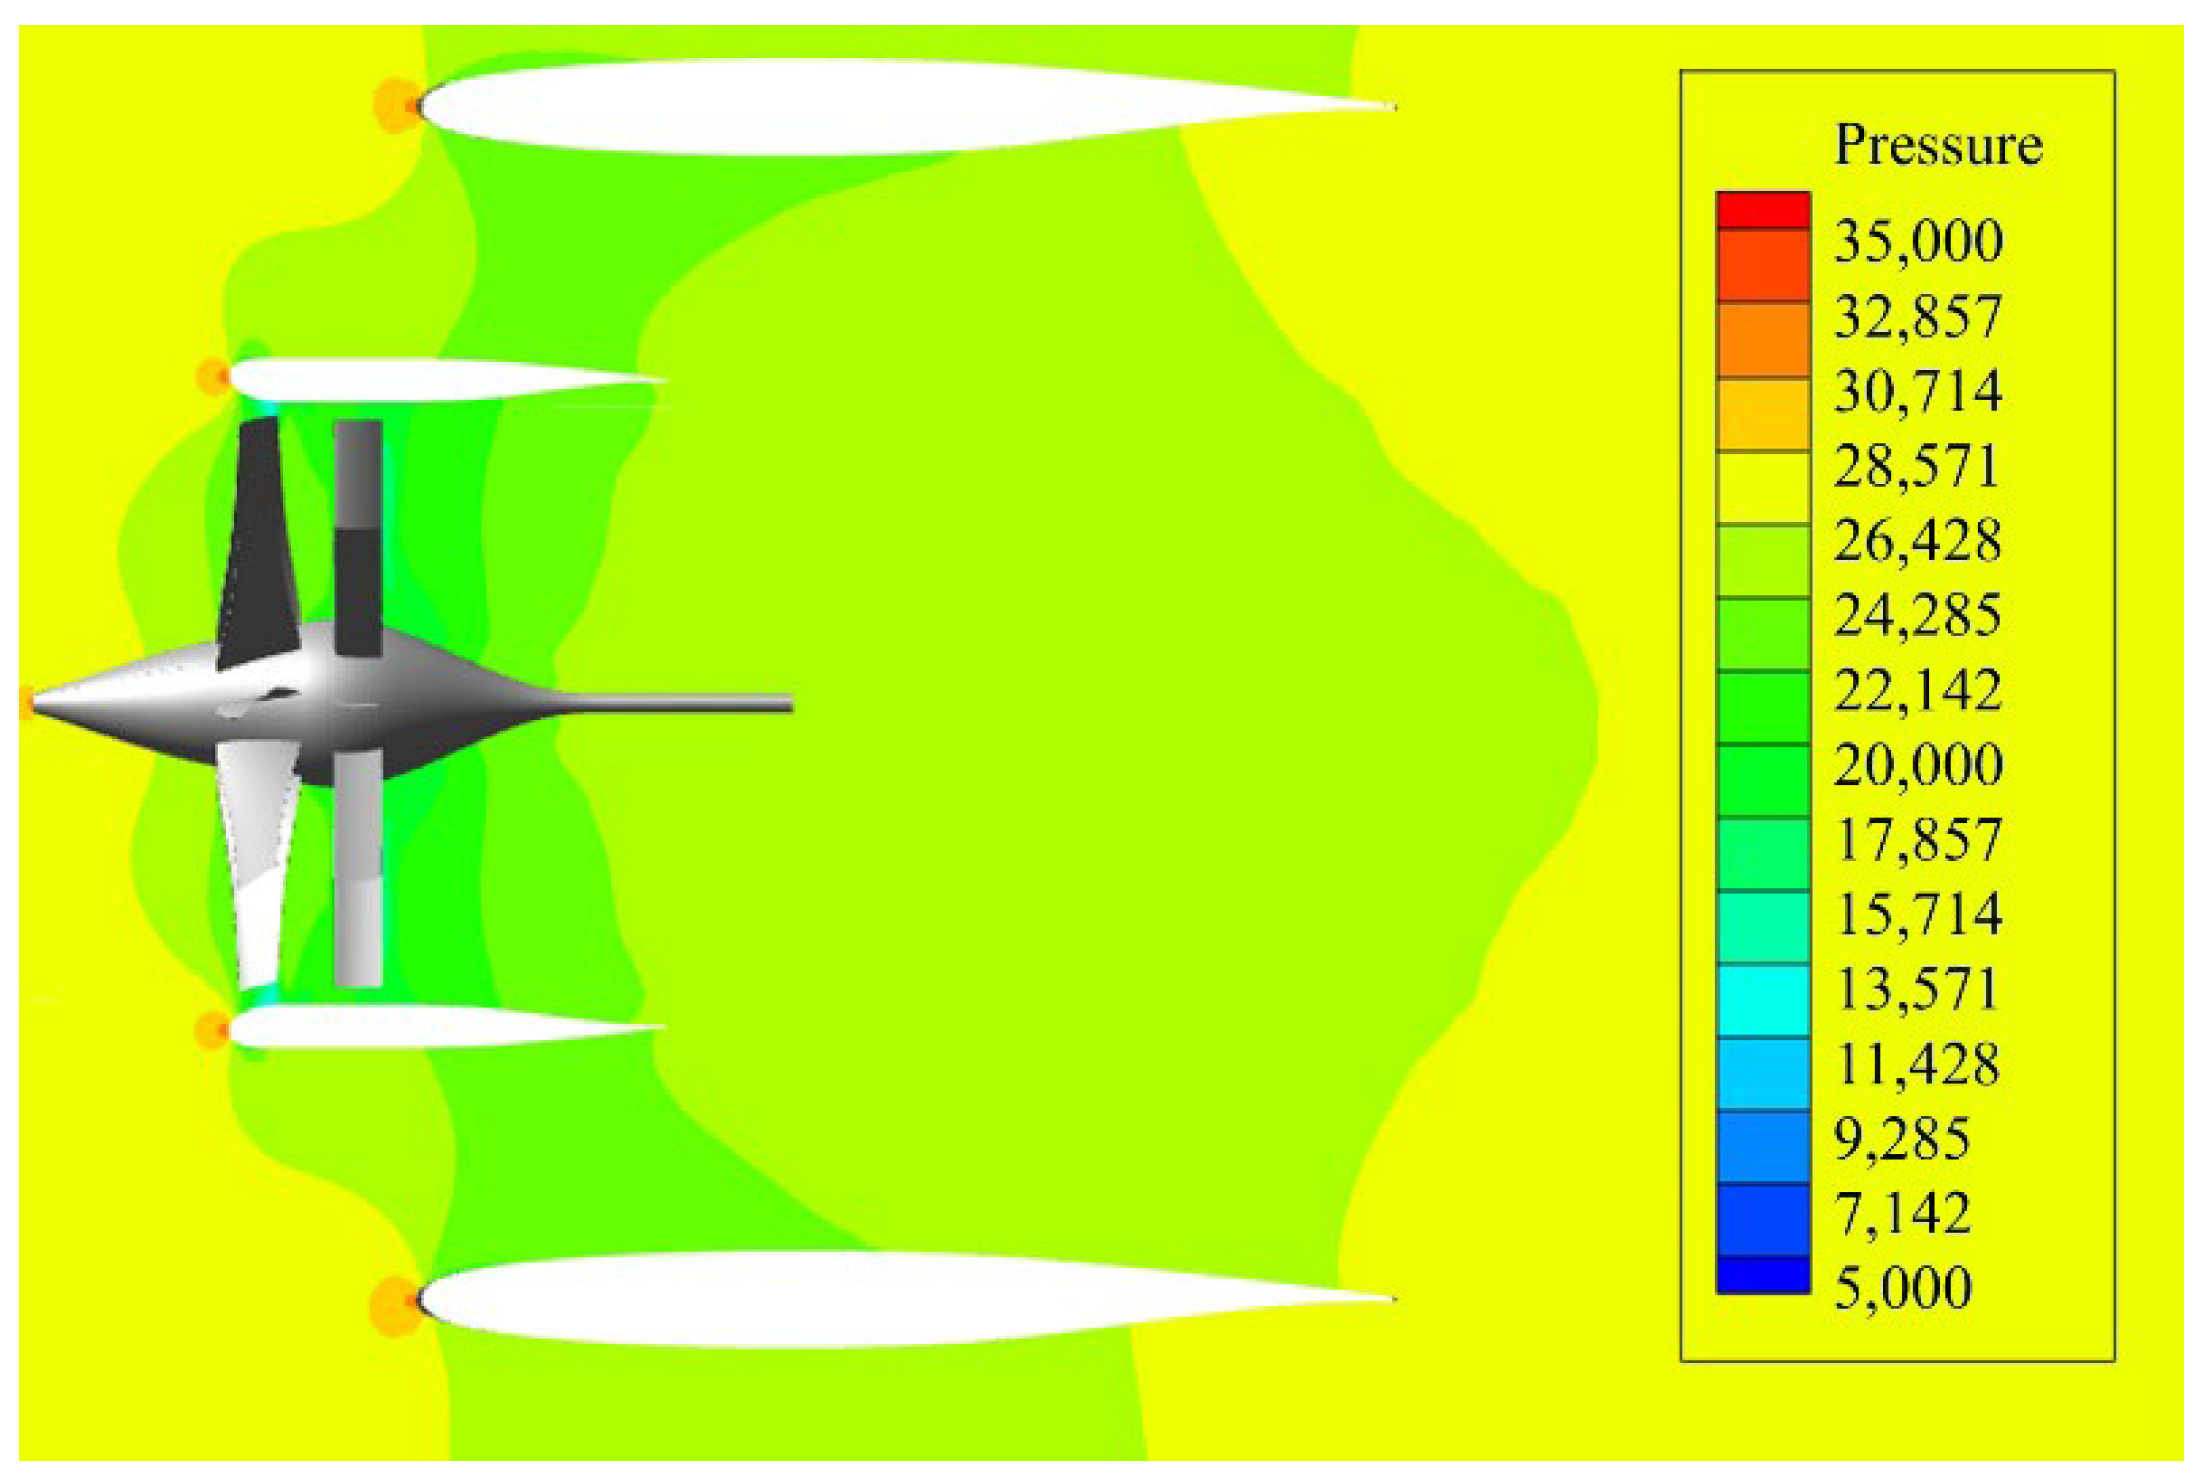
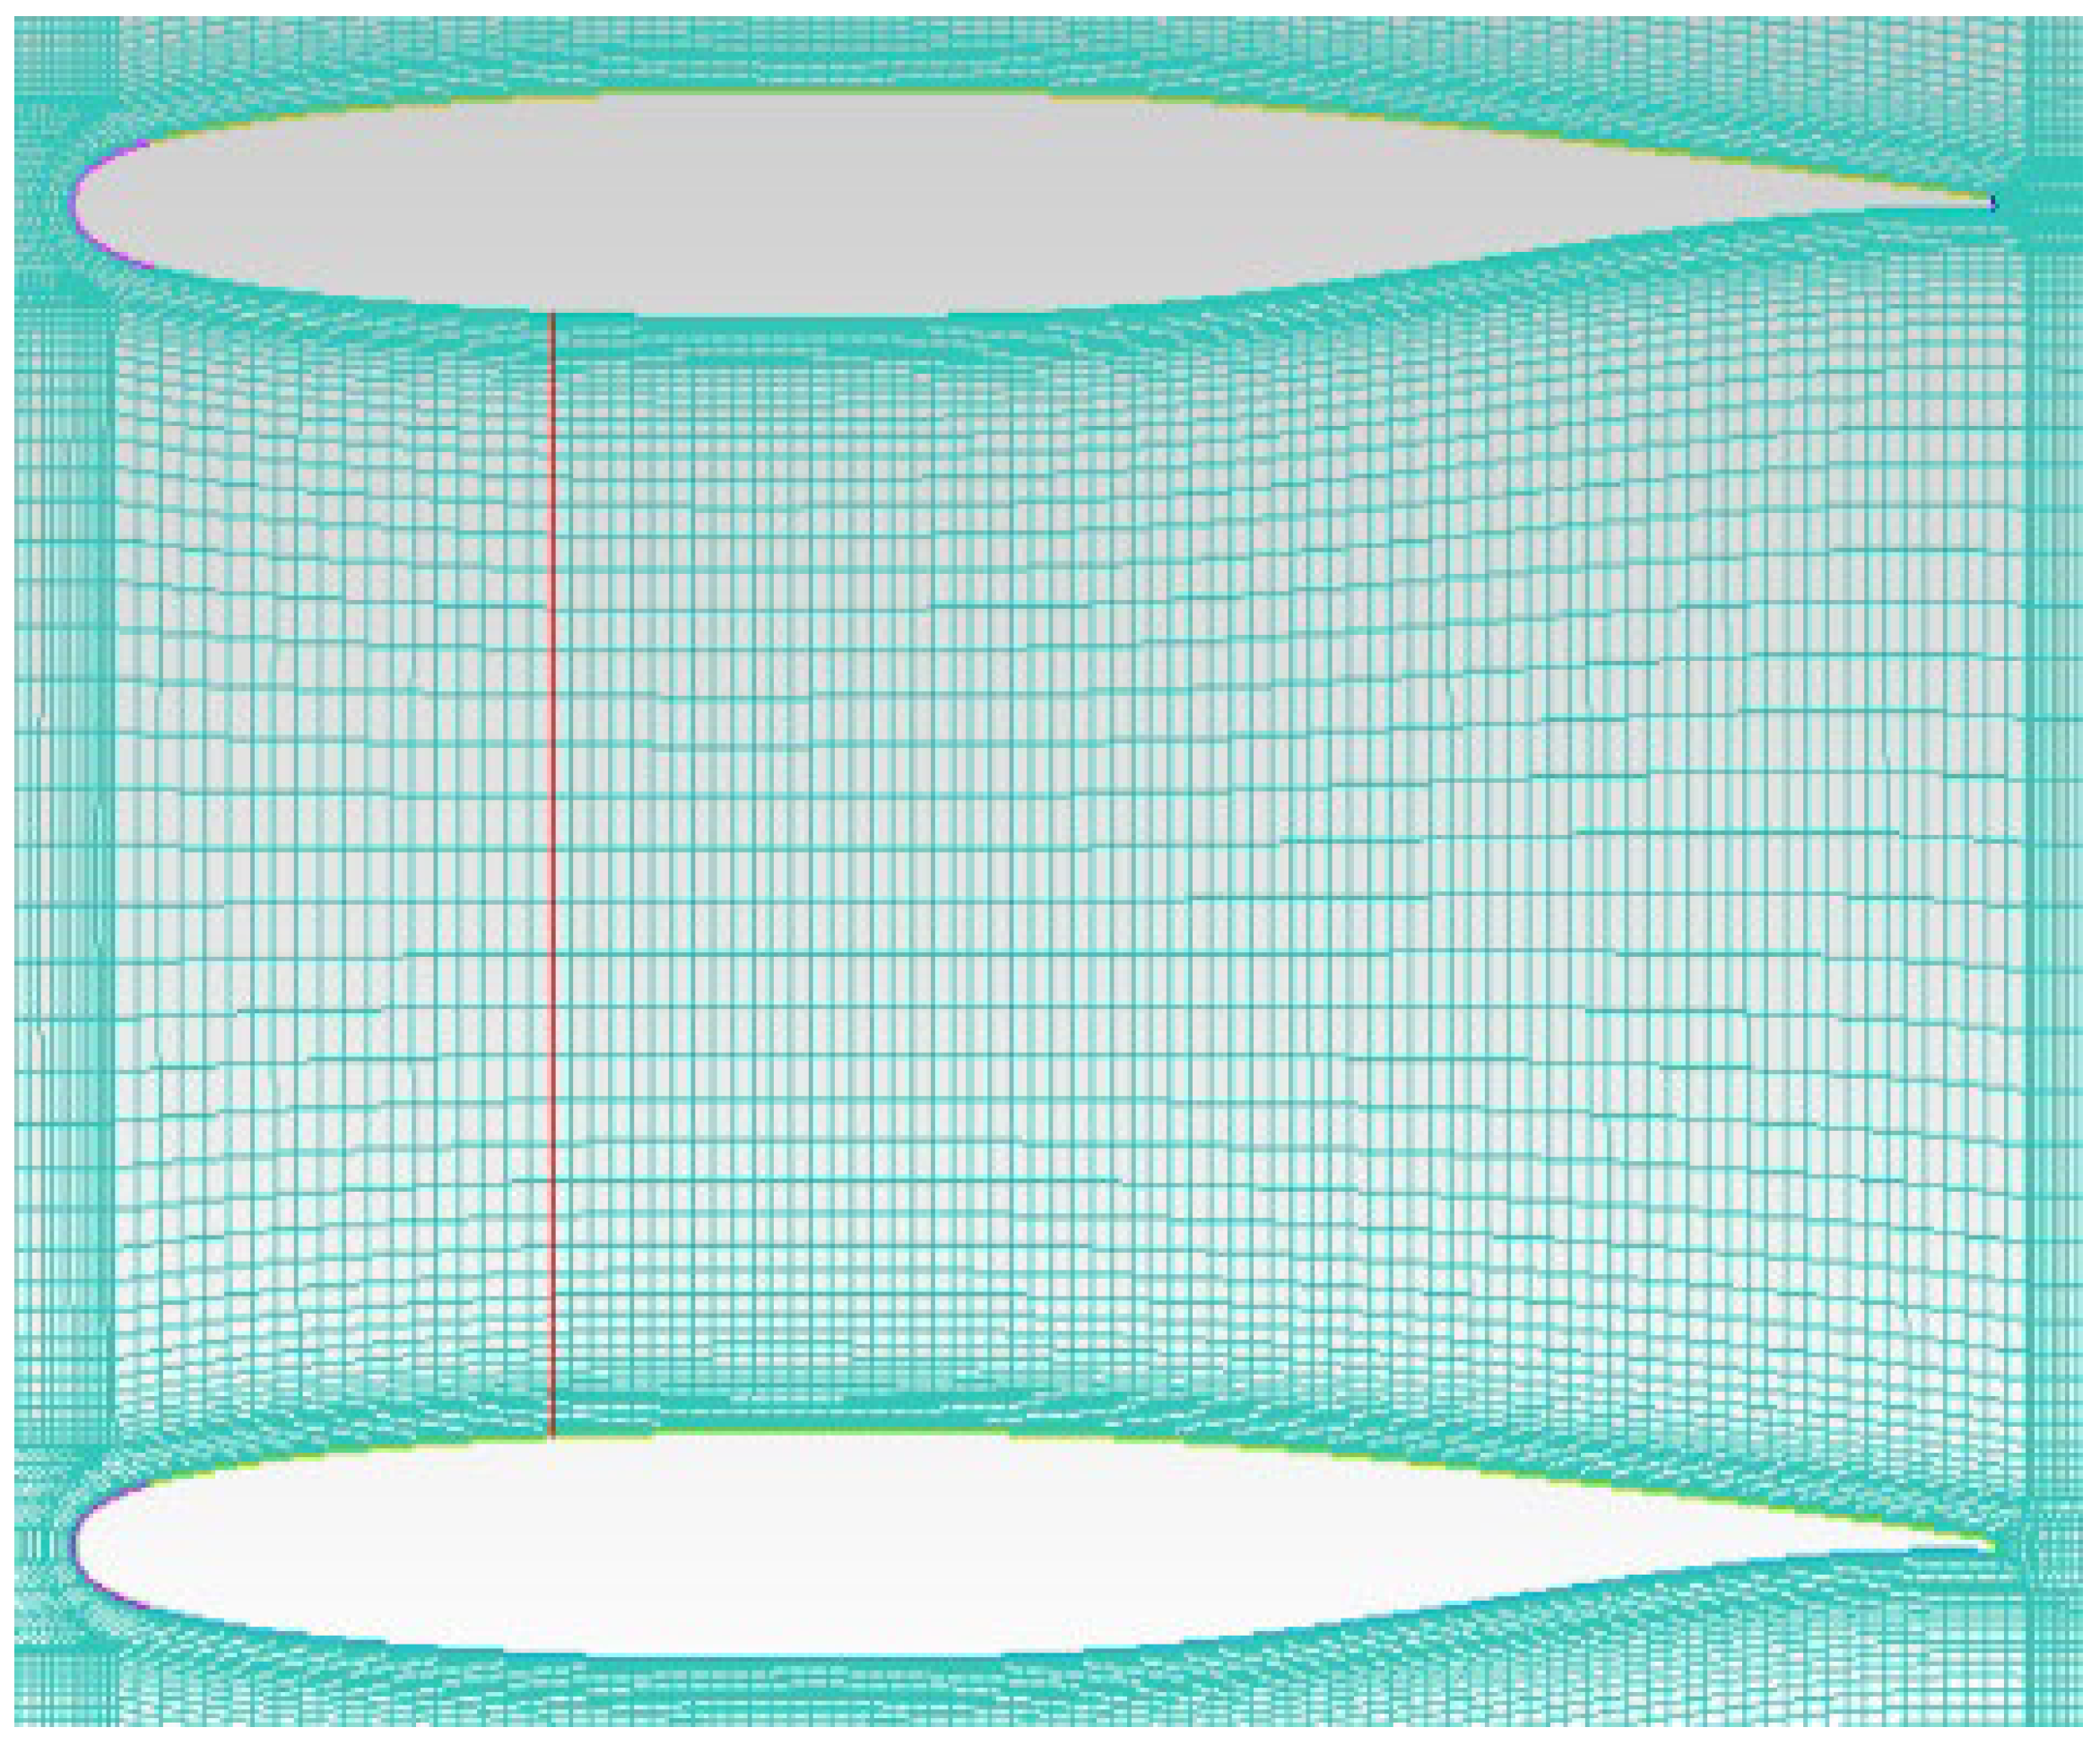
In the DFW vertical meridional plane simulation, the 2D fan boundary is adopted to represent the pressure step generated by the ducted fan between the upper and lower wings. The mesh of the 2D simulation is shown in 
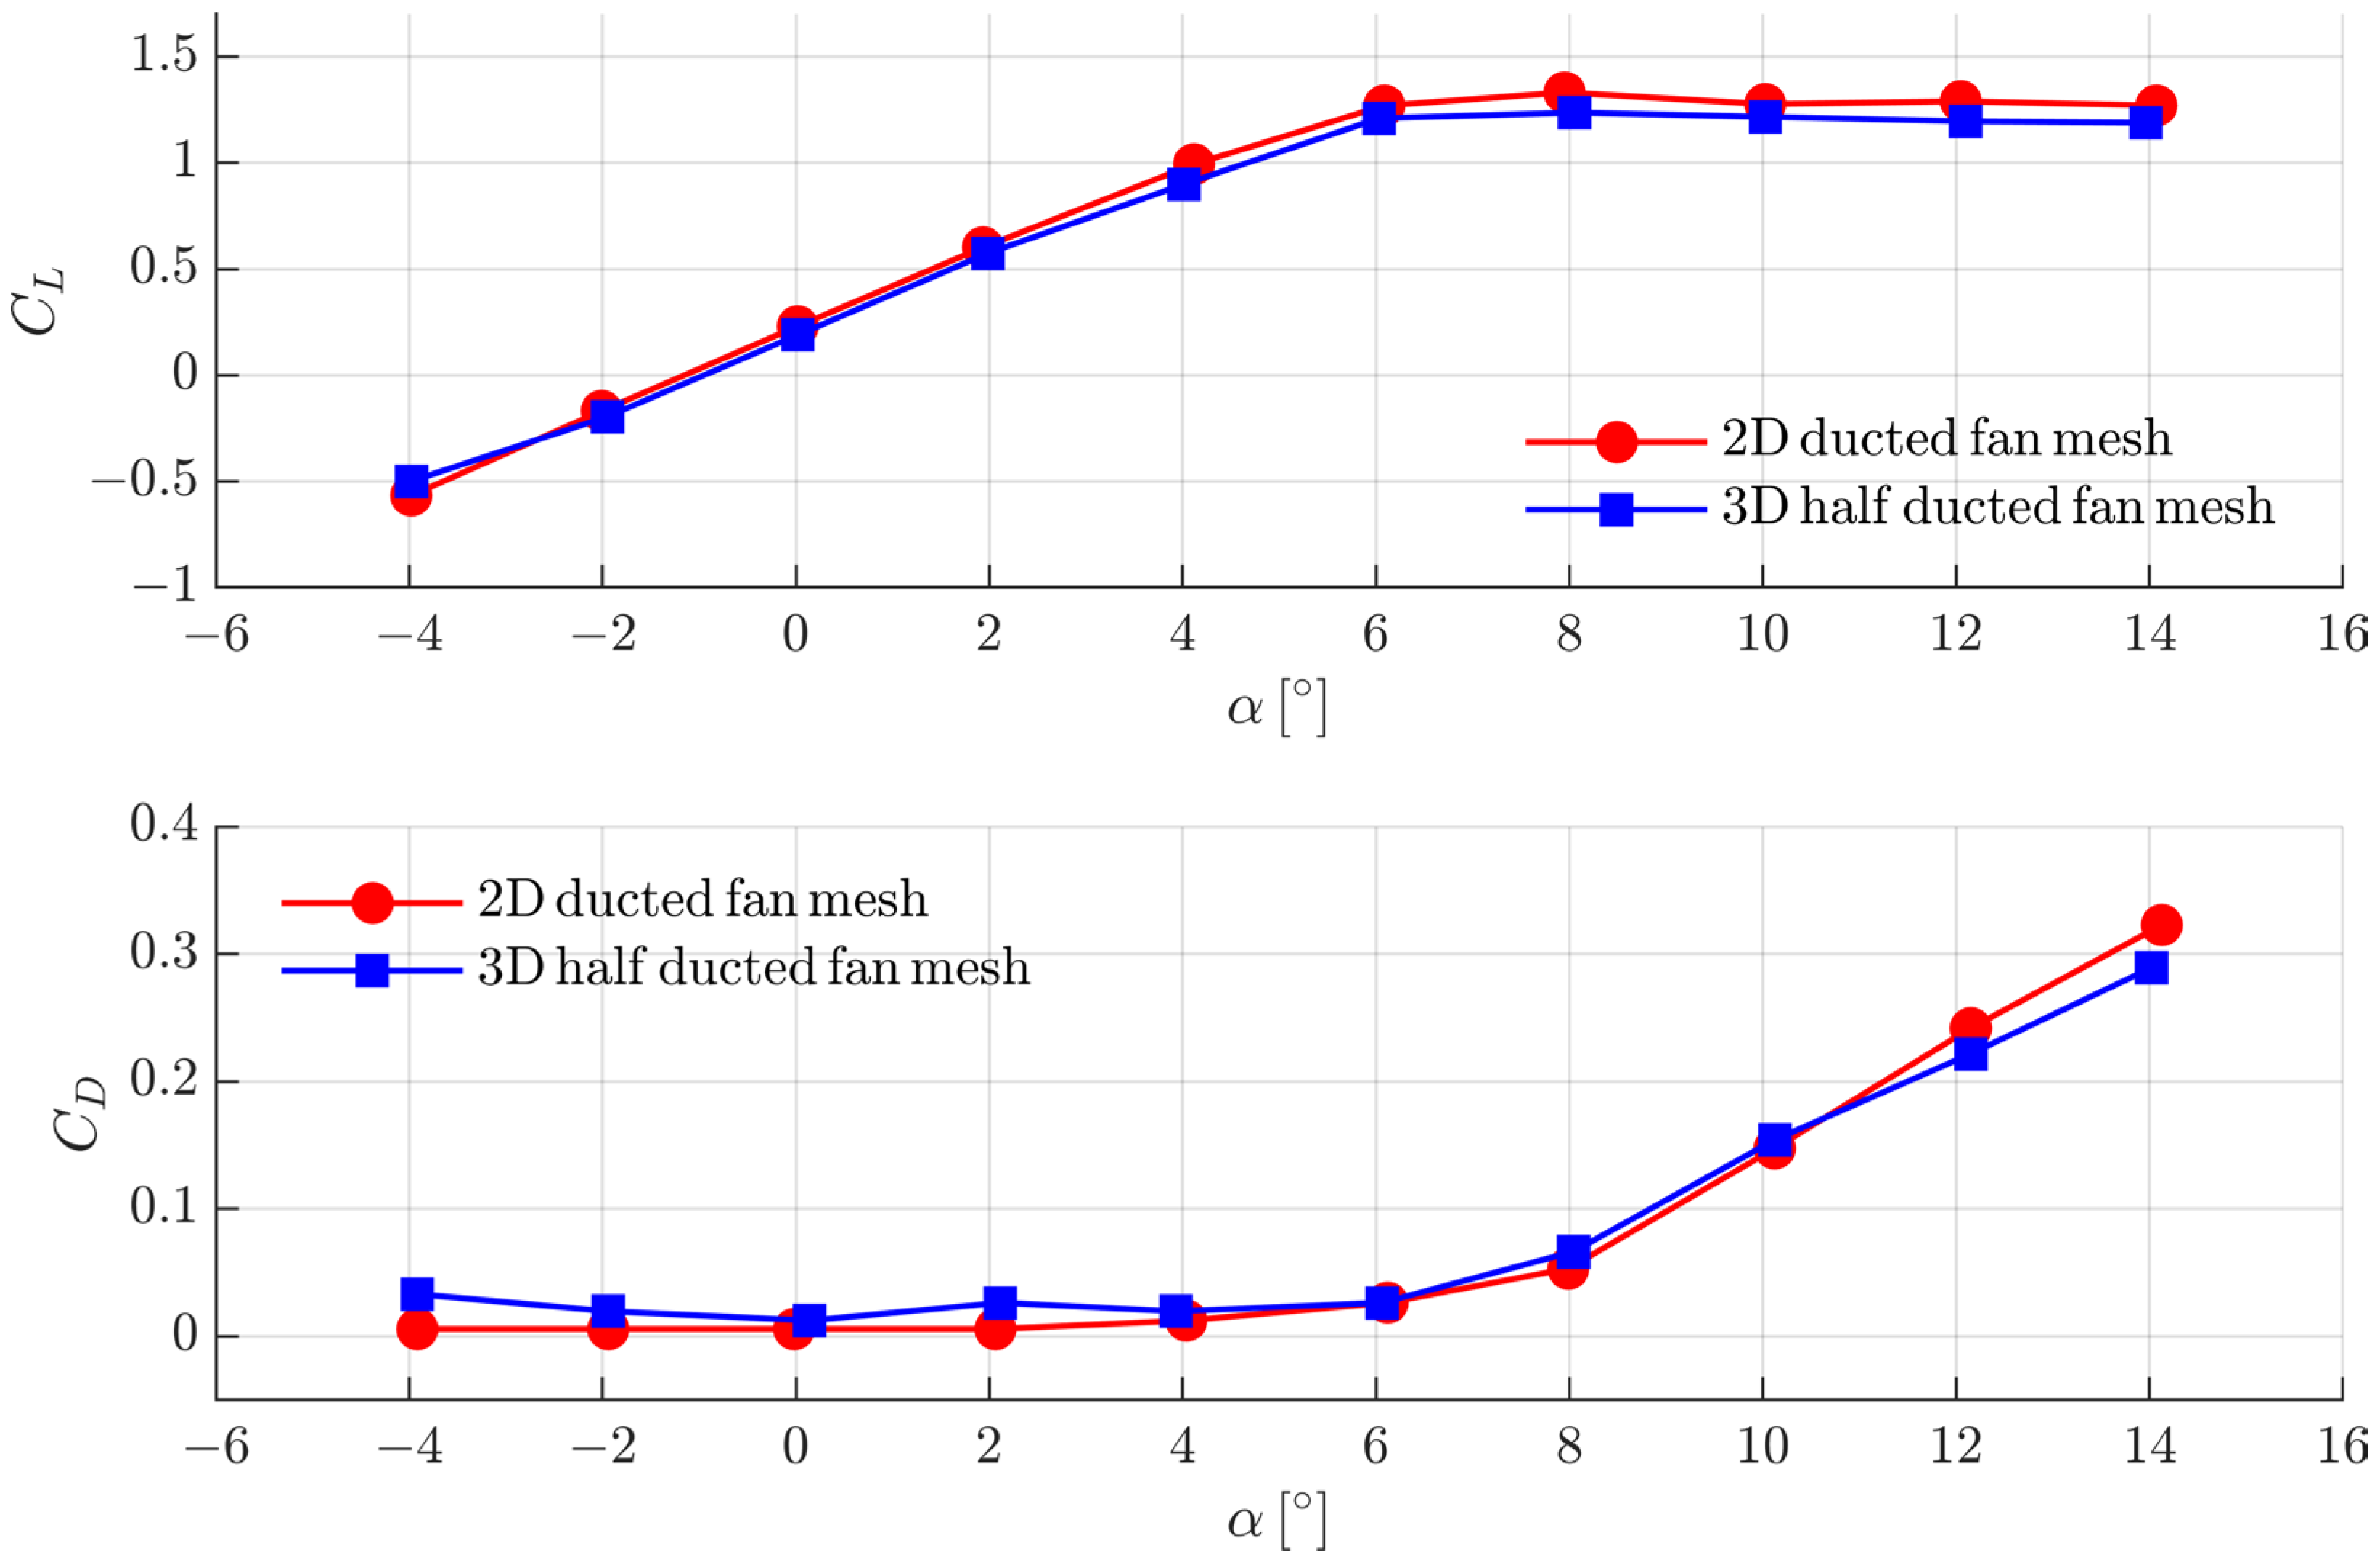
Figure 20. The results comparison between the 2D and half 3D model is shown in Figure 21.
Despite the wall boundary being simplified, the aerodynamic characteristics of both wings affected by the airflow from far-field and slipstream induced by the ducted fan can still be simulated, and their aerodynamic characteristics agree well. The 2D simulation can be used to design the geometric parameters, including the airfoils, chord length, incidence angle, and the vertical distance between both wings, without the participation of an integral ducted fan. The internal and external flow features of DEP eVTOL aircraft in high-speed forward flight can be considered by involving 2D DFW unit characteristics on the vertical meridian plane.
The only minor difference between the dimensionless aerodynamic coefficients of the above two simulations also demonstrates the apparent span independence of these characteristics. The data consistency between the virtual momentum disc and the real blade proves the justices of the proposed LPE idea, that is, to represent the 2D aerodynamics of the DFW unit on a vertical meridian plane. Therefore, the LPE can provide accurate aerodynamic features for establishing a novel DEP eVTOL aircraft conceptual design approach.

4.2. Wind Tunnel Experiment for CFD Results Verification

To verify the accuracy of the CFD method and explore the potential aerodynamic advantages of DEP eVTOL configuration, the authors’ group carried out a wind tunnel test on a 1:10 scaled model without ducted fans. The adopted CFD simulation is also carried out under the same conditions. The models used in the wind tunnel experiment and CFD simulation are shown in Figure 22, and the results comparison of the simulation and experiment are shown in Figure 23.
From Figure 23 it can be perceived that a good coincidence of the two results is that they both demonstrated a blow AoA of 6°. In the whole range of AoA, the lift coefficient difference is less than 10%. The drag coefficient in the wind tunnel experiment is larger than that of the CFD simulation, and the drag difference is less than 20% at AoA above 6°. Therefore, the accuracy of our study’s CFD simulation method can be proved.

4.3. Application on a DEP eVTOL Conceptual Design

The establishment of the DEP eVTOL aircraft conceptual design approach based on the 2D simulation results of the LPE can effectively solve the question of tight coupling and inefficient iteration when using the traditional method.
According to the existing aircraft performance and applications of high-speed VSTOL, the performance requirement of the DEP eVTOL aircraft is proposed, as shown in Table 9.
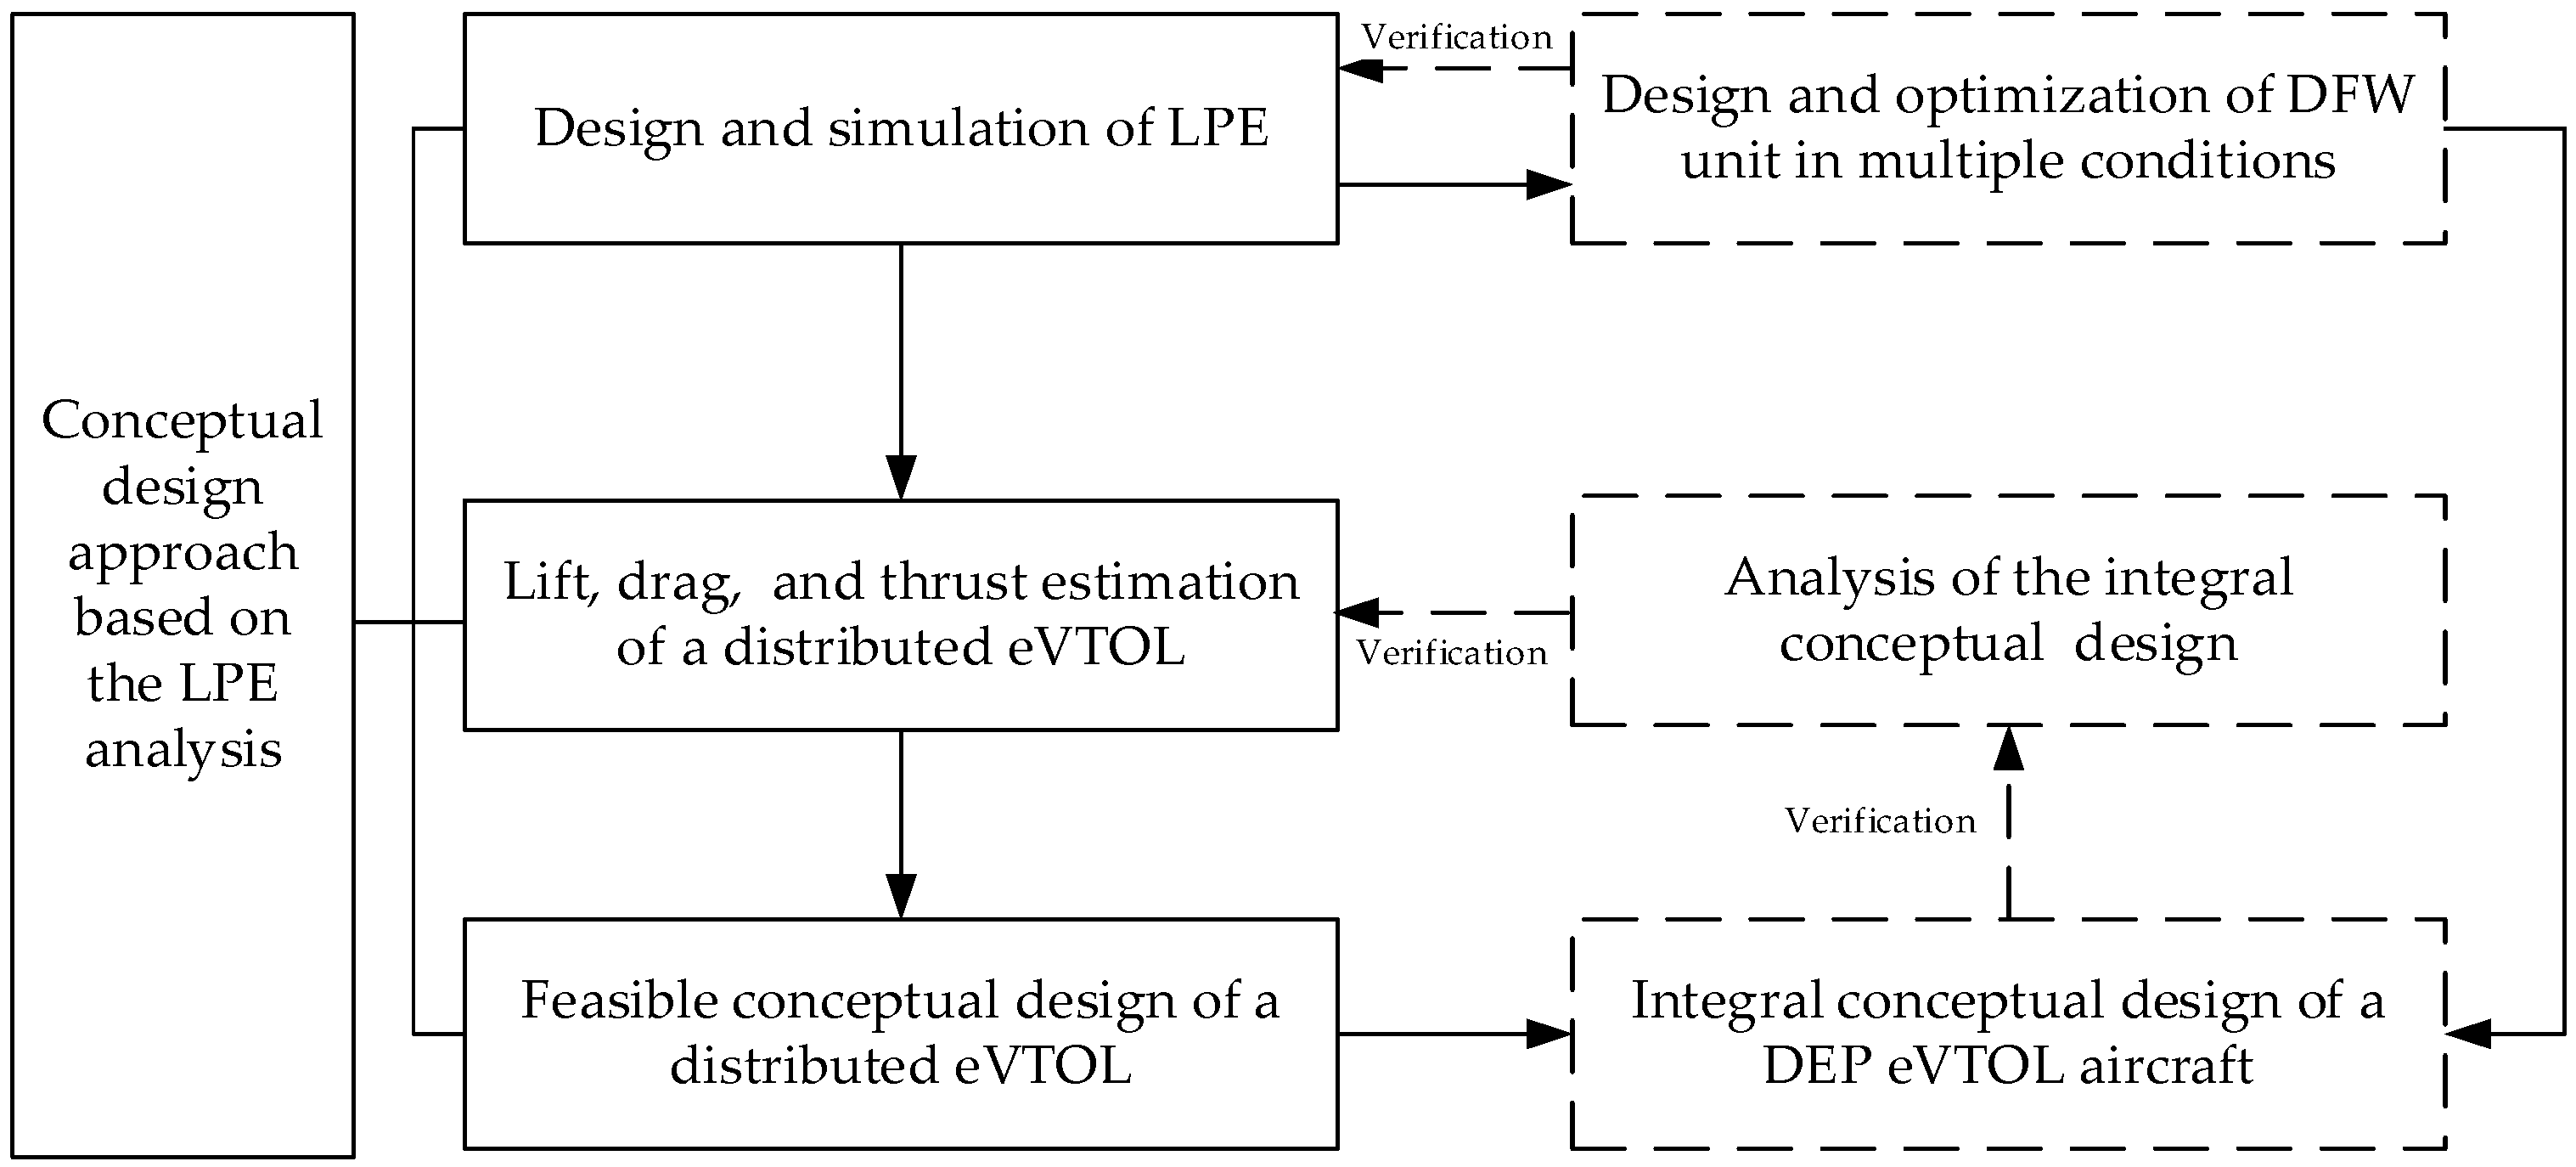
The design process of the LPE includes the selection of two airfoils, the incidence angles, and the vertical distance. The aerodynamic performance of various planes can be obtained efficiently, which effectively benefits the rapid trade-off of the DEP eVTOL aircraft conceptual design. The flow chart of the investigation of the novel conceptual design approach is drawn in Figure 24.
The advantages of the DEP eVTOL are mainly in the high hover efficiency and high cruise aerodynamic efficiency. The ducted fans equipped can maintain a high-power loading of the system. The span length of the wing is unutilized to arrange sufficient disc area, which benefits the disc loading of the eVTOL in a reasonable range to guarantee the propulsion efficiency of the ducted fan.
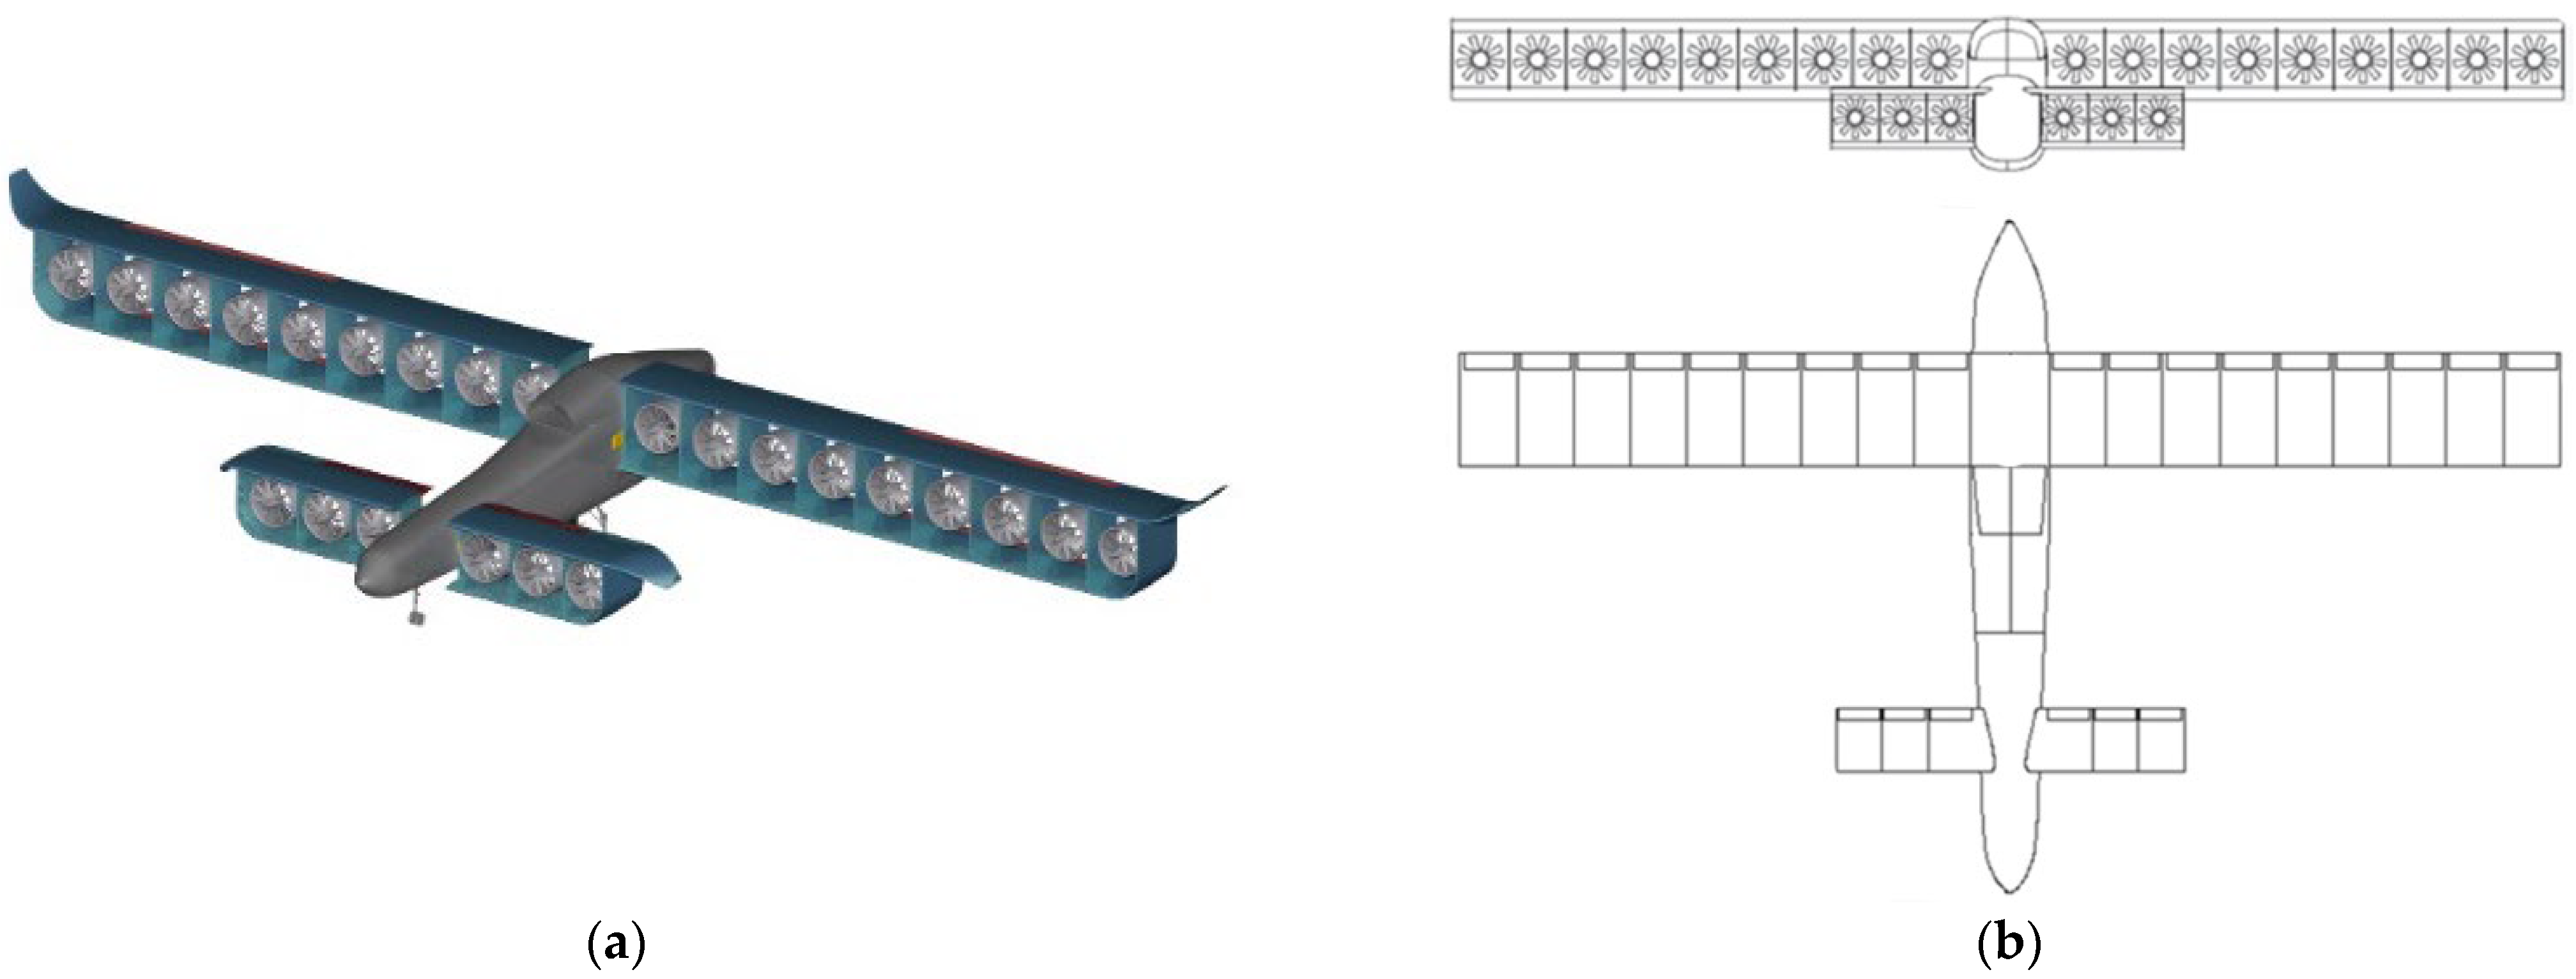
For the canard configuration in this study, the minor trim cost resulting from features of positive canard lift also helps to ensure a high lift-to-drag ratio. Based on the exploration of the DEP system, the canard configuration, and the DFW unit optimization, the obtained DEP eVTOL aircraft satisfies the high-performance requirement. The wing area and aspect ratio are determined according to the above coefficient estimation and weight sizing. The wing area and the number of DFW units of the canard and main wings are considered comprehensively base on the position of the thrust center, gravity center, and aerodynamic center. The spanwise 18 DFW units eventually construct the main wing, and the canard wing consists of 6 DFW units spanwise.
In this study, the design requirement of the conceptual design includes: the maximum flight speed exceeding 700 km/h; the maximum hover efficiency exceeding 75%; the lift-to-drag ratio in cruise is larger than 10; the proportion of the fuel and payload shall not be less than 40% of take-off weight; and that of payload shall not be less than 15%.
The regressive approach of weight proportion is used to calculate the ecoefficiency of fuel weight, payload weight, and empty weight. The fuel weight is obtained based on the fuel coefficient in eight phases of the mission profile. Some important inputs of the estimation include:
In the climbing phase: the climbing height is 10 km; the climb rate is 13.3 m/s; the lift-to-drag ratio is 8; propulsion efficiency is 0.65; the fuel consumption is 0.28 kg/(kW·h).
In the cruising phase: the flight range is 3200 km; the lift-to-drag ratio is 10; propulsion efficiency is 0.85; fuel consumption is 0.28 kg/(kW·h).
The proportion of fuel weight to take-off weight is calculated as 0.2993. The fuel weight of 1800 kg and take-off weight of 6000 kg can be obtained through an iteration.
The geometric parameters and weight of the conceptual design are determined according to the lift, drag, and thrust coefficients of the DFW units, as shown in Table 10. The conceptual design of the DEP eVTOL is presented in Figure 25.
The above 2D plane aerodynamic data is applied to analyze its corresponding DEP eVTOL aircraft. The aerodynamic estimation of the conceptual design based on the data in Figure 21 is estimated as follows.
The aerodynamic estimation of the conceptual design is from [26]. In Figure 21, the slope of the lift coefficient curve is 0.1783, and the intercept is 0.1585. The wing’s incidence angle is set to 1° to maintain the lift coefficient in the cruise. The lift coefficient of the wing is:
C L wing = 0.1783 ( α + 1 ) + 0.1585
The canard lift coefficient is converted into part of the whole aircraft according to its area and aerodynamic efficiency. The incidence angle of the canard is set to 2.3° to trim the aircraft at a positive angle. The lift coefficient of the canard is:
C L canard = 0.033 ( α + 2.3 ) + 0.0292
The lift coefficient equation of the eVTOL is:
C L = C L wing + C L canard = 0.2113 α + 0.4419
In Figure 21, the zero-lift-drag coefficient of the wing is 0.02, and that of the canard is 0.0037, using the same constant transformation as lift. According to the empirical formula, the zero-lift-drag coefficient is C D 0 fuselage = 0.0101 L fuselage / D fuselage = 0.0069 . Amplify 1.1 times for considering interference drag. The zero-lift-drag coefficient of the eVTOL is:
C D 0 = 1.1 ( C D 0 fuselage + C D 0 wing + C D 0 canard ) = 0.035
The induced drag of the eVTOL is:
C D i = k C L 2 + k ( C L C L 2 D α ) 2
In the equation, k = 1.1 / π A e = 0.0382 , k = 0.0132 and C L 2 D α = 0.191 .
The drag coefficient equation of the eVTOL is:
C D = C D 0 + C D i = 0 . 035 + 0.0382 C L 2 + 0.0132 ( C L 0.191 ) 2
The gravity center of the eVTOL is 5 m after the foremost point of the fuselage. In cruise mode, the thrust line of the canard is through the gravity center, so the pitching moment generated by the wing thrust is C M thrust = 0.0207 . The pitching moment produced by lift can be obtained from its distribution, which is C M wing = 0.1043 α 0.197 and C M canard = 0.073 α + 0.2323 . The pitching moment of the fuselage is obtained by Surface Panel Method, which is C M fuselage = 0.005 α 0.016 .
The pitching-moment coefficient equation of the eVTOL is:
C M = C M wing + C M canard + C M fuselage + C M thrust = 0.0263 α 0.0014
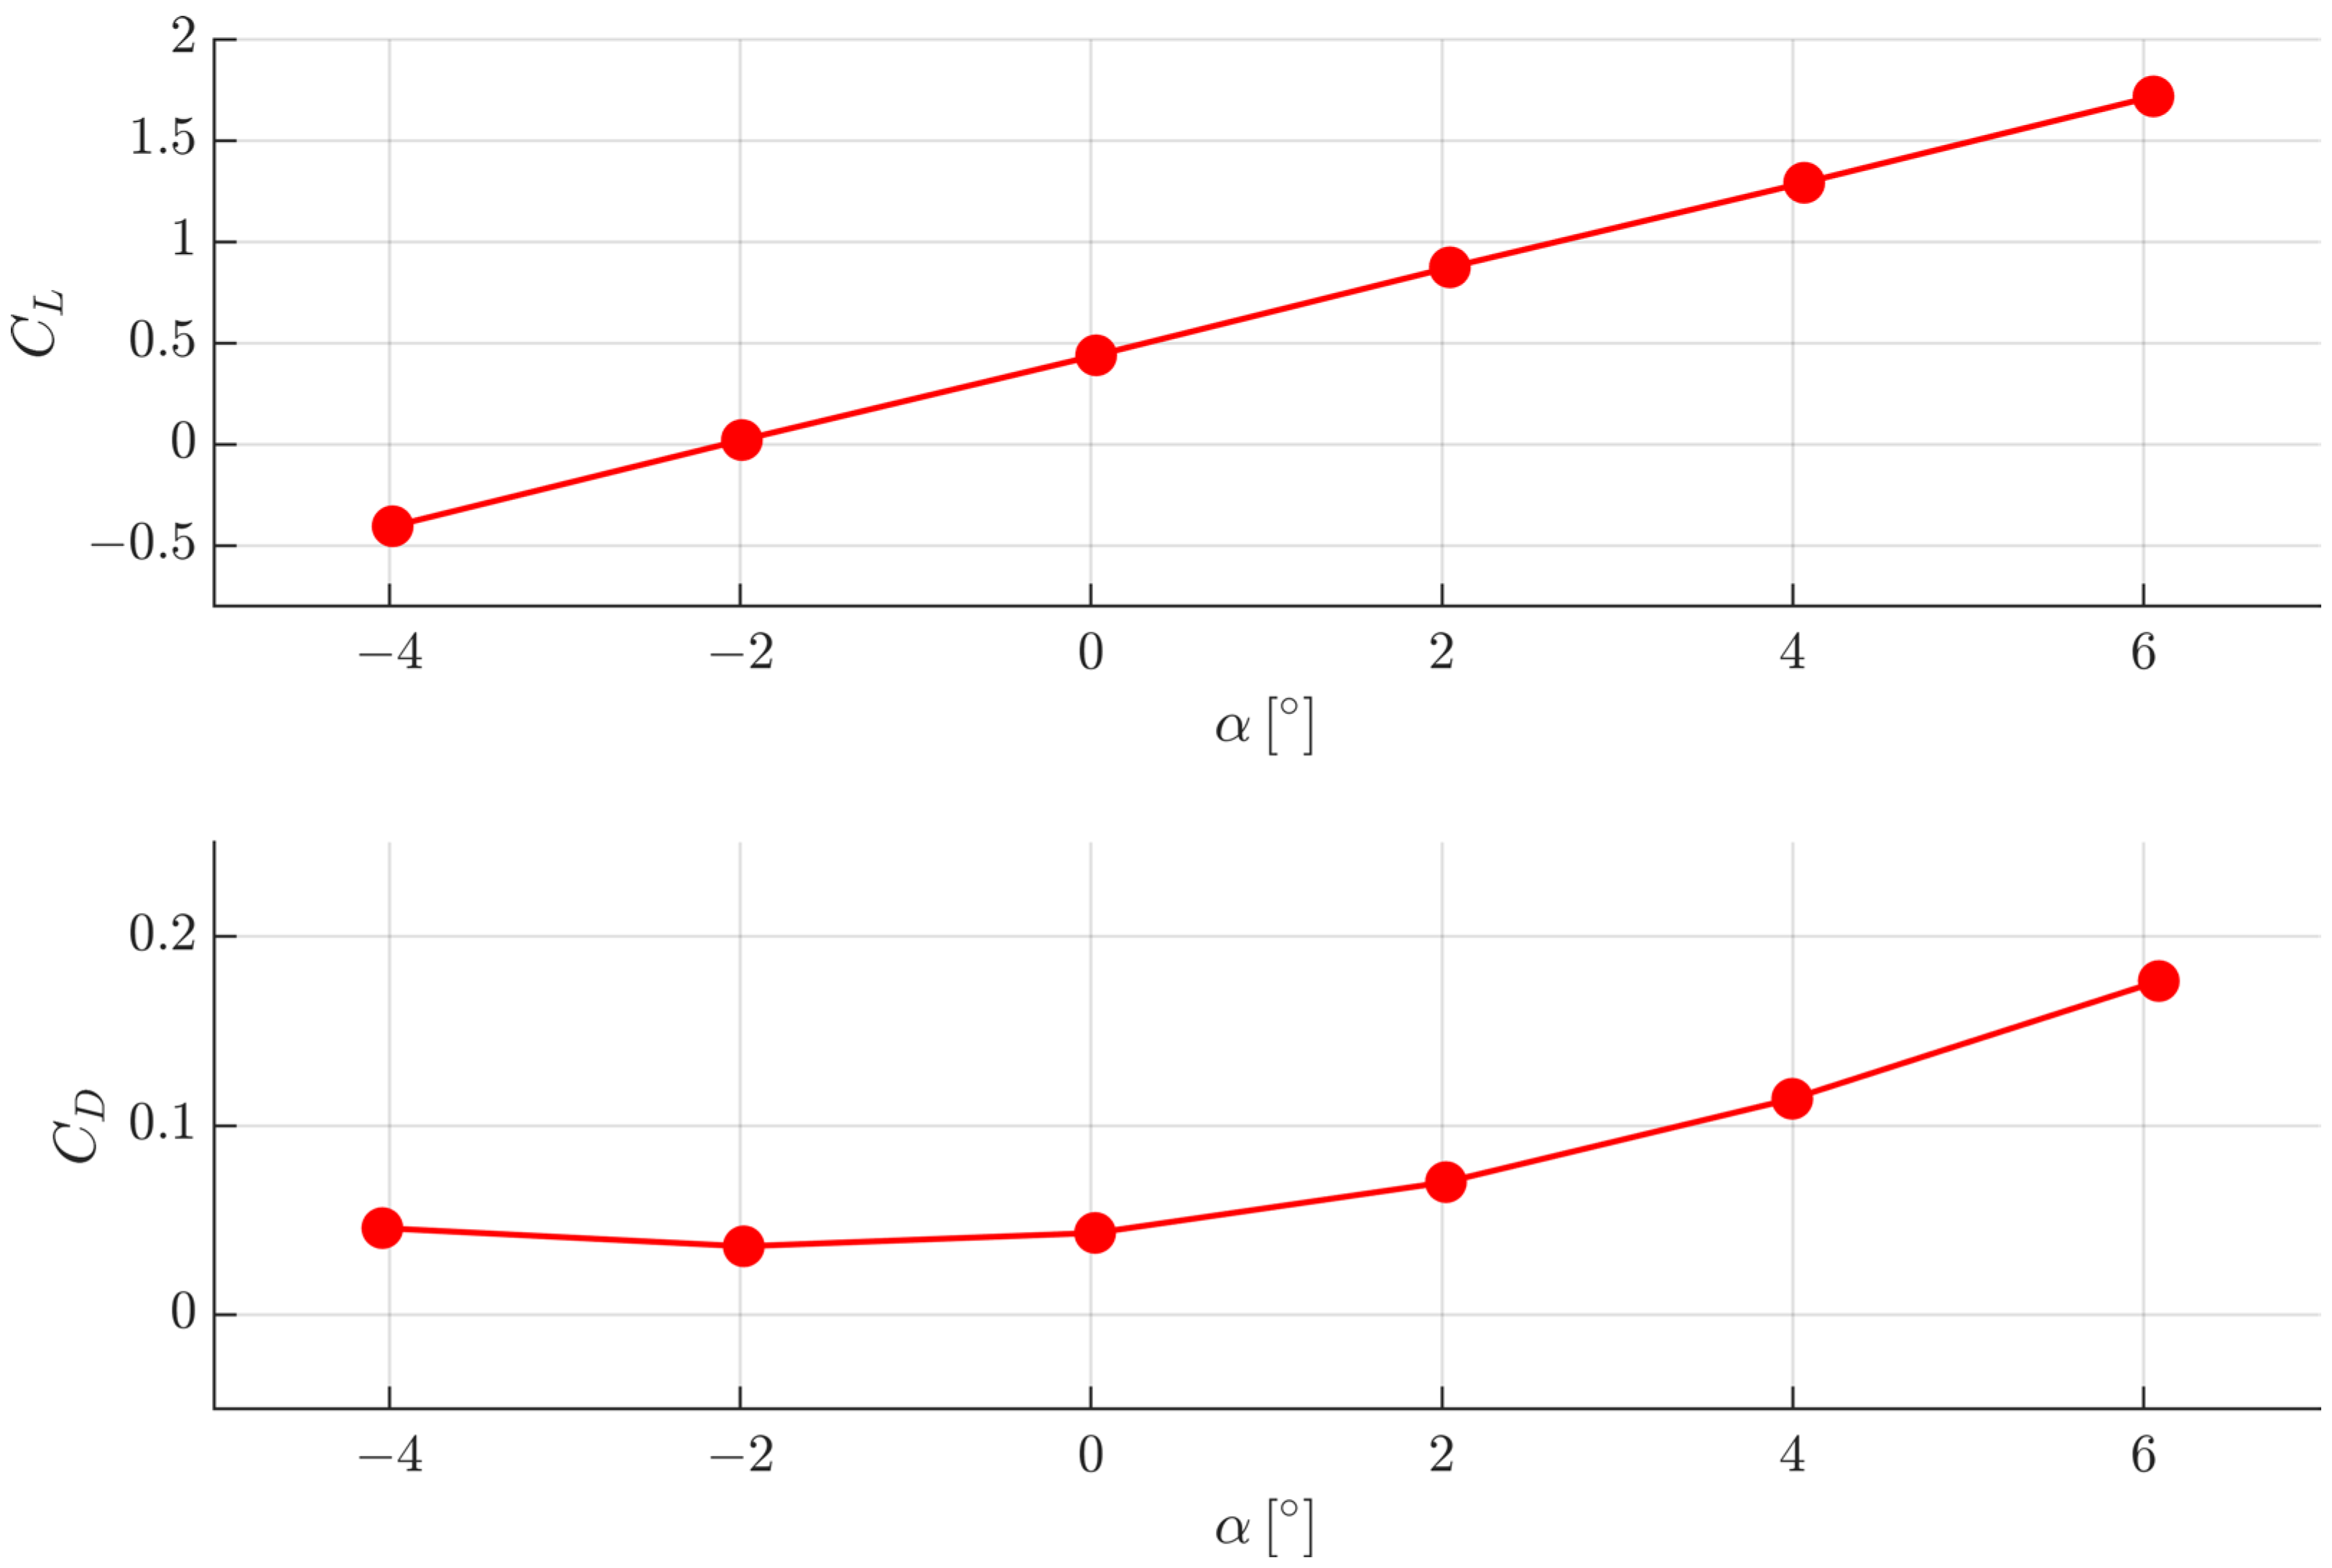
The curves of estimated aerodynamic characteristics are shown in Figure 26.
The cruise lift coefficient is achieved near the zero AoA, where the lift-to-drag ratio reaches 10.21. The pitching moment coefficient is −0.014, near the trim point. Hence, in the conceptual design, according to the aerodynamic and propulsion characteristics, the minimum, cruise, and maximum airspeed can be calculated as shown in Table 11, regardless of the DFW unit arrangement.
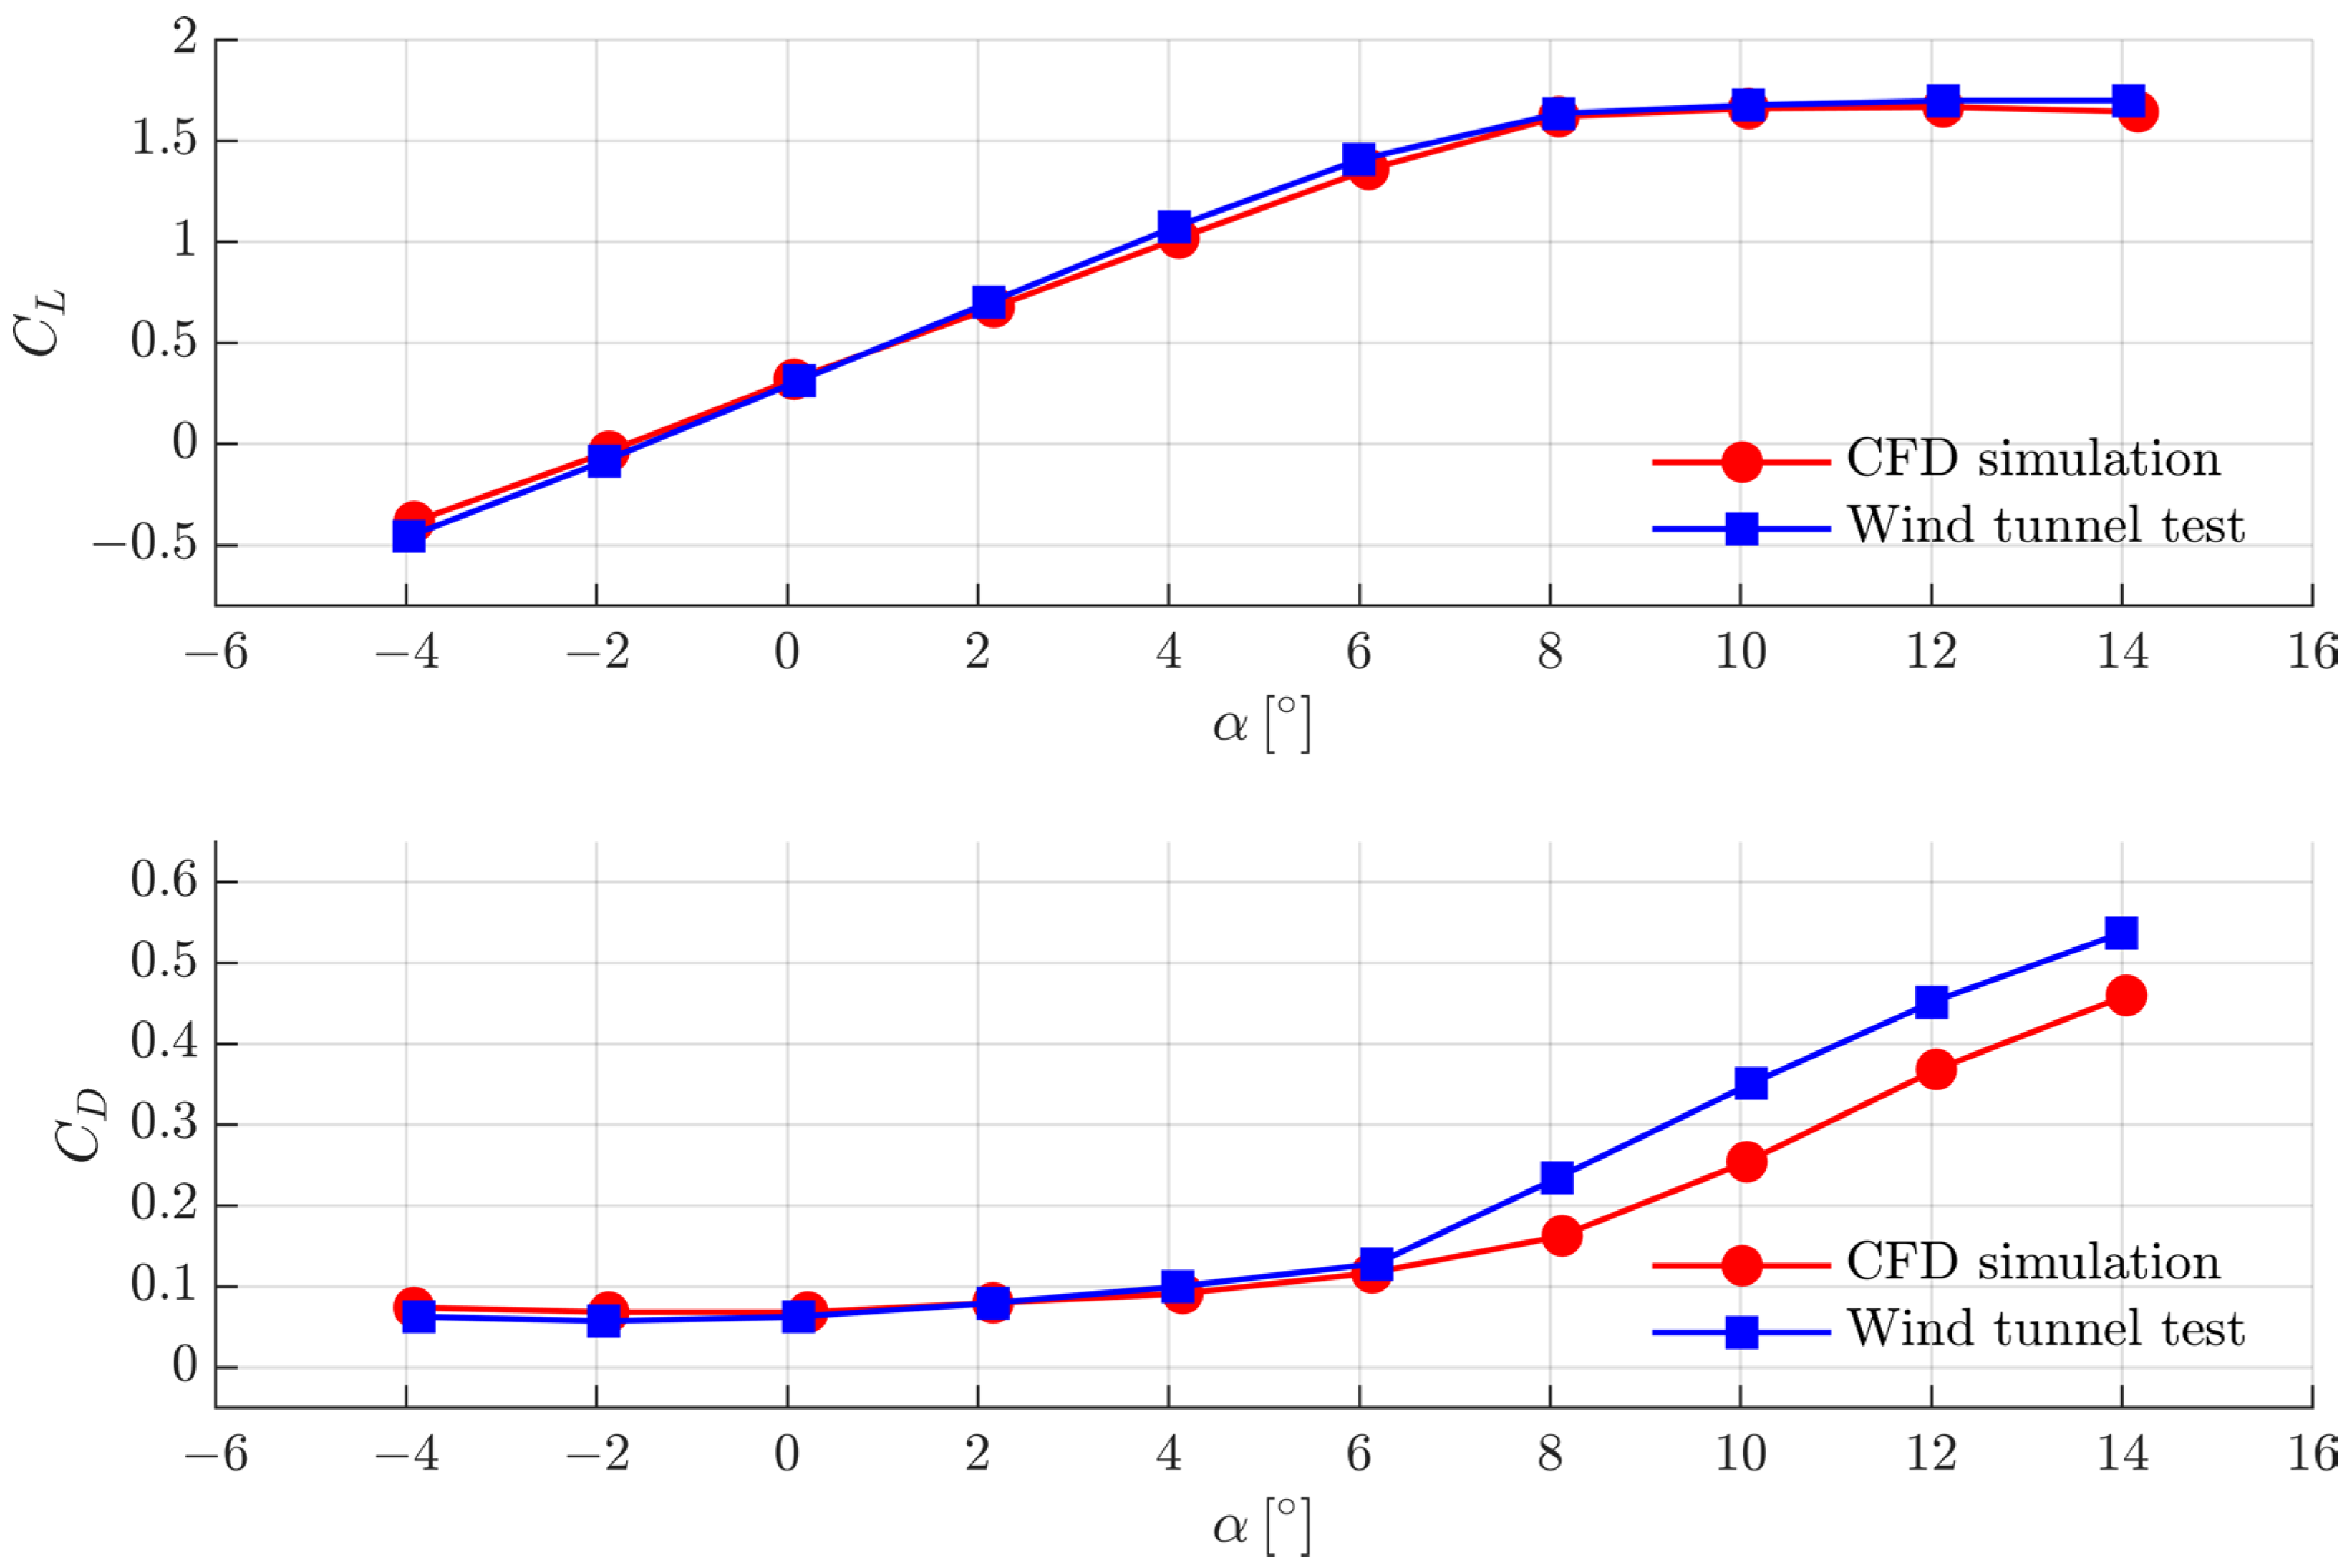
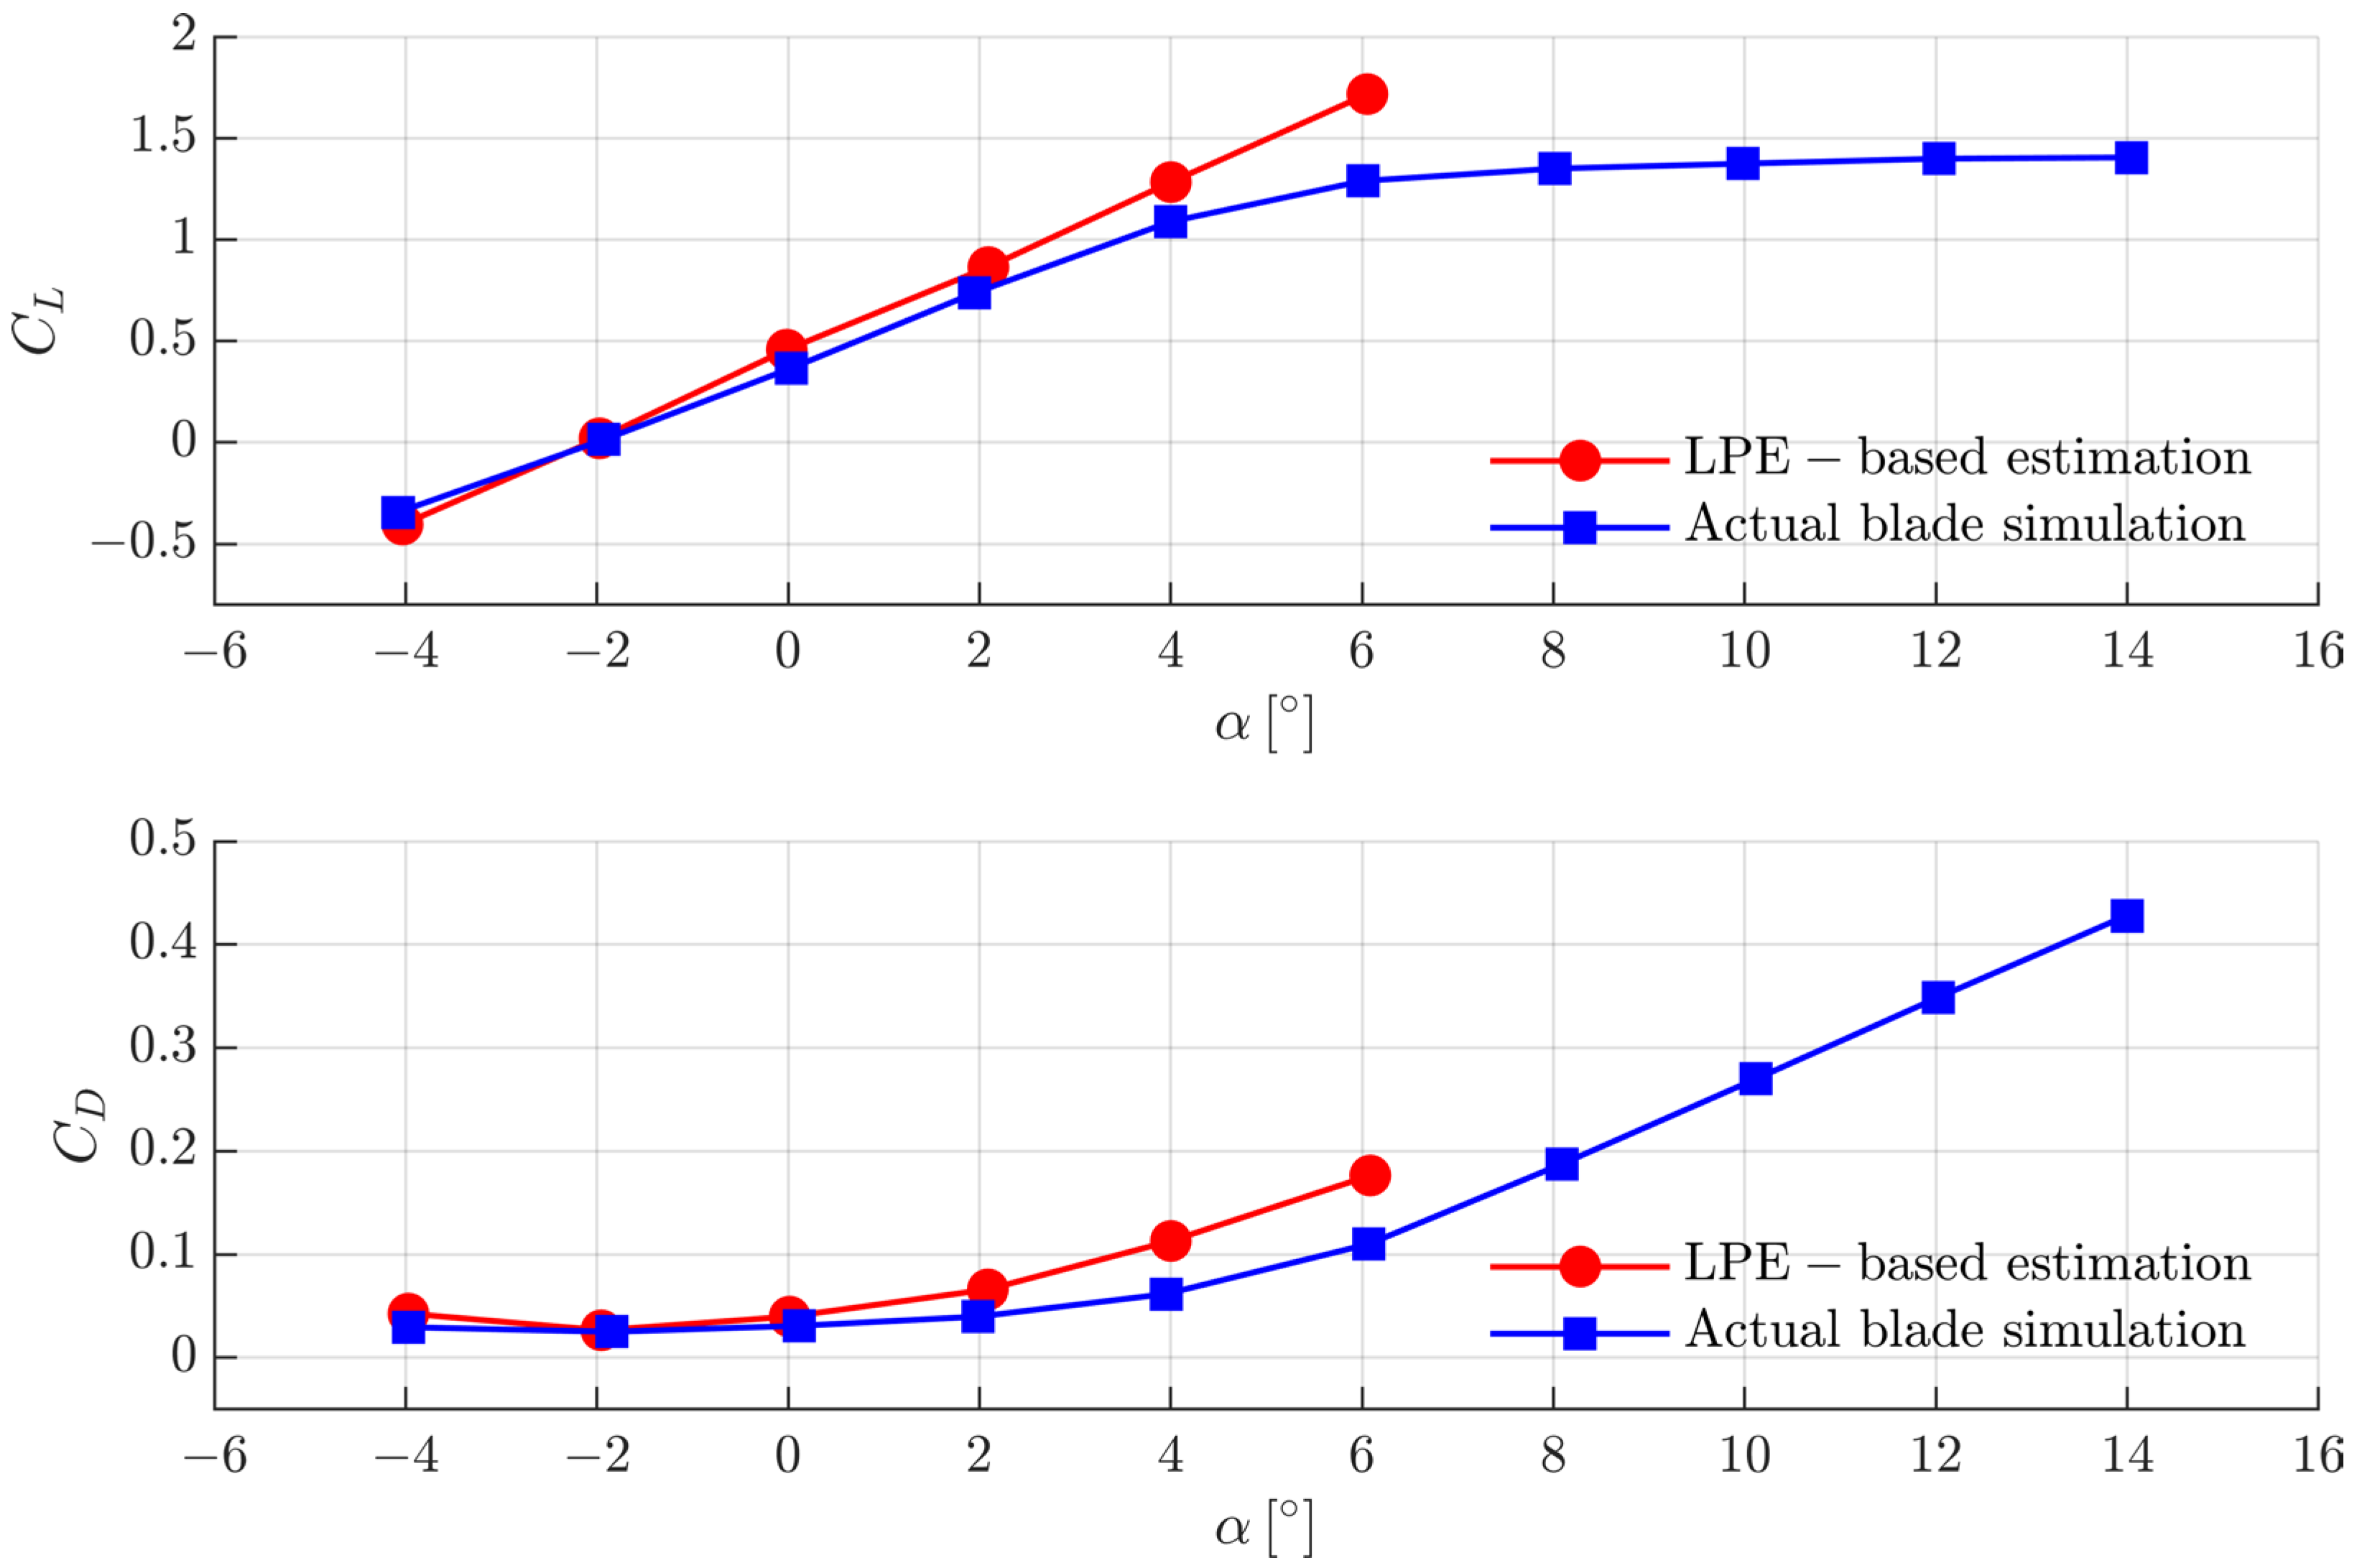
The total estimated lift-and-drag coefficients after the conceptual design are compared to the CFD simulation results, which involve the actual blade model. As shown in Figure 27, the difference between the estimation and CFD simulation results in the linear-lift AoA region (below 5 deg) is reasonably acceptable (the relative errors within 13%). Therefore, the lift-and-drag estimation from the LPE can strongly support the subsequent conceptual design process while ensuring much less calculation effort. In this study, the conceptual design, based on the LPE estimation, meets the design requirements quite well. As a result, additional design modifications in the detailed design phase can be exempt.

5. Conclusions

This study proposes the idea of the ducted fan wing (DFW) unit for the distributed electric power (DEP) eVTOL aircraft by analyzing the tight lift, drag, and thrust coupling in conceptual design. First, the optimization method of DFW units under hovering and cruise conditions is established. After the optimized design of the integral DFW unit is obtained, a novel DEP eVTOL aircraft conceptual design workflow is proposed and discussed. The critical step is to project the aerodynamic and propulsion characteristics of the DFW unit to the vertical meridional plane and regard it as a lift-propulsion element (LPE). By doing so, the DEP eVTOL aircraft conceptual design process can be remarkably decoupled and simplified. Moreover, the obtained canard DEP eVTOL aircraft design exhibits high efficiency in both hovering and cruising. The knowledge learned from the study can be summarized as follows.
  • For the DFW unit optimization process in multiple flight conditions, the fan blade optimization aiming at hovering efficiency should be focused on first. A multi-level blade optimization workflow is established, remarkably promoting design and optimization efficiency. It involves the Betz theory of optimal circulation for initial blade design, the strip theory for rapid blade performance analysis, the MIGA for global optimization, and the NLPQL for local optimization. A significant improvement is achieved in sensitivity analysis on the duct wall section shape, which is necessary to form an integral ducted fan design. The full-scale optimized ducted fan experiment can also demonstrate the effectiveness and accuracy of the optimization results.
  • The aerodynamic efficiency in high-speed cruise is pursued in optimizing the DFW unit, which consists of a ducted fan and its surrounding wings. The sensitivity analysis reveals the trend of the flow field, internal and external of the DFW unit with the relative position variation of the ducted fan and wings. The thrust and power constraints can be met by reducing the interference drag. Eventually, a practical method for promoting DFW unit aerodynamic performance is presented.
  • The comparison of the integral DFW unit and its coefficients on the vertical meridional plane demonstrates the spanwise aerodynamics independence of the lift, drag, and thrust characteristics. Therefore, the DFW unit aerodynamics can be regarded as the 2D LPE, and a conceptual design is conducted based on the LPE aerodynamics estimation. The aerodynamics from the complete simulation meets the conceptual result well, and the flight performance meets the requirement at a maximum speed of 720 km/h, a hover efficiency of 76.3%, and a cruise lift-to-drag ratio of 10.7.
The tight coupling of aerodynamics and propulsion and multiple flight conditions requirement can complicate the trade-off in the DEP eVTOL aircraft conceptual design. In light of this, the rapid iteration without additional aerodynamics or propulsion calculation is a critical issue for the efficient design workflow. The proposed routines enable the researchers to optimize the DFW involving the blade-wing aerodynamic interference, and form the LPE performance properties. Subsequently, a high-performance DEP eVTOL conceptual design can be generated, similar to conventional aircraft design.
One avenue for future work would be further refining the parametric optimization of the integral DFW unit. The influences of structures the ducted fan mounted between wings could be included in the scope, from which the potential to lift hovering and cruise efficiencies could be explored.

Author Contributions

Conceptualization, T.M. and X.W.; methodology, X.W. and J.F.; validation, N.Q., X.W. and Z.Z.; investigation, X.W. and Z.Z.; resources, T.M. and M.B.; data curation, X.W. and N.Q.; writing—original draft preparation, T.M., X.W. and N.Q.; writing—review and editing, X.W., N.Q. and J.F. All authors have read and agreed to the published version of the manuscript.

Funding

This research received no external funding.

Institutional Review Board Statement

Not applicable.

Informed Consent Statement

Not applicable.

Data Availability Statement

The data presented in this study are available on request from the 447 corresponding author.

Conflicts of Interest

The authors declare no conflict of interest.

Nomenclature

DEP eVTOLDistributed electric propulsion electrical vertical take-off and landing aircraft
DFW Ducted-fan wing
LPELift-propulsion element
α (AoA)Angle of attack
n s Rotational speed of the fan discs
r Value of position in blade radius
R Blade radius
Γ Circulation function
T Thrust
M Moment
P Power consumption
P L Power loading ( = P / π R 2 )
ρ Air density
D Blade diameter
C T Thrust coefficient ( = T / ρ n s 2 D 4 )
C P Power coefficient ( = P / ρ n s 3 D 5 )
η Hover efficiency ( = 2 / π C T 1.5 C P )
f ( r ) Function of the effective AoA distribution of the blade elements
a 1 a 5 Design variables
r d Radius of the duct lip
d t i p Blade tip clearance
D d Inner diameter of the duct wall
L Height of the duct
h Distance between the fan disc and the duct lip
β Diffusion angle of duct inner wall
a Vertical distance between the upper wing and ducted fan
b Lateral distance between wing and ducted fan
c Forward distance between wing and ducted fan
A Wing area
C L Lift coefficient
C L wing Lift coefficient of wing
C L canard Lift coefficient of canard
C D Drag coefficient
C p Pressure coefficient
C D 0 Zero-lift-drag coefficient
C D 0 fuselage Zero-lift-drag coefficient of fuselage
L fuselage Length of the fuselage
D fuselage Diameter of the fuselage
C D 0 wing Zero-lift-drag coefficient of wing
C D 0 canard Zero-lift-drag coefficient of canard
k Constant ( = 1.1 / π A e )
k Viscous drag coefficient of airfoil
C L 2 D α Lift slope of airfoil
C D i Induced drag coefficient
C M Pitching moment coefficient
C M wing Pitching moment coefficient of wing
C M canard Pitching moment coefficient of canard
C M fuselage Pitching moment coefficient of fuselage
C M thrust Pitching moment coefficient of thrust

References

  1. Raymer, D.P. Aircraft Design: A Conceptual Approach; AIAA Education Series; American Institute of Aeronautics and Astronautics, Inc.: Reston, VA, USA, 2018; pp. 763–804. [Google Scholar]
  2. Xiao, S.; Qiao, H.; Xu, G.; Luo, G.; Ma, C.; Guo, Z.; Zhang, D. Optimized Matching Lift Unit Transmission Ratio of Engine Driven Ducted Fan. In Proceedings of the MATEC Web of Conferences, Singapore, 24–26 February 2018; EDP Sciences: Singapore, 2018. [Google Scholar]
  3. Huang, J. Survey on design technology of distributed electric propulsion aircraft. Chin. J. Aeronaut. 2021, 42, 13–29. [Google Scholar]
  4. Kong, X. Review of Electric Power System of Distributed Electric Propulsion Aircraft. Chin. J. Aeronaut. 2018, 39, 51–67. [Google Scholar]
  5. Nalianda, D.; Singh, R. Turbo-Electric Distributed Propulsion—Opportunities, Benefits and Challenges. Aircr. Eng. Aerosp. Technol. Int. J. 2014, 86, 543–549. [Google Scholar] [CrossRef]
  6. Johnson, W. Helicopter Theory; Courier Corporation: Chelmsford, MA, USA, 2012; pp. 149–179. [Google Scholar]
  7. An, J.-H.; Kwon, D.-Y.; Jeon, K.-S.; Tyan, M.; Lee, J.-W. Advanced Sizing Methodology for a Multi-Mode EVTOL UAV Powered by a Hydrogen Fuel Cell and Battery. Aerospace 2022, 9, 71. [Google Scholar] [CrossRef]
  8. Moore, M.D. Misconceptions of Electric Aircraft and Their Emerging Aviation Markets. In 52nd Aerospace Sciences Meeting; AIAA SciTech Forum; American Institute of Aeronautics and Astronautics: National Harbor, MD, USA, 2014. [Google Scholar]
  9. Hoover, C.B.; Shen, J. Parametric Study of Propeller Whirl Flutter Stability with Full-Span Model of X-57 Maxwell Aircraft. J. Aircr. 2018, 55, 2530–2537. [Google Scholar] [CrossRef]
  10. Dubois, A.; van der Geest, M.; Bevirt, J.; Christie, R.; Borer, N.K.; Clarke, S.C. Design of an Electric Propulsion System for SCEPTOR’s Outboard Nacelle. In Proceedings of the 16th AIAA Aviation Technology, Integration, and Operations Conference, Washington, DC, USA, 13 June 2016. [Google Scholar]
  11. X-Plane May Impact Future Vertical Lift Program. Available online: https://www.nationaldefensemagazine.org/articles/2016/5/1/2016may-xplane-may-impact-future-vertical-lift-program (accessed on 25 August 2022).
  12. DARPA Announces VTOL X-Plane Phase 2 Design. Available online: https://www.darpa.mil/news-events/2016-03-03 (accessed on 25 August 2022).
  13. Zhang, Y.; Li, H. American “Lighting Strike” VTOL Test Aircraft. Ordnance Knowl. 2016, 8, 36–39. [Google Scholar] [CrossRef]
  14. Bacchini, A.; Cestino, E. Electric VTOL Configurations Comparison. Aerospace 2019, 6, 26. [Google Scholar] [CrossRef] [Green Version]
  15. Zhang, Z.; Ma, T.; Hao, S.; Wang, Z.; Liu, Y. Design of A Distributed Propulsion VTOL UAV. In Proceedings of the 2019 IEEE International Conference on Unmanned Systems (ICUS), Beijing, China, 17–19 October 2019; pp. 84–89. [Google Scholar]
  16. Guo, J.; Zhou, Z. Multi-Objective Design of a Distributed Ducted Fan System. Aerospace 2022, 9, 165. [Google Scholar] [CrossRef]
  17. Lee, K.-H.; Jeon, Y.-H.; Kim, K.-H.; Lee, D.-H.; Lee, K.-T. Three-Dimensional Micro Propeller Design by Using Efficient Two Step Optimization. Sci. Technol. 2007, 2, 12. [Google Scholar] [CrossRef] [Green Version]
  18. Liu, Y.; Li, L.; Li, H.; Hu, H. An Experimental Study of Surface Wettability Effects on Dynamic Ice Accretion Process over an UAS Propeller Model. Aerosp. Sci. Technol. 2018, 73, 164–172. [Google Scholar] [CrossRef]
  19. Korkan, K.; Gregorek, G.; Mikkelson, D. A Theoretical and Experimental Investigation of Propeller Performance Methodologies. In Proceedings of the 16th Joint Propulsion Conference, Hartford, CT, USA, 30 June–2 July 1980; p. 1240. [Google Scholar]
  20. Gill, P.E.; Wong, E. Sequential Quadratic Programming Methods. In Mixed Integer Non-Linear Programming; Springer: Berlin/Heidelberg, Germany, 2012; pp. 147–224. [Google Scholar]
  21. Xu, H.Y.; Xing, S.L.; Ye, Z.Y. Numerical Study of Ducted-Fan Lip Stall Suppression Based on Inflatable Leading Lip Cell. Procedia Eng. 2015, 126, 158–162. [Google Scholar] [CrossRef] [Green Version]
  22. Yilmaz, S.; Erdem, D.; Kavsaoglu, M. Effects of Duct Shape on a Ducted Propeller Performance. In Proceedings of the 51st AIAA Aerospace Sciences Meeting including the New Horizons Forum and Aerospace Exposition, Grapevine, TX, USA, 7 January 2013. [Google Scholar]
  23. Yilmaz, S.; Erdem, D.; Kavsaoglu, M.S. Performance of a Ducted Propeller Designed for UAV Applications at Zero Angle of Attack Flight: An Experimental Study. Aerosp. Sci. Technol. 2015, 45, 376–386. [Google Scholar] [CrossRef]
  24. Bontempo, R.; Manna, M. Effects of Duct Cross Section Camber and Thickness on the Performance of Ducted Propulsion Systems for Aeronautical Applications. Int. J. Aerosp. Eng. 2016, 2016, 8913901. [Google Scholar] [CrossRef]
  25. Roh, N.; Oh, S.; Park, D. Aerodynamic Characteristics of Helicopter with Ducted Fan Tail Rotor in Hover under Low-Speed Crosswind. Int. J. Aerosp. Eng. 2020, 2020, 7059209. [Google Scholar] [CrossRef]
  26. Aeronautical Aerodynamics Manual Editing Group. Aeronautical Aerodynamics Manual Volume II; National Defense Industry Press: Beijing, China, 1983. [Google Scholar]
Figure 1. Typical composition of DFW unit.
Aerospace 09 00690 g001
Figure 2. Flow chart of DFW unit optimization in multiple conditions.
Aerospace 09 00690 g002
Figure 3. Flow chart of the blade design process.
Aerospace 09 00690 g003
Figure 4. Optimal circulation distribution from Betz theory omitting blade element drags.
Aerospace 09 00690 g004
Figure 5. The profile parameters distributions of the two blades.
Aerospace 09 00690 g005
Figure 6. The mesh independence study of 1/10th of the fan disc containing a single blade.
Aerospace 09 00690 g006
Figure 7. The geometrical parameters of the optimized and initial blades.
Aerospace 09 00690 g007
Figure 8. The geometric parameters of the duct wall cross-section.
Aerospace 09 00690 g008
Figure 9. Four kinds of ducted fan lip shapes.
Aerospace 09 00690 g009
Figure 10. Schematics of the 2D-ducted fan CFD model.
Aerospace 09 00690 g010
Figure 11. Fan disc mesh model at 0.08 L axial position. (a) The surface mesh on the duct wall, fan blade, and stator blade. (b) The structure of multi-layer sliding mesh along the axial direction.
Aerospace 09 00690 g011
Figure 12. Static pressure distribution of the flow field near the ducted fan lip. (a) Axial position at 0.08 L; (b) axial position at 0.2 L.
Aerospace 09 00690 g012
Figure 13. A full-scale prototype of the optimized ducted fan.
Aerospace 09 00690 g013
Figure 14. Results comparison between the simulation and experiment.
Aerospace 09 00690 g014
Figure 15. The three geometric parameters (a, b and c) that determine the relative position between the ducted fan and wings.
Aerospace 09 00690 g015
Figure 16. Pressure contours at different axial positions. (a) Contour at c = 0. (b) Contour at c = −0.5 m.
Aerospace 09 00690 g016
Figure 17. Pressure contours at position of a = 0.4 m, b = 0.2 m, c = 0.2 m.
Aerospace 09 00690 g017
Figure 18. The mesh of half DFW unit simulation using the virtual disc with momentum sources.
Aerospace 09 00690 g018
Figure 19. The comparison between the DFW unit simulation using the real blade and virtual disc with momentum sources. (Upper) Lift coefficient comparison; (Lower) Drag coefficient comparison.
Aerospace 09 00690 g019
Figure 20. Mesh of the 2D meridian plane.
Aerospace 09 00690 g020
Figure 21. The results comparison between the 2D and half 3D model.
Aerospace 09 00690 g021
Figure 22. The 1:10 scale model without ducted fans to verify the CFD results. (a) Wind tunnel model; (b) CFD simulation model.
Aerospace 09 00690 g022
Figure 23. The results comparison of CFD simulation and experiment.
Aerospace 09 00690 g023
Figure 24. The flow chart of the investigation on the novel conceptual design approach.
Aerospace 09 00690 g024
Figure 25. The conceptual design of the DEP eVTOL aircraft. (a) The isometric view; (b) the front and the vertical views.
Aerospace 09 00690 g025
Figure 26. The curves of estimated aerodynamic characteristics.
Aerospace 09 00690 g026
Figure 27. The total lift-and-drag coefficients from the LPE-based estimation and the CFD simulation involving the actual blade model. (Upper) Lift coefficient comparison; (Lower) Drag coefficient comparison.
Aerospace 09 00690 g027
Table 1. Performance comparison of the two blades in hovering condition.
T [N]M [N·m]P [kW]PL [kg/kw] η
Blade 12543.7354.5259.90.9790.565
Blade 22505.5358.2262.50.9540.547
Table 2. Comparison of the results from the strip theory method and CFD simulation.
T [N]M [N·m]P [kW]PL [kg/kw] η
Strip theory2543354.5259.90.9790.565
CFD2479365.8268.10.9250.527
Table 3. The range of each factor in the AoA distribution equation.
Parameter Name a 1 a 2 a 3 a 4 a 5
Range[0, 1.5][−5, 0][0, 5][−2, 0][−0.03, 1]
Table 4. Geometric parameters of Blade 1.
Parameter NameValue
Blade radius0.315 m
Hub radius0.07 m
Blade airfoilARA-D
Blade chord (0.7 R)0.064 m
Pitch angle (0.7 R)27.4°
Num of blade10
Table 5. Performance comparison between the optimized blade and the initial blade.
T [N]M [N·m]P [kW]PL [kg/kw] η
Initial2543.7354.5259.90.9790.565
Optimized2533.7327.0239.71.060.609
Table 6. The thrust of different duct wall shapes.
rd/LThrust [N]
NACA00120.0149300
NACA44120.0157404
Modified lip0.0375580
Modified lip (1.25×)0.04691070
Modified lip (1.5×)0.05631170
Semicircle lip0.0625470
Table 7. Results comparisons of fan disc at 0.08 L and 0.2 L axial positions.
Duct Wall Thrust [N]Fan Disc Thrust [N]Fan Disc
Moment [N·m]
P [kw] η
0.08 L88916502641930.77
0.2 L30013002081520.49
Table 8. The thrust of optimized DFW unit in hovering and cruise conditions.
Duct Wall Thrust [N]Fan Disc Thrust [N]Fan Disc Power Consumption [kW]Stator Thrust [N]Total Thrust [N] η
Hovering condition8831616 1914925340.763
Cruise condition−239468171−8626
Table 9. The performance requirements of the distributed eVTOL.
Parameter NameValue
Maximum flight speed≥650 km/h
Hovering efficiency≥75%
Cruise lift-to-drag ratio≥8
Table 10. Salient parameters of the conceptual design.
ParameterValue
AircraftGross Weight6000 kg
Payload900 kg
Fuel Weight1800 kg
Length8.77 m
Height1.94 m
Width1.00 m
WingSpan18.55 m
Root chord1.03 m
Tip chord1.03 m
Aspect Ratio18.00
CanardSpan6.12 m
Root chord1.03 m
Tip chord1.03 m
Aspect Ratio5.94
Table 11. Lift-and-drag characteristics at various speeds.
Speed [km/h] C L AoA [°] C D Lift-to-Drag Ratio
300 (Minimum speed)1.550.14410.4
600 (Cruise speed)0.4800.044910.7
720 (Maximum speed)0.34−0.50.048.5
Publisher’s Note: MDPI stays neutral with regard to jurisdictional claims in published maps and institutional affiliations.

