
The Waste Hierarchy at the Business Level: An International Outlook


1
Departamento de Economía Financiera y Contabilidad, Facultad de Ciencias Económicas y Empresariales, Universidad de Santiago Compostela, Av. Burgo, s/n, 15782 Santiago Compostela, Spain
2
CICF—Centro de Investigação em Contabilidade e Fiscalidade del Instituto Politécnico do Cávado e do Ave, 4750-810 Barcelos, Portugal
3
Escola Superior de Tecnologia e Gestão, Instituto Politécnico da Guarda, 6300-559 Guarda, Portugal
4
Departamento de Administración de Empresas, Facultad de Ciencias Económicas y Empresariales, Universidad de Cantabria, Av. de los Castros, 56, 39005 Santander, Spain
*
Author to whom correspondence should be addressed.
Mathematics 2023, 11(22), 4574; https://doi.org/10.3390/math11224574
Submission received: 18 September 2023
/
Revised: 29 October 2023
/
Accepted: 2 November 2023
/
Published: 8 November 2023
(This article belongs to the Special Issue Multivariate Statistical Analysis and Application)
Abstract
:Sustainable waste management is becoming a common goal in most countries. The national legal framework largely determines the waste management practices, the socio-demographic characteristics, and the economic level of the country and, in the case of businesses, the type of business, the industry in which it operates, and the sector-specific regulations to which it is subject. This paper aims to examine the importance that firms worldwide place on waste management by analyzing the evolution over time of waste management practices used by firms and how this evolution has varied across countries and sectors. The X-STATIS technique is applied to conduct a multivariate analysis using data from seven-hundred and eighty firms from twenty-eight countries and eight sectors from 2016 to 2020 (3900 observations). The results show that waste management has become more important worldwide over time. In terms of waste management practices, the management of the impacts of generated waste occupies the first place in the ranking, performed by 97.5% of the sampled firms in 2020; this is followed by the methods of the disposal of non-hazardous waste (66%) while waste prevention policies occupy the last place in the ranking (30.6%). At the country level, the most committed countries are Taiwan (74.3%) and Finland (70.6%), followed by France, Spain, Russia, Italy, and the United States (60.0–66.9%); meanwhile, the least committed countries are the United Kingdom, Australia, and Ireland (35–36%). At the sector level, consumer goods (63.7%) and oil and gas (63.0%) lead the ranking while the least committed sectors are technology and telecommunications (50.0%) and real estate services (49.3%). The evolution of companies’ commitment to waste management is gradual in all sectors, with oil and gas at the top, with a percentage variation of 21.4%, and consumer goods at the bottom, with 5.2%. In addition, our results suggest that the sector influences waste management practices more than the country of origin of the firms.
MSC:
62H12; 62H151. Introduction
Waste management is a growing challenge that affects the entire planet [1,2]. Poor waste management harms human health, damages the environment, and affects the climate (greenhouse gases from waste are a main cause of climate change), thus hindering development [3,4,5,6,7,8]. Therefore, it is necessary to ensure that waste disposal, collection, recycling, and transportation are carried out correctly and with minimum impact on the environment [9]. As a major contributor to the waste generated, companies need to be held accountable for reducing and properly managing their industrial waste [10,11,12]. Thus, sustainable waste management has become a goal in many countries, requiring companies to manage waste in a way that recycles as much as possible and treats the most polluting waste appropriately to reduce the risk of harm to the natural environment [13]. It implies moving from a linear economy model, in which the generation of waste is the norm, to a circular economy model, in which the reduction and reuse of waste is the norm [13]. A more sustainable waste management strategy gives priority to waste prevention and recovery over waste disposal through landfills, dumping, and incineration [5,14]. In this sense, integrated waste management aims to reduce the costs generated by its production, fulfill institutional objectives, and, if possible, extract value [15,16].
Numerous international organizations and frameworks (e.g., the United Nations 2030 Agenda, the United Nations Environment Programme (UNEP), and the Circular Economy Package of the European Commission) highlight waste management’s role in sustainable development. Additionally, several multilateral instruments dealing with the regulation of waste management are currently in force [17,18,19]. The most important of these are the Basel, Rotterdam, and Stockholm (BRS) conventions, which provide a common approach to the management of chemicals and hazardous wastes to protect the environment and people’s health. Some countries (e.g., Australia, New Zealand, and Taiwan) set “zero waste” as their strategic waste management goal [20]. However, the establishment of a regulatory framework for waste management is only in the beginning stages in other countries, such as the Republic of Kazakhstan [21].
In fact, the regulation of waste management practices varies widely from country to country [3,6]. For example, while developed countries (e.g., Western European countries, Japan, the United States, Canada, or Australia) have strict environmental regulations governing waste management [14], developing countries (e.g., African countries and countries of the Global South) have weak (incomplete and unenforced) environmental regulations that favor unhealthy incineration and dumping practices [5,22]. Similarly, waste management regulations vary across industries [16] as both the type of waste generated and the type of resources required depend on the type of activity [5,20]. For example, the military sector is a major producer of radioactive waste [3].
In the context of the European Union, waste management practices are largely determined by the “waste hierarchy” established by the Waste Framework Directive 2008/98/EC (amended by Directive (EU) 2018/851) [22,23]. With the goal of reducing environmental damage, this hierarchy defines an order of priority for waste management practices, with prevention being the most preferred option and disposal being the least preferred [24]. This regulation represented an important change in waste management practices in Europe as, in the late 20th century, approximately 70% of waste was sent to landfills [3]. A waste management hierarchy has also been considered in terms of national regulations [23]. For instance, in the United States, in the 1980s, the California Office of Appropriate Technology defined a hierarchy of alternatives for the land disposal of hazardous waste [24,25]. In Japan, the Basic Law on Establishing a Sound Material-Cycle Society of 2000 aimed at limiting the use of natural resources and promoting environmentally sound ways to dispose of waste, emphasizing waste prevention [26]. Also, India’s National Solid Waste Policy (NSWP), enacted in 2010, and New Zealand’s Local Government Act Amendment No. 4, enacted in 1996, define a mandatory waste management hierarchy [16,27].
Although the waste hierarchy principle has been around for about 40 years, its link to the circular economy model has reinforced its importance in achieving sustainable waste management that promotes the transition from the linear model to the circular economy model, allowing for the reduction of environmental impacts and the return of valuable resources to the economy [23]. According to the waste hierarchy, waste management should be carried out in the following order of priority: prevention, preparation for reuse, recycling, recovery (including energy recovery), and disposal. This priority order implies a change in waste management practices, which have traditionally relied on disposal methods, particularly landfilling [3,6].
Thus, waste prevention policies focus on waste generation at the source, seeking to reduce the quantity and toxicity of waste, either by restricting the unnecessary consumption of resources or by designing products that produce less waste [20]; they also include the establishment of quantitative targets and their regular monitoring [28]. Waste valorization encompasses “any industrial processing activities aimed at reusing, recycling, or composting from wastes, useful products, or sources of energy” [29] (p. 2701); whereas, management of the impact of generated waste refers to strategies to lessen the negative effects of waste generation.
A prerequisite for sound waste management is waste characterization [30]. Before developing waste management strategies, it is first necessary to determine whether the waste contains hazardous constituents [31]. Waste is considered hazardous when it has certain dangerous properties for the environment or humans (ignitability, explosivity, reactivity, corrosivity, toxicity, carcinogenicity, radioactivity, etc.) and, therefore, it is necessary to subject it to further controls in order to ensure that it does not cause any harm in its manufacturing and management [32,33]. Most of this type of waste is of industrial origin. The management of hazardous waste is one of the most pressing issues [30] since its treatment often produces dioxins and heavy metals. The management of hazardous waste includes (1) reutilization; (2) recycling; (3) composting; (4) recuperation, including energy recovery; (5) combustion, including mass burning; (6) deep injection; (7) landfilling; and (8) onsite disposal [30]. Furthermore, depending on the type and quantity, hazardous waste may be transported in various types of packaging and by various types of vehicles. In most countries, the transport of hazardous waste is usually regulated by standards that prescribe guidelines for the appropriate handling of hazardous waste during transportation by road, rail, water, or air [34]. Likewise, waste management activities are performed for the elimination, storage, and valorization of non-hazardous waste, including the collection, transport, processing, and final recovery of residual materials [35,36].
On this basis, the objective of this paper is to analyze the importance that companies around the world place on the management of their waste (both hazardous and non-hazardous) by identifying patterns of behavior at the country and sector levels. Specifically, we intend to analyze the temporal evolution of companies’ waste management, both at the global level and considering the different elements or practices related to waste management implemented by companies, and how this evolution has occurred in different countries and in different activity sectors. For this purpose, we analyze data corresponding to 780 companies from 28 countries for the period of 2016–2020 (a total of 3900 observations) and use the X-STATIS technique to conduct a multivariate analysis. The analysis conducted has two stages: (1) an analysis by elements/practices to identify which waste management elements/practices firms concentrated their efforts on and which were less addressed during the five years under study and (2) an analysis by countries and sectors to assess the extent to which these waste management elements/practices are related to the characteristics of the institutional environment.
The rest of this paper has the following structure: Section 2 describes the material and methods of this study. Section 3 presents the main results, which are discussed in Section 4. Finally, Section 5 synthesizes the major conclusions and implications of the research, its limitations, and further developments.
2. Material and Methods
2.1. Variables
The Refinitiv database (previously called Thomson Reuters) was used to obtain information on companies’ waste management practices. To analyze the importance given to waste management by companies around the world and its evolution over time, we considered six elements or practices related to corporate waste management, which are presented in Table 1. These practices were defined based on the previous literature [3,4,6,21,30] and considering the information on corporate waste management practices available in the Refinitiv database.
Since the Refinitiv database measures corporate waste management practices on a binary scale (implemented/not implemented), each waste management element/practice is considered a dummy variable that takes the value 1 if the company implements the analyzed element/practice and 0 if it does not.
2.2. Sample
The world’s largest companies were selected because they are the most environmentally proactive [37]. The selected study period comprises five years (2016–2020). This choice was motivated by data availability in the Refinitiv database.
The final sample consists of 780 companies that had information on their waste management practices in the Refinitiv database for the period of 2016–2020, providing a data panel of 3900 observations. The companies in the sample come from 28 countries. Table 2 shows the frequency distribution of the sample by country and year.
Appendix A and Appendix B show the company’s commitment to waste management (% presence) by country and by sector of activity, respectively, for each waste management element/practice and by year.
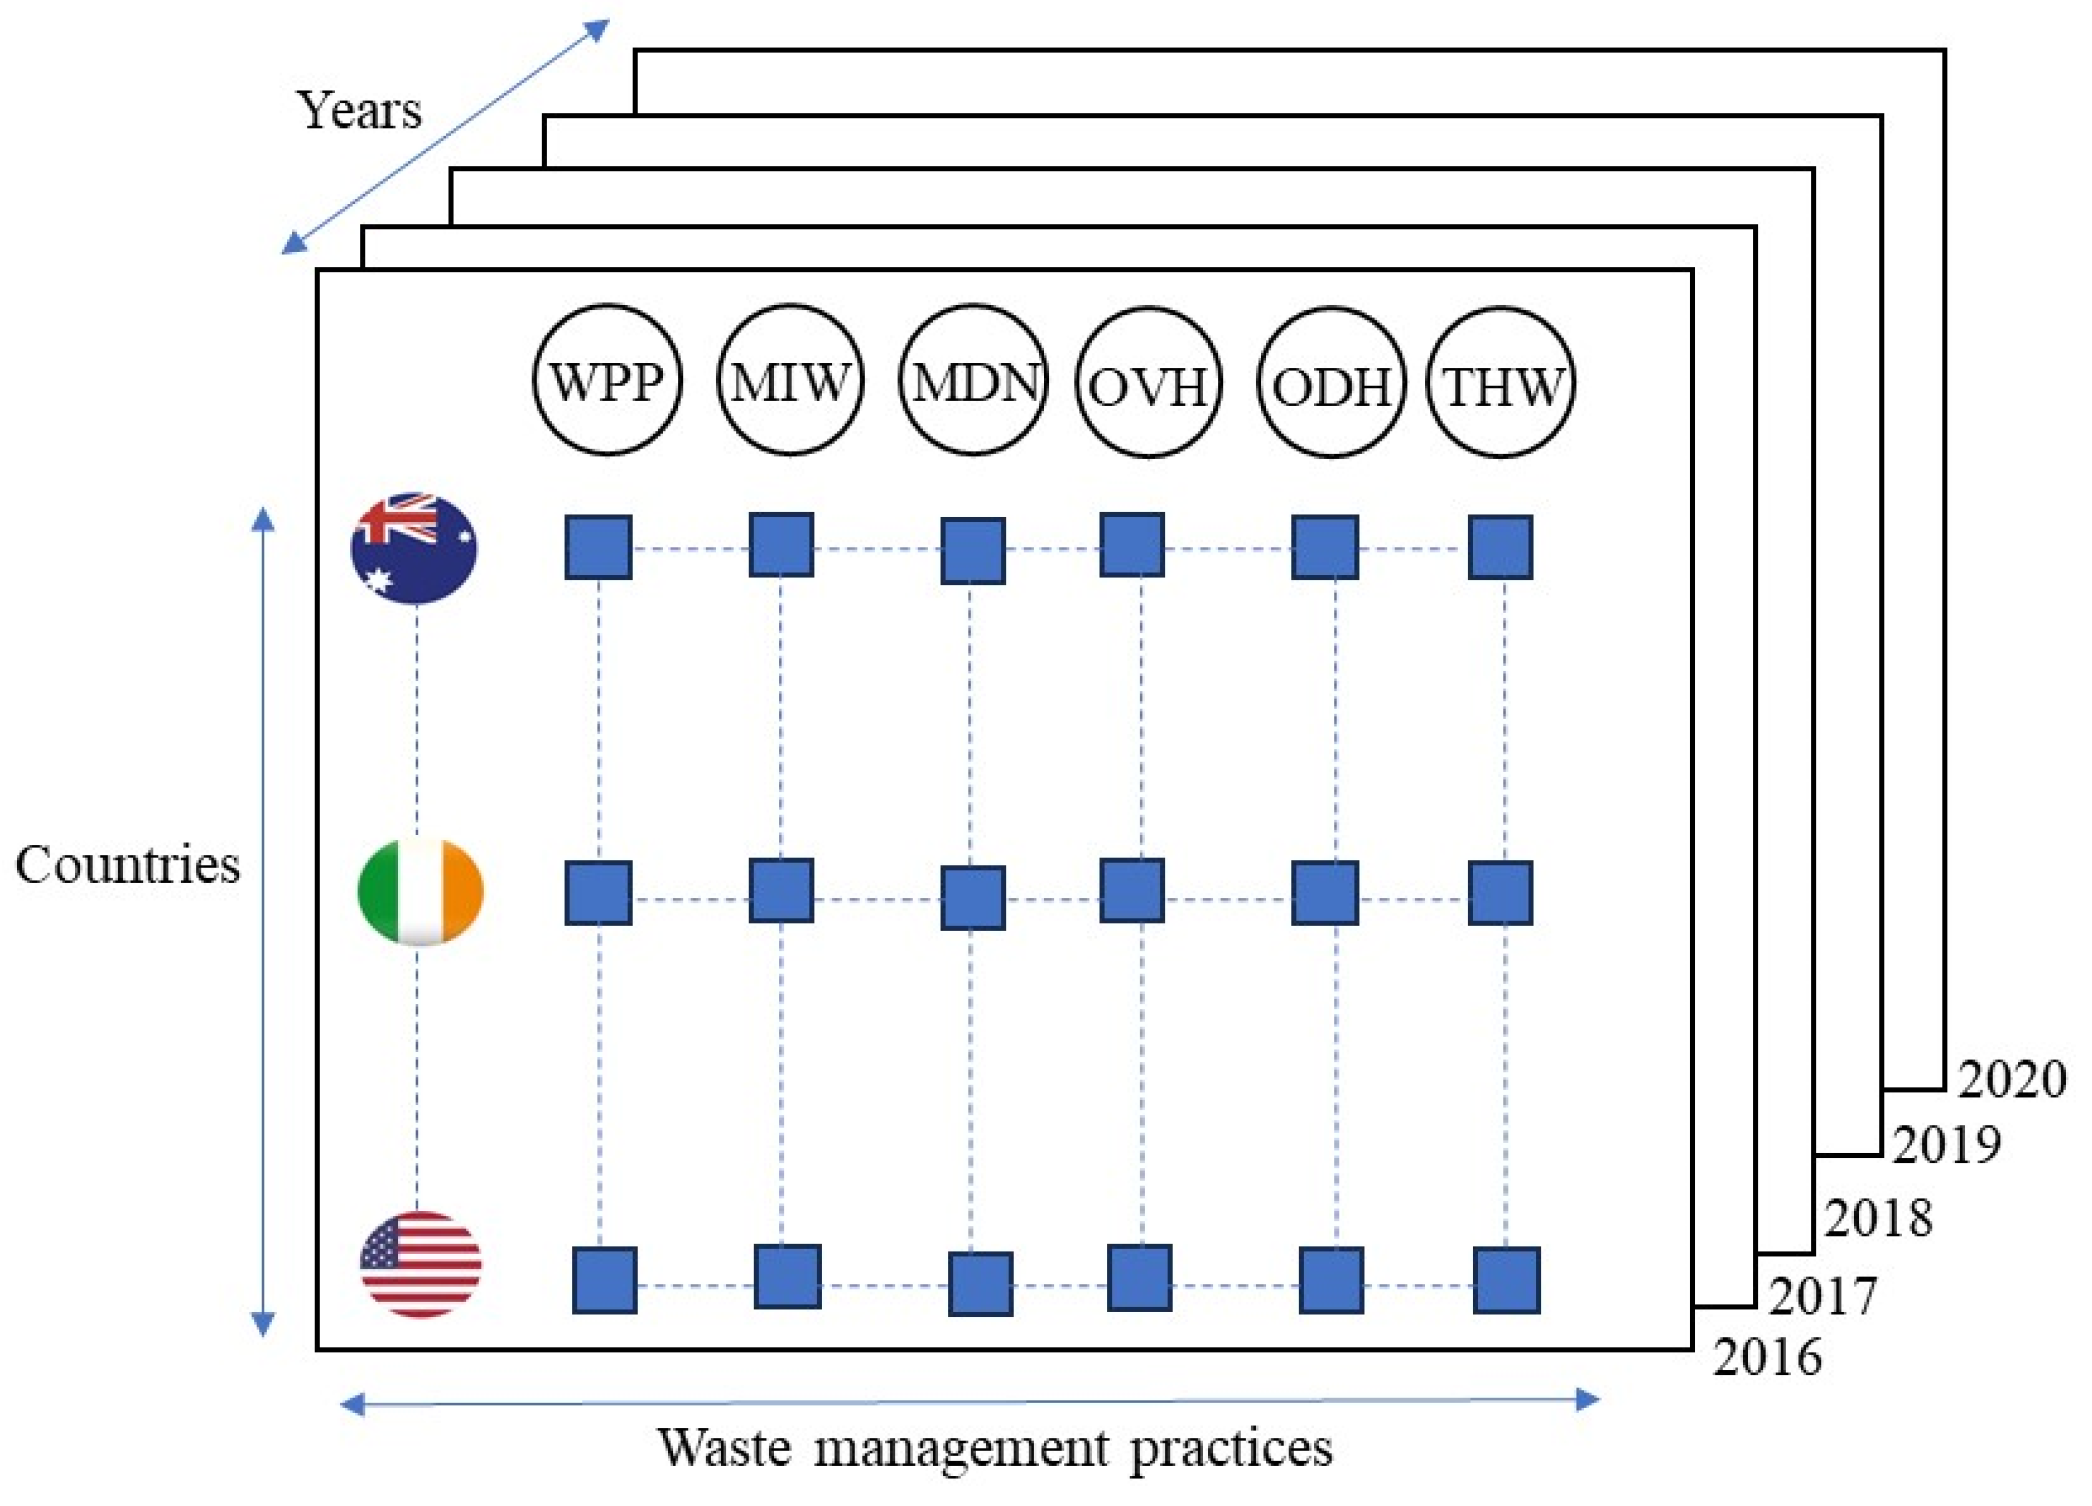
As shown in Figure 1, from the sample, we have constructed a data matrix containing information on the waste management of companies worldwide. Each row represents a company and a year (3900 observations) and each column represents a waste management element/practice (6 waste management elements/practices). Since we aim to analyze the importance given to waste management by companies around the world, we grouped the 780 companies in the sample according to their country of origin (28 different countries). In this way, we have obtained the percentage of presence of each of the 6 waste management elements/practices under study in each country. In addition, we intend to analyze the evolution of waste management by companies over time by characterizing each country according to which waste management elements/practices are more important for it and, on the contrary, which ones represent a greater challenge.
Thus, the data matrix we will work with has three dimensions, 28 × 6 × 5: (i) 28 countries (first dimension, rows); (ii) 6 variables that evaluate the business commitment to waste management (second dimension, columns); and (iii) 5 years, the period of 2016–2020 (third dimension, times).
2.3. Methodology
Given their multidimensional nature, we use a method that allows us to record information from all three of the dimensions. The analysis method used is known as X-STATIS [38], a method of the STATIS family [39,40], which, in turn, belongs to the multitable PCA family, which includes some related techniques, like Multiple Factor Analysis (MFA) [41]. In particular, the STATIS family is an expansion of Principal Component Analysis (PCA), adapted to deal with multiple data tables measuring sets of variables obtained from the same observations [41].
The methods of the STATIS family are applied in cases where the data have a three-way structure, that is, sets of three-entry data matrices made up of the same individuals (in the rows) and the same variables (in the columns) in different occasions or conditions [41,42]. As shown in Figure 1, this is our case, with a first way for countries (or alternatively sectors), a second way for variables representing waste management elements/practices, and a third way representing the study period (2016–2020). Thus, this method will allow us to know the preferences of each country regarding the representative variables of waste management elements/practices, thereby assessing their commitment to waste management, as well as the challenges they face in this regard, while we see their evolution throughout the period under study.
X-STATIS was developed by Jaffrenou in 1978 [38] and its first description was given by L’Hermier des Plantes [40]. Its name (STATIS) is an acronym of the French term “Structuration des Tableaux a Trois Indices de la Statistique”, which means the “structuring of three-way statistical tables” [41]; although, it was originally known by other names, such as Triadic Analysis [43] or Partial Triadic Analysis (PTA) [44]. This technique of statistical analysis has already been used in several studies analyzing the patterns of the adoption and evolution of various sustainability practices at the country or sector level [45,46,47,48,49].
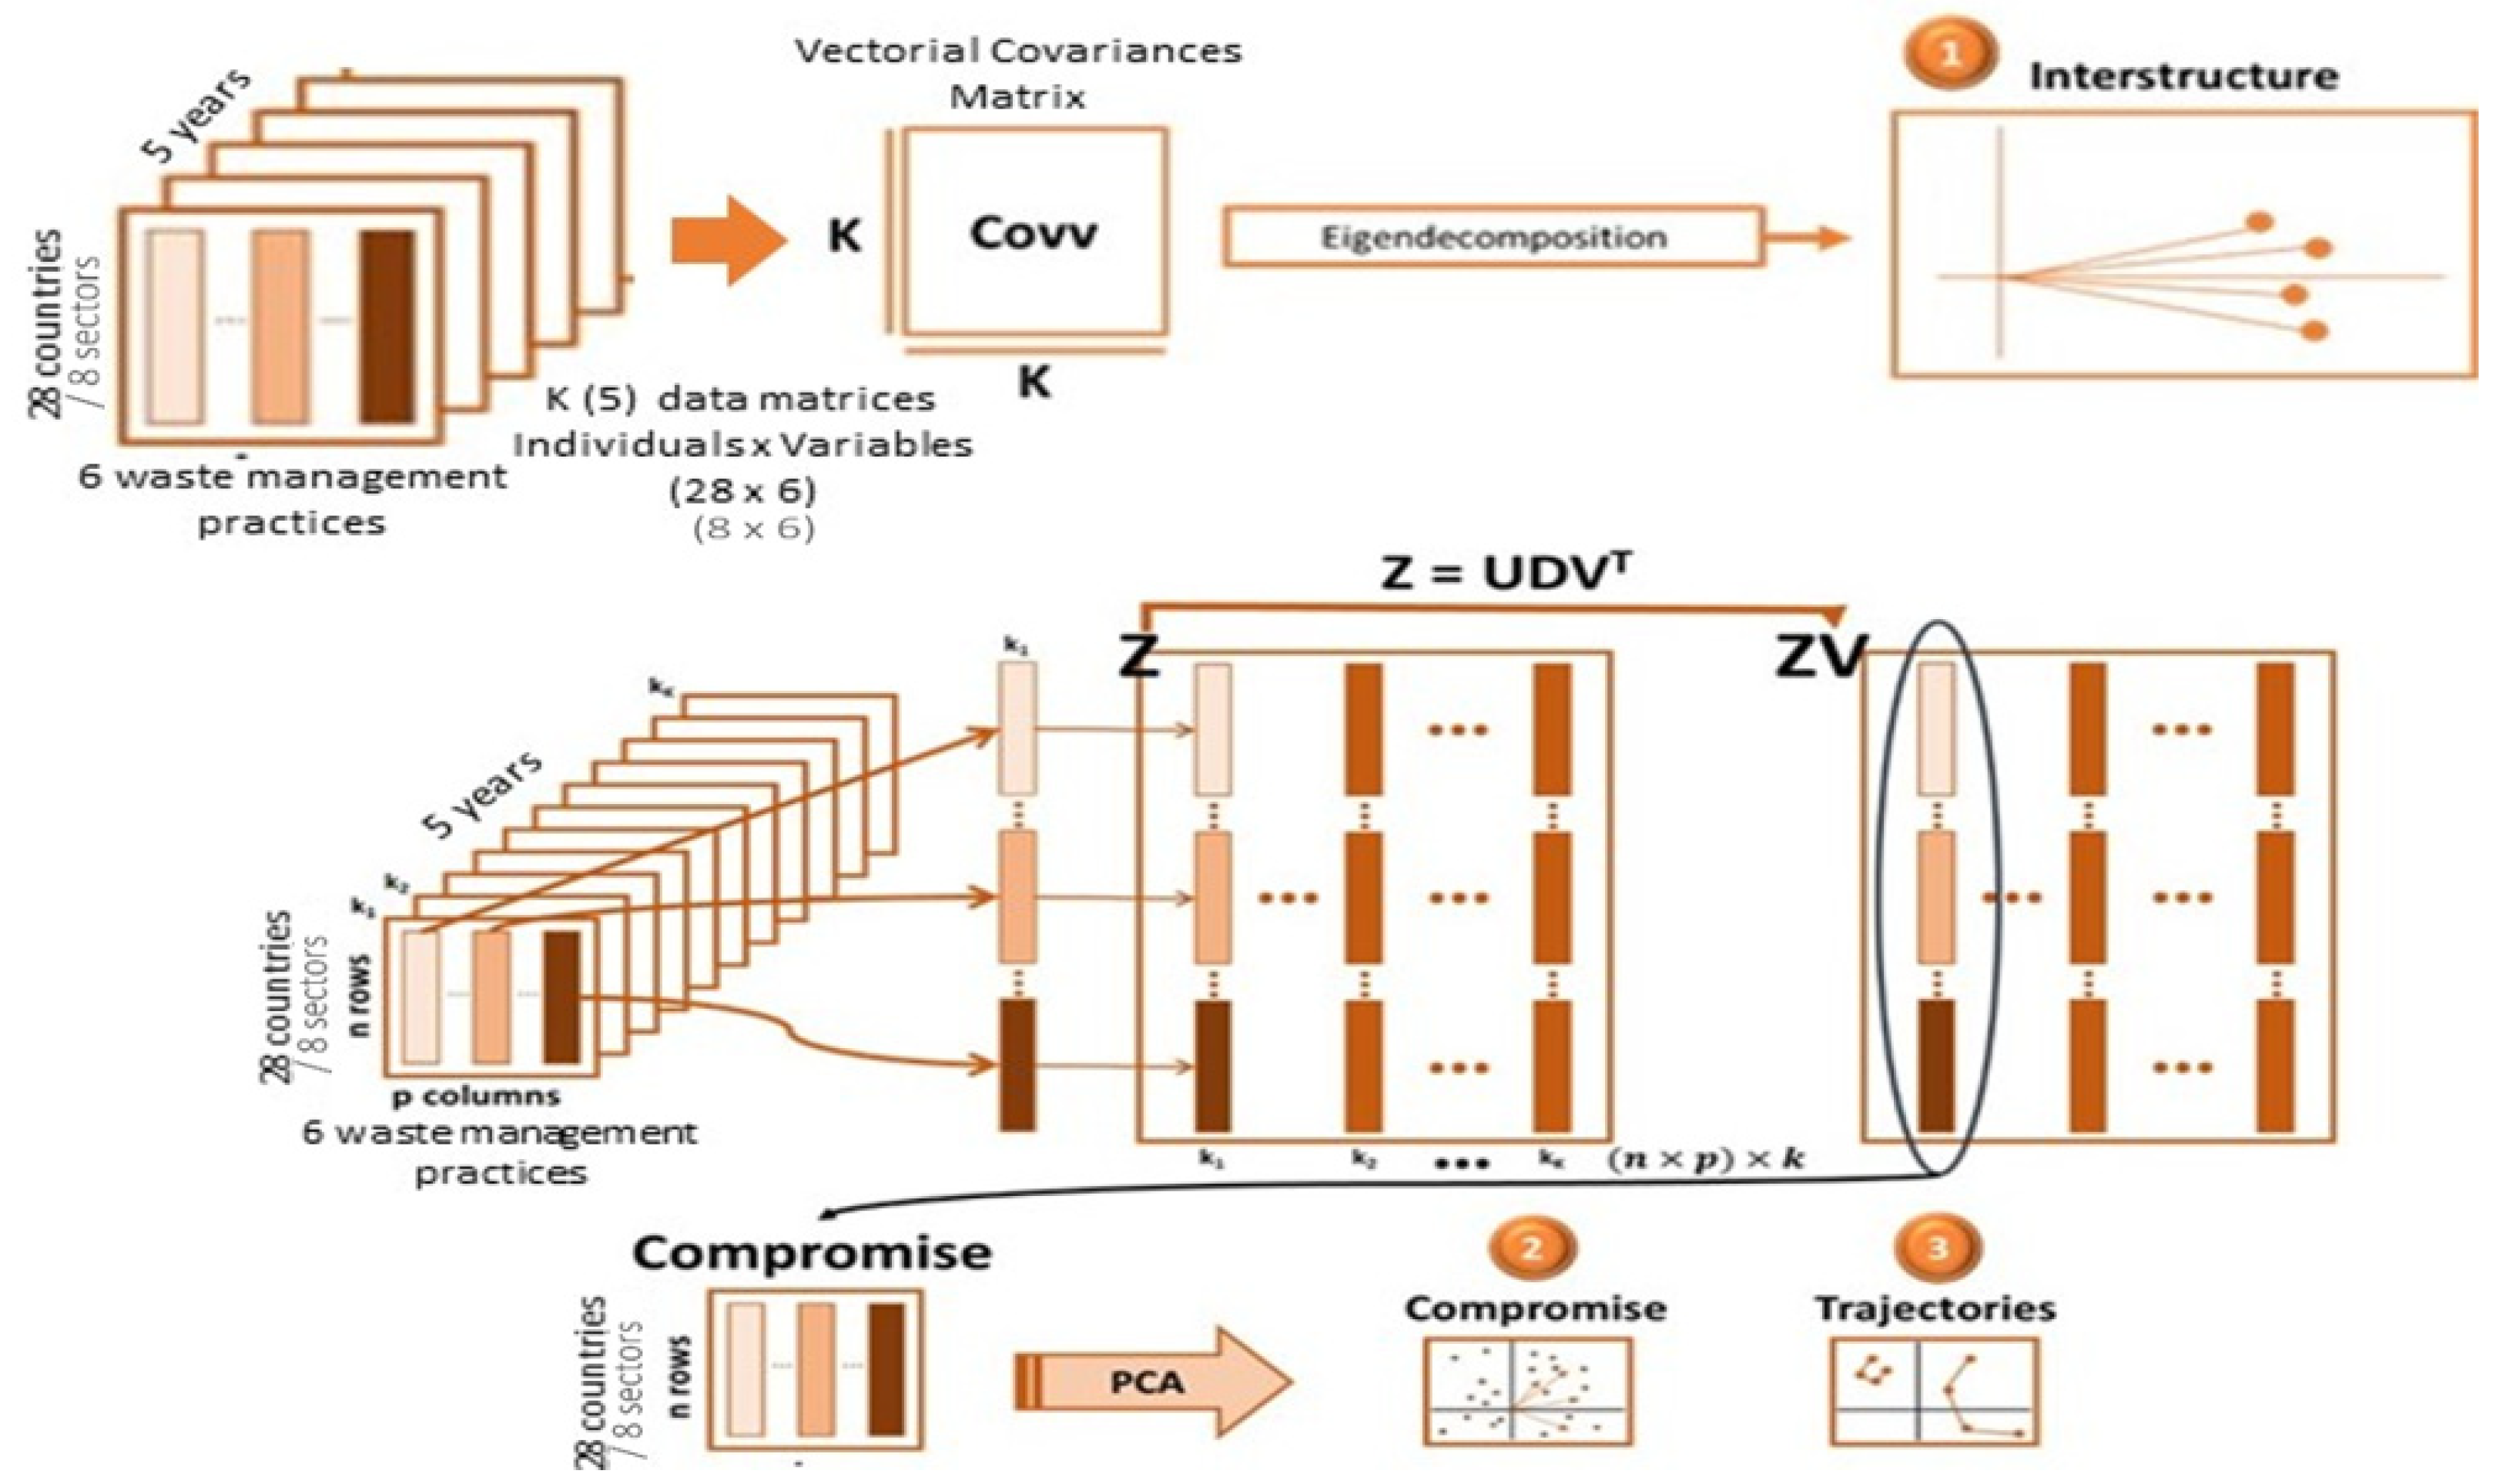
X-STATIS is an explorative technique that enables us to collect the key data from k tables and group them into a single table [45] with three main purposes [41] (p. 125): (1) to comparatively analyze the relationships among individual datasets; (2) to combine them into an “optimum weighted average”, termed “compromise”, which is subsequently analyzed through principal component analysis to uncover the common structure among the data; and (3) to project each of the original datasets onto the “compromise” to identify similarities and dissimilarities. Its development is divided into three stages, which are summarized in Figure 2.
According to the scheme in Figure 2, the first step of the X-STATIS analysis is to study the “interstructure”. This stage began with a comparison of the k data matrices, each matrix corresponding to one year of study. These k data matrices consist of the same I rows (individuals, in our case countries/sectors) and J columns (variables, in our case waste management practices). From the k data matrices, the “vectorial covariances matrix” is built to contain the scalar products between the matrices. Each column vector of this matrix corresponds to one of the k matrices in an expanded form. Thus, the element in row k and column l was calculated as , being the k-th matrix in the series, and and the row and column values, respectively. This step allows us to know which years of the study period are more similar and which years are more different. To achieve this, each year (matrix) is denoted as a dot in a low-dimensional Euclidean subspace, each of these points is connected to the coordinate origin, and the angles between the vectors are evaluated as an estimation of the correlation, with acute angles indicating a positive correlation [50,51].
The next stage of the analysis is the construction of the “compromise matrix” and the analysis of its structure in order to summarize the information of the k original matrices into a single one. Thus, it can be said that compromise provides a picture of the structures that are common to all matrices. The process to construct the “compromise matrix” is as follows: the k matrices are vectorized through a linear conversion that transforms each matrix into a column vector, with each matrix’s columns being stacked in such a way that if we obtain k matrices, we obtain a new matrix with k columns and rows. This new matrix will be called the Z matrix. By performing a principal component analysis on the Z matrix, the ZV matrix is created. Then, the first component that contains the most information is picked out and, by spreading this first column, the compromise matrix is built (see Figure 2). This matrix contains the relevant information for the study period, after filtering the noise (i.e., removing statistically relevant information) [50,51] and synthesizing the stable information from the original k data matrices.
Finally, the last step of the X-STATIS analysis is the study of the “intrastructure”. It consists of the analysis of the reproducibility of the “compromise” since it enables us to represent the positions (or trajectories) on the compromise of each of the individuals and/or variables that make up the different matrices and to analyze their relative position. In this regard, a trajectory is defined as the change in the position of a variable (or individual) over time so that the variable (or individual) is stable when its trajectory has little variation (surrounding); meanwhile, when a variable (or individual) is not stable over time, its trajectory is eccentric. Thus, from the study of the intrastructure, we can analyze the evolution over time of the individuals of our matrix (in our case, the 28 countries from which the sampled firms originate). Through principal component analysis, the information contained in the “compromise” matrix is represented in a two-dimensional subspace by projecting the rows of each of the k original matrices onto the resulting compromise subspace [42,51]. If we consider to be the first eigenvectors matrix from the compromise analysis, the coordinates of the rows of the matrix are the rows of and the columns are the rows of , where are the first eigenvectors of . Thus, by studying trajectories, we can represent individuals from each of the k original matrices in a two-dimensional plane by projecting their values onto the “compromise” subspace, allowing us to observe each country’s evolution from 2016 to 2020.
All computational processes and two-dimensional representations of the X-STATIS analysis were performed by employing the KTensorGraphs package in R, version 1.1. (2020) [52].
3. Results
3.1. Corporate Commitment to Waste Management: Analysis by Country
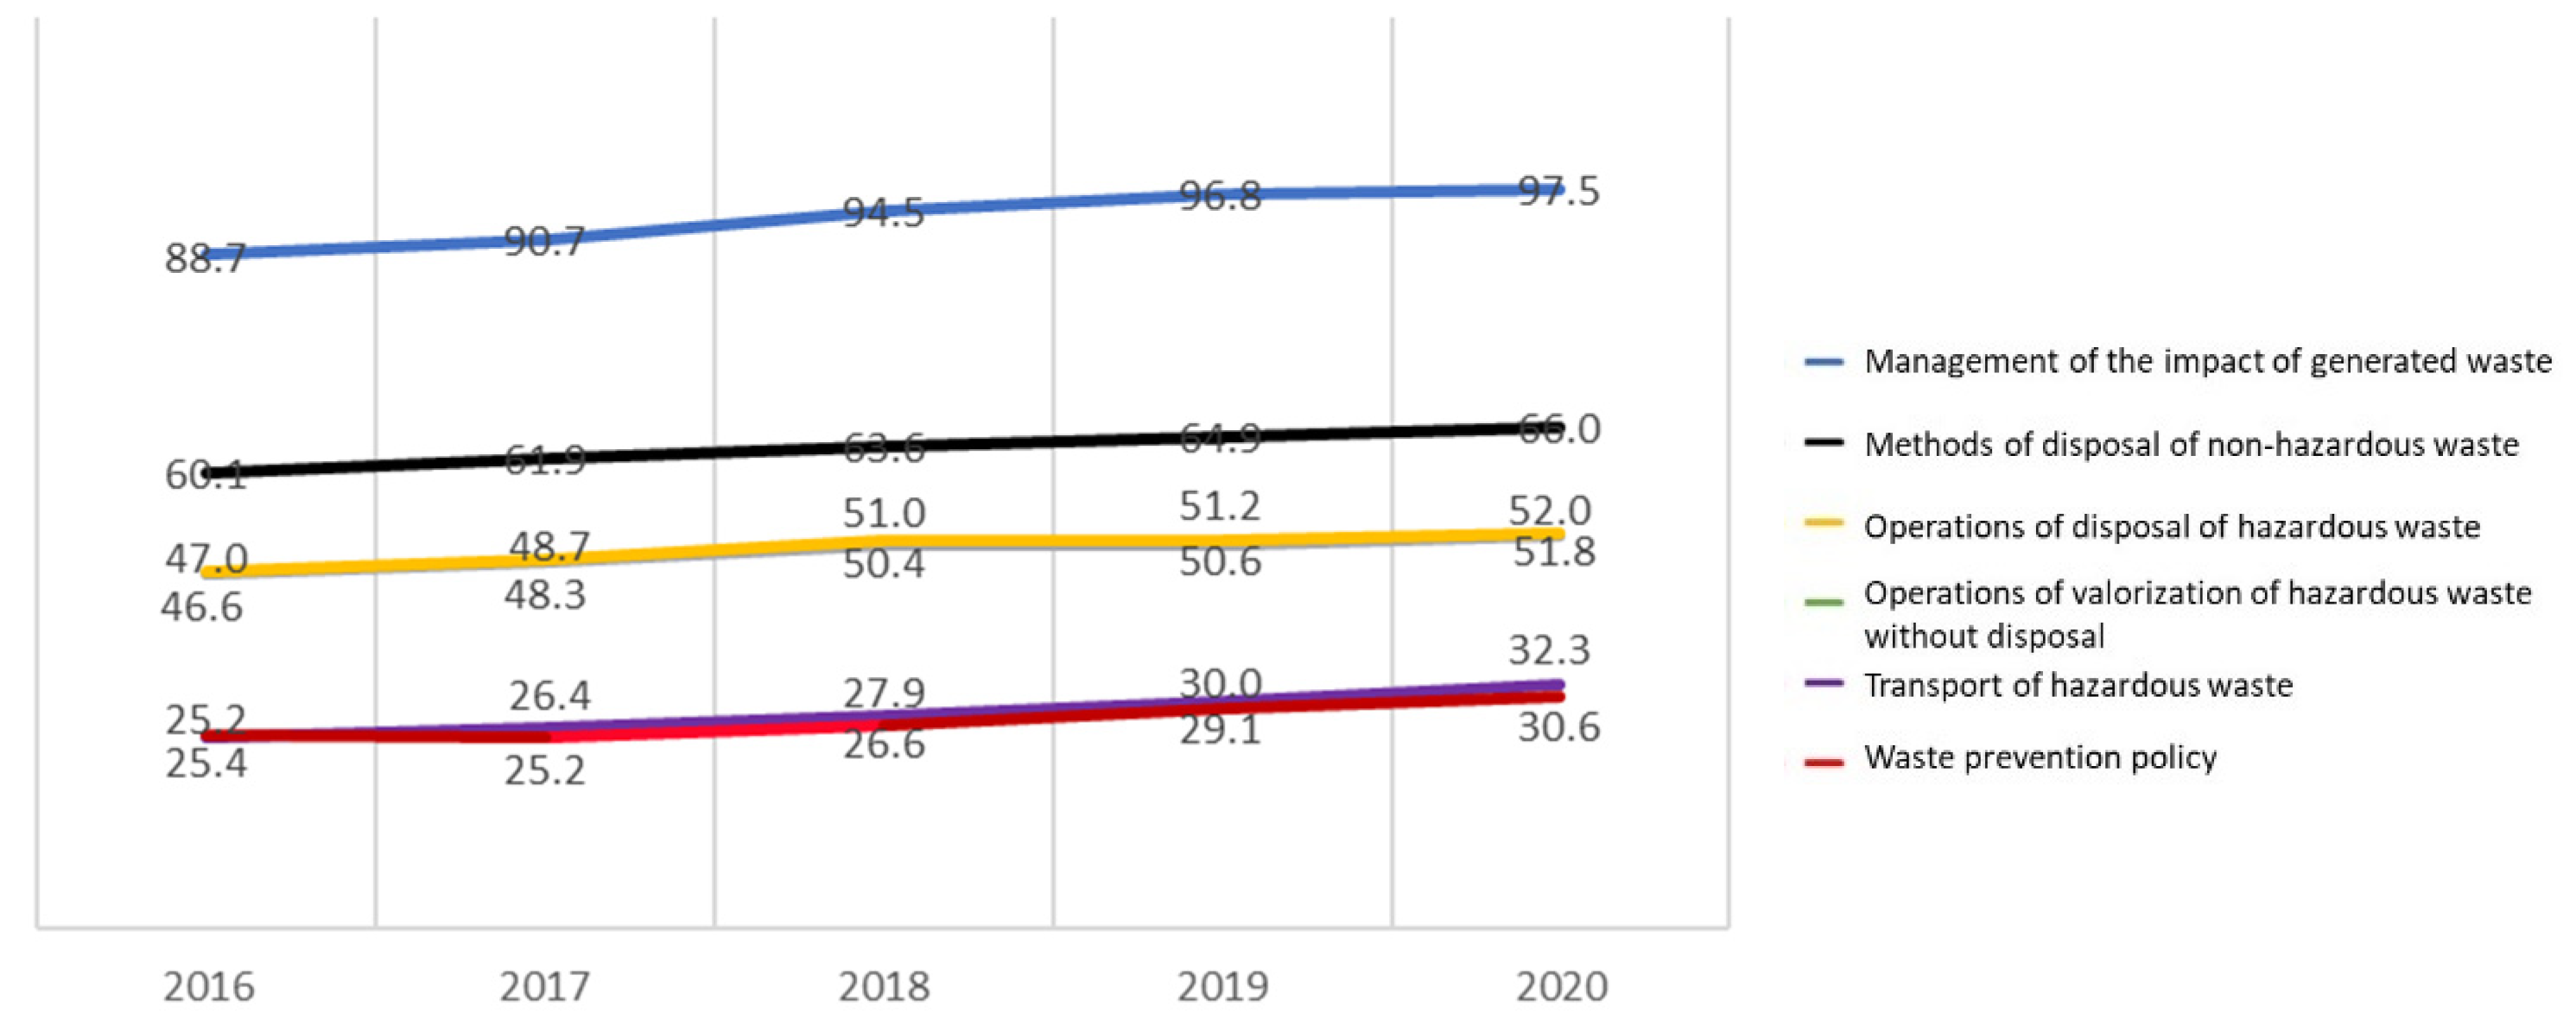
The descriptive values of the six waste management elements/practices analyzed for each year are shown in Table 3, calculated as a percentage by obtaining the sum of the positively informed divided by the total potential. As can be seen, waste management has become more important globally over time as all variables show a positive evolution (see Figure 3).
In Table 3, we can also observe the order of preference of these waste management elements/practices by the companies. Thus, the management of the impacts of generated waste can be considered an obligation for the companies since it is present in practically all of the sampled companies. In second place are the methods of disposal of non-hazardous waste, with a presence of 66.0% in 2020, followed by the operations of disposal of hazardous waste and the operations of valorization of hazardous waste without disposal, both near 52.0%, which indicates that half of the companies are concerned with the reuse of waste. Finally, the transport of hazardous waste and the waste prevention policy are the waste management elements/practices that show the greatest challenge for the future as only between 30.0% and 33.0% of the companies in the sample demonstrate their commitment to them.
Table 4 shows the global corporate commitment to waste management by country and year in terms of the percentage of the presence of the elements/waste management practices under study (the sum of the positively informed divided by the total potential). First, it can be seen that most countries have experienced a positive evolution throughout the analysis period, with the exception of Italy, the Netherlands, and Belgium, whose final values are similar to their initial ones, and Norway, the only country to decrease its commitment to waste management, specifically by −3.7% (“Variation %” column). Among the remaining countries, 14 of them (50% of the sample) show a slight evolution, less than 15.0% (marked in yellow in Table 4). It is worth mentioning countries with a remarkable evolution (as shown in the Variation % column). This is the case in Singapore (61.1%), Ireland (50.0%), and Indonesia (42.3%), as well as Sweden, Denmark, and Malaysia (30.0–35.0%).
In terms of their global commitment to waste management (“Global” column), countries are separated by the 25th and 75th percentiles of the average value over the study period in percentages. The percentiles are used to group countries into advanced, when it is 60.0% or higher (in green); middle, between 45.0% and 59.0% (in yellow); and lagged groups, under 45.0% (in red). Taiwan (74.3%) and Finland (70.6%) stand out as the most committed countries; one step below are France, Spain, Russia, Italy, and the United States (60.0–66.9%); and, finally, the least committed countries are the United Kingdom, Australia, and Ireland (35–36%).
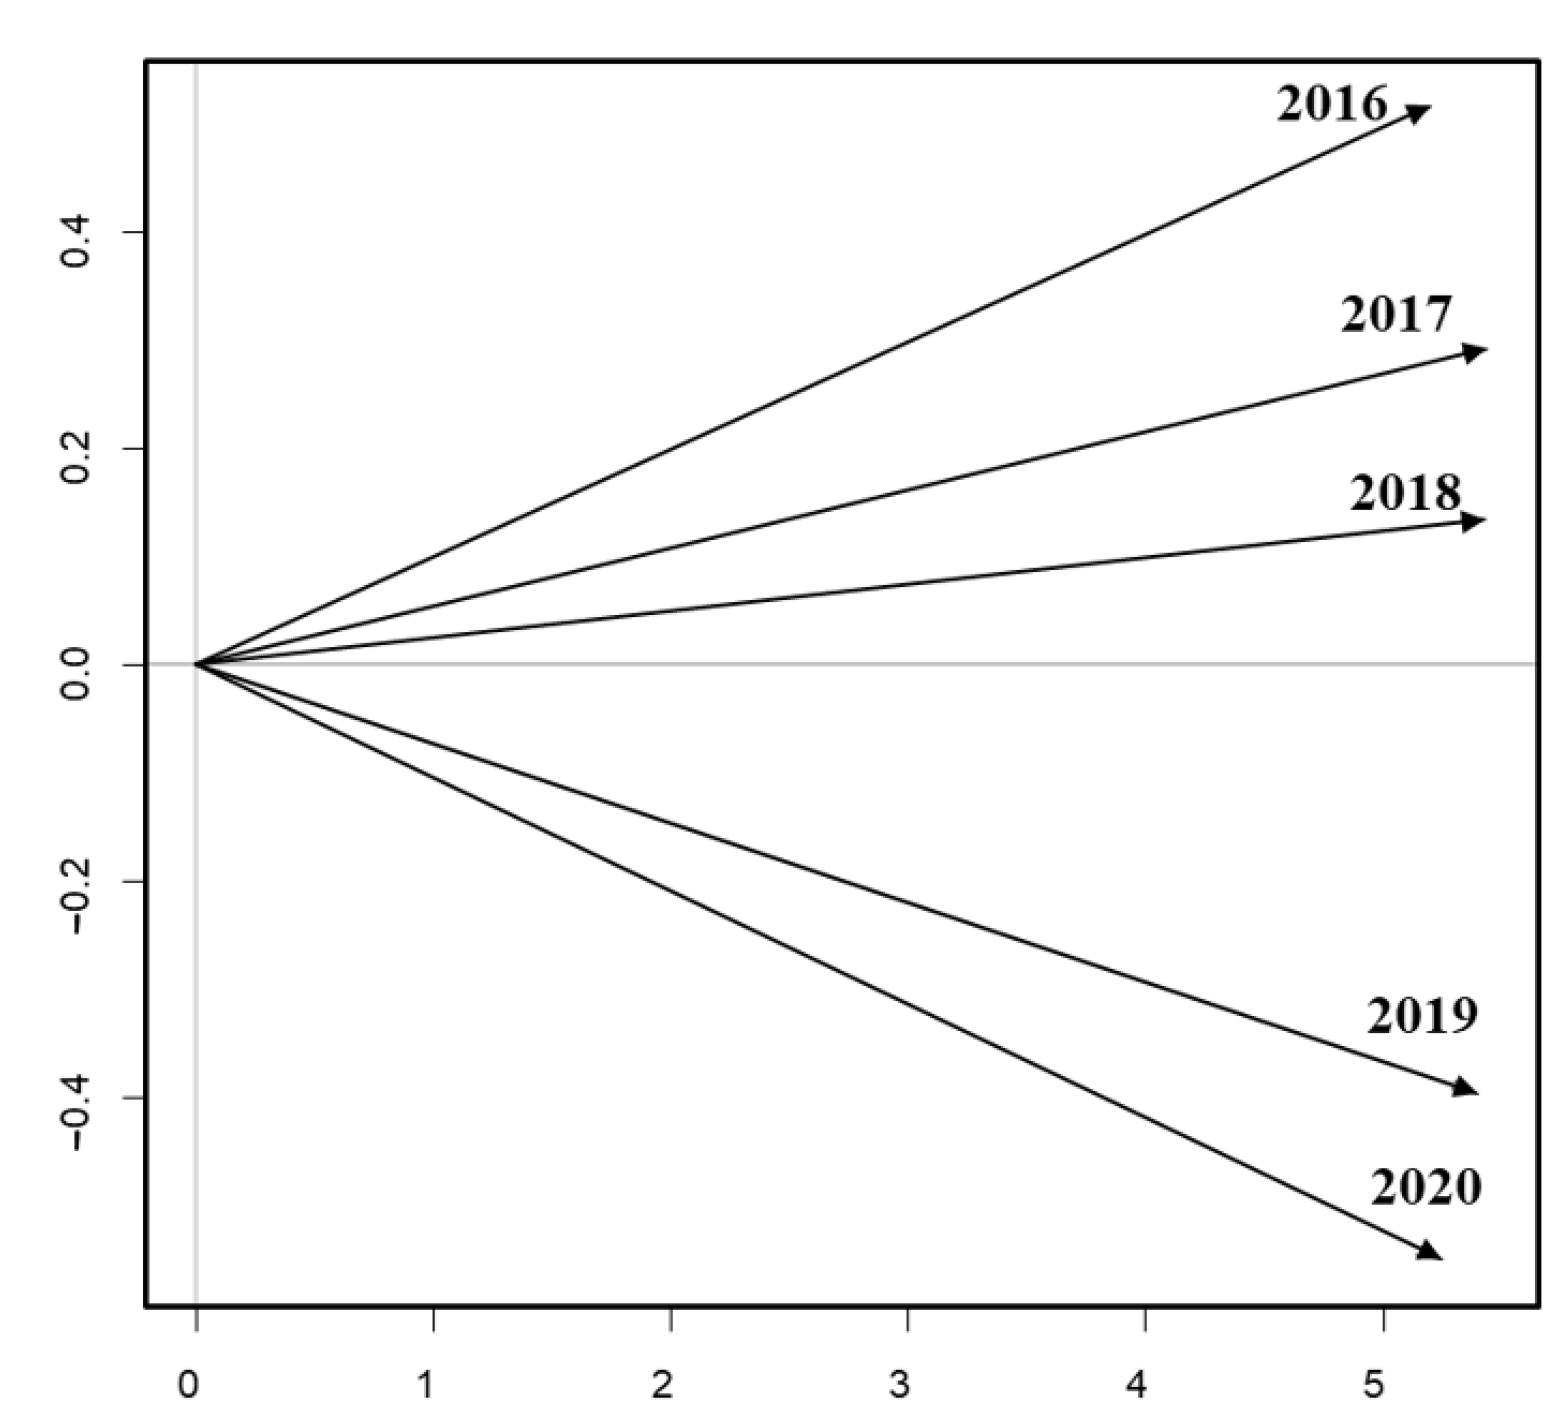
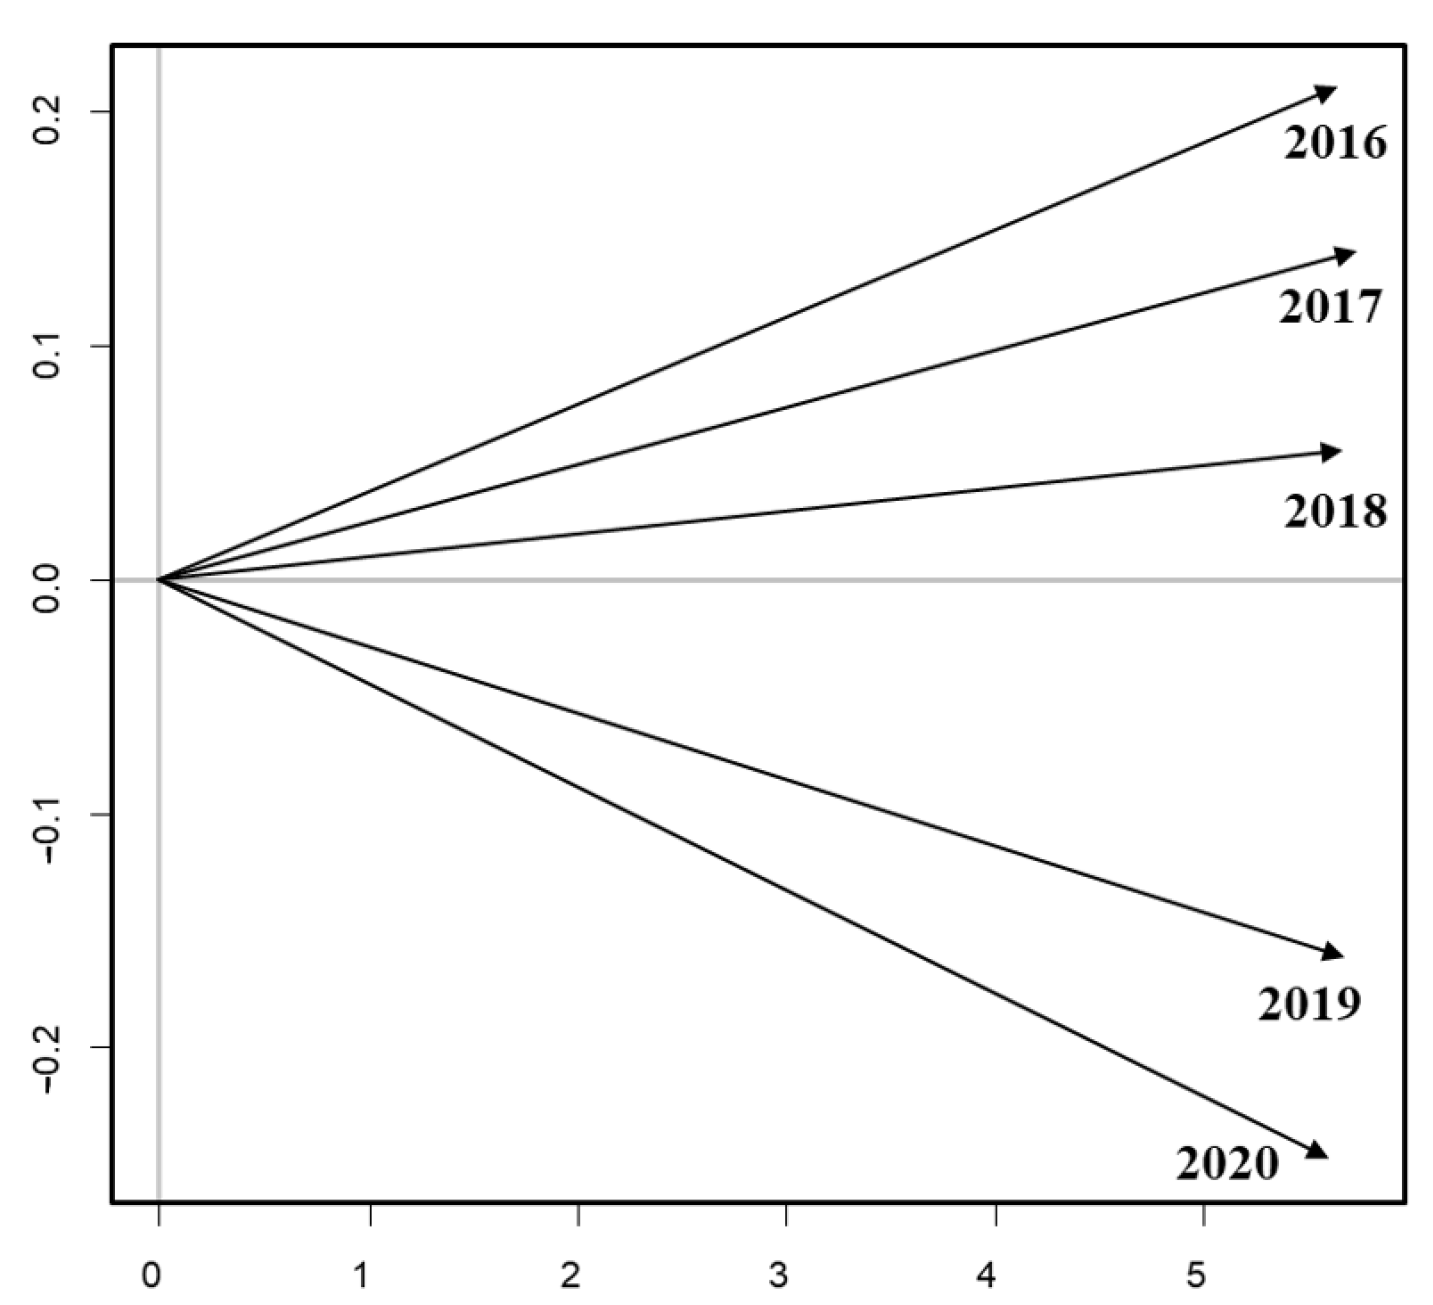
We first analyze the commonalities between the years from the study of the interstructure by graphing the vectorial correlation coefficient between matrices, i.e., between years, in a factorial plane representing the strength of the relationships between matrices from different years [42,51,52]. It gives a graphical estimate of the coefficient in which we find acute angles between the vectors, indicating strong relationships between the years that occur in a gradual way (Figure 4). As can be seen, the most different years are the first and the last years of this study. This is due to the growth we discussed above. We can also see two phases: 2016–2018 and 2019–2020. This can be explained by the effect of the pandemic on waste production and the associated risks of a health crisis [5,53] that caused many countries to deploy recovery plans emphasizing the importance of a circular economy and waste reduction [54].
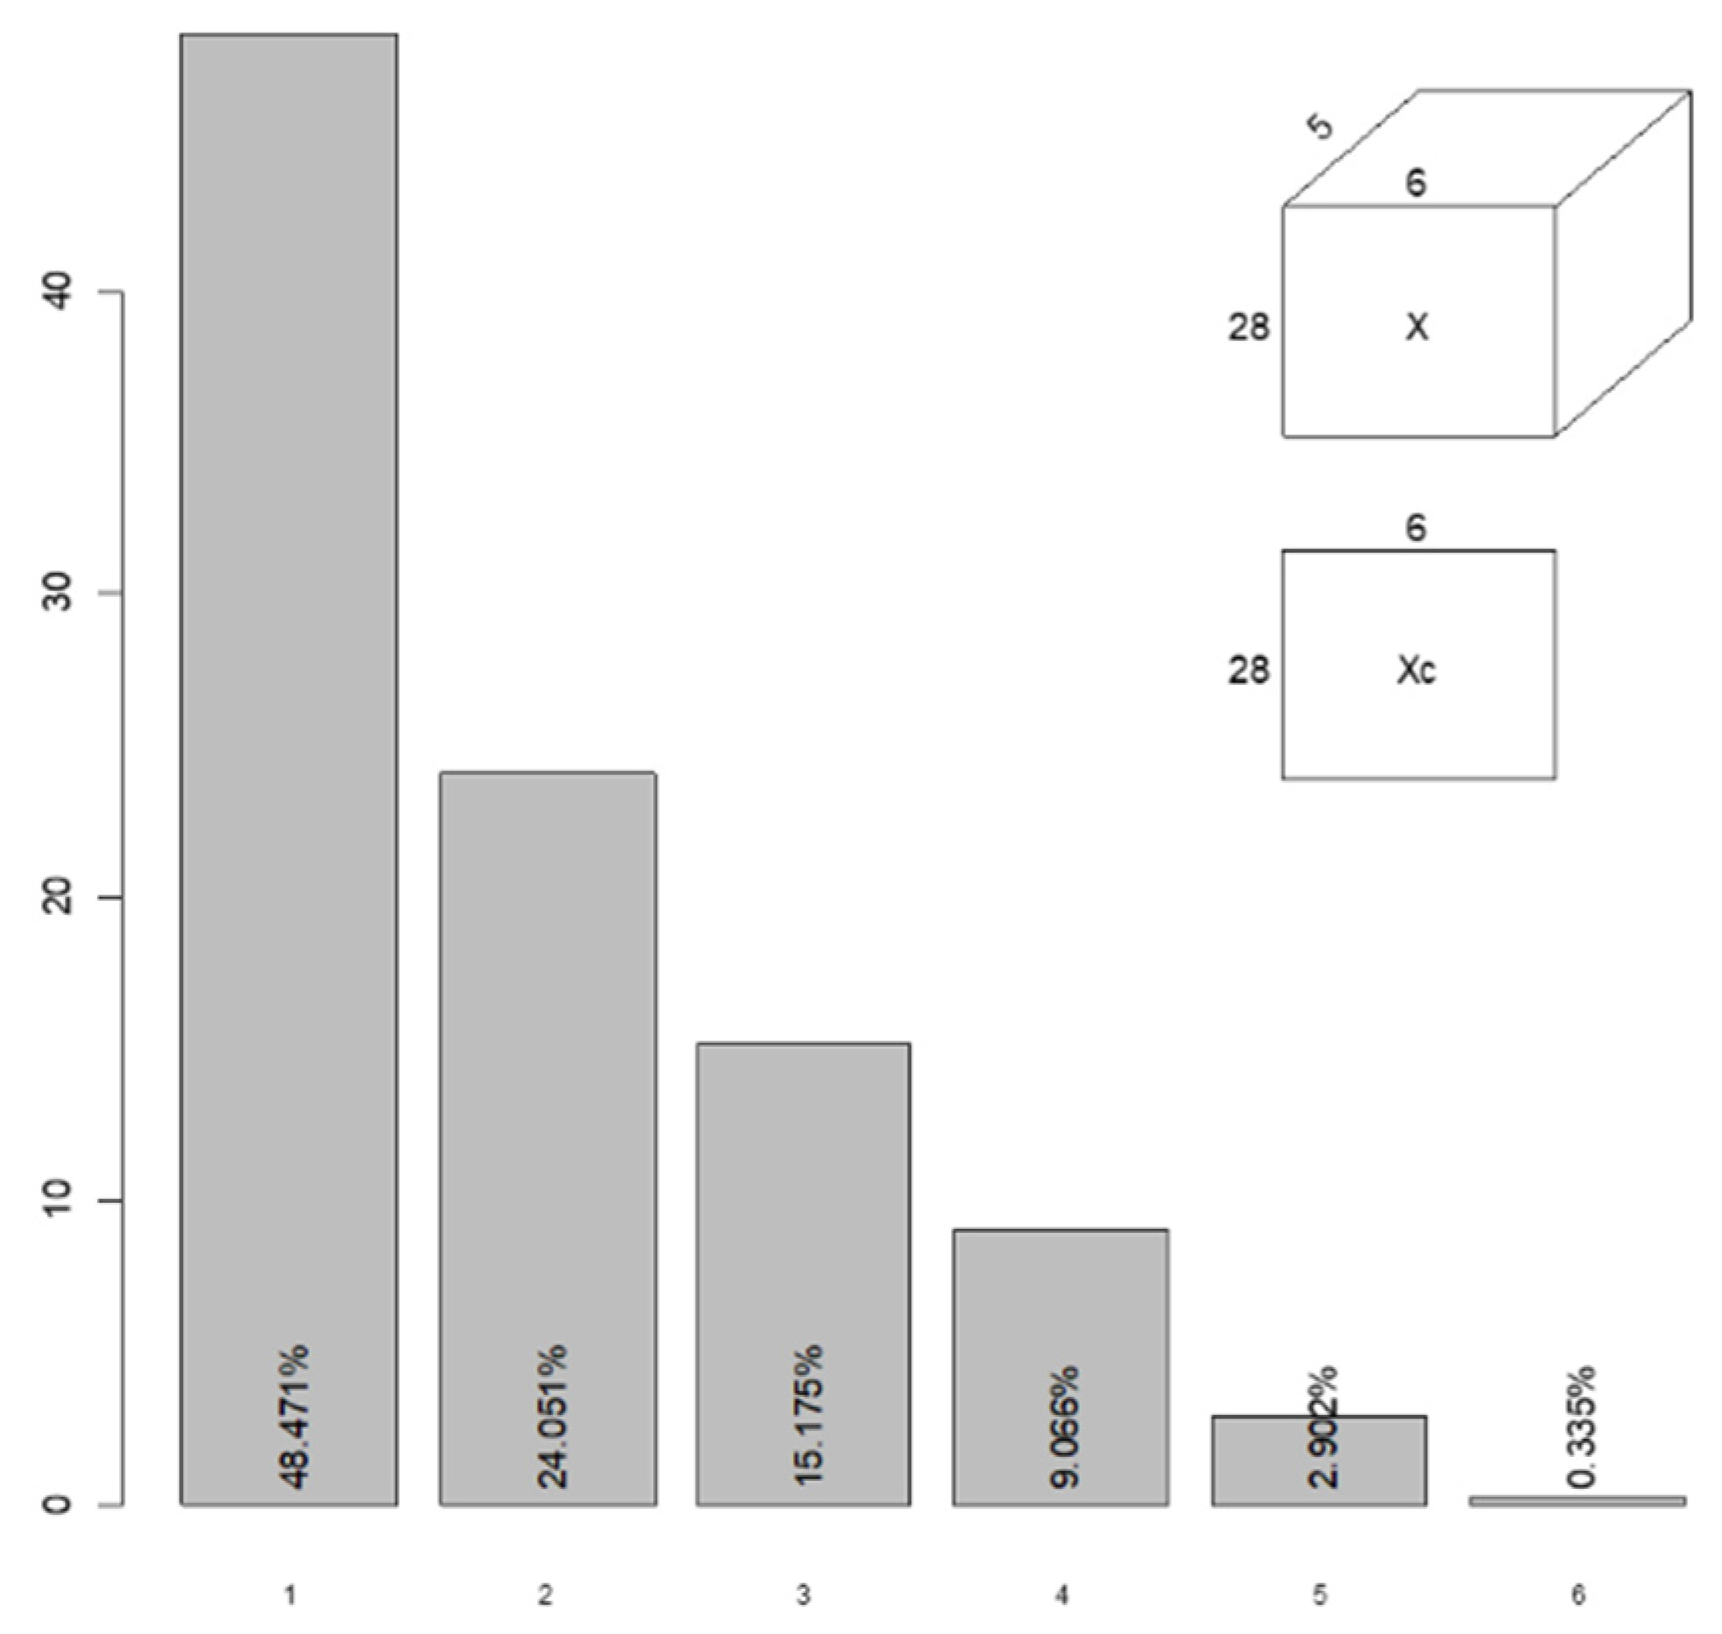
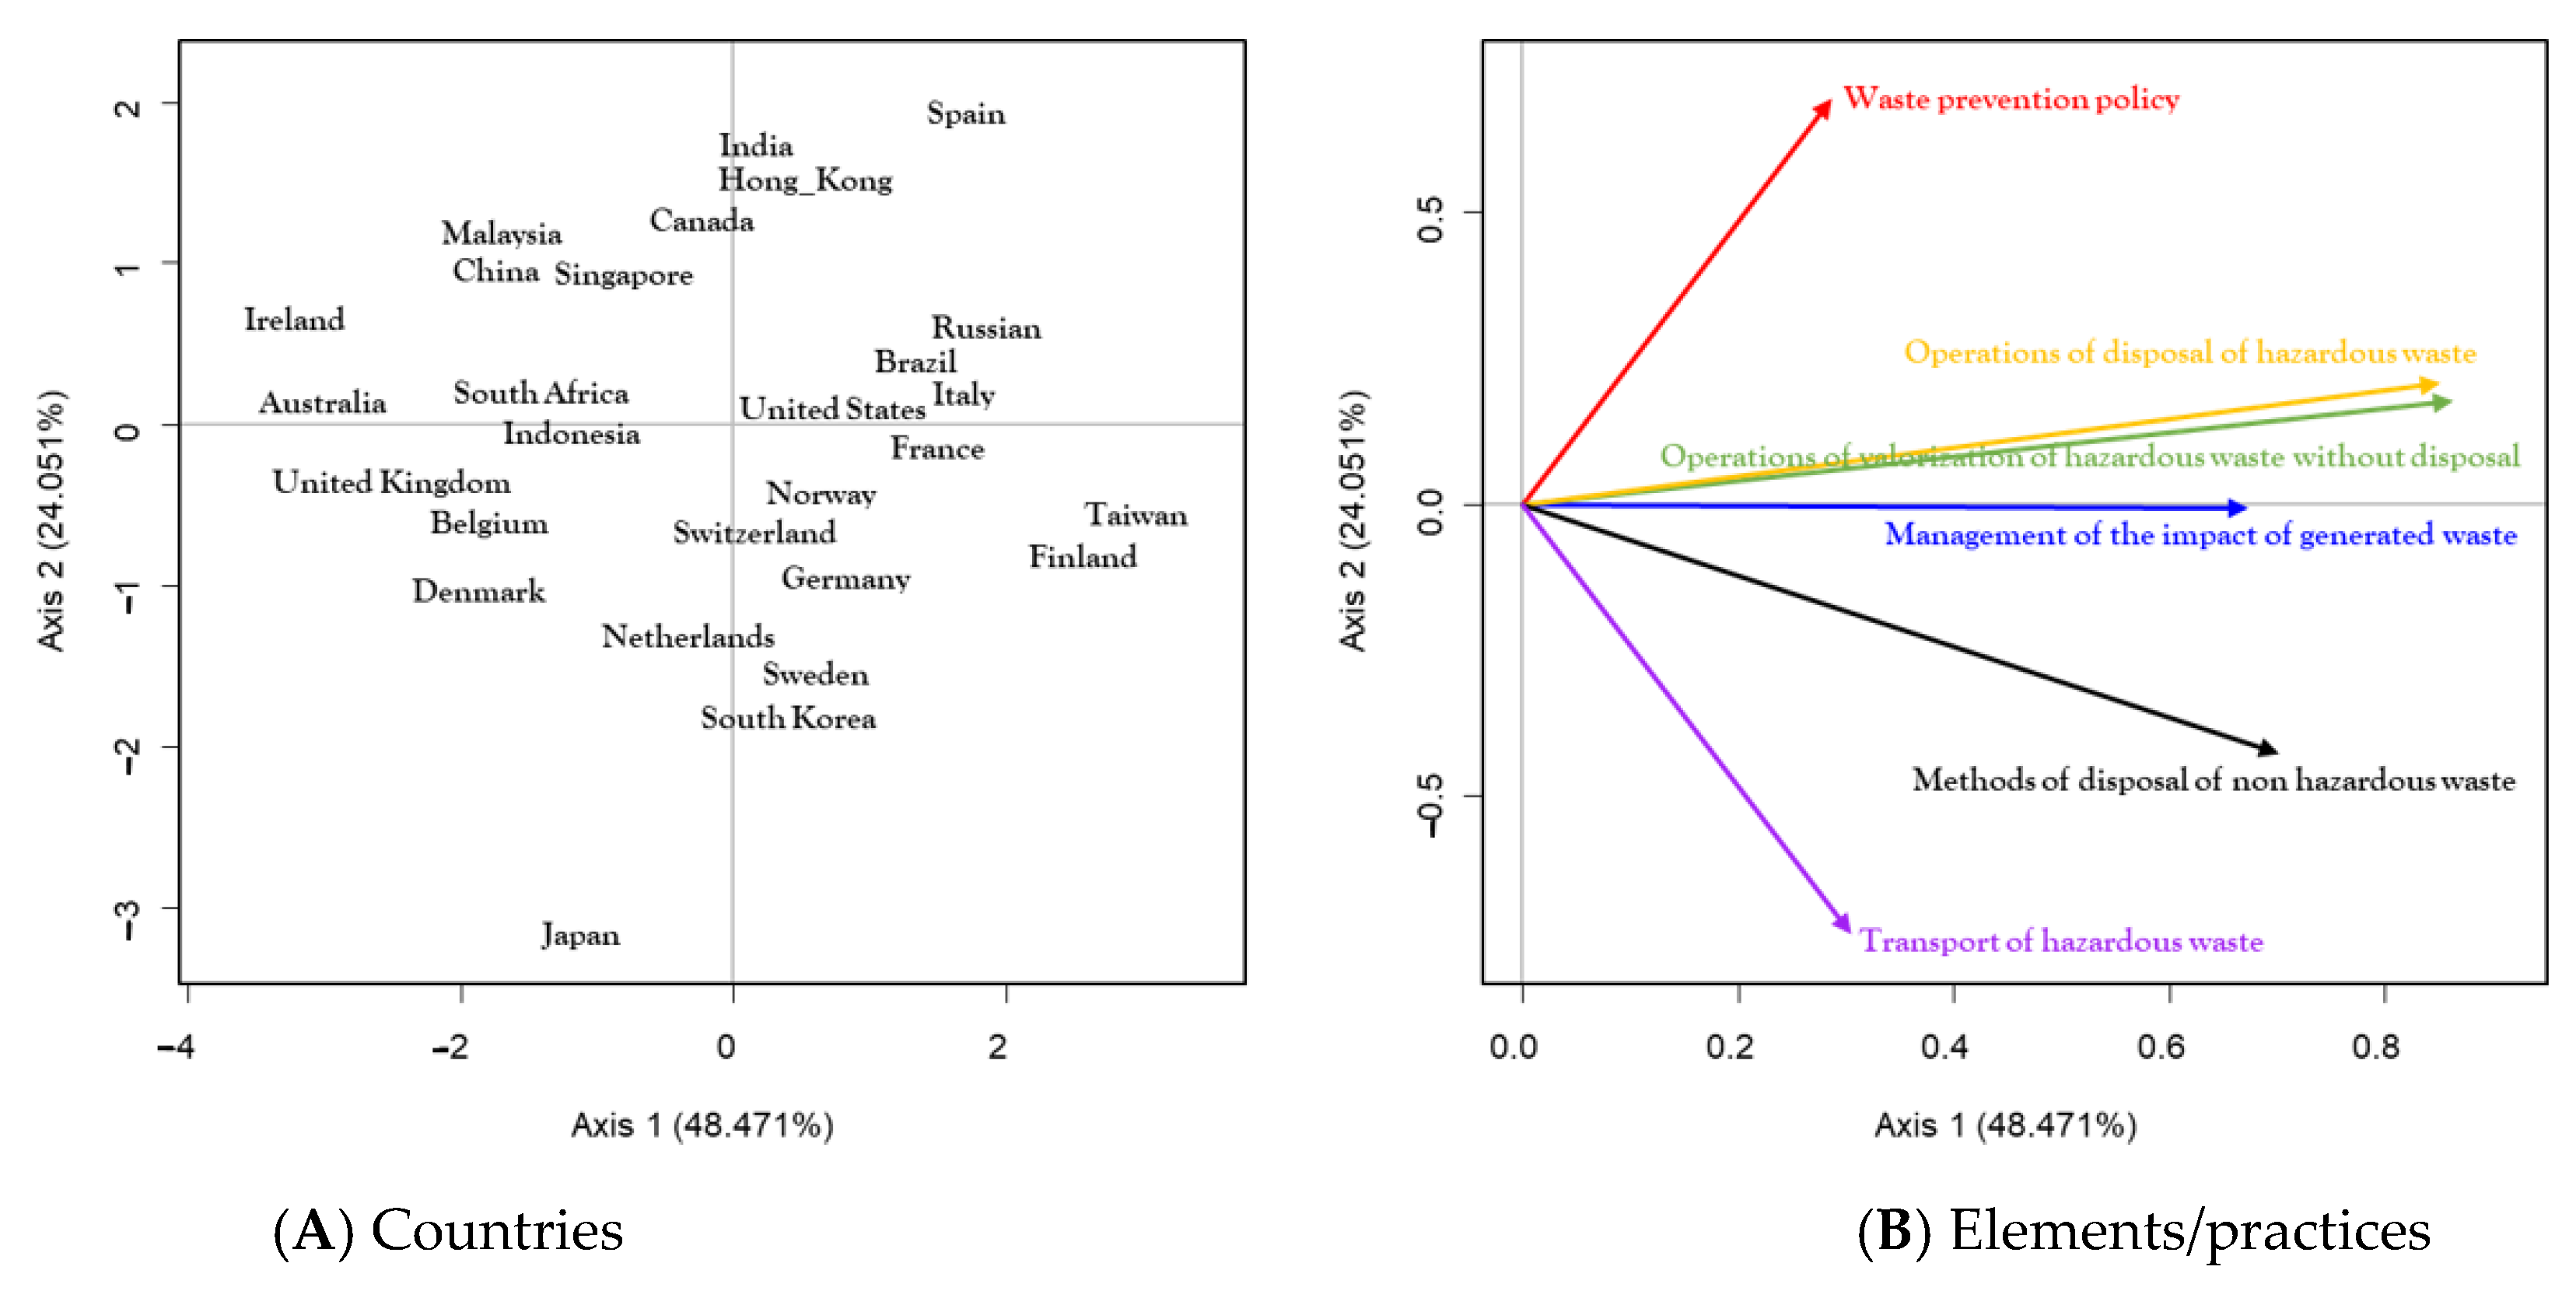
The second step involves constructing the compromise subspace, the aim of which is to summarize the information acquired throughout the study period. The factorial plane 1–2 gathers 72% of the information (Figure 5) and is represented in Figure 6. In this figure, each of the 28 countries and their positions on the plane can be viewed individually on Figure 6A so that each point synthesizes global waste management commitment throughout the study period based on preferences for waste management elements/practices.
From the direction of the vectors in Figure 6, we can obtain a characterization of each of the countries. Thus, countries located in the right hemisphere show a greater commitment to waste management (they are in the green at the top of the Global column in Table 4). Countries such as Spain, Hong Kong, India, and Canada are in the upper zone, with a higher orientation toward waste prevention policies. Other countries, such as Russia, Brazil, Italy, France, Taiwan, Finland, and Spain, are more focused on the disposal and valorization of hazardous waste. Finland and Taiwan lead this study with their preference for methods of disposal of non-hazardous waste and Japan leads for the transport of hazardous waste; meanwhile, South Korea, Sweden, Germany, and the Netherlands have a similar profile but less commitment. The case of Japan involves the remarkable transport of hazardous waste and is also less committed to the other types of management. Finally, the United Kingdom, Australia, and Ireland are the most backward countries in this study (they are in the red at the bottom of the Global column in Table 4).
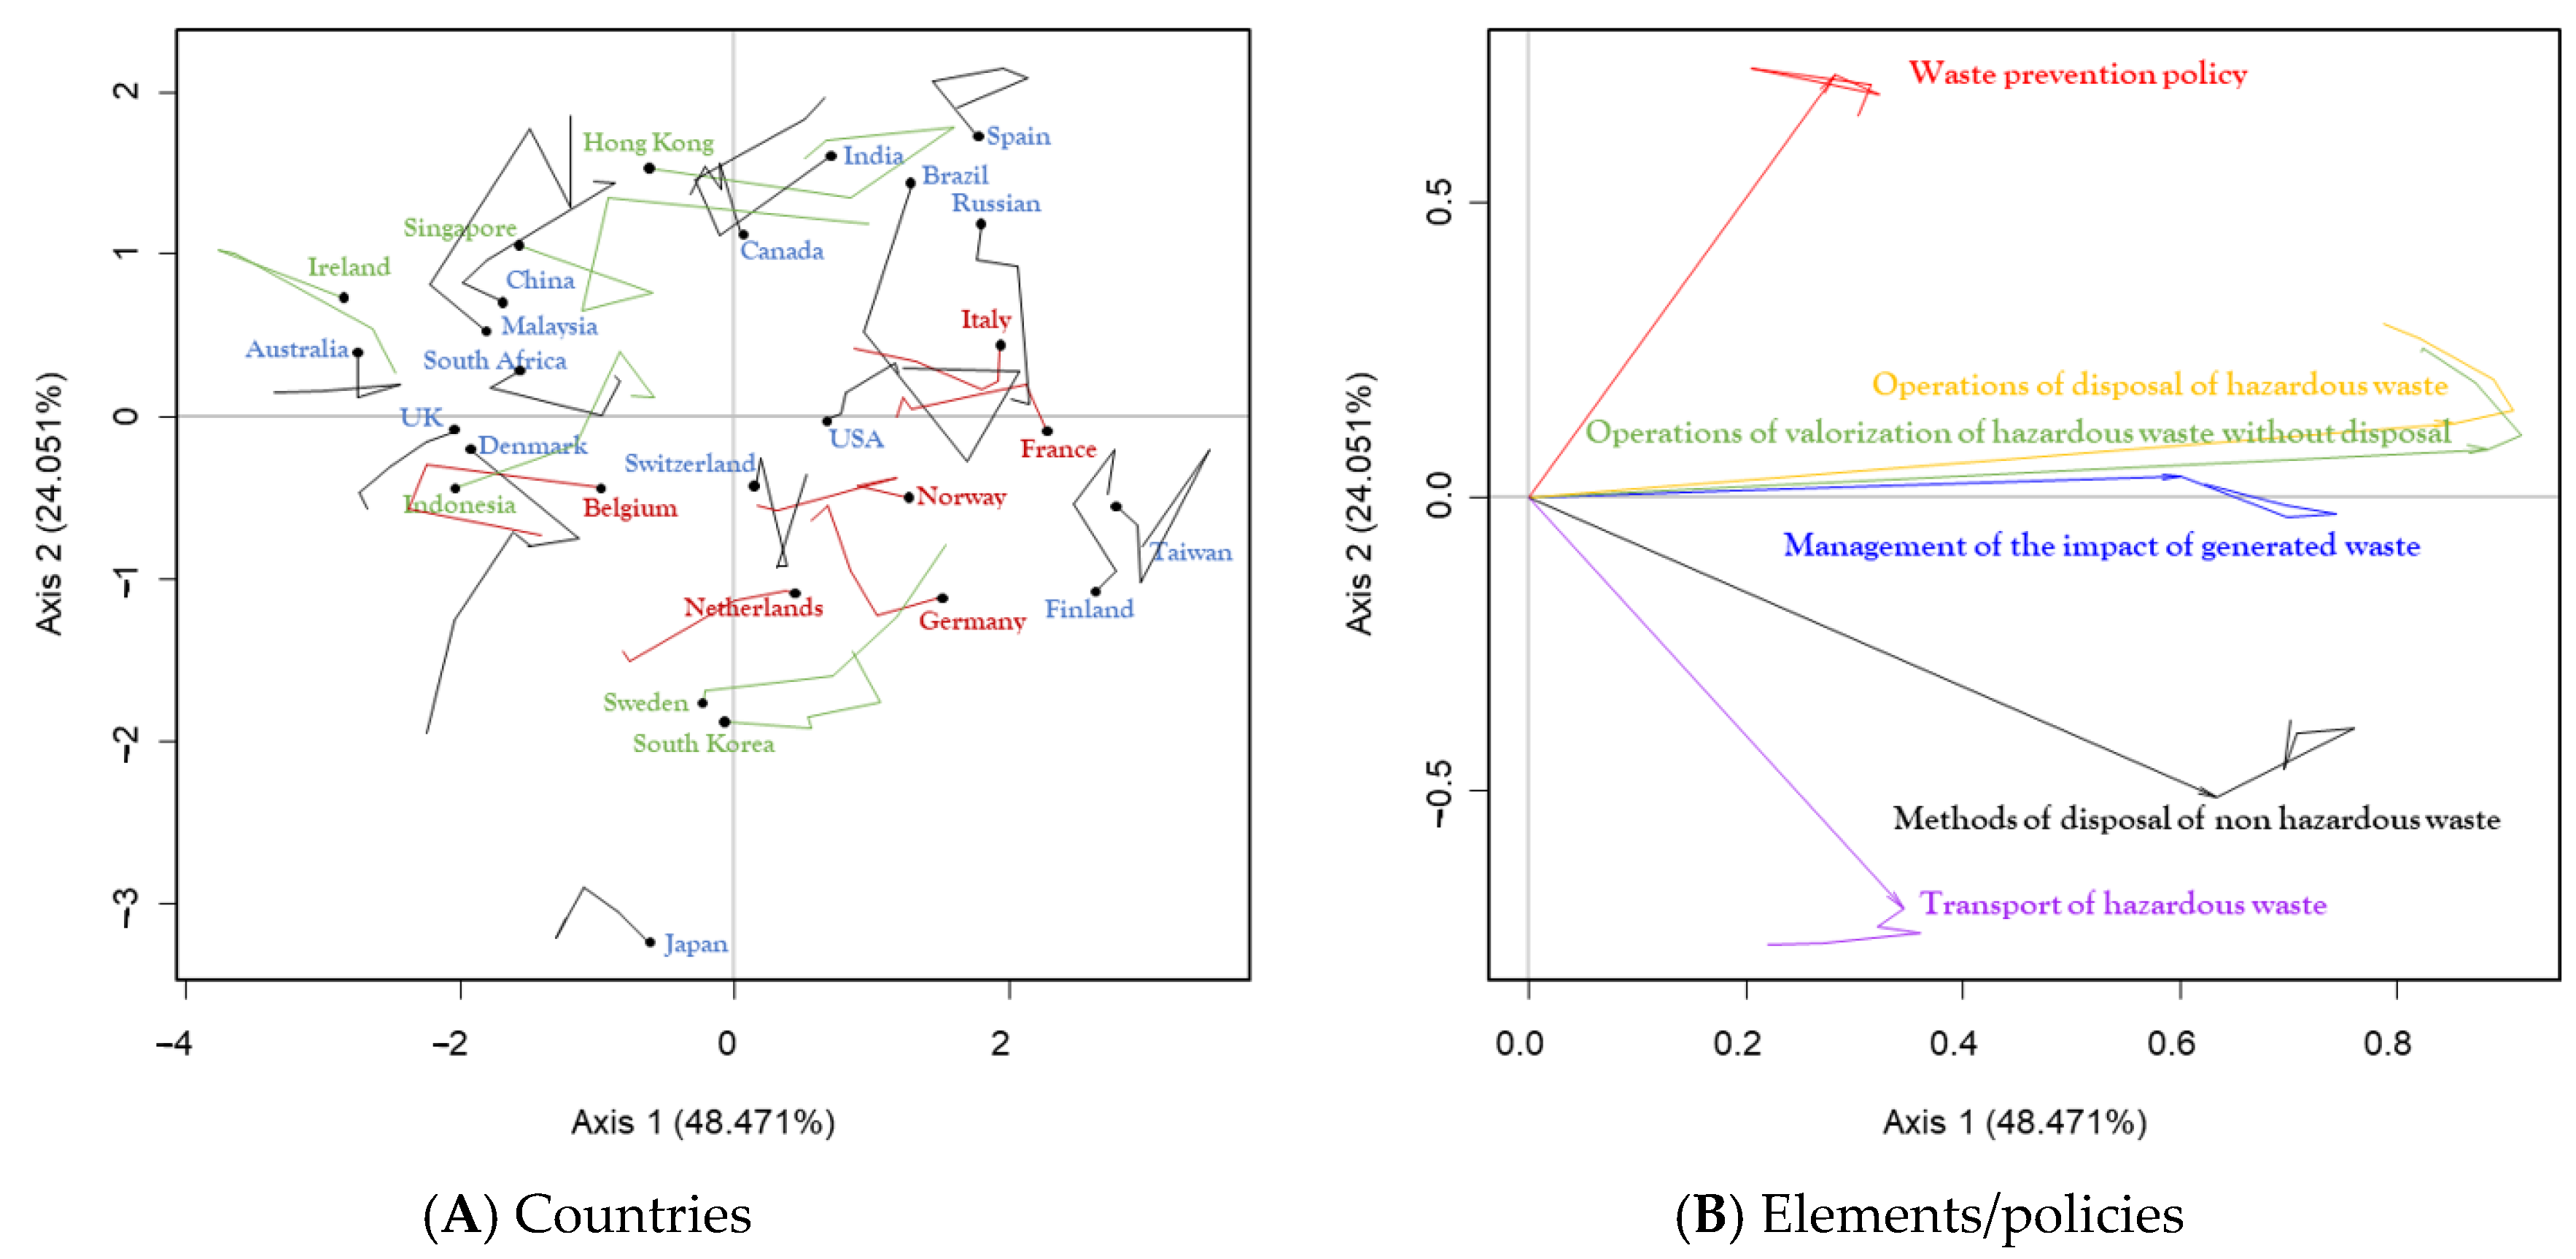
As the third point of this study, we analyze the evolution of the countries during these years via what is known as the analysis of the intrastructure or the analysis of the trajectories. The factorial plane is identical to the previous one so it captures 72% of the information. It differs in projecting each country’s position during each year of study (Figure 7).
Looking first at Figure 7B, we can see that the structure discussed in the previous point is stable over the period studied; the variables (waste management elements/practices) vary little in their position on the plane, maintaining the relationships already discussed. Figure 7A shows the evolution of the countries, marking the most relevant ones (positive in green and negative in red). We can see that some countries, e.g., Norway, Italy, Germany, France, the Netherlands, or Belgium, show a negative evolution (starting from the country’s dot, the evolution line finishes on the left and/or under it), which means that these countries have evolved more slowly than the rest. In the data, they have a percentage variation that varies from −4.0% to +4.0% (see Table 4). On the other hand, countries such as Singapore (61.1%), Indonesia (42.3%), or Sweden (34.9%) show remarkable progress in the graph while others, such as Hong Kong, South Korea, and Ireland, show an overall positive evolution; although, it is not progressive (in other words, they do not improve every year).
3.2. Analysis by Activity Sector
According to the type of business, the sector in which it operates, and the regulations to which it is subject, a company’s waste management activities can vary greatly [37]. Therefore, we complement our research by repeating the previous analysis of waste management elements/practices by country with an analysis by activity sector. The objective is the same as before, to analyze the importance that each sector of activity gives to waste management worldwide.
To achieve this, the seven-hundred and eighty companies in the sample were grouped according to their sector of activity, resulting in a total of eight different sectors (see Table 5). In this way, each sector receives a percentage of presence in each of the six variables representing the waste management elements/practices. Moreover, since this information is repeated over the 5-year time span (2016–2020), we will study its evolution at the same time as we characterize each of the activity sectors.
Before carrying out the analysis, in Table 6, we show the global business commitment to waste management by sector of activity and by year in percentage of presence of the waste management elements/practices under study. As can be seen, the information by sector of activity is very stable; we observe that the global sectoral ranking for the period of 2016–2020 is the same as in the last year of study (2020). Sectors S3 (Consumer goods) and S1 (Oil and gas) lead the ranking, with 63.7% and 63.0%; in a second step, sectors S2 (Basic material and industry) (57.8%), S8 (Other activities) (55.2%), S5 (Financial services) (54.8%), and S4 (Consumer services) (52.7%) follow; and finally, sectors S6 (Technology and telecommunications) and S7 (Real estate services) follow, with 50.0% and 49.3%. As far as the evolution is concerned, it is gradual in all of the sectors, that is to say, their commitment to waste management increases year by year, highlighting, at the top, S1 (Oil and gas), with a percentage variation of 21.4% and, at the bottom, S3 (Consumer goods), with 5.2%.
We then repeat the X-STATIS analysis for the sectors, for which we have a matrix of eight sectors × six variables × five years. We start with the analysis of the similarities between years from the interstructure study (Figure 8), where we find the same structure as for the countries: there are strong relationships between the years that take place in a gradual way. As we can see in Figure 7, the years that differ the most are the first year and the last year of the study period. This is caused by the growth of the companies’ involvement in waste management, which we discussed above. Once more, we can see two phases: 2016–2018 and 2019–2020, which were explained in Figure 4.
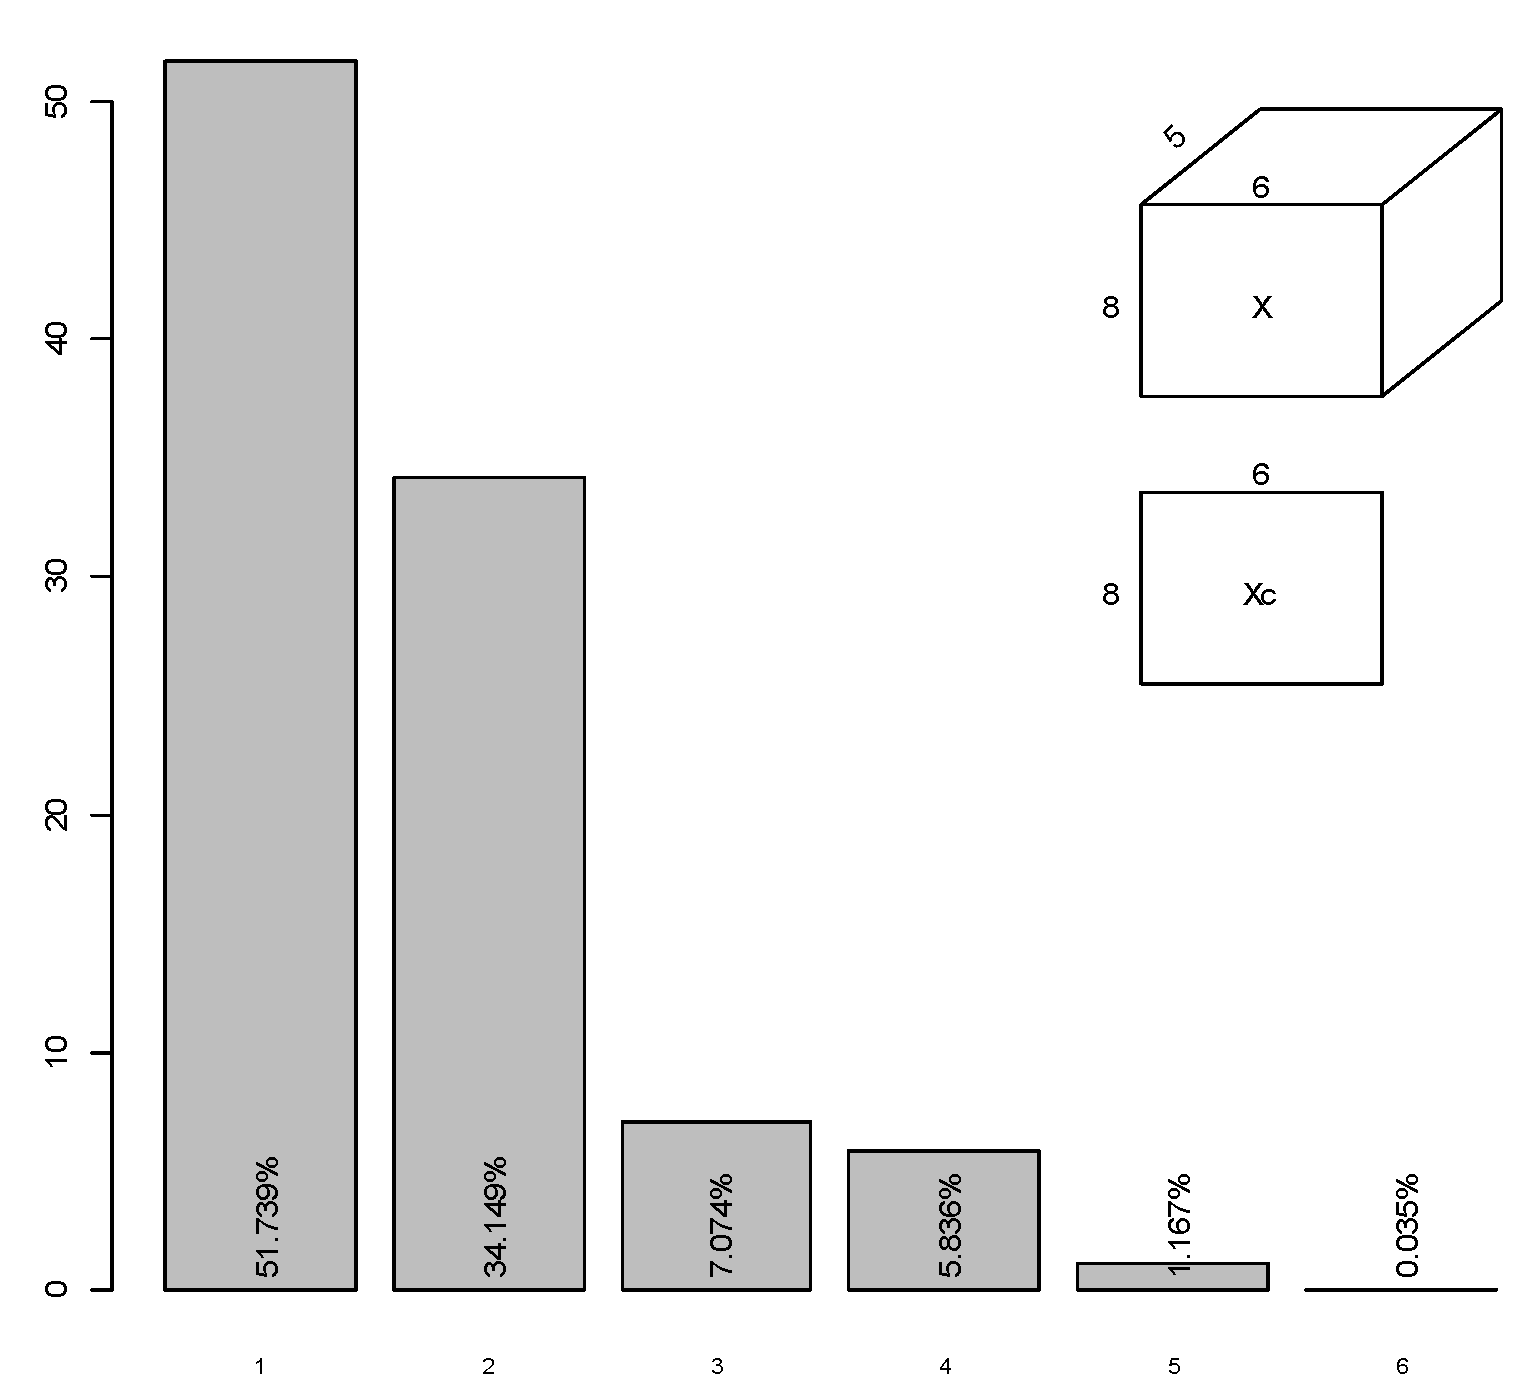
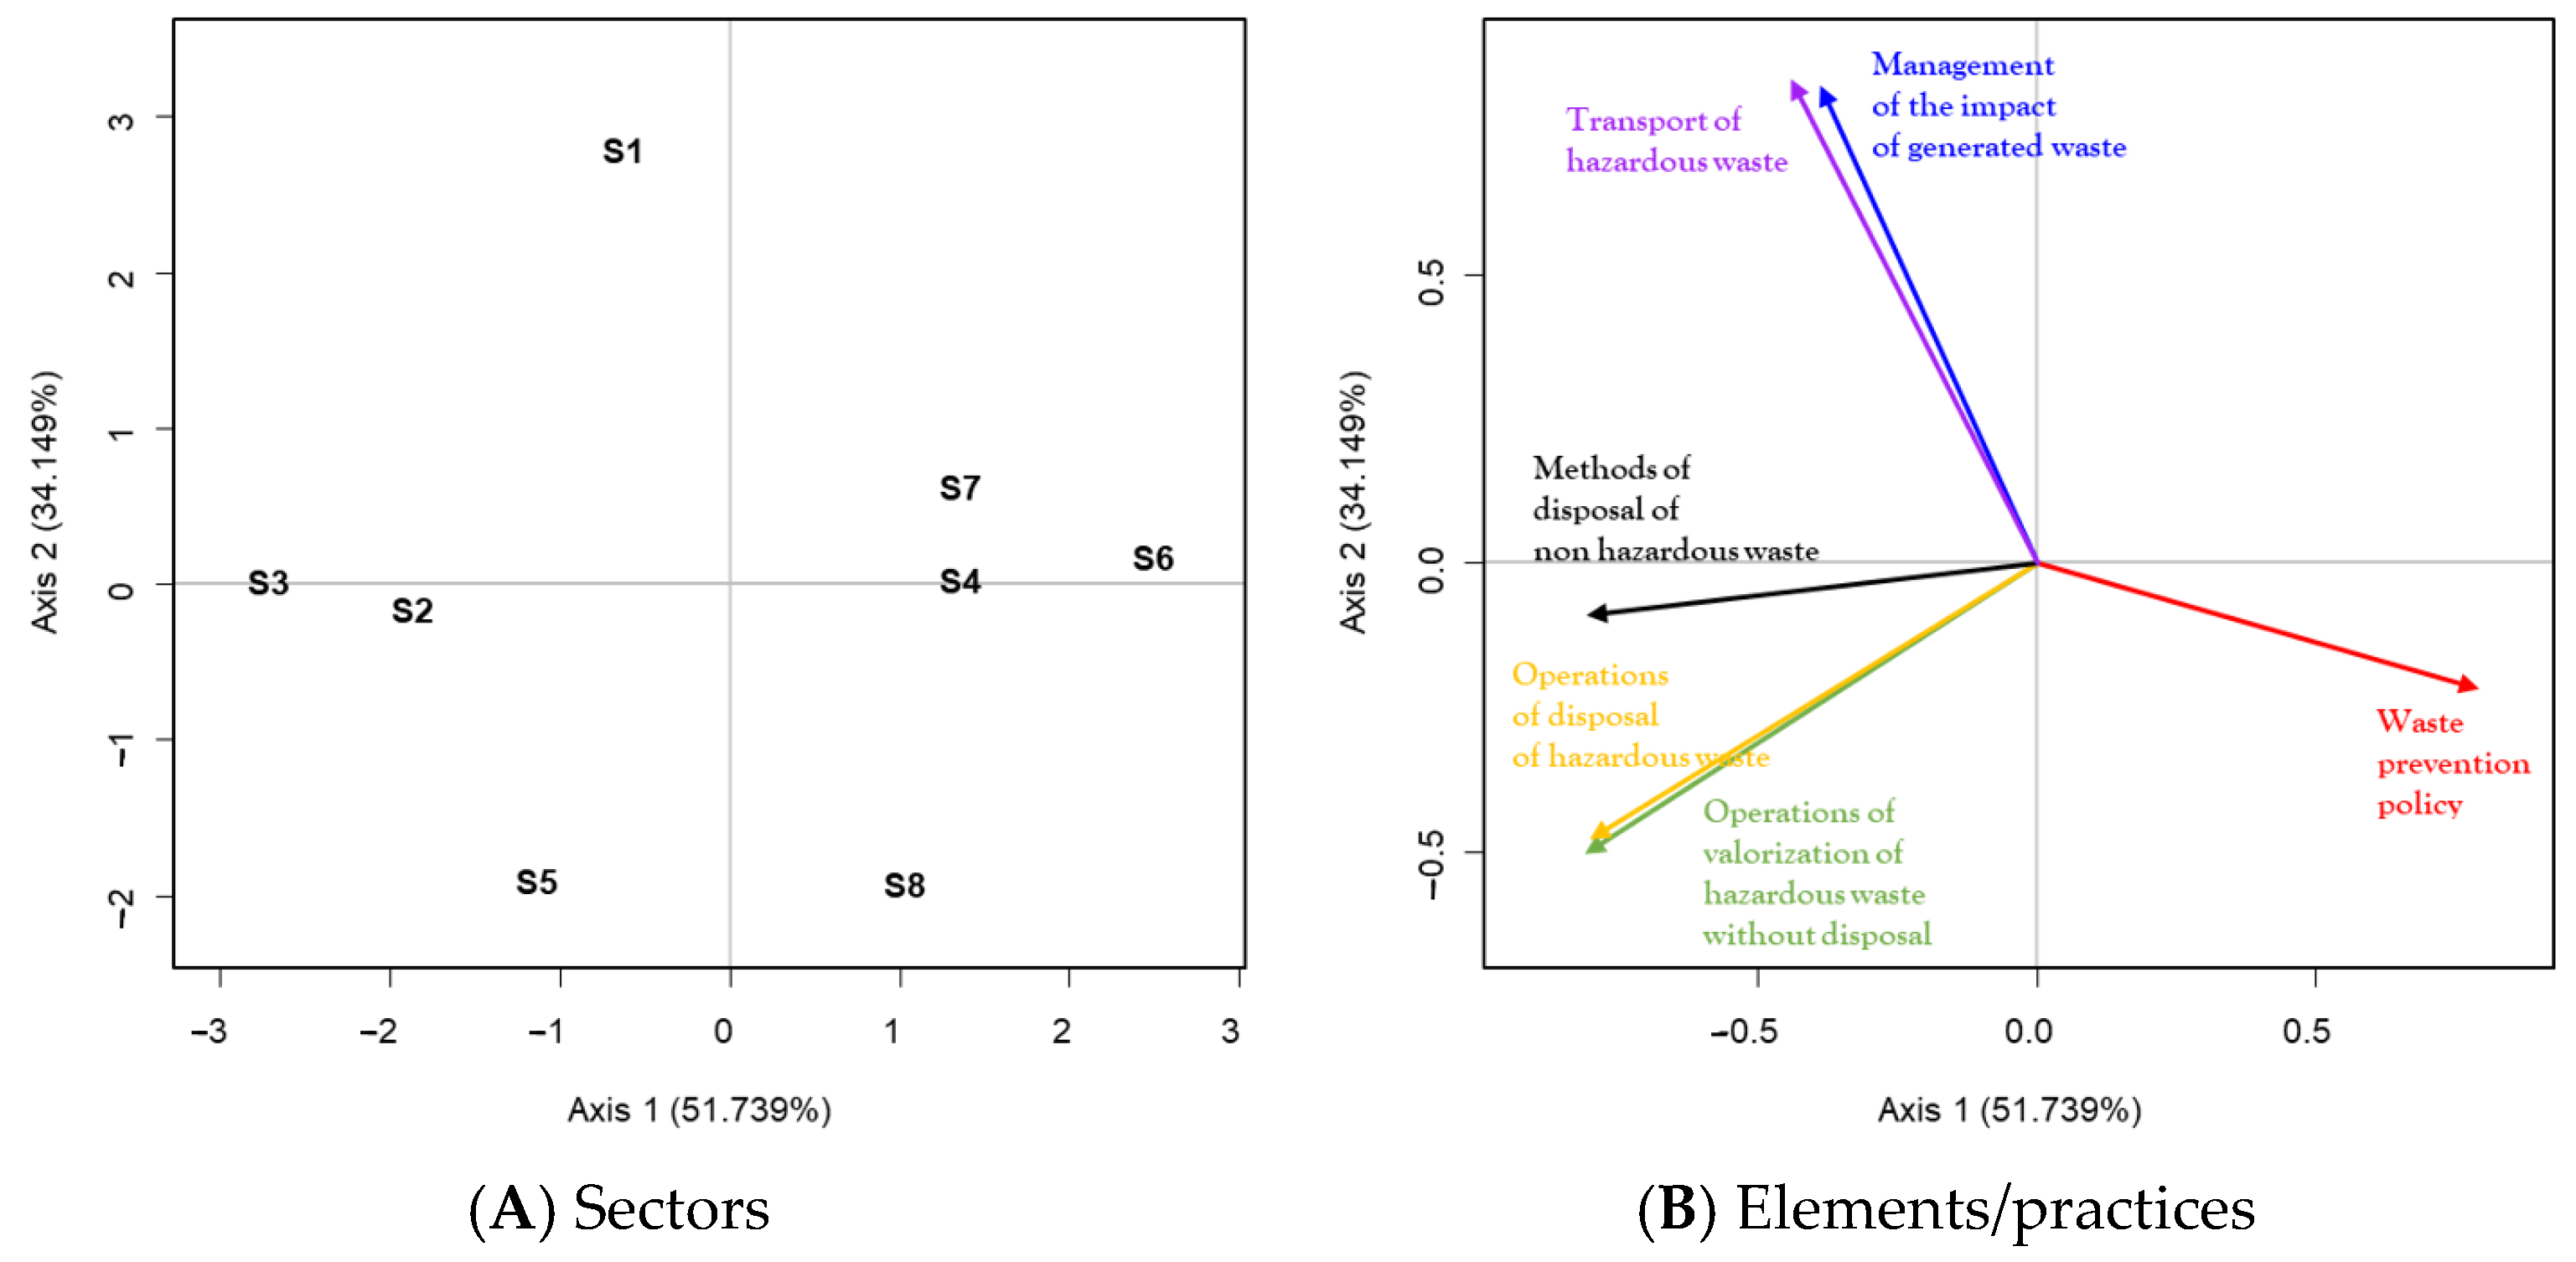
In order to summarize the information collected throughout the study period, the second stage of the analysis consists of the creation of a compromise subspace. The factorial plane 1–2 gathers 86% of the information (Figure 9) and is depicted in Figure 10. This figure shows each of the eight sectors and their positions in the plane so that each dot synthesizes the global commitment to waste management throughout the study period based on their preferences for the waste management elements/practices under study.
From the direction of the vectors in Figure 10B, we can have a characterization of each of the sectors. Thus, we can see that the sector S1 (Oil and gas) prioritizes the management of the impact of generated waste and the transport of hazardous waste while the sectors S4 (Consumer services), S6 (Technology and communications), S7 (Real estate services), and S8 (Other activities) prioritize waste prevention policies. Sectors S3 (Consumer goods) and S2 (Basic materials and industry) focus on the methods of disposal of non-hazardous waste and, in the case of S2, the operations of disposal of hazardous waste. Sector S5 (Financial services) has a similar profile to S1 and S2 but is more focused on the operations of disposal and valorization of hazardous waste.
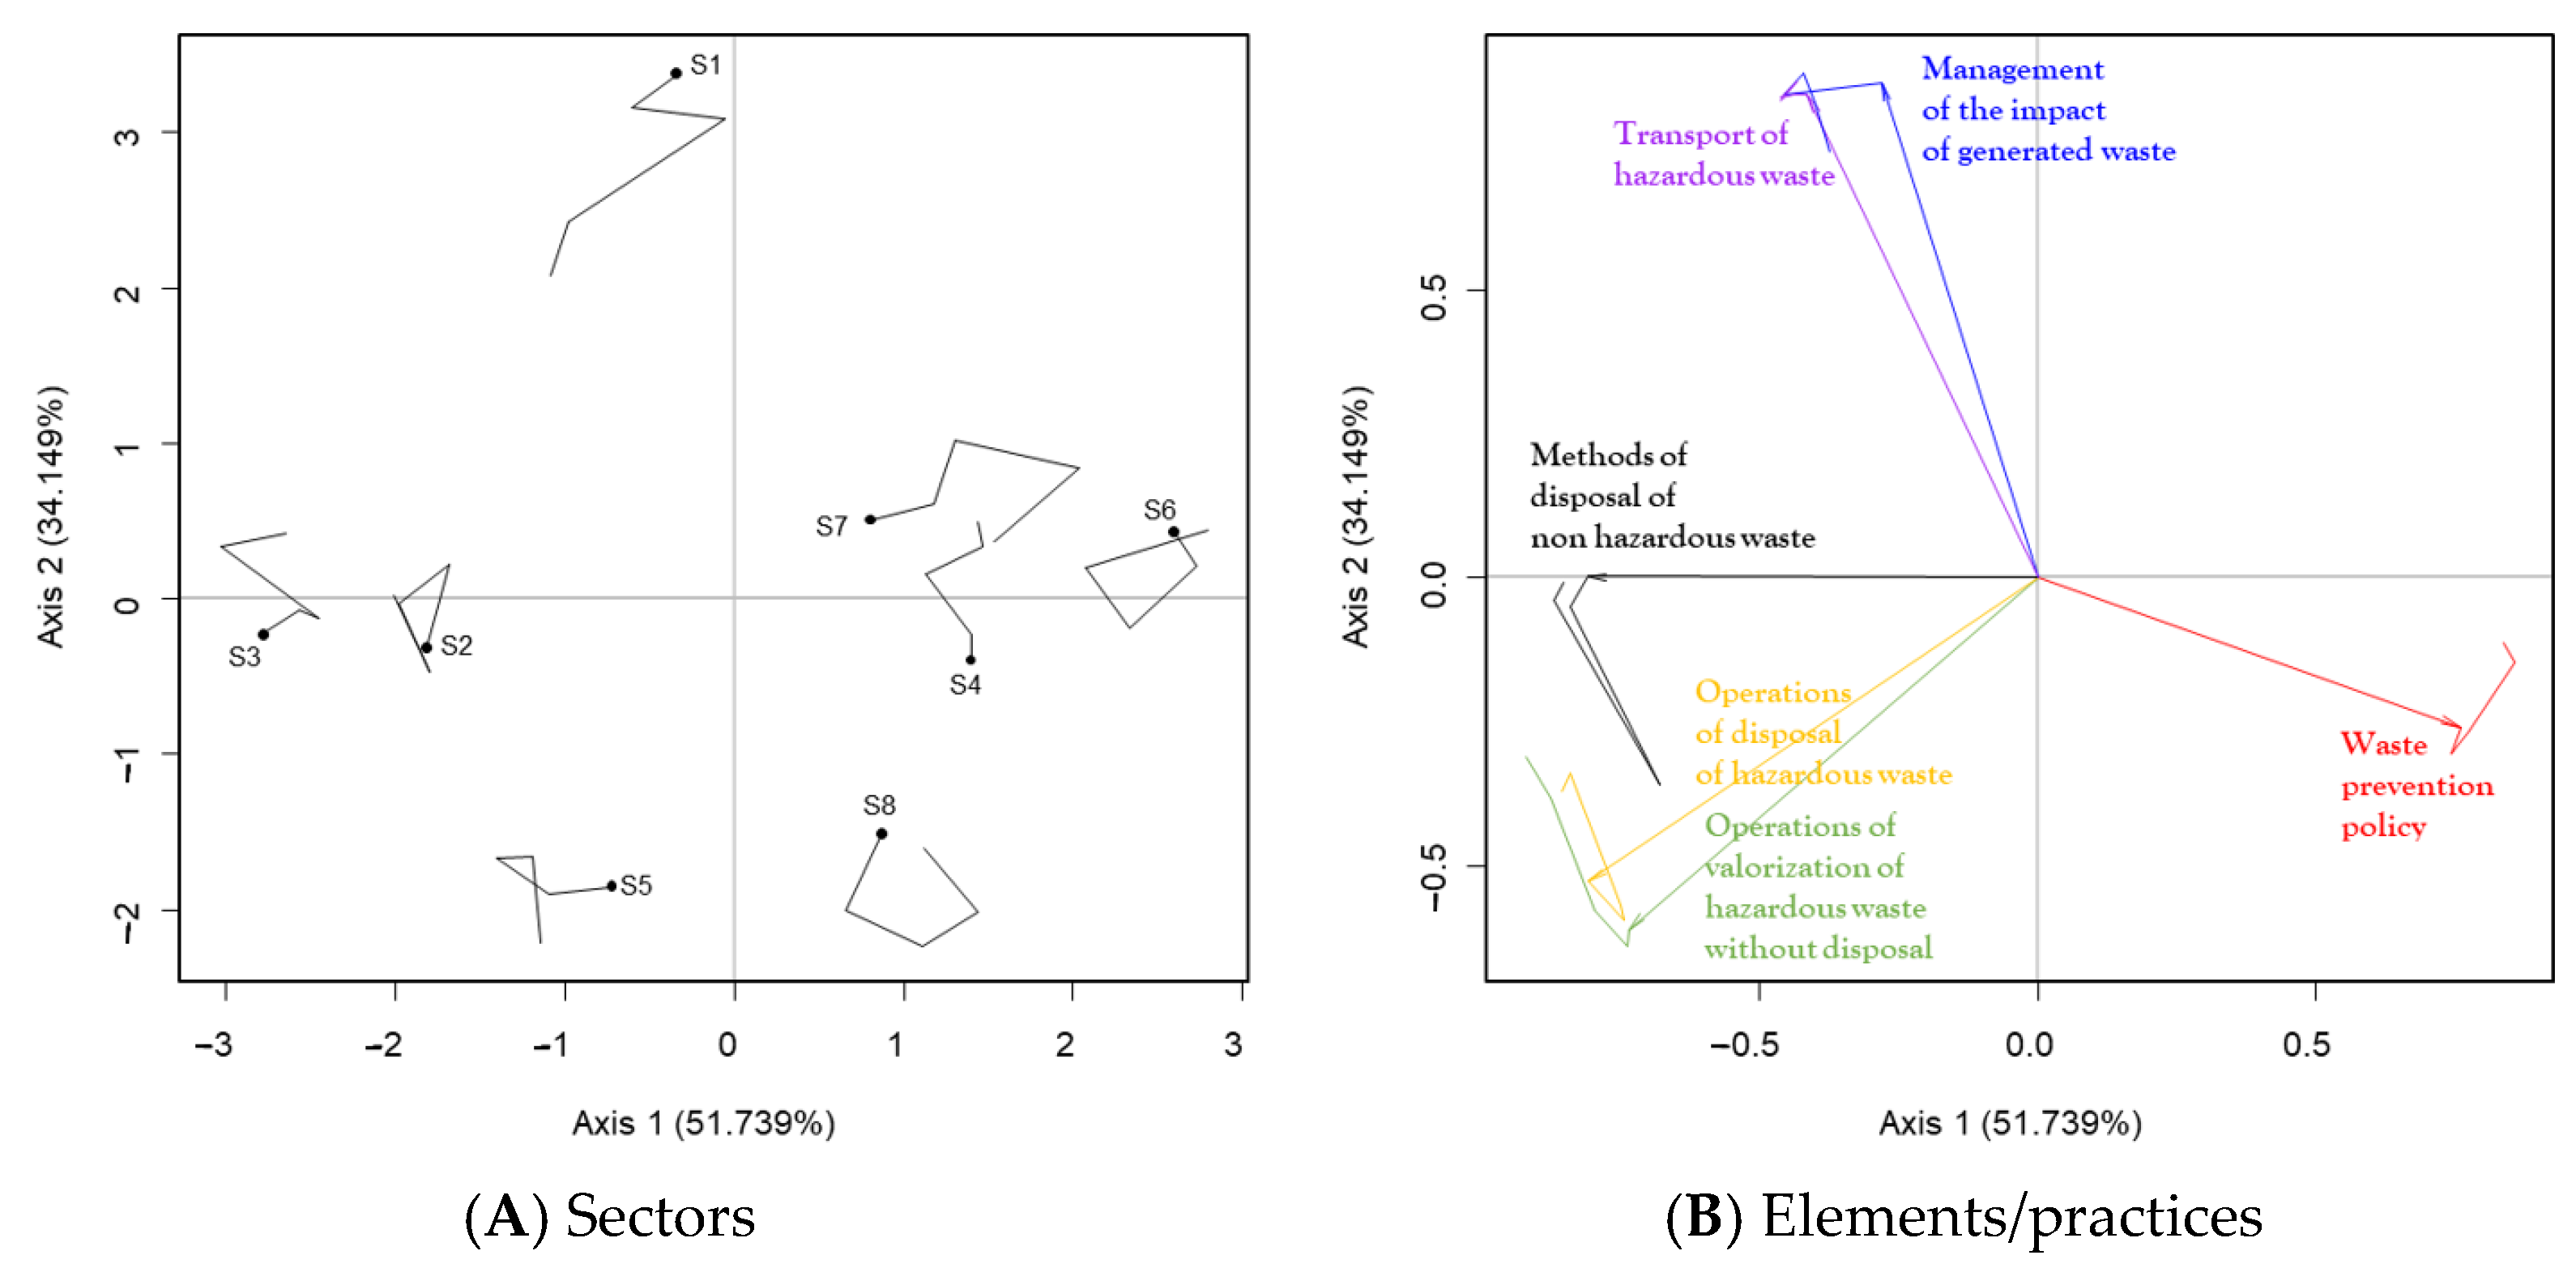
Finally, we analyze the evolution of the activity sectors through the analysis of the intrastructure or the analysis of the trajectories (Figure 11). In the first place, looking at Figure 11B, we can see that the structure discussed in the previous point is stable in the period studied. The variables vary little in their position in the plane; although, it is true that the variables positioned in the third quadrant increase their relationship in certain years of study so that the methods of disposal of non-hazardous waste are close to the operations of disposal and valorization of hazardous waste.
Regarding the sectors of activity, in Figure 11, we can see how they maintain their position on the plane throughout the study period. This leads us to consider the notion that a company’s industry is a more powerful variable to explain its waste management behavior than its country of origin since these data show that the preferences for certain waste management elements/practices are more fixed in the case of industries than in the case of countries of origin. This is due to the general waste policies that companies deploy in relation to their sector, independently of the country.
4. Discussion
The results show that the importance of waste management has increased over time on a global scale. In this evolution, we have identified two phases, 2016–2018 and 2019–2020, suggesting that companies increased their commitment to waste management during the pandemic period. This can be explained by the fact that the pandemic caused an increase in waste production and the associated risks of a health crisis [5,53]. Furthermore, the recovery plans implemented in many countries emphasize the importance of a circular economy and waste reduction [54].
In terms of waste management elements/practices, the order of priority is as follows: in first place is the management of the impacts of generated waste, which is performed by almost all of the sampled companies. The methods of disposal of non-hazardous waste are in second place, followed by the operations of disposal of hazardous waste, in the third place. Operations of valorization of hazardous waste without disposal occupy the fourth place in the ranking, being carried out by half of the companies. Transport of hazardous waste and waste prevention policies complete the ranking. These findings contrast with the priority order established by the waste management hierarchy, where prevention is the highest-ranked practice and disposal the lowest. This lends support to the warnings regarding the conceptual difficulties and shortcomings of the waste hierarchy [24]. Furthermore, our findings lend support to the contention that “in spite of the positive enounced intentions, the actual behavior put into practice maybe not as pro-environmental as desired” [13] (p. 529).
In terms of countries, Taiwan and Finland emerge as the most committed to waste management, followed by France, Spain, Russia, Italy, and the United States. Conversely, the least committed countries to waste management are the United Kingdom, Australia, and Ireland. Furthermore, some European countries, such as Italy, the Netherlands, and Belgium, show stagnation in their commitment to waste management; even Norway has decreased its commitment to waste management throughout the study period.
Our ranking, in which only three European countries (France, Spain, and Italy) are among the most committed to waste management, does not reflect the continuous efforts that are being made in the European Union in the area of waste management, including Directive 2008/98 and the European Green Deal [18]. Also, contrary to what the waste hierarchy establishes, European countries, such as Finland, Sweden, Germany, and the Netherlands, stand out for their use of non-hazardous waste disposal methods (ERNP). This is in contradiction to the European policy focus on waste prevention [20]. Comparing our results with those obtained in a recent econometric analysis of the waste management practices and competitiveness of European companies for the years spanning 2010–2016, based on Stochastic Frontier Analysis (a parametric model) [13], we found significant differences both in the position of the countries and in their evolution over time. Furthermore, our results differ from those obtained by [37] when using principal component analysis and the HJ biplot method to analyze the position of countries and sectors in terms of business actions related to the circular economy. In this study, the countries of the European Union occupy a clear leadership position (they occupy the first 11 places in a list of 25 countries). For the United Kingdom, this finding contrasts with the priority that waste policy in England has given to waste prevention since 2011, with the formulation of several measures to promote waste prevention and reduction [55].
Finally, while at the country level, various studies have shown that waste management practices are closely related to the income level of the country, with waste management being more sustainable in more economically prosperous countries [6,56]; our results suggest that companies in more developed countries are not necessarily the most committed to sustainable waste management.
We then replicated the analysis by industry to analyze the importance that companies place on waste management according to the activity sector in which they operate, observing differences between sectors that are less important in terms of the level of commitment to waste management than in terms of the evolution of this commitment over time. In addition, our results indicate that the industry to which companies belong has a greater influence on the type of waste management elements/practices than the country from which they originate, probably because the sample includes the world’s largest companies that operate in different countries and their decisions usually are based on general policies attained in any country and on the accomplishment of the regulation. These results confirm the effect of a company’s sector of activity on the type of circular economy initiatives it undertakes, as found by [37].
In spite of its interest and usefulness, this study has certain limitations that are due to the sample object of the analysis. Specifically, the sample is composed of the largest companies in the world. On the one hand, these companies are the most proactive in issues related to waste management and the circular economy [37], which may affect the results as the analysis of smaller companies would certainly yield different results. On the other hand, leading companies usually have developed and high-income countries as their country of origin, which are usually the most advanced in implementing sustainable waste management practices [56], a bias that may also affect our results. For example, most waste management practices in Latin American countries are characterized by low levels of recovery and treatment and nearly 40 percent of waste is landfilled globally while 33 percent of waste is still dumped in the open, a practice that is prevalent in low-income countries, with more than two-thirds of waste being dumped in South Asia and Sub-Saharan Africa [46].
A second limitation is related to the period of study (2016–2020). Due to data availability, it was not possible to analyze the last few years (2021 and 2022) and, therefore, the results may change as a consequence of changes in waste management practices motivated by the COVID-19 pandemic and recovery plans [5,53,54]. Finally, a third limitation is related to the binary scale used to measure the variables related to waste management practices. We are aware that in real conditions companies may implement some practices to different extents; however, since the variables in the database are expressed on a binary scale, it was not possible to assess the extent to which each practice was implemented.
5. Conclusions
As the 21st century unfolds, waste management has become a growing concern [57]. Consequently, sustainable waste management is now an objective in many countries and requires firms to manage their hazardous and non-hazardous waste in ways that maximize recycling and minimize the potential harm to the natural environment and people’s health. When it comes to corporate waste management, a firm’s waste management activities can vary greatly depending on the type of company, the sector in which it operates, and the regulations to which it must comply [37].
On this basis, this research has examined the importance that the largest companies worldwide attach to waste management by analyzing the evolution over time of the waste management practices implemented by them and how this evolution has occurred in different countries. Based on data from 780 companies from 28 countries for the period of 2016–2020 (3900 observations), we used the X-STATIS technique to conduct a multivariate analysis.
The contribution of this study to the literature is twofold. First, it provides a snapshot of corporate waste management practices at the international level, allowing the identification of the most widely used practices globally and by country, as well as the leading countries in waste management. Although waste management has been studied extensively, most studies have adopted a macro-level analysis. Furthermore, most authors have focused on specific sectors (e.g., construction, health care), waste management practices (e.g., recycling), types of waste (e.g., e-waste, food waste, solid waste), or waste sources (e.g., urban waste, domestic waste). We adopted a different and broader focus, analyzing the main waste management elements/practices implemented by companies, as well as their evolution over time, considering different sectors of activity and all types of waste. Thus, our study offers a new and original perspective, in which we combine a micro-analysis of business practices related to waste management with a macro-analysis at the country level.
Second, to perform the analysis we have used an exploratory statistical technique (X-STATIS method) previously used in studies analyzing the patterns of the adoption and evolution of corporate sustainability practices at the country or sector level [45,46,47,48,49]. This method allows us to analyze multidimensional information simultaneously and to visualize, in a graphical way, the behavior patterns of the companies related to waste management.
In addition, our results allow for an assessment of the degree to which the waste hierarchy is being followed at the level of the company. In practical terms, the findings may assist policymakers in the development and implementation of waste management policies at both national and international levels, in particular, those that promote sustainable waste management by companies focusing on sectors, as this is a challenge that requires the joint work of all stakeholders (governments, companies, citizens, etc.).
Building on the results of this study and considering the limitations mentioned above, future studies could expand the sample to include smaller firms and, thus, a larger number of countries. Similarly, future studies could extend the study period to provide an updated picture of the issue. In addition, they could deepen the analysis of the differences between the 2016–208 subperiod and the 2019–2020 subperiod by using other statistical or mathematical methods. Future studies could further explore the impact of the COVID-19 pandemic and recovery plans on waste management practices. Finally, future research could develop mathematical models or algorithms that can be developed or improved in the field of waste management.
Author Contributions
Conceptualization, B.A.-G., S.M., F.D. and F.M.S.-R.; methodology, B.A.-G. and F.M.S.-R.; software, F.M.S.-R.; validation, B.A.-G. and F.M.S.-R.; formal analysis, B.A.-G., S.M., F.D. and F.M.S.-R.; investigation, B.A.-G., S.M., F.D. and F.M.S.-R.; writing—original draft preparation, writing—review and editing, B.A.-G., S.M., F.D. and F.M.S.-R.; funding acquisition, F.M.S.-R. All authors have read and agreed to the published version of the manuscript.
Funding
This research received no external funding.
Data Availability Statement
Data were obtained from a private database. They could be available on request from the corresponding author.
Acknowledgments
The authors express their gratitude to the three anonymous reviewers for the comments and proposals. Also, we thank Victor Amor-Esteban for his suggestions and comments on the empirical model and Isabel María García-Sánchez for her comments in the previous versions of the paper.
Conflicts of Interest
The authors declare no conflict of interest.
Appendix A

Table A1.
Business commitment to waste management by country (% presence), by waste management element/practice, and by year.
Table A1.
Business commitment to waste management by country (% presence), by waste management element/practice, and by year.
| 2016 | 2017 | 2018 | 2019 | 2020 | ||||||||||||||||||||||||||
|---|---|---|---|---|---|---|---|---|---|---|---|---|---|---|---|---|---|---|---|---|---|---|---|---|---|---|---|---|---|---|
| Country | WPP | MIW | OVH | ODH | MDNW | THW | WPP | MIW | OVH | ODH | MDNW | THW | WPP | MIW | OVH | ODH | MDNW | THW | WPP | MIW | OVH | ODH | MDNW | THW | WPP | MIW | OVH | ODH | MDNW | THW |
| Australia | 16% | 73% | 32% | 30% | 41% | 0% | 11% | 78% | 32% | 30% | 43% | 0% | 19% | 84% | 35% | 32% | 49% | 5% | 19% | 86% | 35% | 30% | 49% | 5% | 19% | 86% | 35% | 27% | 46% | 5% |
| Belgium | 13% | 75% | 50% | 50% | 63% | 13% | 13% | 75% | 38% | 38% | 50% | 13% | 13% | 75% | 38% | 38% | 63% | 13% | 13% | 100% | 38% | 38% | 50% | 25% | 13% | 100% | 38% | 38% | 50% | 25% |
| Brazil | 45% | 91% | 64% | 64% | 73% | 0% | 27% | 91% | 64% | 64% | 82% | 0% | 18% | 100% | 73% | 73% | 91% | 9% | 27% | 100% | 82% | 82% | 91% | 9% | 27% | 100% | 73% | 73% | 82% | 9% |
| Canada | 39% | 86% | 54% | 54% | 57% | 7% | 43% | 86% | 57% | 57% | 57% | 4% | 39% | 93% | 61% | 61% | 54% | 4% | 43% | 96% | 61% | 61% | 54% | 4% | 39% | 96% | 61% | 64% | 54% | 4% |
| China | 43% | 86% | 29% | 29% | 29% | 29% | 43% | 86% | 29% | 29% | 29% | 29% | 43% | 86% | 43% | 43% | 29% | 29% | 43% | 100% | 57% | 57% | 14% | 29% | 43% | 100% | 57% | 57% | 14% | 29% |
| Denmark | 14% | 79% | 36% | 36% | 43% | 14% | 14% | 86% | 43% | 43% | 50% | 29% | 14% | 86% | 43% | 43% | 50% | 29% | 14% | 86% | 43% | 43% | 50% | 43% | 14% | 86% | 43% | 36% | 50% | 64% |
| Finland | 18% | 82% | 91% | 91% | 91% | 36% | 18% | 91% | 91% | 91% | 91% | 36% | 27% | 91% | 91% | 91% | 91% | 36% | 27% | 100% | 91% | 91% | 91% | 27% | 27% | 100% | 91% | 91% | 91% | 36% |
| France | 41% | 93% | 72% | 72% | 76% | 37% | 48% | 98% | 70% | 67% | 74% | 43% | 50% | 100% | 61% | 61% | 70% | 46% | 57% | 100% | 63% | 61% | 72% | 48% | 54% | 100% | 65% | 63% | 72% | 52% |
| Germany | 10% | 90% | 70% | 73% | 73% | 30% | 10% | 90% | 70% | 70% | 70% | 37% | 13% | 97% | 67% | 67% | 70% | 33% | 23% | 97% | 67% | 67% | 70% | 33% | 23% | 97% | 67% | 67% | 70% | 37% |
| Hong Kong | 42% | 89% | 47% | 42% | 42% | 5% | 37% | 95% | 68% | 63% | 58% | 5% | 47% | 100% | 84% | 74% | 63% | 5% | 47% | 100% | 74% | 63% | 58% | 5% | 42% | 100% | 74% | 63% | 58% | 5% |
| India | 50% | 86% | 64% | 71% | 43% | 21% | 43% | 86% | 50% | 64% | 50% | 21% | 50% | 93% | 50% | 64% | 43% | 21% | 57% | 100% | 64% | 71% | 43% | 21% | 64% | 100% | 64% | 71% | 50% | 21% |
| Indonesia | 8% | 83% | 33% | 42% | 25% | 25% | 17% | 83% | 50% | 50% | 42% | 25% | 17% | 83% | 67% | 67% | 42% | 17% | 17% | 92% | 67% | 67% | 42% | 25% | 17% | 92% | 67% | 67% | 42% | 25% |
| Ireland | 20% | 80% | 20% | 30% | 30% | 0% | 20% | 70% | 30% | 30% | 20% | 0% | 20% | 80% | 30% | 30% | 20% | 0% | 20% | 80% | 50% | 50% | 40% | 10% | 20% | 80% | 50% | 60% | 40% | 20% |
| Italy | 38% | 94% | 69% | 69% | 75% | 19% | 31% | 94% | 75% | 75% | 81% | 19% | 31% | 100% | 75% | 75% | 81% | 19% | 38% | 100% | 69% | 69% | 81% | 19% | 38% | 100% | 69% | 63% | 75% | 19% |
| Japan | 13% | 93% | 17% | 15% | 76% | 64% | 14% | 94% | 19% | 17% | 76% | 66% | 15% | 97% | 21% | 21% | 73% | 68% | 17% | 99% | 20% | 20% | 75% | 74% | 19% | 100% | 22% | 22% | 77% | 77% |
| Malaysia | 29% | 79% | 29% | 36% | 50% | 7% | 29% | 86% | 29% | 29% | 36% | 7% | 57% | 86% | 43% | 36% | 50% | 7% | 50% | 93% | 43% | 50% | 50% | 14% | 64% | 100% | 36% | 43% | 43% | 14% |
| The Netherlands | 13% | 93% | 53% | 47% | 67% | 27% | 13% | 93% | 53% | 53% | 73% | 27% | 13% | 100% | 47% | 47% | 73% | 27% | 7% | 100% | 40% | 40% | 73% | 27% | 13% | 100% | 40% | 40% | 73% | 33% |
| Norway | 13% | 88% | 75% | 75% | 63% | 25% | 13% | 88% | 75% | 75% | 63% | 25% | 13% | 100% | 75% | 75% | 63% | 25% | 13% | 100% | 63% | 63% | 63% | 25% | 13% | 100% | 63% | 63% | 63% | 25% |
| Russian | 25% | 88% | 88% | 88% | 63% | 0% | 25% | 88% | 88% | 88% | 75% | 0% | 25% | 100% | 88% | 88% | 75% | 0% | 25% | 100% | 88% | 88% | 75% | 25% | 25% | 100% | 88% | 88% | 75% | 25% |
| Singapore | 38% | 88% | 25% | 25% | 50% | 0% | 38% | 88% | 38% | 38% | 75% | 0% | 38% | 88% | 38% | 38% | 75% | 0% | 50% | 100% | 38% | 38% | 63% | 0% | 50% | 100% | 63% | 63% | 88% | 0% |
| South Africa | 14% | 84% | 43% | 54% | 51% | 3% | 14% | 89% | 41% | 54% | 57% | 0% | 14% | 92% | 41% | 54% | 62% | 3% | 19% | 89% | 38% | 51% | 62% | 3% | 22% | 95% | 35% | 51% | 59% | 3% |
| South Korea | 8% | 77% | 54% | 54% | 77% | 38% | 8% | 85% | 62% | 62% | 77% | 46% | 8% | 92% | 62% | 62% | 77% | 46% | 15% | 100% | 62% | 62% | 85% | 46% | 23% | 100% | 62% | 62% | 77% | 54% |
| Spain | 38% | 92% | 88% | 83% | 42% | 8% | 42% | 96% | 92% | 92% | 50% | 8% | 46% | 100% | 92% | 92% | 50% | 8% | 50% | 100% | 83% | 83% | 54% | 8% | 54% | 100% | 83% | 83% | 67% | 13% |
| Sweden | 5% | 81% | 57% | 57% | 52% | 48% | 5% | 81% | 62% | 62% | 57% | 48% | 10% | 90% | 71% | 71% | 67% | 52% | 14% | 95% | 76% | 76% | 76% | 43% | 24% | 95% | 81% | 81% | 81% | 43% |
| Switzerland | 14% | 82% | 64% | 59% | 64% | 18% | 18% | 91% | 59% | 55% | 64% | 18% | 14% | 95% | 64% | 59% | 68% | 32% | 14% | 95% | 68% | 64% | 68% | 36% | 27% | 95% | 73% | 68% | 73% | 36% |
| Taiwan | 30% | 100% | 80% | 80% | 70% | 50% | 40% | 100% | 90% | 90% | 80% | 50% | 30% | 100% | 90% | 90% | 80% | 60% | 40% | 100% | 90% | 90% | 80% | 60% | 40% | 100% | 90% | 90% | 80% | 60% |
| UK | 21% | 87% | 24% | 23% | 47% | 12% | 18% | 88% | 23% | 23% | 46% | 11% | 15% | 92% | 23% | 24% | 47% | 11% | 16% | 94% | 24% | 25% | 49% | 15% | 15% | 96% | 25% | 26% | 50% | 16% |
| USA | 46% | 96% | 51% | 54% | 65% | 32% | 45% | 97% | 54% | 58% | 69% | 33% | 44% | 97% | 56% | 61% | 71% | 34% | 45% | 99% | 58% | 61% | 73% | 36% | 46% | 99% | 59% | 60% | 74% | 39% |
Appendix B
Table A2.
Business commitment to waste management by sector of activity (% presence), by waste management element/practice, and by year.
Table A2.
Business commitment to waste management by sector of activity (% presence), by waste management element/practice, and by year.
| 2016 | 2017 | 2018 | 2019 | 2020 | ||||||||||||||||||||||||||
|---|---|---|---|---|---|---|---|---|---|---|---|---|---|---|---|---|---|---|---|---|---|---|---|---|---|---|---|---|---|---|
| WPP | MIW | OVH | ODH | MDNW | THW | WPP | MIW | OVH | ODH | MDNW | THW | WPP | MIW | OVH | ODH | MDNW | THW | WPP | MIW | OVH | ODH | MDNW | THW | WPP | MIW | OVH | ODH | MDNW | THW | |
| S1 | 11% | 100% | 33% | 37% | 56% | 74% | 11% | 100% | 37% | 41% | 59% | 78% | 15% | 100% | 41% | 44% | 52% | 78% | 22% | 100% | 48% | 52% | 63% | 78% | 26% | 100% | 52% | 52% | 67% | 81% |
| S2 | 7% | 92% | 52% | 52% | 70% | 26% | 8% | 96% | 53% | 51% | 69% | 29% | 12% | 97% | 57% | 56% | 73% | 32% | 18% | 97% | 59% | 58% | 73% | 36% | 17% | 99% | 59% | 57% | 77% | 37% |
| S3 | 23% | 96% | 62% | 65% | 72% | 46% | 22% | 96% | 63% | 63% | 72% | 51% | 20% | 97% | 65% | 65% | 70% | 51% | 20% | 100% | 67% | 66% | 73% | 52% | 20% | 100% | 67% | 66% | 70% | 59% |
| S4 | 36% | 86% | 38% | 37% | 62% | 25% | 35% | 89% | 38% | 38% | 64% | 26% | 36% | 95% | 42% | 41% | 65% | 28% | 37% | 97% | 41% | 40% | 66% | 29% | 39% | 98% | 41% | 41% | 67% | 30% |
| S5 | 14% | 84% | 57% | 57% | 56% | 17% | 14% | 88% | 61% | 61% | 60% | 16% | 14% | 93% | 62% | 63% | 65% | 18% | 16% | 95% | 61% | 61% | 66% | 21% | 17% | 94% | 63% | 62% | 69% | 23% |
| S6 | 39% | 92% | 36% | 33% | 44% | 19% | 39% | 92% | 36% | 36% | 47% | 19% | 39% | 94% | 39% | 42% | 53% | 19% | 39% | 97% | 42% | 44% | 56% | 28% | 42% | 97% | 39% | 39% | 53% | 31% |
| S7 | 24% | 93% | 41% | 38% | 55% | 25% | 21% | 93% | 39% | 38% | 54% | 27% | 21% | 96% | 37% | 35% | 59% | 28% | 28% | 97% | 37% | 38% | 56% | 30% | 27% | 97% | 42% | 42% | 58% | 30% |
| S8 | 35% | 86% | 48% | 51% | 54% | 13% | 37% | 87% | 54% | 56% | 57% | 13% | 39% | 90% | 54% | 57% | 57% | 14% | 41% | 94% | 53% | 56% | 58% | 15% | 45% | 96% | 54% | 58% | 60% | 18% |
References
- Shahab, Y.; Gull, A.A.; Rind, A.A.; Sarang, A.A.A.; Ahsan, T. Do corporate governance mechanisms curb the anti-environmental behavior of firms worldwide? An illustration through waste management. J. Environ. Manag. 2022, 310, 114707. [Google Scholar] [CrossRef] [PubMed]
- Wulansari, W.; Adhariani, D. Corporate waste disclosure, risk-taking and foreign ownership: Evidence from Indonesia. Bus. Strateg. Dev. 2023, 6, 205–225. [Google Scholar] [CrossRef]
- Giusti, L. A review of waste management practices and their impact on human health. Waste Manag. 2009, 29, 2227–2239. [Google Scholar] [CrossRef]
- Chen, D.M.C.; Bodirsky, B.L.; Krueger, T.; Mishra, A.; Popp, A. The world’s growing municipal solid waste: Trends and impacts. Environ. Res. Lett. 2020, 15, 074021. [Google Scholar] [CrossRef]
- Hantoko, D.; Li, X.; Pariatamby, A.; Yoshikawa, K.; Horttanainen, M.; Yan, M. Challenges and practices on waste management and disposal during COVID-19 pandemic. J. Environ. Manag. 2021, 286, 112140. [Google Scholar] [CrossRef]
- Abubakar, I.R.; Maniruzzaman, K.M.; Dano, U.L.; AlShihri, F.S.; AlShammari, M.S.; Ahmed, S.M.S.; Al-Gehlani, W.A.G.; Alrawaf, T.I. Environmental sustainability impacts of solid waste management practices in the global South. Int. J. Environ. Res. Public Health 2022, 19, 12717. [Google Scholar] [CrossRef]
- Chandra, S.; Ganguly, R. Assessment of landfill gases by LandGEM and energy recovery potential from municipal solid waste of Kanpur city, India. Heliyon 2023, 9, e15187. [Google Scholar] [CrossRef]
- Chandra, S.; Ganguly, R.; Parmar, D. Assessment of gas generation and energy recovery from municipal solid waste in Kanpur city, India. Environ. Monit. Assess. 2023, 195, 1107. [Google Scholar] [CrossRef]
- Gull, A.A.; Atif, M.; Ahsan, T.; Derouiche, I. Does waste management affect firm performance? International evidence. Econ. Model. 2022, 114, 105932. [Google Scholar] [CrossRef]
- Benjamin, S.J.; Biswas, P.K.; Wellalage, N.H.; Man, Y. Environmental disclosure and its relation to waste performance. Meditari Account. Res. 2022. [Google Scholar] [CrossRef]
- Bogdan, V.; Sabău-Popa, C.D.; Boloș, M.I.; Popa, D.N.; Beleneși, M. Tracking Waste Management Information Disclosure Behavior Connected to Financial Performance through Moderating Variables. Int. J. Environ. Res. Public Health 2022, 19, 13068. [Google Scholar] [CrossRef] [PubMed]
- Levänen, J.; Park, S.; Rosca, E. Circular solutions in developing countries: Coping with sustainability tensions by means of technical functionality and business model relevance. Bus. Strateg. Dev. 2023, 6, 75–94. [Google Scholar] [CrossRef]
- Agovino, M.; Matricano, D.; Garofalo, A. Waste management and competitiveness of firms in Europe: A stochastic frontier approach. Waste Manag. 2020, 102, 528–540. [Google Scholar] [CrossRef] [PubMed]
- Das, S.; Lee, S.H.; Kumar, P.; Kim, K.H.; Lee, S.S.; Bhattacharya, S.S. Solid waste management: Scope and the challenge of sustainability. J. Clean. Prod. 2019, 228, 658–678. [Google Scholar] [CrossRef]
- Wilson, D.C.; Rodic, L.; Modak, P.; Soos, R.; Carpintero, A.; Velis, K.; Iyer, M.; Simonett, O. Global Waste Management Outlook Report; UNEP: New York, NY, USA, 2015. [Google Scholar]
- Seadon, J.K. Integrated waste management—Looking beyond the solid waste horizon. Waste Manag. 2006, 26, 1327–1336. [Google Scholar] [CrossRef]
- Ray, A. Waste management in developing Asia: Can trade and cooperation help? J. Environ. Dev. 2008, 17, 3–25. [Google Scholar] [CrossRef]
- Zorpas, A.A. Strategy development in the framework of waste management. Sci. Total Environ. 2020, 716, 137088. [Google Scholar] [CrossRef]
- Wingfield, S.; Lim, M. The United Nations Basel convention’s global plastic waste partnership: History, evolution and progress. In Microplastic Environment Pattern Process; Springer: Berlin/Heidelberg, Germany, 2022; pp. 323–331. [Google Scholar]
- Zorpas, A.A.; Lasaridi, K.; Abeliotis, K.; Voukkali, I.; Loizia, P.; Fitiri, L.; Chroni, L.; Bikaki, N. Waste prevention campaign regarding the Waste Framework Directive. Fresenius Environ. Bull. 2014, 23, 2876–2883. [Google Scholar]
- Zhamiyeva, R.; Sultanbekova, G.; Balgimbekova, G.; Mussin, K.; Abzalbekova, M.; Kozhanov, M. Problems of the effectiveness of the implementation of international agreements in the field of waste management: The study of the experience of Kazakhstan in the context of the applicability of European legal practices. Int. Environ. Agreem. Politics Law Econ. 2022, 22, 177–199. [Google Scholar] [CrossRef]
- Gharfalkar, M.; Court, R.; Campbell, C.; Ali, Z.; Hillier, G. Analysis of waste hierarchy in the European waste directive 2008/98/EC. Waste Manag. 2015, 39, 305–313. [Google Scholar] [CrossRef]
- Pires, A.; Martinho, G. Waste hierarchy index for circular economy in waste management. Waste Manag. 2019, 95, 298–305. [Google Scholar] [CrossRef] [PubMed]
- Van Ewijk, S.; Stegemann, J.A. Limitations of the waste hierarchy for achieving absolute reductions in material throughput. J. Clean. Prod. 2016, 132, 122–128. [Google Scholar] [CrossRef]
- Wolf, K. Source reduction and the waste management hierarchy. JAPCA 1988, 38, 681–686. [Google Scholar] [CrossRef]
- Sakai, S.-I.; Yano, J.; Hirai, Y.; Asari, M.; Yanagawa, R.; Matsuda, T.; Yoshida, H.; Yamada, T.; Kajiwara, N.; Suzuki, G.; et al. Waste prevention for sustainable resource and waste management. J. Mater. Cycles Waste Manag. 2017, 19, 1295–1313. [Google Scholar] [CrossRef]
- Khan, A.H.; López-Maldonado, E.A.; Khan, N.A.; Villarreal-Gómez, L.J.; Munshi, F.M.; Alsabhan, A.H.; Perveen, K. Current solid waste management strategies and energy recovery in developing countries-State of art review. Chemosphere 2022, 291, 133088. [Google Scholar] [CrossRef] [PubMed]
- Yano, J.; Sakai, S.I. Waste prevention indicators and their implications from a life cycle perspective: A review. J. Mater. Cycles Waste Manag. 2016, 18, 38–56. [Google Scholar] [CrossRef]
- Kabongo, J.D. Waste Valorization. In Encyclopedia of Corporate Social Responsibility; Idowu, S.O., Capaldi, N., Zu, L., Gupta, A.D., Eds.; Springer: Berlin/Heidelberg, Germany, 2013. [Google Scholar] [CrossRef]
- Misra, V.; Pandey, S.D. Hazardous waste, impact on health and environment for development of better waste management strategies in future in India. Environ. Int. 2005, 31, 417–431. [Google Scholar] [CrossRef]
- Weissenbach, T.; Sarc, R. Investigation of particle-specific characteristics of non-hazardous, fine shredded mixed waste. Waste Manag. 2021, 119, 162–171. [Google Scholar] [CrossRef]
- Filho, W.L.; Will, M. Waste Management. In Encyclopedia of Corporate Social Responsibility; Idowu, S.O., Capaldi, N., Zu, L., Gupta, A.D., Eds.; Springer: Berlin/Heidelberg, Germany, 2013; pp. 2691–2700. [Google Scholar]
- Akpan, V.E.; Olukanni, D.O. Hazardous waste management: An African overview. Recycling 2020, 5, 15. [Google Scholar] [CrossRef]
- Klein, C.M. A model for the transportation of hazardous waste. Decis. Sci. 1991, 22, 1091–1108. [Google Scholar] [CrossRef]
- Turskis, Z.; Lazauskas, M.; Zavadskas, E.K. Fuzzy multiple criteria assessment of construction site alternatives for non-hazardous waste incineration plant in Vilnius city, applying ARAS-F and AHP methods. J. Environ. Eng. Landsc. Manag. 2012, 20, 110–120. [Google Scholar] [CrossRef]
- Richter, A.; Ng, K.T.; Pan, C. Effects of percent operating expenditure on Canadian non-hazardous waste diversion. Sustain. Cities Soc. 2018, 38, 420–428. [Google Scholar] [CrossRef]
- García-Sánchez, I.M.; Somohano-Rodríguez, F.M.; Amor-Esteban, V.; Frías-Aceituno, J.V. Which region and which sector leads the circular economy? CEBIX, a multivariant index based on business actions. J. Environ. Manag. 2021, 297, 113299. [Google Scholar] [CrossRef] [PubMed]
- Jaffrenou, P.A. Sur L’analyse des Familles Finies de Variables Vectorielles: Bases Algébriques et Application à la Description Statistique. Ph.D. Thesis, Université de Lyon, Lyon, France, 1978. [Google Scholar]
- Escoufier, Y. Opérateur associé à un tableau de données. In Annales de l’INSEE, no. 22/23; Institut National de la Statistique et des Études Économiques, JSTOR: New York, NY, USA, 1976; pp. 165–179. [Google Scholar] [CrossRef]
- des Plantes, H.L. Structuration des Tableauya trois Indices de la Statistique; Université Montpellier II: Montpellier, France, 1976. [Google Scholar]
- Abdi, H.; Williams, L.J.; Valentin, D.; Bennani-Dosse, M. STATIS and DISTATIS: Optimum multitable principal component analysis and three way metric multidimensional scaling. Wiley Interdiscip. Rev. Comput. Stat. 2012, 4, 124–167. [Google Scholar] [CrossRef]
- Rodríguez-Martínez, C.C.; Cubilla-Montilla, M.; Vicente-Galindo, P.; Galindo-Villardón, P. X-STATIS: A Multivariate Approach to Characterize the Evolution of E-Participation, from a Global Perspective. Mathematics 2023, 11, 1492. [Google Scholar] [CrossRef]
- Thioulouse, J.; Chessel, D. Multi-Table Analysis of Ecological Factors. I. From Description of Ecosystem Status to That of Ecosystem Function Using Triadic Analysis. Acta Oecol. Oecol. Gen. 1987, 8, 463–480. [Google Scholar]
- Kroonenberg, P.M. The Analysis of Multiple Tables in Factorial Ecology. III–Three-Mode Principle Component Analyses: “Analyse Triadique Complète”. Acta Oecol. Oecol. Gen. 1989, 10, 245–256. [Google Scholar]
- Esteban, V.A.; Villardón MP, G.; Sanchez, I.M.G. Cultural values on CSR patterns and evolution: A study from the biplot representation. Ecol. Indic. 2017, 81, 18–29. [Google Scholar] [CrossRef]
- Amor-Esteban, V.; Galindo-Villardón, M.P.; David, F. Study of the importance of national identity in the development of corporate social responsibility practices: A multivariate vision. Adm. Sci. 2018, 8, 50. [Google Scholar] [CrossRef]
- Amor-Esteban, V.; Galindo-Villardón, M.P.; García-Sánchez, I.M. Industry mimetic isomorphism and sustainable development based on the X-STATIS and HJ-biplot methods. Environ. Sci. Pollut. Res. 2018, 25, 26192–26208. [Google Scholar] [CrossRef]
- Amor-Esteban, V.; García-Sánchez, I.M.; Galindo-Villardón, M.P. Analysing the effect of legal system on corporate social responsibility (CSR) at the country level, from a multivariate perspective. Soc. Ind. Res. 2018, 140, 435–452. [Google Scholar] [CrossRef]
- Rieiro-García, M.; Amor-Esteban, V.; Aibar-Guzmán, C. ‘Localizing’ the sustainable development goals: A multivariate analysis of Spanish regions. AIMS Environ. Sci. 2023, 10, 356–381. [Google Scholar] [CrossRef]
- Prieto, J.M.; Amor, V.; Turias, I.; Almorza, D.; Piniella, F. Evaluation of Paris MoU Maritime Inspections Using a STATIS Approach. Mathematics 2021, 9, 2092. [Google Scholar] [CrossRef]
- Prieto, J.M.; Amor-Esteban, V.; Almorza-Gomar, D.; Turias, I.; Piniella, F. Application of Multivariate Statistical Techniques as an Indicator of Variability of the Effects of COVID-19 on the Paris Memorandum of Understanding on Port State Control. Mathematics 2023, 11, 3188. [Google Scholar] [CrossRef]
- Rodriguez-Rosa, M. KTensorGraphs: Co-Tucker3 Analysis of Two Sequences of Matrices. R Package Version 0.1. Departamento de Estadística, Universidad de Salamanca. 2016. Available online: http://cran.nexr.com/web/packages/KTensorGraphs/KTensorGraphs.pdf (accessed on 1 September 2023).
- Sarkodie, S.A.; Owusu, P.A. Impact of COVID-19 pandemic on waste management. Environ. Dev. Sustain. 2021, 23, 7951–7960. [Google Scholar] [CrossRef]
- Sharma, H.B.; Vanapalli, K.R.; Samal, B.; Cheela, V.S.; Dubey, B.K.; Bhattacharya, J. Circular economy approach in solid waste management system to achieve UN-SDGs: Solutions for post-COVID recovery. Sci. Total Environ. 2021, 800, 149605. [Google Scholar] [CrossRef]
- Gregson, N.; Crang, M.; Laws, J.; Fleetwood, T.; Holmes, H. Moving up the waste hierarchy: Car boot sales, reuse exchange and the challenges of consumer culture to waste prevention. Resour. Conserv. Recycl. 2013, 77, 97–107. [Google Scholar] [CrossRef]
- Kaza, S.; Yao, L.C.; Bhada-Tata, P.; Van Woerden, F. What a Waste 2.0: A Global Snapshot of Solid Waste Management to 2050. In Urban Development; World Bank: Washington, DC, USA, 2018; Available online: http://hdl.handle.net/10986/30317 (accessed on 1 September 2023).
- Minelgaitė, A.; Liobikienė, G. Waste problem in European Union and its influence on waste management behaviours. Sci. Total Environ. 2019, 667, 86–93. [Google Scholar] [CrossRef]
Figure 1.
Data structure.

Figure 2.
-STATIS analysis flow chart. Source: adapted from [29] (p. 9).
Figure 2.
-STATIS analysis flow chart. Source: adapted from [29] (p. 9).

Figure 3.
Evolution of waste management elements/practices in the period of 2016–2020.

Figure 4.
Analysis of the interstructure, similarities, and differences by years and countries.

Figure 5.
Percentage of inertia of the compromise subspace of the X-STATIS analysis by country.

Figure 6.
Compromise subspace of the X-STATIS analysis; countries and waste management elements/practices during the period of 2016–2020.
Figure 6.
Compromise subspace of the X-STATIS analysis; countries and waste management elements/practices during the period of 2016–2020.

Figure 7.
Projection of trajectories in the compromise subspace of the X-STATIS analysis; countries and waste management elements/practices during the period of 2016–2020.
Figure 7.
Projection of trajectories in the compromise subspace of the X-STATIS analysis; countries and waste management elements/practices during the period of 2016–2020.

Figure 8.
Analysis of the structure, similarities, and differences by years and activity sectors.

Figure 9.
Percentage of inertia of the compromise subspace of the X-STATIS analysis by activity sector.
Figure 9.
Percentage of inertia of the compromise subspace of the X-STATIS analysis by activity sector.

Figure 10.
Compromise subspace of the X-STATIS analysis; activity sectors and waste management elements/practices during the period of 2016–2020.
Figure 10.
Compromise subspace of the X-STATIS analysis; activity sectors and waste management elements/practices during the period of 2016–2020.

Figure 11.
Projection of trajectories in the compromise subspace of the X-STATIS analysis; activity sectors and waste management elements/practices in the period of 2016–2020.
Figure 11.
Projection of trajectories in the compromise subspace of the X-STATIS analysis; activity sectors and waste management elements/practices in the period of 2016–2020.

Table 1.
Corporate waste management elements or practices.
| Variable | Waste Management Element/Practice |
|---|---|
| WPP | Waste prevention policy |
| MIW | Management of the impacts of generated waste |
| MDNW | Methods of disposal of non-hazardous waste |
| OVH | Operations of valorization of hazardous waste without disposal |
| ODH | Operations of disposal of hazardous waste |
| THW | Transport of hazardous waste |
Table 2.
Frequency distribution of the sample by country and year.
| Country | 2016 | 2017 | 2018 | 2019 | 2020 | Observations | |
|---|---|---|---|---|---|---|---|
| 1 | Australia | 37 | 37 | 37 | 37 | 37 | 185 |
| 2 | Belgium | 8 | 8 | 8 | 8 | 8 | 40 |
| 3 | Brazil | 11 | 11 | 11 | 11 | 11 | 55 |
| 4 | Canada | 28 | 28 | 28 | 28 | 28 | 140 |
| 5 | China | 7 | 7 | 7 | 7 | 7 | 35 |
| 6 | Denmark | 14 | 14 | 14 | 14 | 14 | 70 |
| 7 | Finland | 11 | 11 | 11 | 11 | 11 | 55 |
| 8 | France | 46 | 46 | 46 | 46 | 46 | 230 |
| 9 | Germany | 30 | 30 | 30 | 30 | 30 | 150 |
| 10 | Hong Kong | 19 | 19 | 19 | 19 | 19 | 95 |
| 11 | India | 14 | 14 | 14 | 14 | 14 | 70 |
| 12 | Indonesia | 12 | 12 | 12 | 12 | 12 | 60 |
| 13 | Ireland | 10 | 10 | 10 | 10 | 10 | 50 |
| 14 | Italy | 16 | 16 | 16 | 16 | 16 | 80 |
| 15 | Japan | 117 | 117 | 117 | 117 | 117 | 585 |
| 16 | Malaysia | 14 | 14 | 14 | 14 | 14 | 70 |
| 17 | The Netherlands | 15 | 15 | 15 | 15 | 15 | 75 |
| 18 | Norway | 8 | 8 | 8 | 8 | 8 | 40 |
| 19 | Russian Federation | 8 | 8 | 8 | 8 | 8 | 40 |
| 20 | Singapore | 8 | 8 | 8 | 8 | 8 | 40 |
| 21 | South Africa | 37 | 37 | 37 | 37 | 37 | 185 |
| 22 | South Korea | 13 | 13 | 13 | 13 | 13 | 65 |
| 23 | Spain | 24 | 24 | 24 | 24 | 24 | 120 |
| 24 | Sweden | 21 | 21 | 21 | 21 | 21 | 105 |
| 25 | Switzerland | 22 | 22 | 22 | 22 | 22 | 110 |
| 26 | Taiwan | 10 | 10 | 10 | 10 | 10 | 50 |
| 27 | United Kingdom | 106 | 106 | 106 | 106 | 106 | 530 |
| 28 | United States | 114 | 114 | 114 | 114 | 114 | 570 |
| Total | 780 | 780 | 780 | 780 | 780 | 3900 |
Table 3.
Percentage of companies performing waste management elements/practices per year.
| Waste Management Element/Practice | 2016 | 2017 | 2018 | 2019 | 2020 |
|---|---|---|---|---|---|
| Management of the impact of generated waste | 88.7% | 90.7% | 94.5% | 96.8% | 97.5% |
| Methods of disposal of non-hazardous waste | 60.1% | 61.9% | 63.6% | 64.9% | 66.0% |
| Operations of disposal of hazardous waste | 47.0% | 48.7% | 51.0% | 51.2% | 52.0% |
| Operations of valorization of hazardous waste without disposal | 46.6% | 48.3% | 50.4% | 50.6% | 51.8% |
| Transport of hazardous waste | 25.2% | 26.4% | 27.9% | 30.0% | 32.3% |
| Waste prevention policy | 25.4% | 25.2% | 26.6% | 29.1% | 30.6% |
Table 4.
Global business commitment to waste management (% presence of the implementation of waste management practices) by country and year.
Table 4.
Global business commitment to waste management (% presence of the implementation of waste management practices) by country and year.
| Country | Global | 2016 | 2017 | 2018 | 2019 | 2020 | Variation % | Position 2020 | |
|---|---|---|---|---|---|---|---|---|---|
| 1 | Taiwan | 74.3% | 68.3% | 75.0% | 75.0% | 76.7% | 76.7% | 12.2% | 1 |
| 2 | Finland | 70.6% | 68.2% | 69.7% | 71.2% | 71.2% | 72.7% | 6.7% | 2 |
| 3 | France | 66.2% | 65.2% | 66.7% | 64.5% | 66.7% | 67.8% | 3.9% | 3 |
| 4 | Spain | 63.2% | 58.3% | 63.2% | 64.6% | 63.2% | 66.7% | 14.3% | 5 |
| 5 | Russian | 62.9% | 58.3% | 60.4% | 62.5% | 66.7% | 66.7% | 14.3% | 6 |
| 6 | Italy | 61.9% | 60.4% | 62.5% | 63.5% | 62.5% | 60.4% | 0.0% | 12 |
| 7 | United States | 60.4% | 57.3% | 59.4% | 60.5% | 62.0% | 62.7% | 9.4% | 8 |
| 8 | Brazil | 59.4% | 56.1% | 54.5% | 60.6% | 65.2% | 60.6% | 8.1% | 11 |
| 9 | Sweden | 58.7% | 50.0% | 52.4% | 60.3% | 63.5% | 67.5% | 34.9% | 4 |
| 10 | Germany | 58.6% | 57.8% | 57.8% | 57.8% | 59.4% | 60.0% | 3.8% | 14 |
| 11 | South Korea | 57.9% | 51.3% | 56.4% | 57.7% | 61.5% | 62.8% | 22.5% | 7 |
| 12 | India | 56.7% | 56.0% | 52.4% | 53.6% | 59.5% | 61.9% | 10.6% | 10 |
| 13 | Norway | 55.8% | 56.3% | 56.3% | 58.3% | 54.2% | 54.2% | −3.7% | 16 |
| 14 | Hong Kong | 55.3% | 44.7% | 54.4% | 62.3% | 57.9% | 57.0% | 27.5% | 15 |
| 15 | Switzerland | 55.2% | 50.0% | 50.8% | 55.3% | 57.6% | 62.1% | 24.2% | 9 |
| 16 | Canada | 51.5% | 49.4% | 50.6% | 51.8% | 53.0% | 53.0% | 7.2% | 17 |
| 17 | The Netherlands | 50.2% | 50.0% | 52.2% | 51.1% | 47.8% | 50.0% | 0.0% | 20 |
| 18 | Japan | 49.4% | 46.4% | 47.6% | 49.1% | 50.9% | 52.8% | 13.8% | 18 |
| 19 | Singapore | 47.5% | 37.5% | 45.8% | 45.8% | 47.9% | 60.4% | 61.1% | 13 |
| 20 | Indonesia | 46.4% | 36.1% | 44.4% | 48.6% | 51.4% | 51.4% | 42.3% | 19 |
| 21 | China | 45.2% | 40.5% | 40.5% | 45.2% | 50.0% | 50.0% | 23.5% | 21 |
| 22 | Denmark | 44.0% | 36.9% | 44.0% | 44.0% | 46.4% | 48.8% | 32.3% | 22 |
| 23 | Malaysia | 44.0% | 38.1% | 35.7% | 46.4% | 50.0% | 50.0% | 31.3% | 23 |
| 24 | South Africa | 43.2% | 41.4% | 42.3% | 44.1% | 43.7% | 44.1% | 6.5% | 25 |
| 25 | Belgium | 41.7% | 43.8% | 37.5% | 39.6% | 43.8% | 43.8% | 0.0% | 26 |
| 26 | United Kingdom | 36.2% | 35.5% | 34.7% | 35.4% | 37.1% | 38.2% | 7.5% | 27 |
| 27 | Australia | 35.1% | 32.0% | 32.4% | 37.4% | 37.4% | 36.5% | 14.1% | 28 |
| 28 | Ireland | 35.0% | 30.0% | 28.3% | 30.0% | 41.7% | 45.0% | 50.0% | 24 |
Note: The “Global” column value is the average value over the study period in a percentage. The countries are separated by the 25th and 75th percentiles. They are advanced when it is 60.0% or higher (in green); middle when it is between 45.0% and 59.0% (in yellow); and lagged when it is under 45.0% (in red). The “Variation %” column is calculated by (%2020–%2016)/%2016; the colour code is green when the evolution is positive, yellow if it is stable and red if it is negative.
Table 5.
Frequency distribution of the sample by sectors and years.
| Sector | 2016 | 2017 | 2018 | 2019 | 2020 | Observations |
|---|---|---|---|---|---|---|
| S1: Oil and gas | 27 | 27 | 27 | 27 | 27 | 135 |
| S2: Basic material and industry | 109 | 109 | 109 | 109 | 109 | 545 |
| S3: Consumer goods | 76 | 76 | 76 | 76 | 76 | 380 |
| S4: Consumer services | 229 | 229 | 229 | 229 | 229 | 1145 |
| S5: Financial services | 108 | 108 | 108 | 108 | 108 | 540 |
| S6: Technology and Telecommunications | 34 | 34 | 34 | 34 | 34 | 170 |
| S7: Real estate services | 66 | 66 | 66 | 66 | 66 | 330 |
| S8: Other activities | 131 | 131 | 131 | 131 | 131 | 655 |
| Total | 780 | 780 | 780 | 780 | 780 | 3900 |
Table 6.
Business commitment to waste management (% presence) by sector and year.
| Sector | Global | 2016 | 2017 | 2018 | 2019 | 2020 | Variation % | |
|---|---|---|---|---|---|---|---|---|
| 1 | S3: Consumer goods | 61.9% | 60.5% | 61.2% | 61.2% | 63.1% | 63.7% | 5.2% |
| 2 | S1: Oil and gas | 56.9% | 51.9% | 54.3% | 54.9% | 60.5% | 63.0% | 21.4% |
| 3 | S2: Basic material and Industry | 53.9% | 49.7% | 50.9% | 54.5% | 56.9% | 57.8% | 16.2% |
| 4 | S8: Other activities | 51.6% | 47.7% | 50.6% | 51.8% | 52.8% | 55.2% | 15.8% |
| 5 | S5: Financial services | 51.6% | 47.5% | 49.9% | 52.5% | 53.3% | 54.8% | 15.2% |
| 6 | S4: Consumer services | 50.2% | 47.3% | 48.2% | 51.1% | 51.7% | 52.7% | 11.3% |
| 7 | S6: Technology and Telecom. | 47.5% | 44.0% | 44.9% | 47.7% | 50.9% | 50.0% | 13.7% |
| 8 | S7: Real estate services | 46.9% | 46.0% | 45.3% | 46.0% | 47.7% | 49.3% | 7.1% |
Note: The “Global” column value is the average value over the study period in a percentage. The sectors are separated into two groups following country criteria. They are advanced when it is 60.0% or higher (in green) and middle when it is between 45.0% and 59.0% (in yellow). The “Variation %” column is calculated by (%2020–%2016)/%2016; the colour code is green when the evolution is positive and yellow if it is stable.
Disclaimer/Publisher’s Note: The statements, opinions and data contained in all publications are solely those of the individual author(s) and contributor(s) and not of MDPI and/or the editor(s). MDPI and/or the editor(s) disclaim responsibility for any injury to people or property resulting from any ideas, methods, instructions or products referred to in the content. |
© 2023 by the authors. Licensee MDPI, Basel, Switzerland. This article is an open access article distributed under the terms and conditions of the Creative Commons Attribution (CC BY) license (https://creativecommons.org/licenses/by/4.0/).
Share and Cite
MDPI and ACS Style
Aibar-Guzmán, B.; Monteiro, S.; David, F.; Somohano-Rodríguez, F.M. The Waste Hierarchy at the Business Level: An International Outlook. Mathematics 2023, 11, 4574. https://doi.org/10.3390/math11224574
AMA Style
Aibar-Guzmán B, Monteiro S, David F, Somohano-Rodríguez FM. The Waste Hierarchy at the Business Level: An International Outlook. Mathematics. 2023; 11(22):4574. https://doi.org/10.3390/math11224574
Chicago/Turabian StyleAibar-Guzmán, Beatriz, Sónia Monteiro, Fátima David, and Francisco M. Somohano-Rodríguez. 2023. "The Waste Hierarchy at the Business Level: An International Outlook" Mathematics 11, no. 22: 4574. https://doi.org/10.3390/math11224574
Note that from the first issue of 2016, this journal uses article numbers instead of page numbers. See further details here.