
Diabetes Monitoring through Urine Analysis Using ATR-FTIR Spectroscopy and Machine Learning


Center for Lasers and Applications-CLA, Nuclear and Energy Research Institute-IPEN/CNEN, Av. Professor Lineu Prestes, São Paulo 2242, SP, Brazil
*
Author to whom correspondence should be addressed.
Chemosensors 2023, 11(11), 565; https://doi.org/10.3390/chemosensors11110565
Submission received: 26 September 2023
/
Revised: 30 October 2023
/
Accepted: 7 November 2023
/
Published: 15 November 2023
(This article belongs to the Special Issue Chemosensors in Biological Challenges, Volume II)
Abstract
:Diabetes mellitus (DM) is a widespread and rapidly growing disease, and it is estimated that it will impact up to 693 million adults by 2045. To cope this challenge, the innovative advances in non-destructive progressive urine glucose-monitoring platforms are important for improving diabetes surveillance technologies. In this study, we aim to better evaluate DM by analyzing 149 urine spectral samples (86 diabetes and 63 healthy control male Wistar rats) utilizing attenuated total reflection–Fourier transform infrared (ATR-FTIR) spectroscopy combined with machine learning (ML) methods, including a 3D discriminant analysis approach—3D–Principal Component Analysis–Linear Discriminant Analysis (3D-PCA-LDA)—in the ‘bio-fingerprint’ region of 1800–900 cm. The 3D discriminant analysis technique demonstrated superior performance compared to the conventional PCA-LDA approach with the 3D-PCA-LDA method achieving 100% accuracy, sensitivity, and specificity. Our results show that this study contributes to the existing methodologies on non-destructive diagnostic methods for DM and also highlights the promising potential of ATR-FTIR spectroscopy with an ML-driven 3D-discriminant analysis approach in disease classification and monitoring.
1. Introduction
Diabetes mellitus (DM) is a prevalent and rapidly growing disease worldwide, which is diagnosed by abnormally high blood glucose levels, and it affects the endocrine system [1]. It is estimated that it will impact approximately 693 million adults by 2045, thus posing a significant health concern [2]. Although considered to be potentially devastating, DM is an incurable metabolic disorder characterized as hypoglycemic due to the devastation of insulin-secreting pancreatic -cells, which results in ineffective glucose processing by the body and high levels of glucose in the bloodstream [3]. Diabetes is categorized into two main types: Type 1 and Type 2. Type-1 diabetes is an autoimmune disease that primarily affects children and adolescents where the immune system damages insulin-producing cells in the pancreas, and lifelong insulin therapy is required for treatment [4]. Type-2 diabetes, caused by lifestyle and genetic factors, results in insulin resistance or insufficient insulin production. It is more prevalent than Type 1 and can be managed with lifestyle changes, medication, or a combination of both [5]. DM is associated with metabolic disorders including macrovascular and microvascular complications, such as neuropathy [6], cardiovascular disease [7], diabetic kidney disease [8], and diabetic retinopathy [9]. These complications can lead to an increased risk of mortality, blindness, kidney failure, and a reduced quality of life for individuals coping with diabetes [2,10]. Hence, the early diagnosis and effective management of diabetes are crucial for preventing complications and promoting optimal health. Treatment may include lifestyle changes, medications, and regular monitoring of blood sugar levels.
A plethora of studies demonstrate that diabetes can result in alterations in urine composition, leading to the presence of glucose when it surpasses the kidneys’ capacity for re-absorption, making urine analysis a useful method for monitoring hyperglycemia in diabetic patients [11]. Additionally, urine analysis requires an easily accessible and non-destructive technique that can be applied to determine urinary components, e.g., tract and kidneys, and monitor several metabolic, endocrine, and toxic conditions [12]. Recently, several methods have been introduced for urine analysis, and attenuated total reflection–Fourier transform infrared (ATR-FTIR) spectroscopy is an effective option due to its sensitive and non-destructive technique. ATR-FTIR spectroscopy is capable of extracting intricate biochemical information from the vibrational energy inherent in chemical bonds found within biomolecules, such as lipids, nucleic acids, proteins, and carbohydrates when applied to liquid matrices [13,14,15]. This analytical technique ensures the detailed quantitative assessment of complicated biochemical samples, thus enabling the identification of the concentration of specific molecules [16]. Furthermore, it assists qualitative analysis through the examination of spectral disparities in characteristic bands of biomolecules related to the particular pathology under investigation. By virtue of its outstanding sensitivity, specificity, and the ability to simultaneously scrutinize all molecular components, ATR-FTIR spectroscopy has emerged as an invaluable tool for the early screening of a myriad of pathological conditions [17,18].
ATR-FTIR, in particular, can evaluate several urine components, for instance creatinine [19], urea [20], uric acid [21], phosphate and sulfate [12], as well as cystinuria [22], by manipulating components absorbed at certain wavenumbers using infrared (IR) spectrum. Furthermore, ATR-FTIR provides many advantages, such as no sample preparation, low cost, automated analysis, and a non-destructive nature [23].
Recently, the extensive use of Artificial Intelligence (AI) algorithms combined with ATR-FTIR, specifically machine learning (ML), has been shown to be useful in urine analysis [24]. Not only can these AI algorithms assess the risk of developing diabetes by monitoring glucose levels and diagnosing the disease, but ML can also monitor for complications by evaluating symptoms and test results. Hence, ML in integration with ATR-FTIR can provide highly accurate, user-friendly, and accessible computational modeling simulations, which hold huge potential in medical applications [23,25].
In this paper, ATR-FTIR spectroscopy is used as a novel approach to monitor alterations in urinary molecules modified by diabetes. Thereby, we aim to show the ability of ATR-FTIR spectroscopy integrated with ML modeling to discriminate between urinary components of non-diabetic (ND) versus diabetic rats. The discriminant analysis algorithm, which is an ML method, is composed of two distinct techniques: 3D-PCA-LDA and PCA-LDA. A vital factor to identify urinary parameters is a computational modeling framework used to achieve the accurate monitoring of urine glucose to identify diabetes via markers in silico perfectly with 3D-PCA-LDA that shows optimal precision.
2. Methods and Materials
2.1. Experimental Analysis
Male Wistar (∼260 g) rats were used in our experiment. We caused diabetes in the Wistar rats in order to examine the effects of DM. The experiment adhered to the Brazilian Society of Laboratory Animal Science’s (SBCAL) recommendations for the handling and using of laboratory animals, and the experimental procedures were approved by the Federal University of Uberlandia’s (UFU) Ethics Committee for Animal Research (License No. CEUA-UFA No. 013/2016) in accordance with the ethical principles adopted by the Brazilian College of Animal Experimentation (COBEA) in accordance with ARRIVE recommendations. The UFU’s Center for Vivariums and Experimentation (REBIR) supplied the rats, which were kept under standard conditions (12 h light/dark cycle), with regulated temperature and humidity (∼60%), and with unrestricted access to water.
The experimental protocol involved administering a sole intraperitoneal injection of 60 mg/kg streptozotocin (STZ), reconstituted in 0.1 M citrate buffer (pH 4.5), following an overnight period of fasting to the rats. Animals were classified as diabetic (D) if they had hyperglycemia (>250 mg/dL) 48 h later. The control subjects were administered an intravenous injection of 0.9% sodium chloride (physiological saline) in equimolar quantities.
2.2. Samples Collection
The rats were housed in metabolic cages for 24 h on day 6 of the experiment in order to obtain their individual 24 h urine samples. The samples were then gathered, measured, processed, and kept at a temperature of −80 until further research. In accordance with the recommendations of the manufacturer (Labtest Diagnostica SA, Lagoa Santa–MG, Brazil), enzymatic tests were performed to determine the levels of diverse features (creatinine, urea, and glucose) in urine. Blood glucose levels were quantified from the tail vein of rats after an overnight fast, employing reactive strips compatible with a glucometer (Accu-Chek Performa, Roche Diagnostic Systems, Basel, Switzerland). The estimation of glucose concentration from the FTIR spectra exhibits a strong positive correlation with enzymatic tests ( = 0.79) [24]. Additionally, the variance in body weight gain/loss ( body weight) following STZ or placebo treatment was examined. Animals were subjected to death by an excessive anesthetic dose after the 24 h urine collection and other measures. The samples of urine were lyophilized using Liotop L101 and then analyzed after drying.
2.3. ATR-FTIR Data Analysis
An FTIR (Thermo Scientific’s Nicolet 6700, Waltham, MA, USA) instrument integrated with a diamond crystal ATR accessory, which operates in ATR mode to obtain reflection–absorption spectral information for sensitive measurement and covers the range of 4000 to 400 cm, was used to collect the spectroscopic data. The 100 scans (co-adds) per spectrum and with fine spectral resolution (4 cm) were applied to collect the spectra. The ATR-FTIR spectra were preprocessed by baseline correction, vector normalization, and smoothing using the Savitzky-Golay (SG) filter with a polynomial of 2nd order in an eleven-point window prior to the analysis of the spectra data. The bio-fingerprint region 1800–900 cm served as the input to the computational modeling framework. All preprocessing procedures and spectral analyses were systematically computed using Python 3.0. The source code was accessed on 9 November 2023 (https://github.com/sajid-dahar/Diabetes) and can be found in the Supplementary Material.
2.3.1. Principle Component Analysis
Chemometrics employs advanced statistical and mathematical methodologies to extract information from data originating from biological, chemical, and medical analyses and apply it within the field of chemical measurements. Among these techniques, Principal Components Analysis (PCA) has emerged as a potential and extensively applied methodology [26]. PCA can be utilized for several purposes in data analysis. It can be employed either independently for exploratory data analysis [27] or as an initial step in classification (e.g., SIMCA) [28] as well as in calibration (e.g., principal component regression) [29]. Moreover, PCA has frequently been used as a data compression algorithm.
In the context of exploratory analysis utilizing PCA, several conventional parameters are leveraged:
- Scores—these are employed to investigate the interrelationships among individual measurements or observations, thus facilitating the detection of trends, groupings, outliers, and other pertinent patterns.
- Loadings—loadings are instrumental in exploring the connections between variables and discerning their influence on the PCs extracted through PCA.
- Distances—distance plots are used to identify outliers and extreme objects within the PCA model constructed with a specified number of components, thus aiding in the detection of data points that deviate significantly from the norm.
- Residual/Explained Variance—variance plots lead the objective of determining the optimal number of components to include in the PCA model, thus offering insight into the proportion of variance accounted for by each component.
As previously mentioned, the utilization of the PCA technique required the decomposition of the spectral matrix (X) into its constituent components, such as loading (P), scores (, and residuals (E). Mathematically, the model’s performance was evaluated using the following method:
where P depicts the variability in the direction of variables (i.e., wavenumber) and can be used to identify potential markers in the spectrum. On the other hand, T indicates variations in the direction of samples, thus enabling the assessment of similarities or dissimilarities between them.
The 3D-PCA technique employs a conventional PCA methodology, which is given as:
where the spectral matrix at the position (l, m) is denoted by , while rows and columns of data represent samples and wavenumbers, respectively. The residuals at (l, m) are represented by . The PCA scores and loading at (l, m) are represented by and , respectively.
2.3.2. Classification Analysis Based on Machine Learning
Linear discriminant analysis (LDA) is a supervised classification technique employed to discriminate samples into their respective classes by exploiting Mahalanobis distance calculations [30,31]. Hence, the calculation process is executed by considering the variance–covariance matrix of each class separately. The calculation of score for LDA () is evaluated according to [32]:
where variables and represent the scores of T for sample i and the scores of class j for their respective PCs, where each is a 1× N row vector.
In term of LDA, the class covariance matrices are supposed to be equal so that a pooled covariance matrix is given as:
where represents the class covariance matrix of class j.
2.4. Performance Parameter for Quality Evaluation
The data analysis was conducted using Python 3.0 in a Jupyter Notebook environment, adhering to established ML methodologies. The raw spectra were loaded and subjected to a series of precise preprocessing steps. First, the fingerprint regime (1800 to 900 cm) was specifically extracted to focus on relevant spectral features. Next, a Savitzky–Golay (SG) filter was applied using a window size of 11 points, a 2nd order polynomial, and a first derivative to effectively mitigate noise while enhancing spectral resolution. To correct for baseline distortions, Automatic Weighted Least Squares baseline correction was employed, which accounts for varying intensity profiles with high precision. Normalization to the Amide I band was performed to account for differences in spectral intensities, ensuring accurate comparative analysis. Finally, mean centering was applied to further standardize the data, ensuring that the spectra were centered around zero and thus minimizing the impact of systemic variations. These rigorous and precise preprocessing steps were meticulously implemented to ensure the robustness and reliability of subsequent data analysis, as shown in Supplementary (Figure S1). Table 1 offers a comprehensive inventory of selected wavenumbers derived from the Supplementary (Figure S2), which was specifically designed for the analysis of urine samples [33]. These wavenumbers are accompanied by their respective tentative biomolecular assignments, contributing to a thorough understanding of the spectral data’s biomolecular constituents and their relevance in the context of the study [34].
Key metrics, including accuracy (), sensitivity (), and specificity (), were measured on both the train and test sets to assess the classification rate and validation performance of the models in order to obtain optimal computational model performance. The following formulas were used to calculate these metrics:
where the stands for true negative, denotes true positive, signifies false negative, and represents false positive.
3. Results
ATR-FTIR is a sophisticated and well-known analytical method that has shown to be extremely useful in the study of diseases. This method uses very accurate and precise measurements of biological materials to analyze various disorders [35]. To evaluate the performance metrics, including , , and , in distinguishing the diabetic group, we leveraged ATR-FTIR as a robust analytical tool in our study.
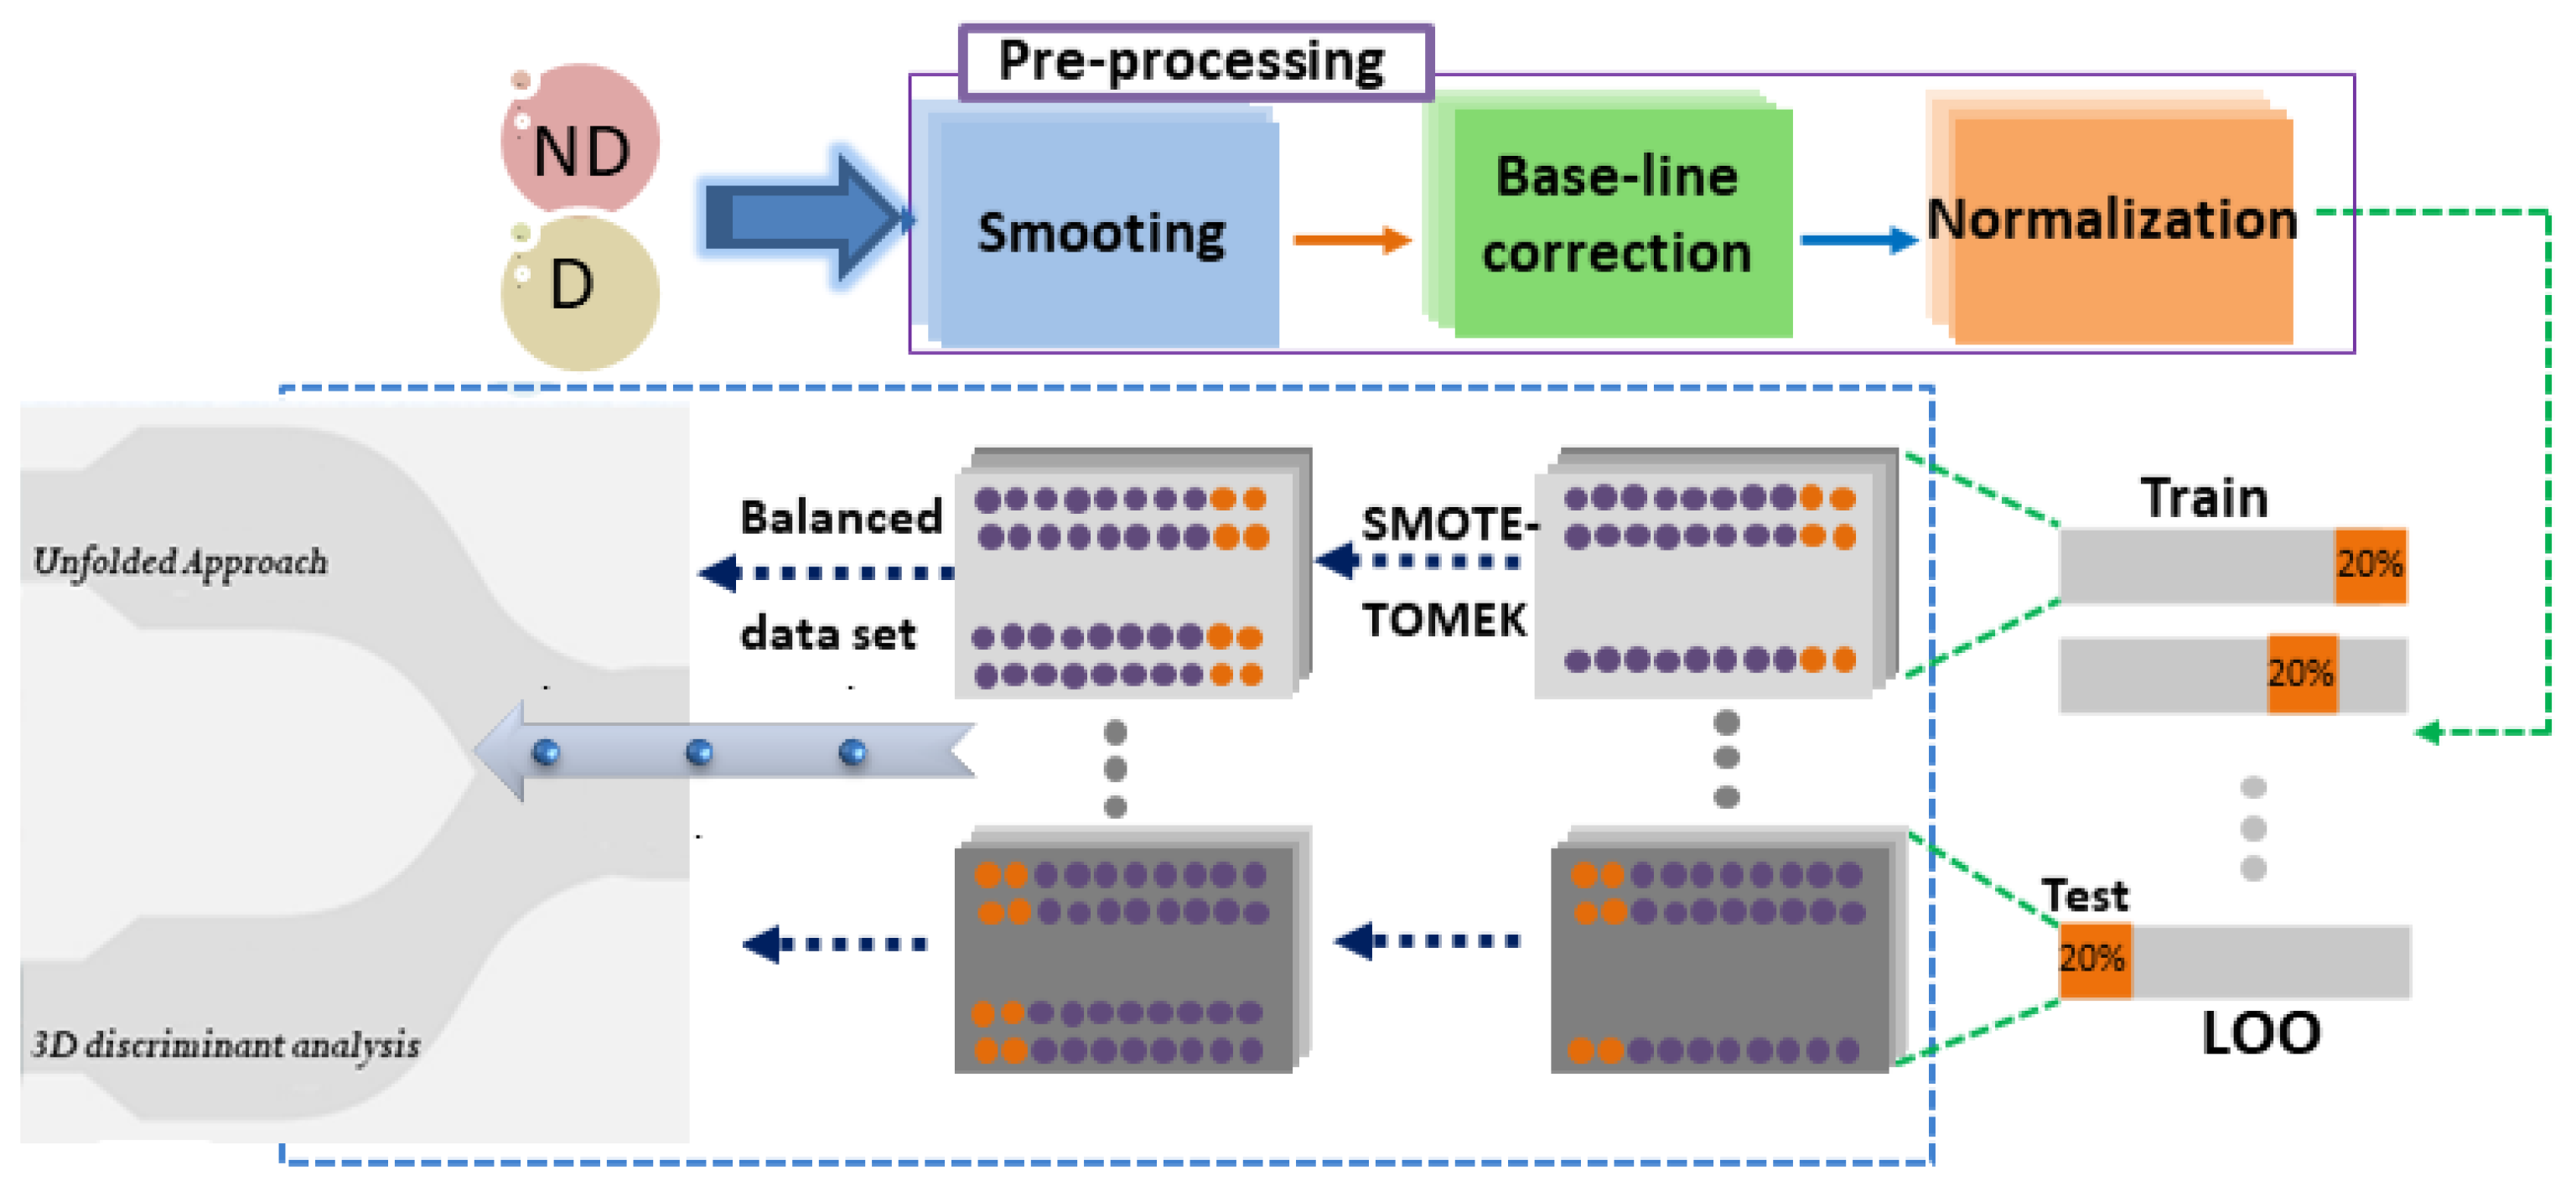
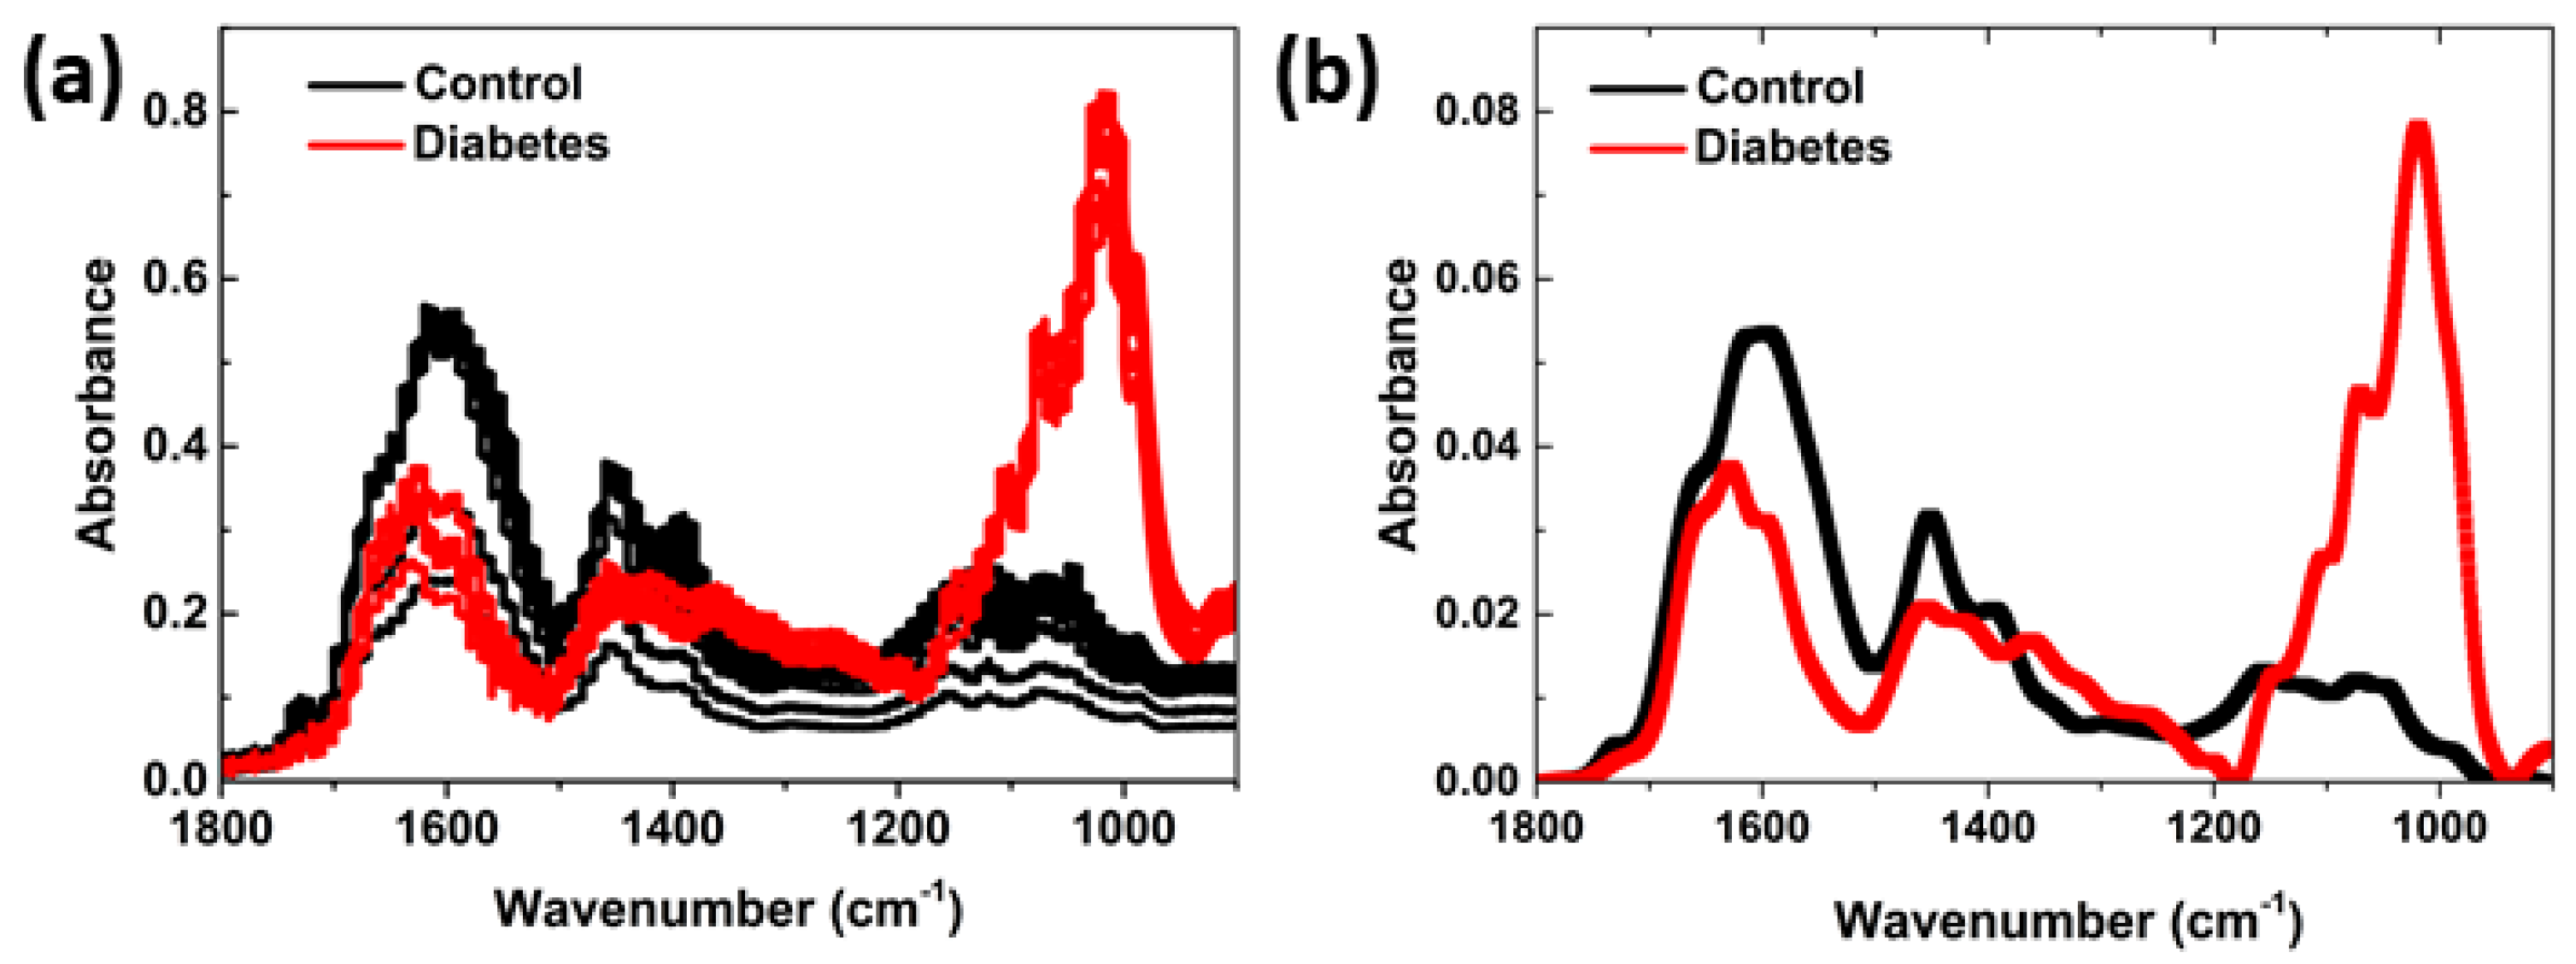
The dataset encompasses a total of 149 samples, consisting of 66 urinary spectra samples from the control group and 83 samples from individuals with diabetes. To prepare the spectral data for analysis, we applied an SG filter, which includes smoothing, baseline correction, and normalization techniques, to the fingerprint domain ranging from 1800 to 900 cm, as shown in Figure 1. Multiple spectra were acquired for each sample, thus resulting in a total of 149 spectra. The raw as well as preprocessed data comparing control and diabetes samples are presented in Figure 2. As mentioned previously, the data pertaining to diabetes and ND samples were imbalanced. Therefore, we utilized SMOTE-TOMEK techniques to balance the data and achieve higher precision and accuracy in our analysis.
Within the domain of interest, specifically the fingerprint regime (1800 to 900 cm), prominent spectral characteristics were identified, including a peak at 1650 cm indicative of Amide I proteins.
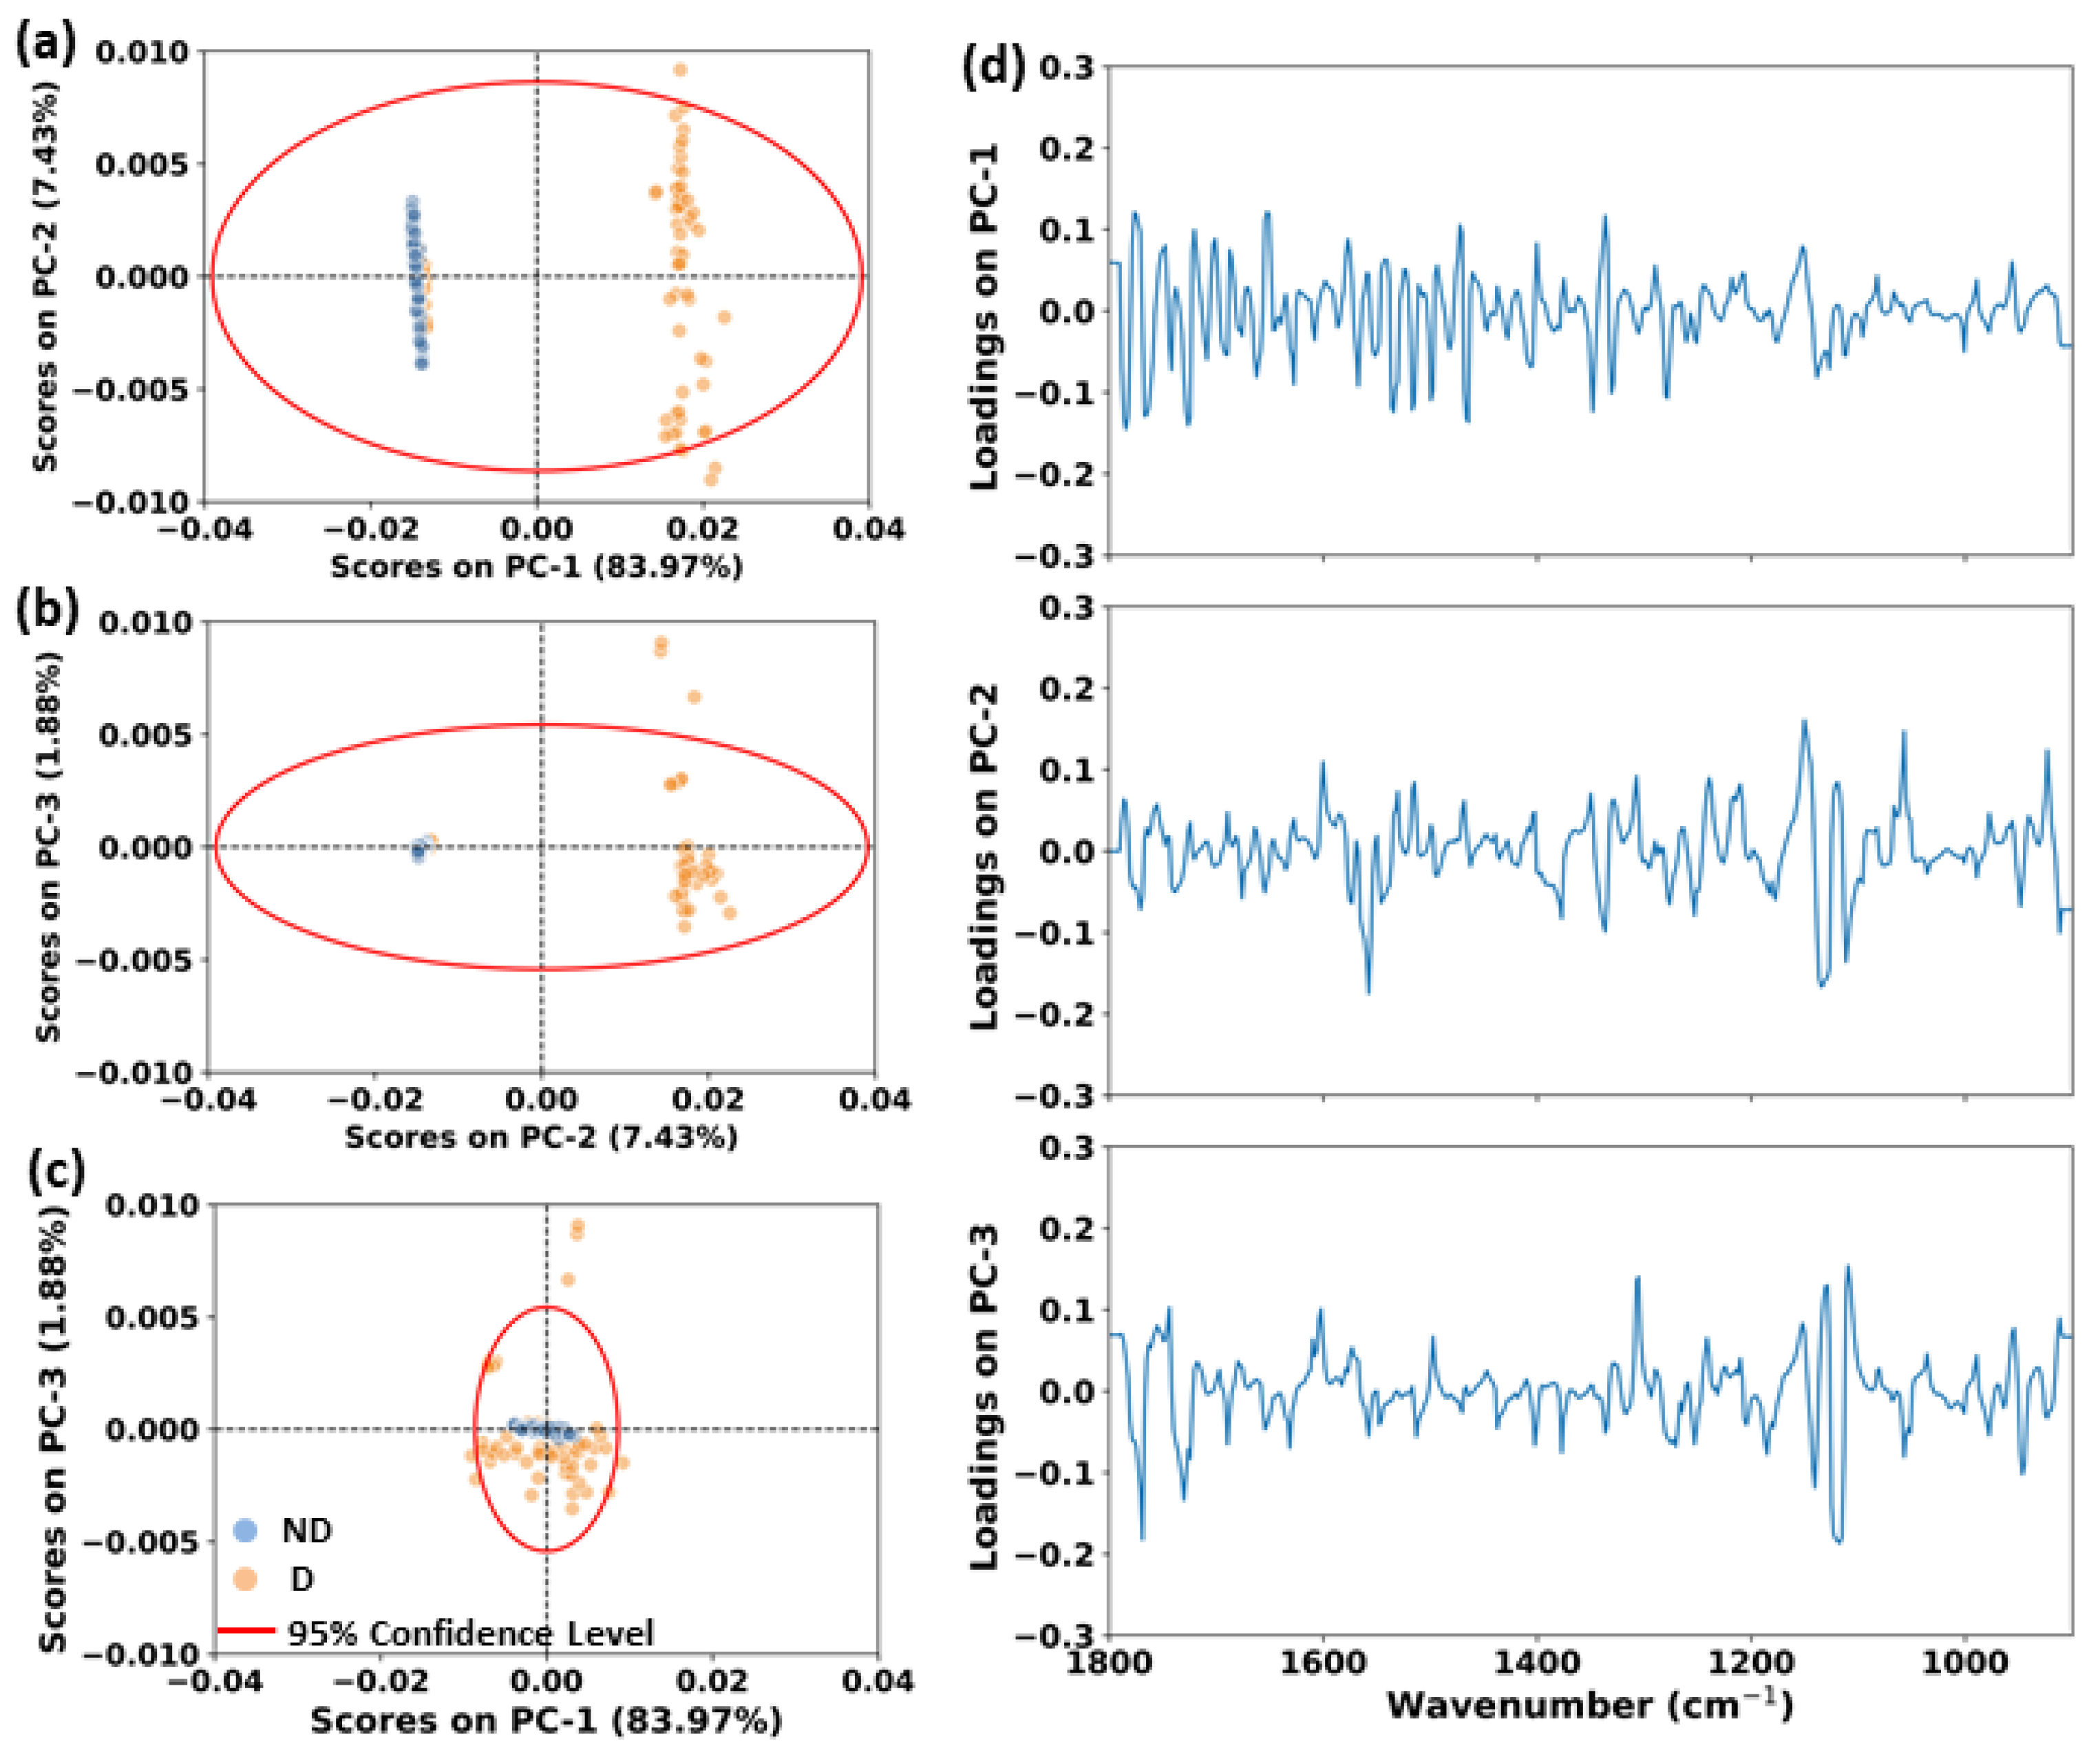
In order to accurately evaluate the presence of diabetes in rat urine samples, the ML method was employed to identify biochemical signatures that can differentiate between healthy (control) and non-healthy (diabetic) samples. Initially, a Principal Component Analysis model was utilized for exploratory data analysis, as depicted in Figure 3. Three PCs were utilized, which accounted for over 93% of the cumulative explained variance. In the PCA plot depicted in Figure 3a, PC1, which accounted for 83.97% of the explained variance score, was compared to PC2, which accounted for 7.43% of the explained variance score. Additionally, the comparison of PC2 with PC3 (1.88% of explained variance), as seen in Figure 3b, and the plot of PC1 versus PC3 scores (Figure 3c) revealed that these components were effective in differentiating the sample groups. However, the percentage of spectral explained variance for class separation was found to be relatively low (PC2 vs. PC3), indicating that additional spectral features may be required for more robust discrimination between the sample groups. Furthermore, the scores plot represents each spectrum as a point in space. Spectra that are similar to each other are closer, while dissimilar spectra are positioned farther apart (see Figure 3). This type of visualization greatly facilitates the rapid identification of patterns within similar datasets.
The precise characterization of distinct markers, notwithstanding inherent biological variability, necessitates a comprehensive understanding of the underlying biochemical constituents responsible for differentiation between control and diabetes groups. To achieve this goal, we have meticulously identified prominent peaks within the absolute values of PC loadings, which correspond to specific wavenumbers that exert a significant influence on the variance within the FTIR dataset. As illustrated in Figure 3, these identified peaks play an important role in achieving the highest levels of differentiation between diabetes and non-diabetes spectral markers. PC1, capturing 83.97% of the total dataset’s variance, emerges as a key discriminant factor in revealing prominent spectral features, as shown in Figure 3d. As evident in Figure 3, PC1 loading exhibits both positive and negative values, thus reflecting the distinct wavenumber regions considered during PC calculations. An elucidation of the specific vibrational modes associated with PC1 loading (Table 1) provides invaluable insights into the nuanced biochemical constituents relevant to diabetes spectral markers. The capability of PC1 to underscore significant spectral disparities positions it as a primary contributor to differentiate among diabetes vs. non-daibetes, thereby offering indispensable information for precise markers characterization.
Moreover, PC2, responsible for 7.43% of the dataset total variance, presents a unique perspective on diabetes differentiation. In distinct contrast to PC1, PC2 loading predominantly manifests as positive values in the range 1200–900 cm (Figure 3). Notably, the spectral bands responsible for diabetes differentiation in PC2 occur in entirely distinct wavenumber ranges, confirming the independence of these principal components. The systematic assignment of vibrational modes to peaks within PC2 loading enhances our understanding of spectroscopic features contributing to the discrimination of markers, thus augmenting the robustness and specificity of our analytical framework. Additionally, PC3, contributing 1.88% to the data’s total variance, introduces a distinctive profile characterized by frequent variations and narrower peak profiles, as depicted in Figure 3. This characteristic implies the involvement of a wide spectrum of biomolecular constituents in driving subtle yet significant variations in the FTIR signal of control group. The localization of these spectral variations within specific wavenumber regions, as unveiled by PC3, underscores the intricate biochemical distinctions captured within these tissues. A systematic assignment of vibrational modes to peaks in PC3 loading serves important insights into the precise biochemical elements responsible for these diabetes spectral markers.
These results elucidate the discriminating spectral properties across the sample groups and offer useful insights into the spectral features that account for the observed segregation pattern in PCA-related scores. As shown in Figure 3d, the spectrum analysis of urea (NHCONH) and creatinine (CHNO) depict unique bands at particular wavenumbers, presenting the existence of molecular vibrations. Four distinct bands can be seen in urea: NH vibrational bands at 1149 cm [36], a CN stretch antisymmetric band at 1459 cm, a CO stretch band at 1587 cm, and an NH bend antisymmetric band at 1620 cm [12,24]. For creatinine, a single band at 1449 cm is seen, which can be ascribed to vibrations of the C=N stretch, CN stretch, and N-CH band bending. In addition, three more bands can be observed in the 1700–1500 cm range (Figure S2). It is important to note that due to the hydrogen bonding between them, these bands of urea and creatinine may interact with water bands (1635 cm), thereby changing their spectral properties. The IR signatures of glucose primarily derive from the stretching vibrations of C-O and C-O-C bonds (Figure 2), thus resulting in distinct peaks within the lower wavenumber range (1200–900 cm) [37,38]. In a similar vein, one can evaluate glucose concentration by observing spectral changes at approximately 1050 cm [39].
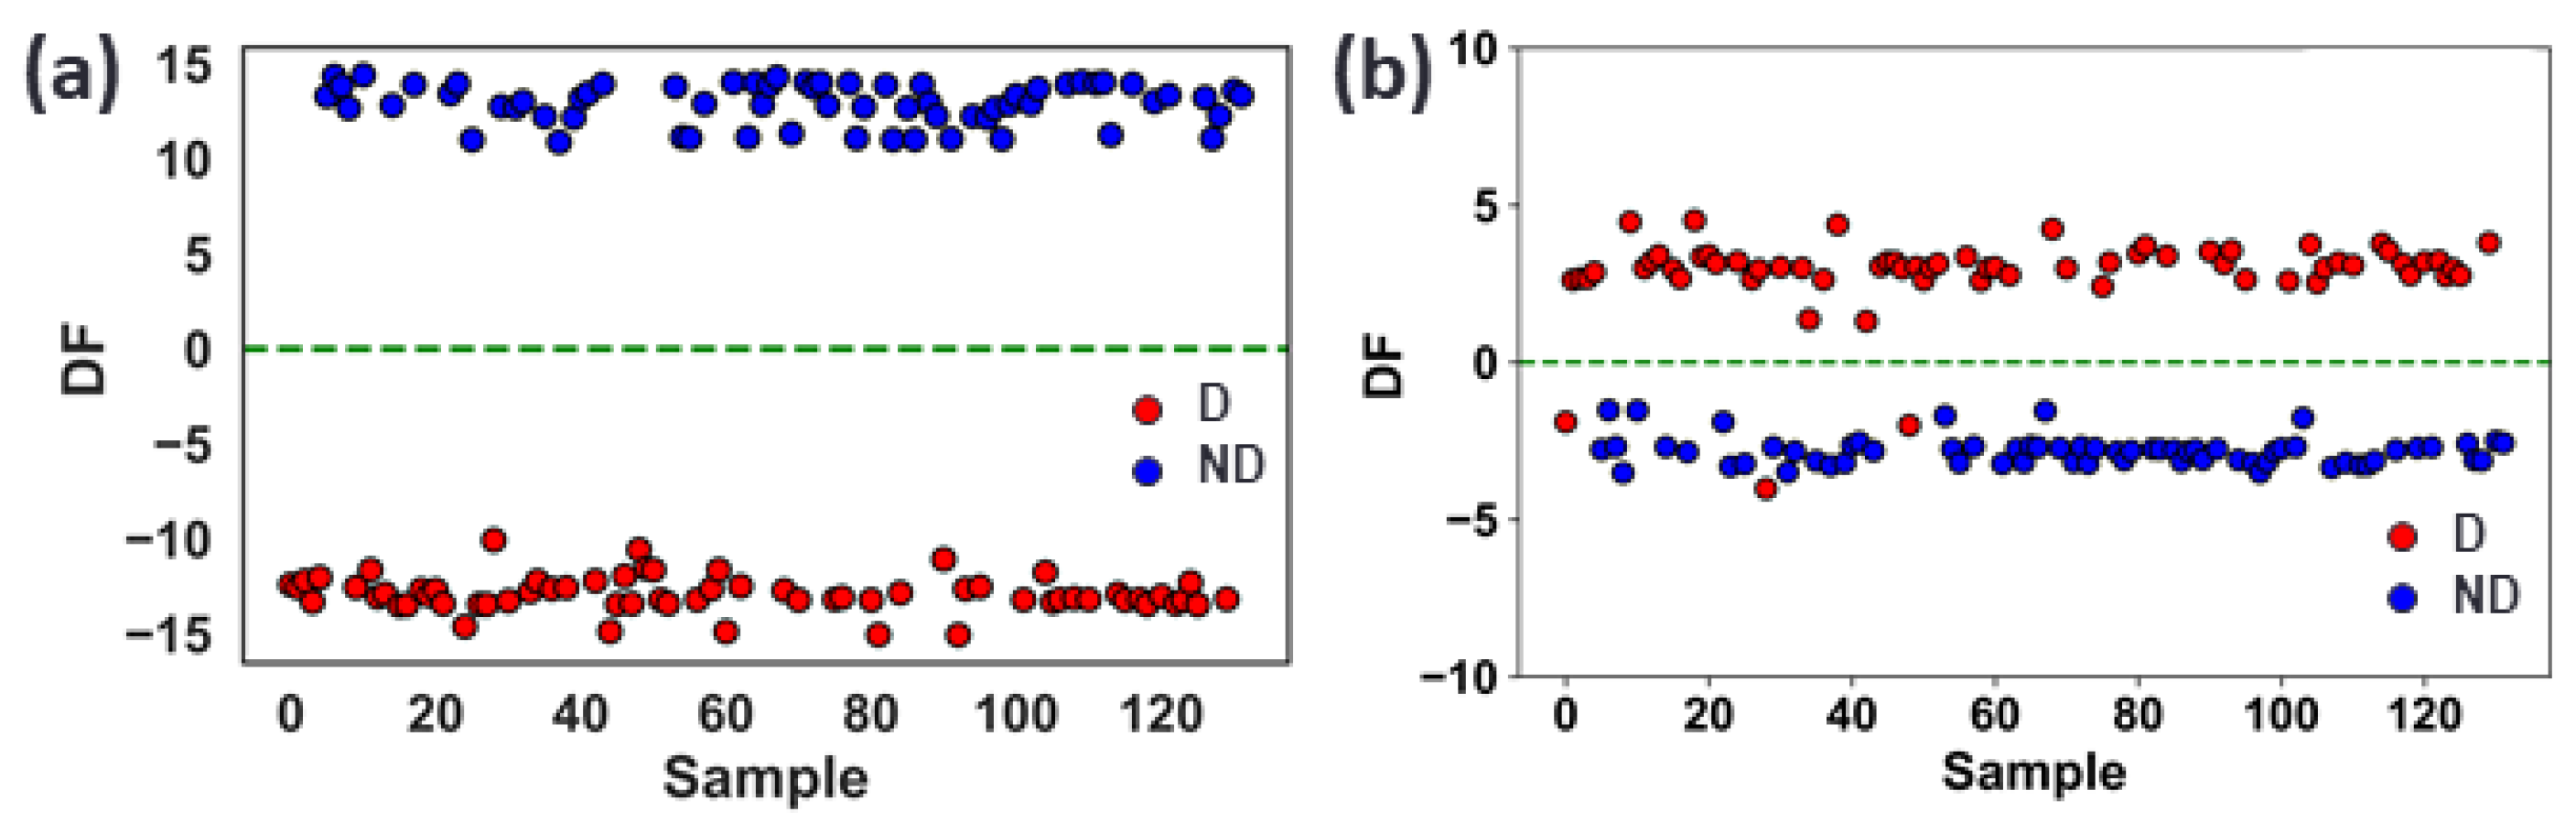
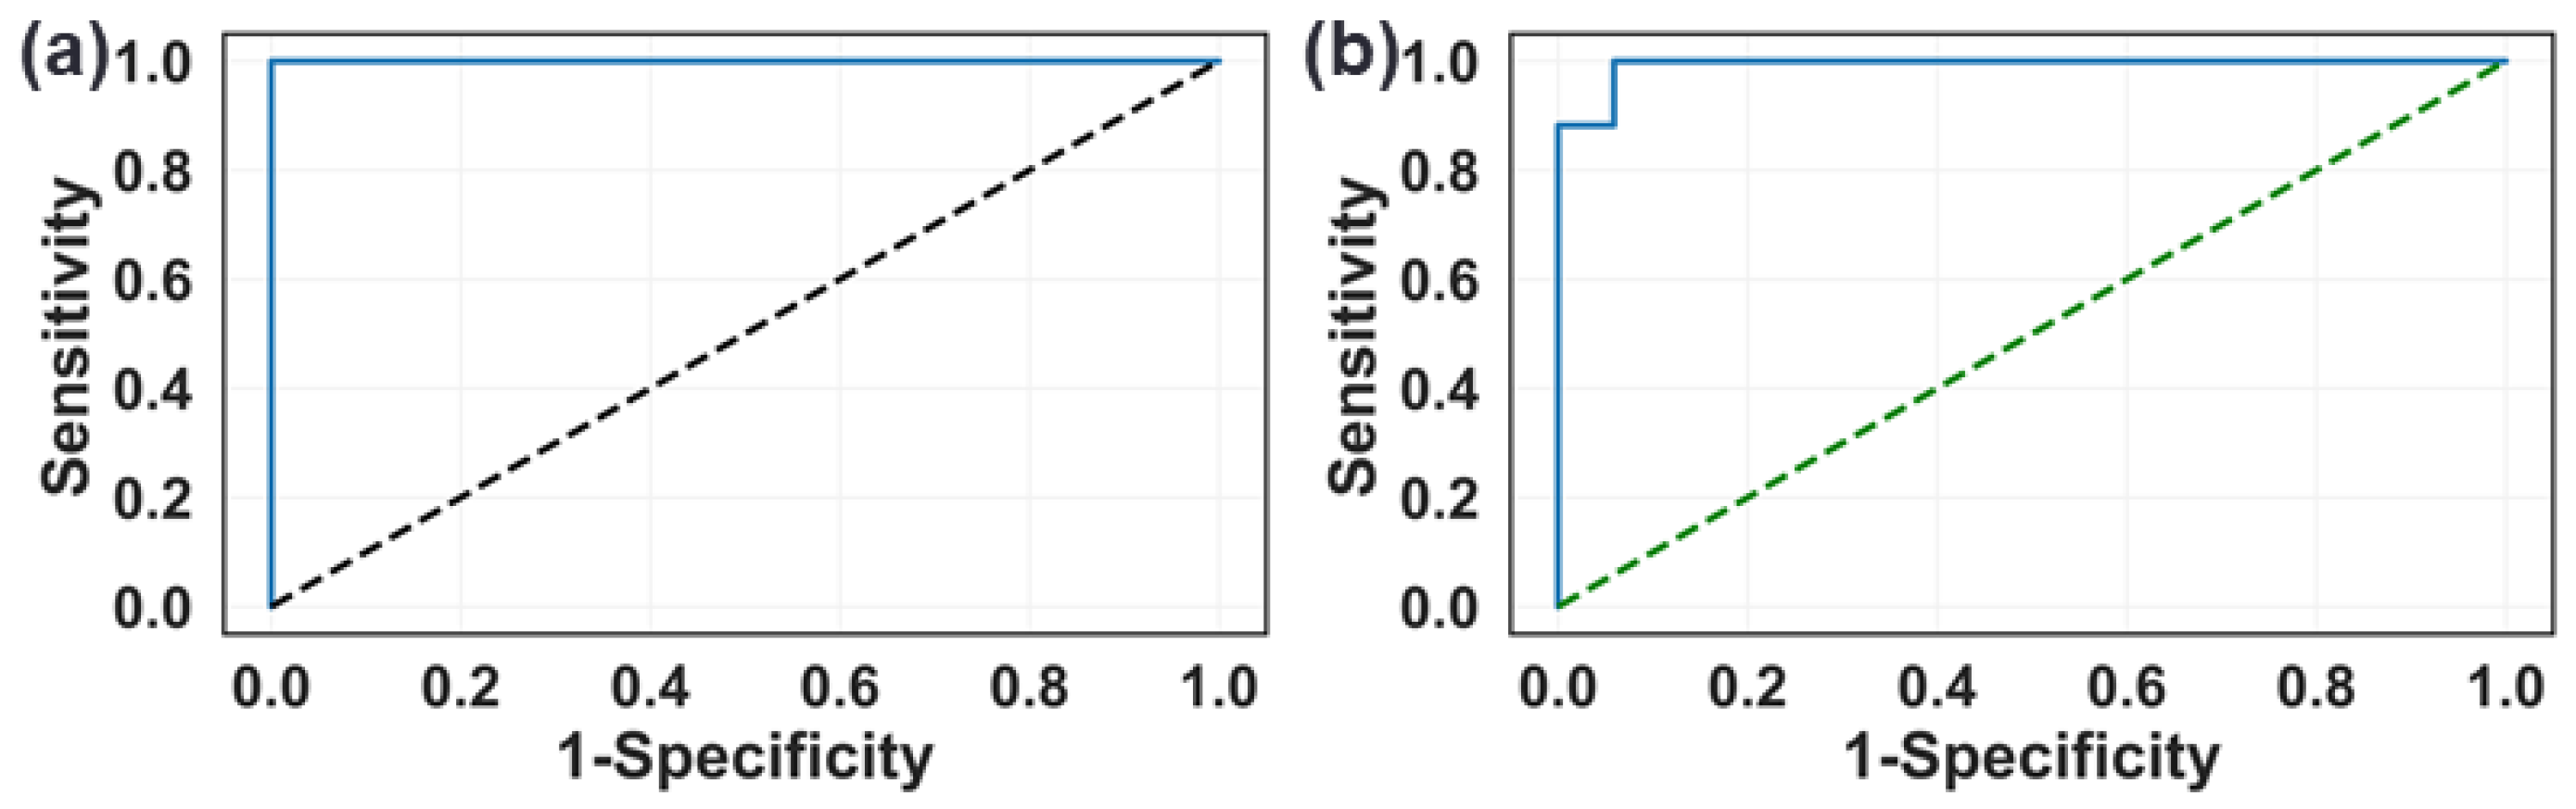
In order to explore performance exclusively, semi-supervised classification models utilizing unfolded PCA-LDA and a 3D discriminant analysis technique were introduced to systematically discriminate between urine-based diabetes groups and healthy urine control groups. The preprocessed spectral data were split into train (80%) and test (20%) sets, employing the SMOTE-TOMEK technique uniform sample selection algorithm. The performance of the 3D-PCA-LDA classification algorithm was compared to the PCA-LDA model, and performance measures including , , and were calculated for both the test and train sets. The 3D-PCA-LDA algorithm obtained the best classification efficiency, having an of 100%. As shown in Figure 4a, the discriminant function (DF) depicts a clear separation between control and diabetes samples, and no miss-classification is found. Figure 4b presents a discriminant function plot of the unfolded model (PCA-LDA), indicating a little overlapping between the healthy control and diabetes groups. These results, as shown in Figure 4b, indicate that the unfolded model achieved close to 97% accuracy for the test sets, while it achieves 100% with the 3D discriminant analysis approach. However, a clear difference in performance was observed when employing receiver operating characteristic (ROC) curve analysis using 3D discriminant analysis (Figure 5a). The performance achieved by the area under the curve (AUC) reached 1.0 using the 3D-PCA-LDA model, which outperformed the PCA-LDA model (0.97), as depicted in Figure 5b.
Table 2 indicates the correct classification rates achieved for testing and validation in various models using confusion matrices. Interestingly, the PCA-LDA algorithm demonstrates a significant improvement with correct classification rates of 94% and 96% for non-diabetic samples in the test (20%) and CV (LOO) datasets, respectively. In contrast, the 3D-PCA-LDA method achieves a perfect classification rate of 100% for diabetes samples in both the training and cross-validation model evaluation of datasets (Table 2).
During test analysis, the classification performance of the PCA-LDA algorithm resulted in , , and scores of 97%, 94%, and 99%, respectively. However, with the 3D-PCA-LDA model, there was a significant improvement in performance parameters (, and ) with scores of 100% (Table 3). Furthermore, the samples were reduced using the Leave-One-Out (LOO) approach to perform cross-validation (CV). As presented in Table 3, the , and values are overall 100%, showing that there is no over-fitting when using 3D-PCA-LDA. Our study clearly presents the advantages of using the 3D discriminant analysis approach over unfolded algorithms in identifying diabetes vs. non-diabetes in urine samples.
4. Discussion
The development of a pioneering diagnostic tool is crucial, especially in the context of diabetes-related disease like DM, which can pose risks to both growing fetuses and older populations. ATR-FTIR spectroscopy has become a powerful and potent analytical tool that may reveal various biological structures through spectrum analysis. This novel method has been shown to be extremely valuable in clinical healthcare realizations and offers encouraging possibilities for the future promises to continued technical improvements. Thus, the spectral fingerprint in the range of 1800 to 900 cm, as acquired through spectroscopic analysis, contains crucial information pertaining to biomolecules like nucleic acids, proteins, lipids, and carbohydrates [40].
For computational modeling simulations, urine samples obtained from male Wistar rats were comprised of 63 control and 83 diabetes samples. In order to explore more about the chemical signatures of the urine components, these samples were submitted to ATR-FTIR spectroscopy. The results of our analysis of the data depicted that an unsupervised machine learning method was successful in differentiating between the non-diabetes and diabetes groups with clear differences seen in the scores of Principal Components (PCs) such as PC1 and PC2. There was no discernible difference between the groups in PC3. However, clear changes in the water and protein sections of the spectra were found, indicating possible variations in the composition of these elements between the D and ND groups. These results demonstrate the capability of ATR-FTIR spectroscopy to characterize distinctive spectrochemical properties and distinguish between various groups in rat urine samples specifically in reference to the water and protein components.
Moreover, we applied PCA-LDA and 3D-PCA-LDA techniques to classify samples of urine regarding healthy control and diabetes. Among these models, the 3D-PCA-Linear Discriminant Analysis emerged as the most effective classification model, consistently distinguishing urine-based diabetes samples obtained from controls. The 3D-PCA-LDA is a potent feature selection technique that utilizes combining three-dimensional PCA with LDA, selecting the most relevant single-valued decomposition that maximizes class separation. It has shown superior performance compared to feature extraction methods. Notably, there are fewer studies that have explored the employment of ATR-FTIR in DM-related research with even fewer focusing on urine samples of DM. Using a 3D-PCA-LDA approach, the performance parameters, i.e., , and , is 100%, which outperforms the unfolded approach. In another study, Caixeta et al. demonstrated the effectiveness of ATR-FTIR combined with an unfolded approach in analyzing saliva samples from male Wistar rats containing DM, achieving ∼95% accuracy and highlighting the potential of the ML method in monitoring DM [41]. Moreover, a study conducted by Bernardes et al. investigated the promising potential of combining ATR-FTIR with multivariate analysis to attain a high degree of in the assessment of gestational DM [42].
The proposed computational model (3D-PCA-LDA) has demonstrated the ability to confirm the suitability of our platform for detecting diabetes in urine samples. The identification of spectral biomarkers in urine presents new opportunities for identifying the severity of diabetes. Considering the metabolic similarities between diabetic animal models and human patients, we propose that this urine-based ATR-FTIR-integrated ML-based diagnostics could be further examined in large patient samples for the rapid and cost-effective monitoring of diabetes using urine samples. This approach may also have the potential to facilitate point-of-care assays using portable ATR-FTIR spectroscopic approaches.
5. Conclusions
In conclusion, our study utilized a 3D discriminant approach with ATR-FTIR spectroscopy to effectively differentiate between diabetes and control groups in urine samples. Our model outperformed conventional methods like PCA-LDA in distinguishing the infrared spectra of urine between diabetic and non-diabetic rats, achieving an extraordinarily high discriminating accuracy of 100% in sensitivity and specificity. This demonstrates the reliability and effectiveness of our approach in detecting the metabolic changes associated with diabetes. Our research adds to the expanding body of research on non-invasive diabetes diagnosis techniques and supports the promise of ATR-FTIR spectroscopy as a robust diagnostic and prognostic tool.
Supplementary Materials
The following supporting information can be downloaded at https://www.mdpi.com/article/10.3390/chemosensors11110565/s1, Figure S1: The data utilized in this study: Raw (a) of diabetes and (b) non-diabetes attributed to urine samples as well as their respective preprocessed (c,d) data. Figure S2: The second derivative plots of absorbance (A) for identification of spectral biomarkers in urine using Savitzky–Golay filter smoothing (window 11, polynomial fitting order 2, derive = 2).
Author Contributions
Conceptualization, S.F. and D.M.Z.; methodology, S.F.; software, S.F.; validation, S.F. and D.M.Z.; formal analysis, S.F.; investigation, S.F.; resources, D.M.Z.; data curation, S.F.; writing—original draft preparation, S.F.; writing—review and editing, S.F. and D.M.Z.; visualization, S.F.; supervision, D.M.Z.; project administration, D.M.Z.; funding acquisition, D.M.Z. All authors have read and agreed to the published version of the manuscript.
Funding
This work was supported by FAPESP (21/00633-0, 17/50332-0), CAPES (Finance Code 001) and CNPq (INCT-465763/2014-6, INCT 406761/2022-1, PQ-314517/2021-9), Sisfóton (440228/2021-2).
Institutional Review Board Statement
The animal study protocol was approved by the Institutional Ethics Committee of Federal University of Uberlandia (protocol code CEUA-UFA No. 013/2016, 14 April 2016) for studies involving animals.
Data Availability Statement
The data are available upon reasonable request from the corresponding author.
Acknowledgments
We express our gratitude to Robinson Sabino-Silva of the Innovation Center in Salivary Diagnostics and Nanobiotechnology, Department of Physiology, Institute of Biomedical Sciences, Federal University of Uberlandia, Uberlandia, Brazil, for his invaluable contributions, insightful discussions, and unwavering support throughout thisproject.
Conflicts of Interest
The authors declare no conflict of interest.
References
- Ogurtsova, K.; Guariguata, L.; Barengo, N.C.; Ruiz, P.L.D.; Sacre, J.W.; Karuranga, S.; Sun, H.; Boyko, E.J.; Magliano, D.J. IDF diabetes Atlas: Global estimates of undiagnosed diabetes in adults for 2021. Diabetes Res. Clin. Pract. 2022, 183, 109118. [Google Scholar] [CrossRef] [PubMed]
- Cole, J.B.; Florez, J.C. Genetics of diabetes mellitus and diabetes complications. Nat. Rev. Nephrol. 2020, 16, 377–390. [Google Scholar] [CrossRef] [PubMed]
- Poznyak, A.; Grechko, A.V.; Poggio, P.; Myasoedova, V.A.; Alfieri, V.; Orekhov, A.N. The diabetes mellitus–atherosclerosis connection: The role of lipid and glucose metabolism and chronic inflammation. Int. J. Mol. Sci. 2020, 21, 1835. [Google Scholar] [CrossRef] [PubMed]
- Roep, B.O.; Thomaidou, S.; van Tienhoven, R.; Zaldumbide, A. Type 1 diabetes mellitus as a disease of the β-cell (do not blame the immune system?). Nat. Rev. Endocrinol. 2021, 17, 150–161. [Google Scholar] [CrossRef] [PubMed]
- Padhi, S.; Nayak, A.K.; Behera, A. Type II diabetes mellitus: A review on recent drug based therapeutics. Biomed. Pharmacother. 2020, 131, 110708. [Google Scholar] [CrossRef]
- Chitneni, A.; Rupp, A.; Ghorayeb, J.; Abd-Elsayed, A. Early detection of diabetic peripheral neuropathy by fMRI: An evidence-based review. Brain Sci. 2022, 12, 557. [Google Scholar] [CrossRef]
- Liccardo, D.; Cannavo, A.; Spagnuolo, G.; Ferrara, N.; Cittadini, A.; Rengo, C.; Rengo, G. Periodontal disease: A risk factor for diabetes and cardiovascular disease. Int. J. Mol. Sci. 2019, 20, 1414. [Google Scholar] [CrossRef]
- Yamazaki, T.; Mimura, I.; Tanaka, T.; Nangaku, M. Treatment of diabetic kidney disease: Current and future. Diabetes Metab. J. 2021, 45, 11–26. [Google Scholar] [CrossRef]
- Ansari, P.; Tabasumma, N.; Snigdha, N.N.; Siam, N.H.; Panduru, R.V.; Azam, S.; Hannan, J.; Abdel-Wahab, Y.H. Diabetic retinopathy: An overview on mechanisms, pathophysiology and pharmacotherapy. Diabetology 2022, 3, 11. [Google Scholar] [CrossRef]
- Tomic, D.; Shaw, J.E.; Magliano, D.J. The burden and risks of emerging complications of diabetes mellitus. Nat. Rev. Endocrinol. 2022, 18, 525–539. [Google Scholar] [CrossRef]
- Das, T.; Harshey, A.; Srivastava, A.; Nigam, K.; Yadav, V.K.; Sharma, K.; Sharma, A. Analysis of the ex-vivo transformation of semen, saliva and urine as they dry out using ATR-FTIR spectroscopy and chemometric approach. Sci. Rep. 2021, 11, 11855. [Google Scholar] [CrossRef] [PubMed]
- Sarigul, N.; Kurultak, İ.; Uslu Gökceoğlu, A.; Korkmaz, F. Urine analysis using FTIR spectroscopy: A study on healthy adults and children. J. Biophotonics 2021, 14, e202100009. [Google Scholar] [CrossRef] [PubMed]
- Pan, S.W.; Lu, H.C.; Lo, J.I.; Ho, L.I.; Tseng, T.R.; Ho, M.L.; Cheng, B.M. Using an ATR-FTIR Technique to Detect Pathogens in Patients with Urinary Tract Infections: A Pilot Study. Sensors 2022, 22, 3638. [Google Scholar] [CrossRef]
- Cano-Trujillo, C.; Barbaro, A.; Ortega-Ojeda, F.E.; García-Ruiz, C.; Montalvo, G. Source determination of human and animal oral fluid stains on porous substrates by chemometrics-assisted ATR FTIR spectroscopy: A preliminary study. Microchem. J. 2023, 190, 108648. [Google Scholar] [CrossRef]
- Silva, L.G.; Péres, A.F.; Freitas, D.L.; Morais, C.L.; Martin, F.L.; Crispim, J.C.; Lima, K.M. ATR-FTIR spectroscopy in blood plasma combined with multivariate analysis to detect HIV infection in pregnant women. Sci. Rep. 2020, 10, 20156. [Google Scholar] [CrossRef]
- Kharratian, S.; Conteduca, D.; Procacci, B.; Shaw, D.J.; Hunt, N.T.; Krauss, T.F. Metasurface-enhanced mid-infrared spectroscopy in the liquid phase. Chem. Sci. 2022, 13, 12858–12864. [Google Scholar] [CrossRef]
- Praja, R.K.; Wongwattanakul, M.; Tippayawat, P.; Phoksawat, W.; Jumnainsong, A.; Sornkayasit, K.; Leelayuwat, C. Attenuated Total Reflectance-Fourier Transform Infrared (ATR-FTIR) Spectroscopy Discriminates the Elderly with a Low and High Percentage of Pathogenic CD4+ T Cells. Cells 2022, 11, 458. [Google Scholar] [CrossRef]
- Lilo, T.; Morais, C.L.; Ashton, K.M.; Pardilho, A.; Davis, C.; Dawson, T.P.; Gurusinghe, N.; Martin, F.L. Spectrochemical differentiation of meningioma tumours based on attenuated total reflection Fourier-transform infrared (ATR-FTIR) spectroscopy. Anal. Bioanal. Chem. 2020, 412, 1077–1086. [Google Scholar] [CrossRef]
- Perez-Guaita, D.; Richardson, Z.; Heraud, P.; Wood, B. Quantification and identification of microproteinuria using ultrafiltration and ATR-FTIR spectroscopy. Anal. Chem. 2020, 92, 2409–2416. [Google Scholar] [CrossRef]
- Lin, T.L.; Evans, R.D.; Unwin, R.J.; Norman, J.T.; Rich, P.R. Assessment of Measurement of Salivary Urea by ATR-FTIR Spectroscopy to Screen for CKD. Kidney360 2022, 3, 357. [Google Scholar] [CrossRef]
- Ergün, E.; Kart, Ş.; Zeybek, D.K.; Zeybek, B. Simultaneous electrochemical determination of ascorbic acid and uric acid using poly (glyoxal-bis (2-hydroxyanil)) modified glassy carbon electrode. Sens. Actuators B Chem. 2016, 224, 55–64. [Google Scholar] [CrossRef]
- Oliver, K.V.; Vilasi, A.; Maréchal, A.; Moochhala, S.H.; Unwin, R.J.; Rich, P.R. Infrared vibrational spectroscopy: A rapid and novel diagnostic and monitoring tool for cystinuria. Sci. Rep. 2016, 6, 34737. [Google Scholar] [CrossRef] [PubMed]
- Naseer, K.; Ali, S.; Qazi, J. ATR-FTIR spectroscopy as the future of diagnostics: A systematic review of the approach using bio-fluids. Appl. Spectrosc. Rev. 2021, 56, 85–97. [Google Scholar] [CrossRef]
- Caixeta, D.C.; Lima, C.; Xu, Y.; Guevara-Vega, M.; Espindola, F.S.; Goodacre, R.; Zezell, D.M.; Sabino-Silva, R. Monitoring glucose levels in urine using FTIR spectroscopy combined with univariate and multivariate statistical methods. Spectrochim. Acta Part A Mol. Biomol. Spectrosc. 2023, 290, 122259. [Google Scholar] [CrossRef]
- Meza Ramirez, C.A.; Greenop, M.; Ashton, L.; Rehman, I.U. Applications of machine learning in spectroscopy. Appl. Spectrosc. Rev. 2021, 56, 733–763. [Google Scholar] [CrossRef]
- Iannucci, L. Chemometrics for data interpretation: Application of principal components analysis (pca) to multivariate spectroscopic measurements. IEEE Instrum. Meas. Mag. 2021, 24, 42–48. [Google Scholar] [CrossRef]
- Rodionova, O.; Kucheryavskiy, S.; Pomerantsev, A. Efficient tools for principal component analysis of complex data—A tutorial. Chemom. Intell. Lab. Syst. 2021, 213, 104304. [Google Scholar] [CrossRef]
- Rukundo, I.R.; Danao, M.G.C. Identifying turmeric powder by source and metanil yellow adulteration levels using near-infrared spectra and PCA-SIMCA modeling. J. Food Prot. 2020, 83, 968–974. [Google Scholar] [CrossRef]
- Sitnikova, V.E.; Kotkova, M.A.; Nosenko, T.N.; Kotkova, T.N.; Martynova, D.M.; Uspenskaya, M.V. Breast cancer detection by ATR-FTIR spectroscopy of blood serum and multivariate data-analysis. Talanta 2020, 214, 120857. [Google Scholar] [CrossRef]
- Wu, W.; Mallet, Y.; Walczak, B.; Penninckx, W.; Massart, D.; Heuerding, S.; Erni, F. Comparison of regularized discriminant analysis linear discriminant analysis and quadratic discriminant analysis applied to NIR data. Anal. Chim. Acta 1996, 329, 257–265. [Google Scholar] [CrossRef]
- Morais, C.L.; Martin-Hirsch, P.L.; Martin, F.L. A three-dimensional principal component analysis approach for exploratory analysis of hyperspectral data: Identification of ovarian cancer samples based on Raman microspectroscopy imaging of blood plasma. Analyst 2019, 144, 2312–2319. [Google Scholar] [CrossRef] [PubMed]
- Duda, R.O.; Hart, P.E.; Stork, D.G. Pattern Classification; John Wiley & Sons: Hoboken, NJ, USA, 2006. [Google Scholar]
- Eilers, P.H. A perfect smoother. Anal. Chem. 2003, 75, 3631–3636. [Google Scholar] [CrossRef] [PubMed]
- Rohman, A.; Windarsih, A.; Lukitaningsih, E.; Rafi, M.; Betania, K.; Fadzillah, N.A. The use of FTIR and Raman spectroscopy in combination with chemometrics for analysis of biomolecules in biomedical fluids: A review. Biomed. Spectrosc. Imaging 2019, 8, 55–71. [Google Scholar] [CrossRef]
- Giamougiannis, P.; Morais, C.L.; Rodriguez, B.; Wood, N.J.; Martin-Hirsch, P.L.; Martin, F.L. Detection of ovarian cancer (±neo-adjuvant chemotherapy effects) via ATR-FTIR spectroscopy: Comparative analysis of blood and urine biofluids in a large patient cohort. Anal. Bioanal. Chem. 2021, 413, 5095–5107. [Google Scholar] [CrossRef]
- Navarrete, J.L.; Hernández, V.; Ramirez, F. Ir and Raman spectra of L-aspartic acid and isotopic derivatives. Biopolym. Orig. Res. Biomol. 1994, 34, 1065–1077. [Google Scholar] [CrossRef]
- Khajehpour, M.; Dashnau, J.L.; Vanderkooi, J.M. Infrared spectroscopy used to evaluate glycosylation of proteins. Anal. Biochem. 2006, 348, 40–48. [Google Scholar] [CrossRef]
- Simonova, D.; Karamancheva, I. Application of Fourier transform infrared spectroscopy for tumor diagnosis. Biotechnol. Biotechnol. Equip. 2013, 27, 4200–4207. [Google Scholar] [CrossRef]
- Petrich, W. Mid-infrared and Raman spectroscopy for medical diagnostics. Appl. Spectrosc. Rev. 2001, 36, 181–237. [Google Scholar] [CrossRef]
- Skolik, P.; Morais, C.L.; Martin, F.L.; McAinsh, M.R. Attenuated total reflection fourier-transform infrared spectroscopy coupled with chemometrics directly detects pre-and post-symptomatic changes in tomato plants infected with botrytis cinerea. Vib. Spectrosc. 2020, 111, 103171. [Google Scholar] [CrossRef]
- Caixeta, D.C.; Aguiar, E.M.; Cardoso-Sousa, L.; Coelho, L.M.; Oliveira, S.W.; Espindola, F.S.; Raniero, L.; Crosara, K.T.; Baker, M.J.; Siqueira, W.L.; et al. Salivary molecular spectroscopy: A sustainable, rapid and non-invasive monitoring tool for diabetes mellitus during insulin treatment. PLoS ONE 2020, 15, e0223461. [Google Scholar] [CrossRef]
- Bernardes-Oliveira, E.; de Freitas, D.L.D.; de Morais, C.d.L.M.; Cornetta, M.d.C.d.M.; Camargo, J.D.d.A.S.; de Lima, K.M.G.; Crispim, J.C.d.O. Spectrochemical differentiation in gestational diabetes mellitus based on attenuated total reflection Fourier-transform infrared (ATR-FTIR) spectroscopy and multivariate analysis. Sci. Rep. 2020, 10, 19259. [Google Scholar] [CrossRef] [PubMed]
Figure 1.
Data preprocessing procedure involved in smoothing, baseline correction and normalization. The data are split into train (80%) and test (20%) sets, and for balancing data, the SMOTETomek technique is applied to perform the unfolded (PCA-LDA) and 3D discriminant analysis approaches.
Figure 1.
Data preprocessing procedure involved in smoothing, baseline correction and normalization. The data are split into train (80%) and test (20%) sets, and for balancing data, the SMOTETomek technique is applied to perform the unfolded (PCA-LDA) and 3D discriminant analysis approaches.

Figure 2.
Fourier Transform Infrared Spectroscopy Analysis: (a) The data comprise raw infrared (IR) spectra acquired within the bio-fingerprint region, spanning the wavenumber range of 1800–900 cm, extracted from samples belonging to individuals with diabetes and those from (ND) controls. (b) The displayed information represents the mean preprocessed infrared spectra, which have undergone an Amide I and II peak baseline correction using the Asymmetrically Weighted Least Squares (AWLS) method, all within the bio-fingerprint region (1800–900 cm), for samples obtained from both individuals with diabetes and control subjects.

Figure 3.
PCA scores plots: (a) PC1 vs. PC2, (b) PC2 vs. PC3 and (c) PC1 vs. PC3. PC loading on PC1, PC2 and PC3 (d), respectively.
Figure 3.
PCA scores plots: (a) PC1 vs. PC2, (b) PC2 vs. PC3 and (c) PC1 vs. PC3. PC loading on PC1, PC2 and PC3 (d), respectively.

Figure 4.
Discriminant function showing separation between diabetes and non-diabetes samples using (a) 3D-PCA-LDA and (b) PCA-LDA methods.
Figure 4.
Discriminant function showing separation between diabetes and non-diabetes samples using (a) 3D-PCA-LDA and (b) PCA-LDA methods.

Figure 5.
ROC curve to obtain the model performance for (a) 3D-PCA-LDA (AUC = 1.0) and (b) PCA-LDA (AUC = 0.97).
Figure 5.
ROC curve to obtain the model performance for (a) 3D-PCA-LDA (AUC = 1.0) and (b) PCA-LDA (AUC = 0.97).


Table 1.
The prominent wavenumbers attributed for classification rate.
| Wavenumber (cm) | Tentative Assignment |
|---|---|
| 978 | (C-C), -sheet of proteins (=) of lipids |
| 1015 | v(C-O), v(C-C), () |
| 1075 | P-O, , S=O stretching |
| 1154 | v(C-O) of proteins and carbohydrate |
| 1461 | bending |
| 1468 | (C-N) |
| 1564 | Amide II |
| 1587 | stretch |
| 1620 | (C-N) bending |
| 1643 | Amide I |
| 1662 | Amide I |
| 1755 | lipids |
Table 2.
The confusion matrices for datasets, including testing and validation (KFold = 5), were generated using both unfolded and discriminant analysis techniques.
Table 2.
The confusion matrices for datasets, including testing and validation (KFold = 5), were generated using both unfolded and discriminant analysis techniques.
| Methods | PCA-LDA | 3D-PCA-LDA | |||
|---|---|---|---|---|---|
| Non-Diabetes | Diabetes | Non-Diabetes | Diabetes | ||
| Testing | Non-Diabetes | 94% | 6% | 100% | 0% |
| Diabetes | 1% | 99% | 0% | 100% | |
| CV | Non-diabetes | 96% | 4% | 100% | 0% |
| Diabetes | 1% | 99% | 0% | 100% | |
Table 3.
Performance parameters (, , ) of computational modeling using the PCA-LDA versus 3D-PCA-LDA methods for diabetes vs. control.
Table 3.
Performance parameters (, , ) of computational modeling using the PCA-LDA versus 3D-PCA-LDA methods for diabetes vs. control.
| Data Analysis | Methods | Accuracy | Sensitivity | Specificity |
|---|---|---|---|---|
| PCA-LDA | Test | 97% | 94% | ∼99% |
| CV | 98% | 96% | ∼99% | |
| 3D-PCA-LDA | Test | 100% | 100% | 100% |
| CV | 100% | 100% | 100% |
Disclaimer/Publisher’s Note: The statements, opinions and data contained in all publications are solely those of the individual author(s) and contributor(s) and not of MDPI and/or the editor(s). MDPI and/or the editor(s) disclaim responsibility for any injury to people or property resulting from any ideas, methods, instructions or products referred to in the content. |
© 2023 by the authors. Licensee MDPI, Basel, Switzerland. This article is an open access article distributed under the terms and conditions of the Creative Commons Attribution (CC BY) license (https://creativecommons.org/licenses/by/4.0/).
Share and Cite
MDPI and ACS Style
Farooq, S.; Zezell, D.M. Diabetes Monitoring through Urine Analysis Using ATR-FTIR Spectroscopy and Machine Learning. Chemosensors 2023, 11, 565. https://doi.org/10.3390/chemosensors11110565
AMA Style
Farooq S, Zezell DM. Diabetes Monitoring through Urine Analysis Using ATR-FTIR Spectroscopy and Machine Learning. Chemosensors. 2023; 11(11):565. https://doi.org/10.3390/chemosensors11110565
Chicago/Turabian StyleFarooq, Sajid, and Denise Maria Zezell. 2023. "Diabetes Monitoring through Urine Analysis Using ATR-FTIR Spectroscopy and Machine Learning" Chemosensors 11, no. 11: 565. https://doi.org/10.3390/chemosensors11110565
Note that from the first issue of 2016, this journal uses article numbers instead of page numbers. See further details here.