
Optimization Study on Enhancing Deep-Cut Effect of the Vacuum Distillation Unit (VDU)

College of Information Science and Technology, Beijing University of Chemical Technology, Beijing 100020, China
*
Author to whom correspondence should be addressed.
Processes 2022, 10(2), 359; https://doi.org/10.3390/pr10020359
Submission received: 9 January 2022
/
Revised: 8 February 2022
/
Accepted: 11 February 2022
/
Published: 14 February 2022
Abstract
:The vacuum distillation unit (VDU) is the key unit to produce vacuum gas oil and vacuum residue, which has a very important impact on the downstream secondary processing units. The optimization of deep-cut vacuum distillation seeks to improve the yield of heavy vacuum gas oil (HVGO) and its dry point temperature, which is related to the economic benefits of the refinery. In this study, we first established a simple model of a VDU by using the Aspen HYSYS Process simulation software. Then, we built a rigorous model with fast convergence by using the initial values obtained by the simple model. The rigorous model can accurately reflect the refinery’s operation and can make predictions. Then, based on the rigorous model, we increased the flash section temperature (FST) to 420 °C and the steam flow rate (SFR) of the stripping to 26 t/h. We eventually increased the yield of HVGO by 6.3 percentage points to 43.4%, while increasing its D86 95%-point temperature by 31.9 °C to 570.9 °C. In this way, the refinery can effectively optimize the deep-cut vacuum distillation and obtain greater economic benefits.
1. Introduction
The vacuum distillation unit (VDU) is the key component of the crude oil distillation process and the leading device of the refinery [1,2]. It can extract wax oil from atmospheric residue and provide essential raw materials for secondary processing units (such as the catalytic cracking unit and catalytic hydrogenation unit) [3,4]. Since the beginning of the 21st century, the development of the oil refining industry has changed from high-speed development to high-quality development [5,6]. Deep-cut vacuum distillation technology plays a key role in the VDU [7]. Its purpose is to improve the recovery rate of vacuum gas oil (VGO) and the D86-95% point temperature of VGO. The extraction rate of heavy vacuum gas oil (HVGO) is the key factor in determining the quality of the VDU. Therefore, improving its extraction rate is conducive to the economic benefits of the refinery. Therefore, studying the VDU, various feeds and chemical reactions is necessary [8]. It requires us to establish a rigorous mechanism model consistent with reality [9], and through this model, we can accurately determine how to optimize the deep-cut vacuum distillation.
Many scholars have studied the modeling and optimization of vacuum distillation before. The most typical is the research of the American KBC company and Dutch Shell company. KBC [10] simulated the VDU through the Petro-SIM simulation software to increase the cutting point temperature of vacuum distillation to a higher temperature [11]. They strictly controlled the vacuum furnace tube through direct-contact heat transfer to operate for more than half a year at a higher furnace outlet temperature below 425 °C [12]. Shell used deep-flash high vacuum unit technology to design empty columns, which reduced the vacuum in the column and allowed the real boiling point cutting temperature to reach the specified temperature [13]. Shell’s deep-cut vacuum distillation technology can reduce the packing and reduce the pressure drop of the whole column. However, it is only applicable to the design of new vacuum column units. Zhang Long [14] also used the new structured packing method of the vacuum column to improve the pull-out rate by 3%. Jiang Bin [15] used a quench oil cycling structure to reduce residue pyrolysis and polymerization. They used Fluent for the simulation and confirmed that using a quench oil distribution pipe could effectively ensure the uniform temperature distribution of residue. In addition, Liu [16] and Li [17] optimized the deep-cut vacuum distillation from the perspective of the type and amount of activator. Although the extraction rate improved to a certain extent, the range was only within 2~3%. Wei Zhong [18] simulated the atmospheric and vacuum distillation unit with Pro/II software in 2000, calculated the operation data of the atmospheric and vacuum distillation unit under specific conditions and compared them with the production practice. It is considered that it is feasible to simulate the atmospheric and vacuum distillation unit with Pro/II software. However, the products in the first line of decompression are quite different from the actual products. Cheng [19] and Hou [20] established the steady-state simulation process of an atmospheric and vacuum distillation unit on the Aspen Plus software platform, with the calibration data as the main input data and the product control index as the main constraint. Through the adjustment of operating parameters such as operating pressure and feed temperature, the crude oil extraction rate can be increased by 6.8 percentage points to maximize the economic benefits.
However, few scholars have used Aspen HYSYS to model the VDU, and even if they have, there are many deviations from the actual refinery operating environment. This has a certain adverse effect on deep-cut vacuum distillation operation optimization. At the same time, some researchers’ optimization methods are singular, some are too complex, and some economic investments are too large, which greatly reduces the effect of actual optimization. The direct simulation of the vacuum column has the disadvantages of difficult convergence and great difference from the actual situation. This paper presents a method from simple simulation to rigorous simulation. Furthermore, the simple model proposed in this paper divides the vacuum column into four absorption columns for simulation one by one. The simple model can quickly and accurately identify the performance parameters of the VDU, especially the preliminary research of transformation. The model can converge according to the specified input parameters and provide a reliable initial value for establishing a rigorous model. The rigorous model established by this method is easy to converge and has high accuracy. We can further provide a model basis for deep-cut vacuum distillation optimization through this rigorous model.
Finally, we rely on the rigorous model of vacuum distillation established by Aspen HYSYS to find two efficient and convenient methods for optimizing deep-cut vacuum distillation, which are increasing the flash section temperature (FST) of the vacuum column and increasing the steam flow rate (SFR) of the stripping. The simulation software shows that the yield of HVGO and the temperature of its D86 95%-point can be improved greatly by using these two methods simultaneously. Furthermore, within a certain control range, this method can safely, reliably and economically improve the production efficiency of the refinery.
2. Materials and Methods
2.1. Case Study
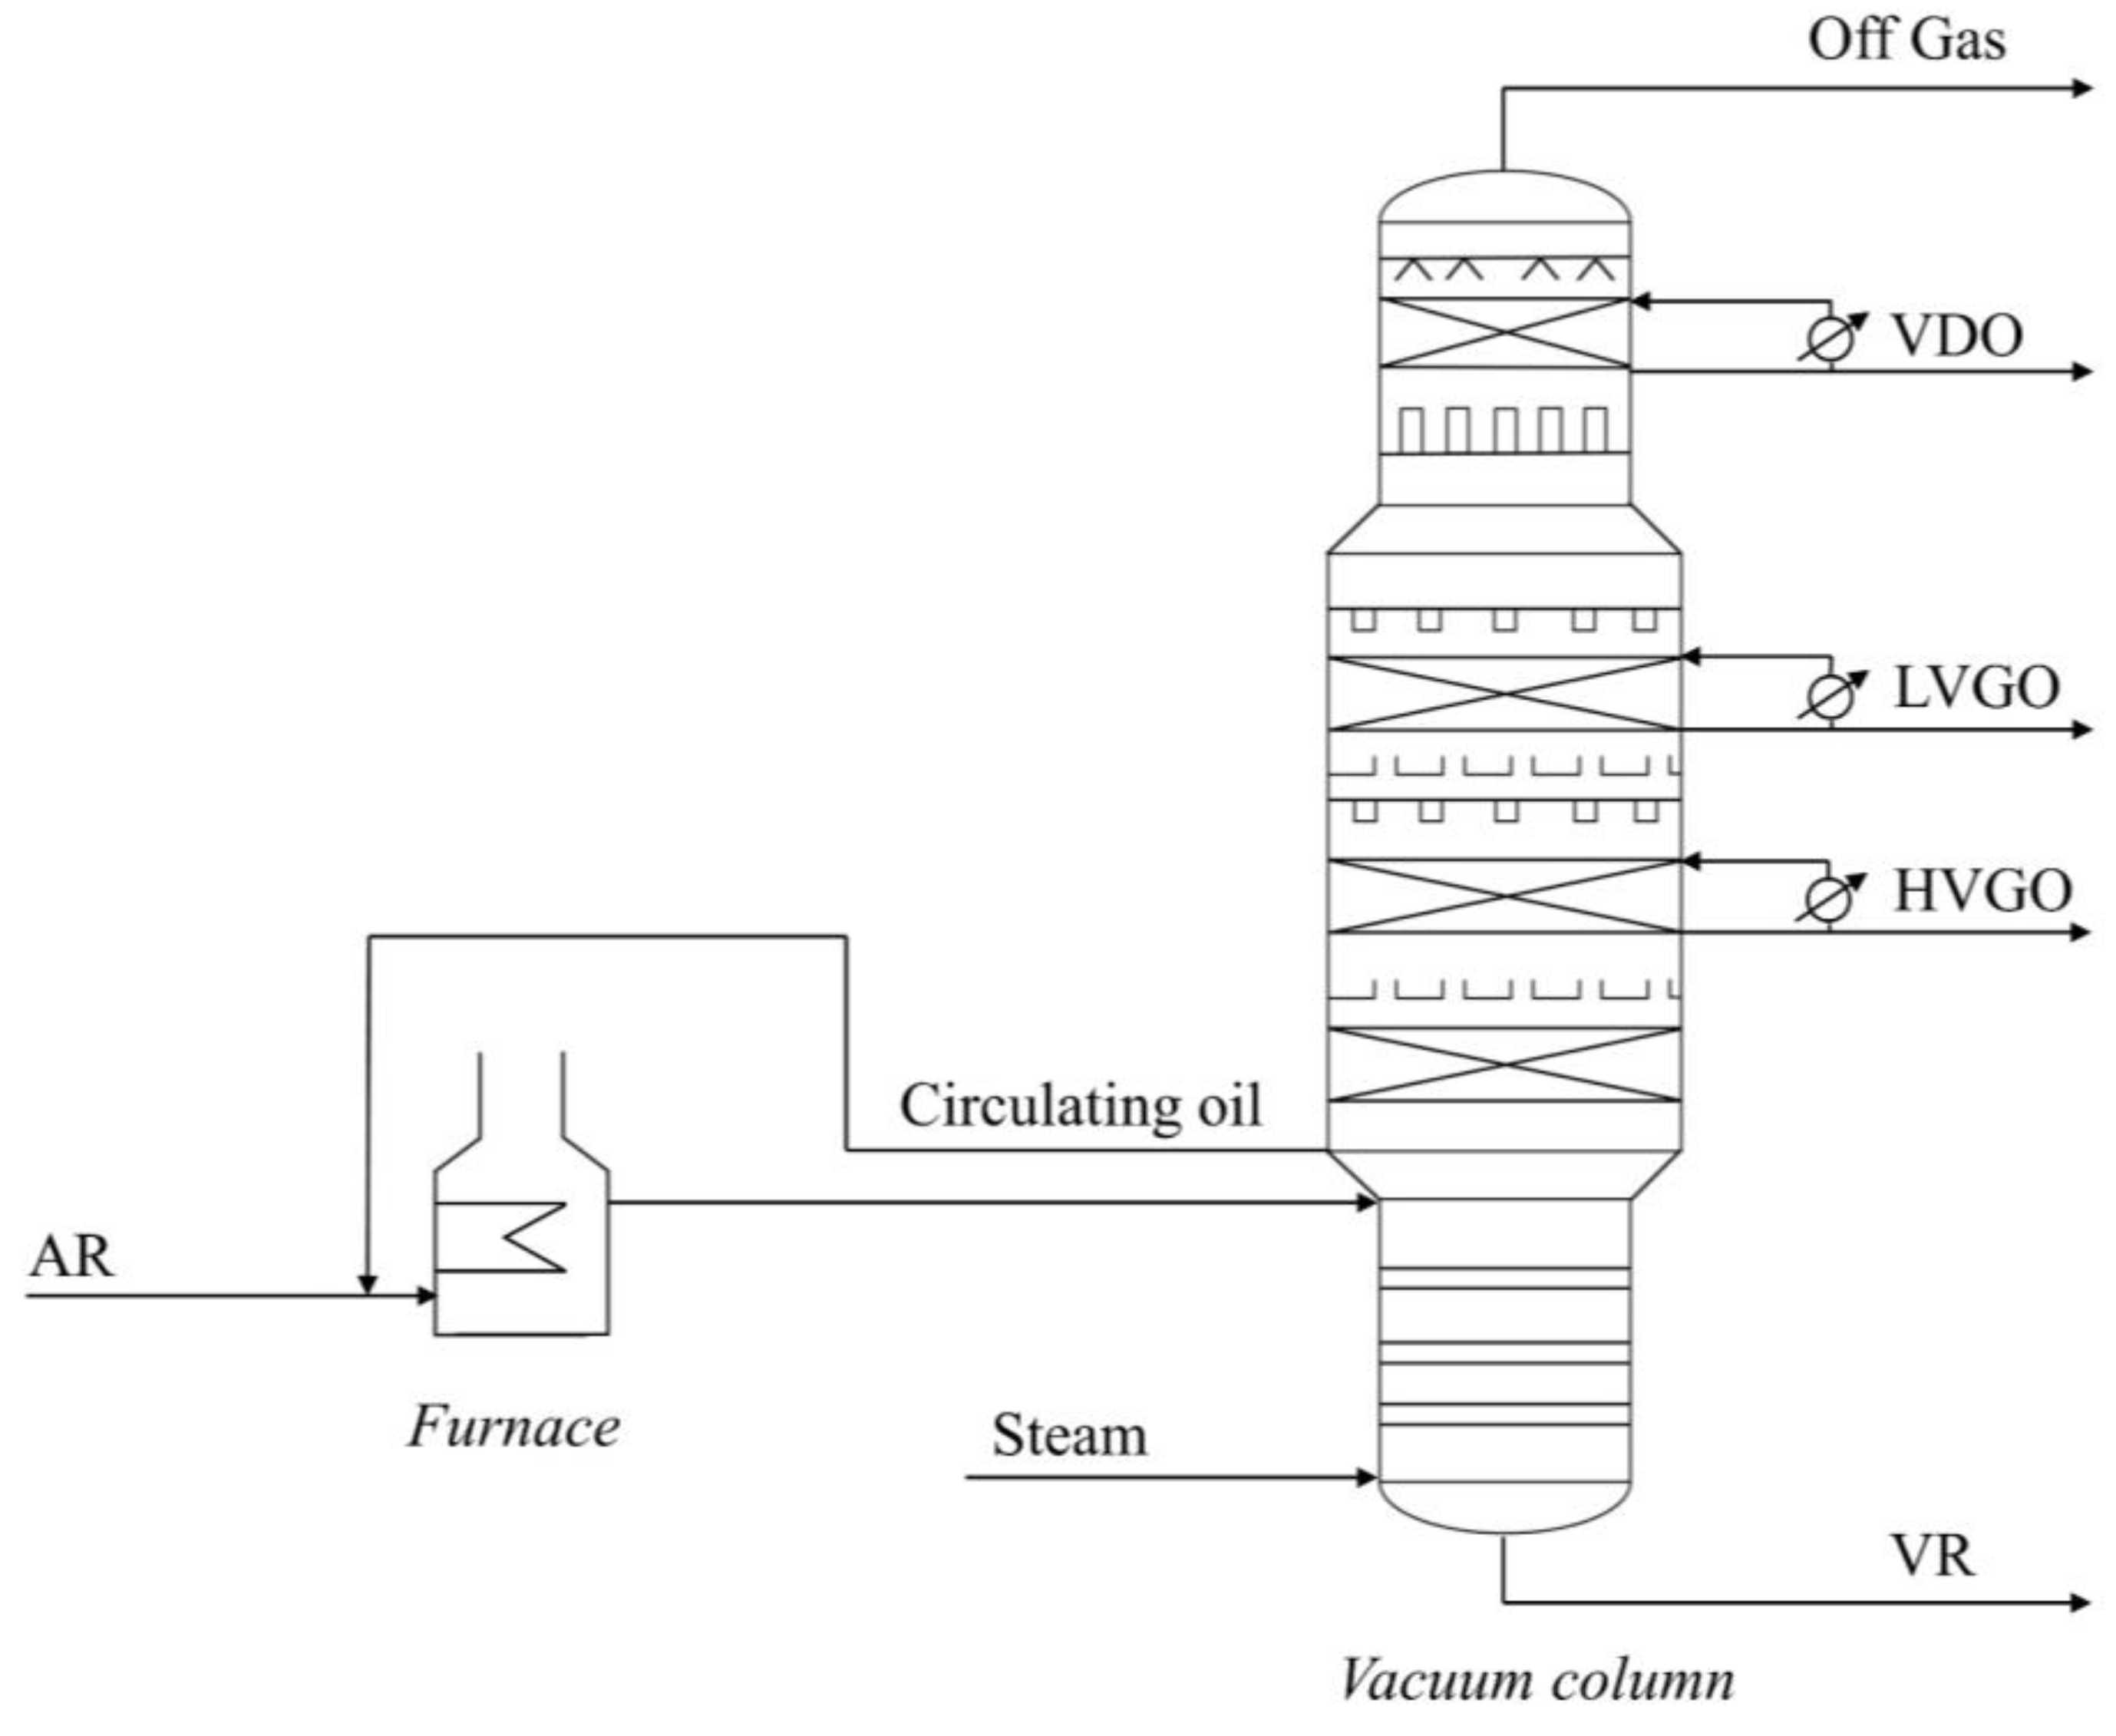
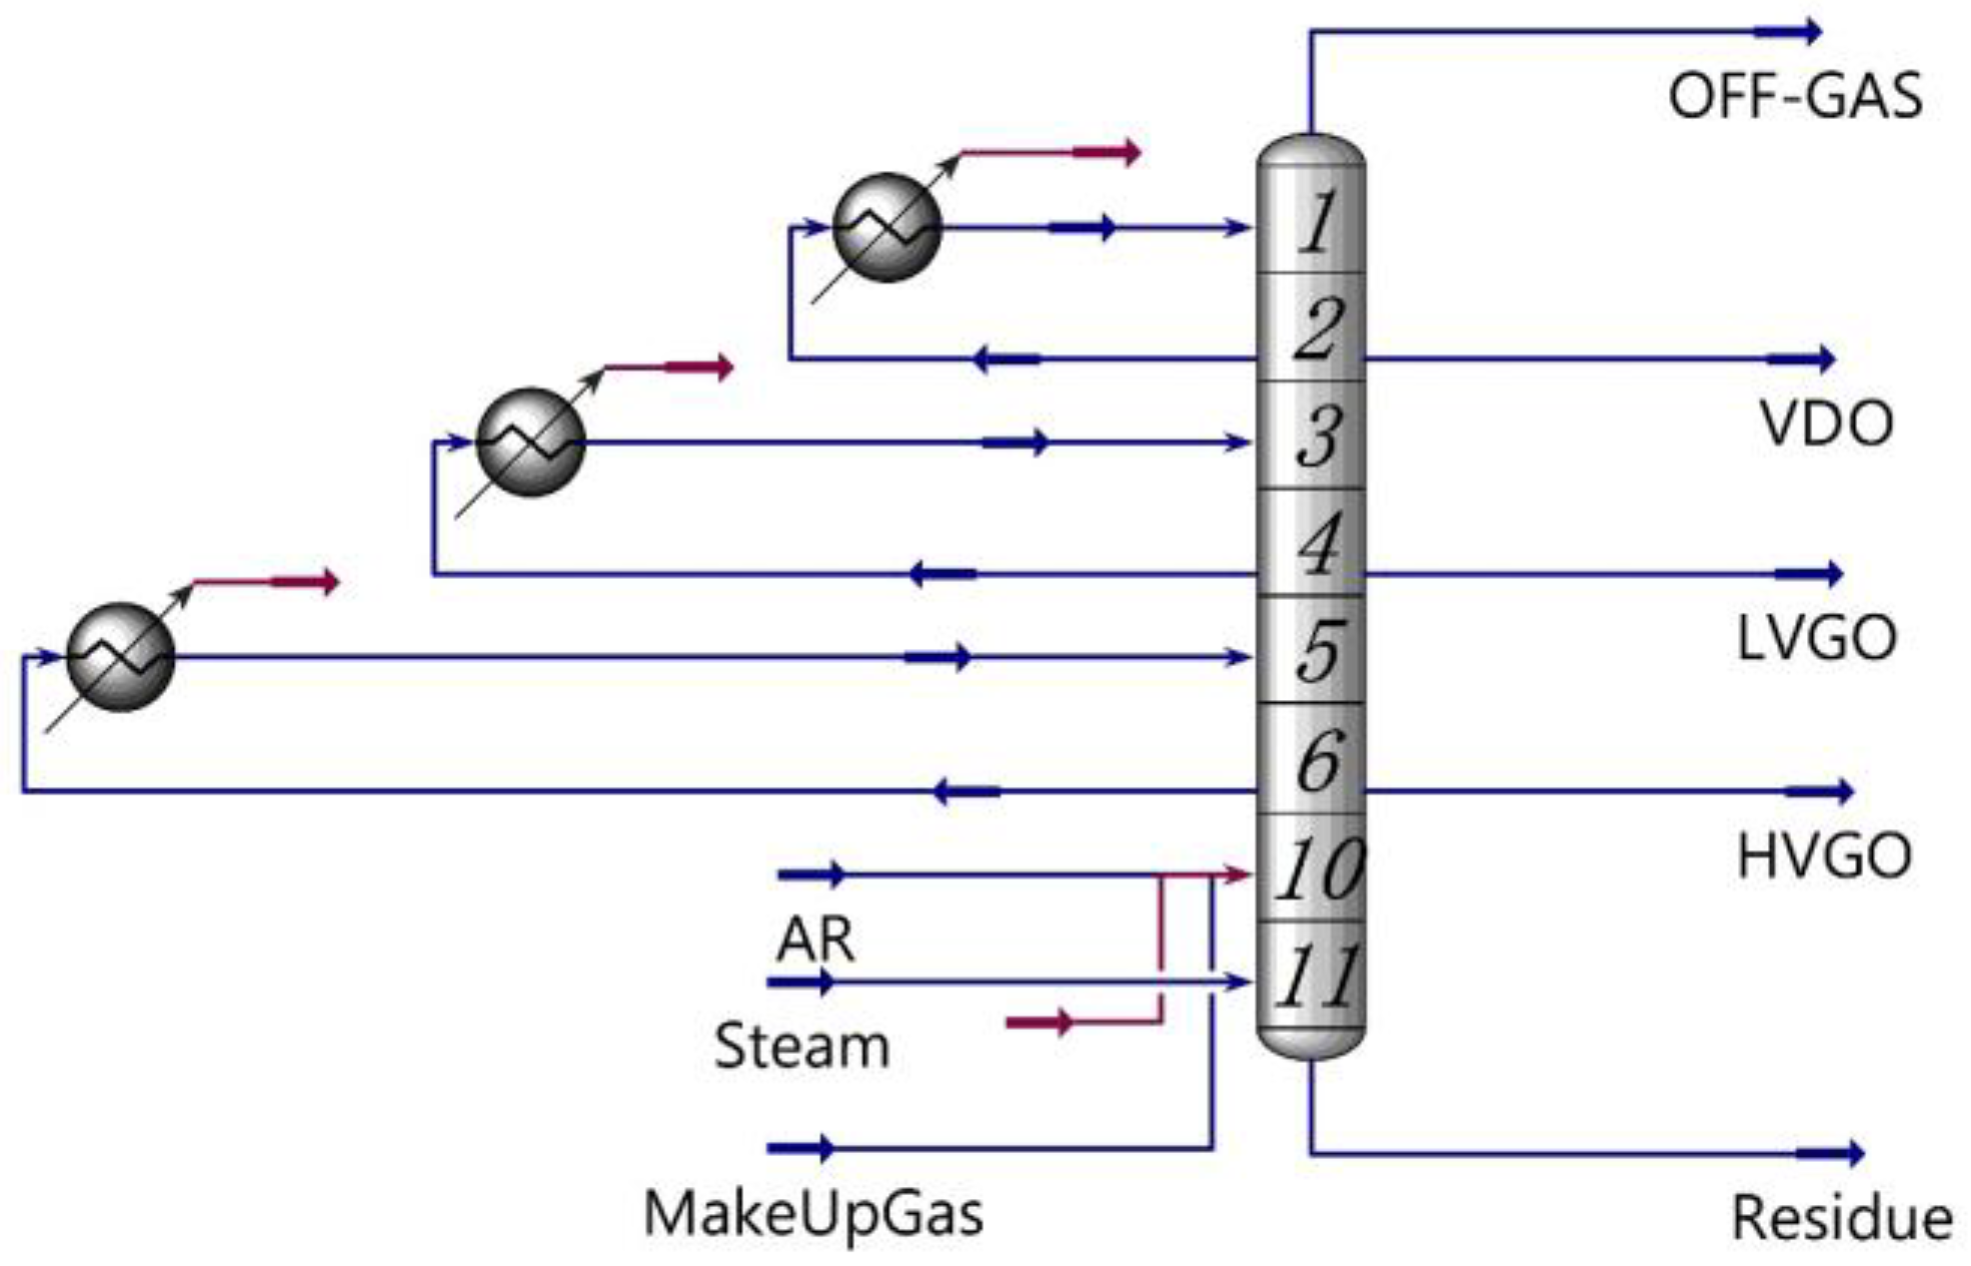
This paper takes the VDU of a refinery in China as an example for simulation research. The refinery process flow diagram is shown in Figure 1. The atmospheric residue (AR) from the bottom of the atmospheric distillation column is preheated to 411 °C by the vacuum heating furnace and then enters the vacuum column. At the same time, low-pressure steam is introduced into the column bottom to strip AR. The vacuum column of the refinery is divided into four zones from top to bottom: vacuum distillate oil (VDO) zone, light vacuum gas oil (LVGO) zone, HVGO zone and stripping and flash zone [21]. There is a mid-cycle in each of the first three zones. The pre-furnace circulation oil is pumped out in the lower part of the HVGO zone back to the heating furnace for reheating. The off-gas discharged from the top of the vacuum column then enters the collection unit, and the vacuum residue (VR) at the bottom of the column enters the downstream secondary processing unit.
2.2. Simulation Methods
Before the simulation, we needed to adjust the device data. During this period, we collected the refinery data in the study case for up to one month. Due to a lack of data or instrument failure, we further averaged or extrapolated or interpolated the data to supplement and improve them and to ensure the integrity of the modeling data [22]. At the same time, we also consulted with the field device engineer about the consistency of the data, and ensured that each complete data set did not contain abnormal operation or major operation adjustment. We usually need to adjust the trial operation data to perfectly match the material balance and energy balance [23]. For this, we retested the original data. Table 1 shows the data requirements of the VDU model.
We used the V11 version of Aspen HYSYS software to carry out the simulation [24,25]. Next, we started by establishing a simple model and then built a rigorous model. Table 2 shows the setting data information of each column. The establishment of the simple model facilitates the convergence of the flowsheet. It allows reliable initial values to be obtained, thus laying the foundation for establishing the rigorous model, which is a closer simulation to the actual working conditions and has a key role in the subsequent study of the operational optimization of the working conditions. The following describes the establishment of the simple model and rigorous model.
2.2.1. Establishment of Simple Model
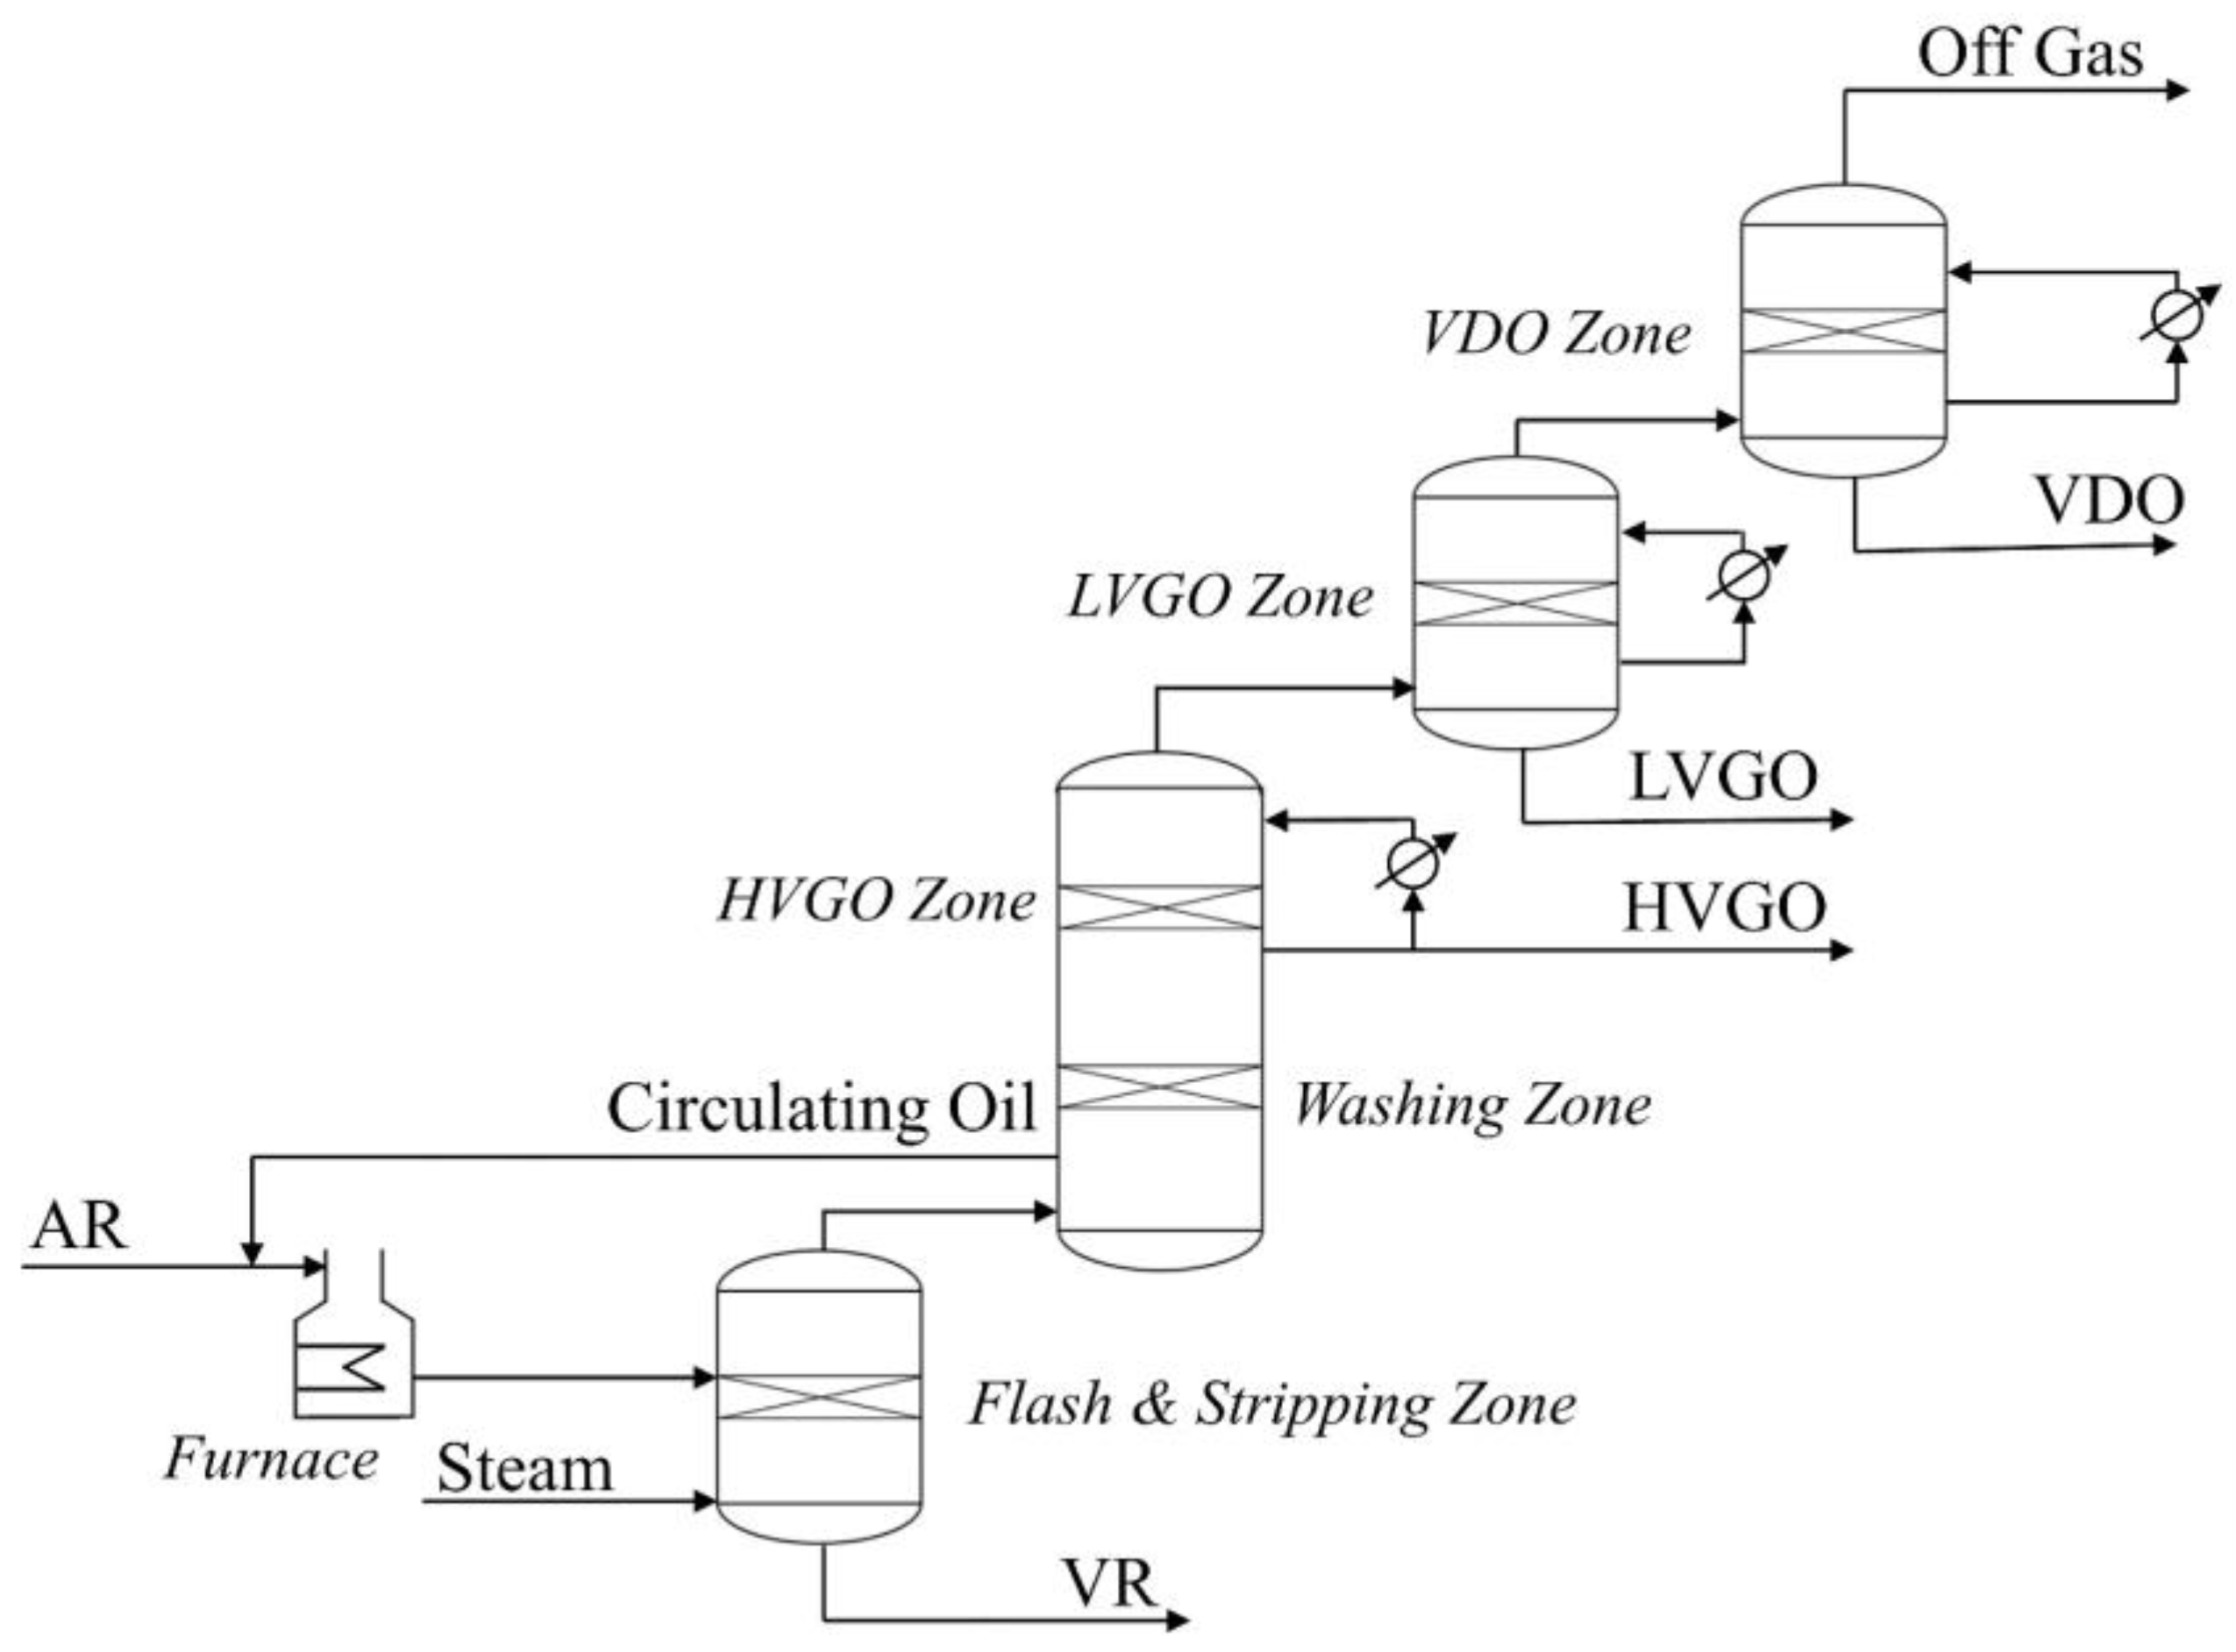
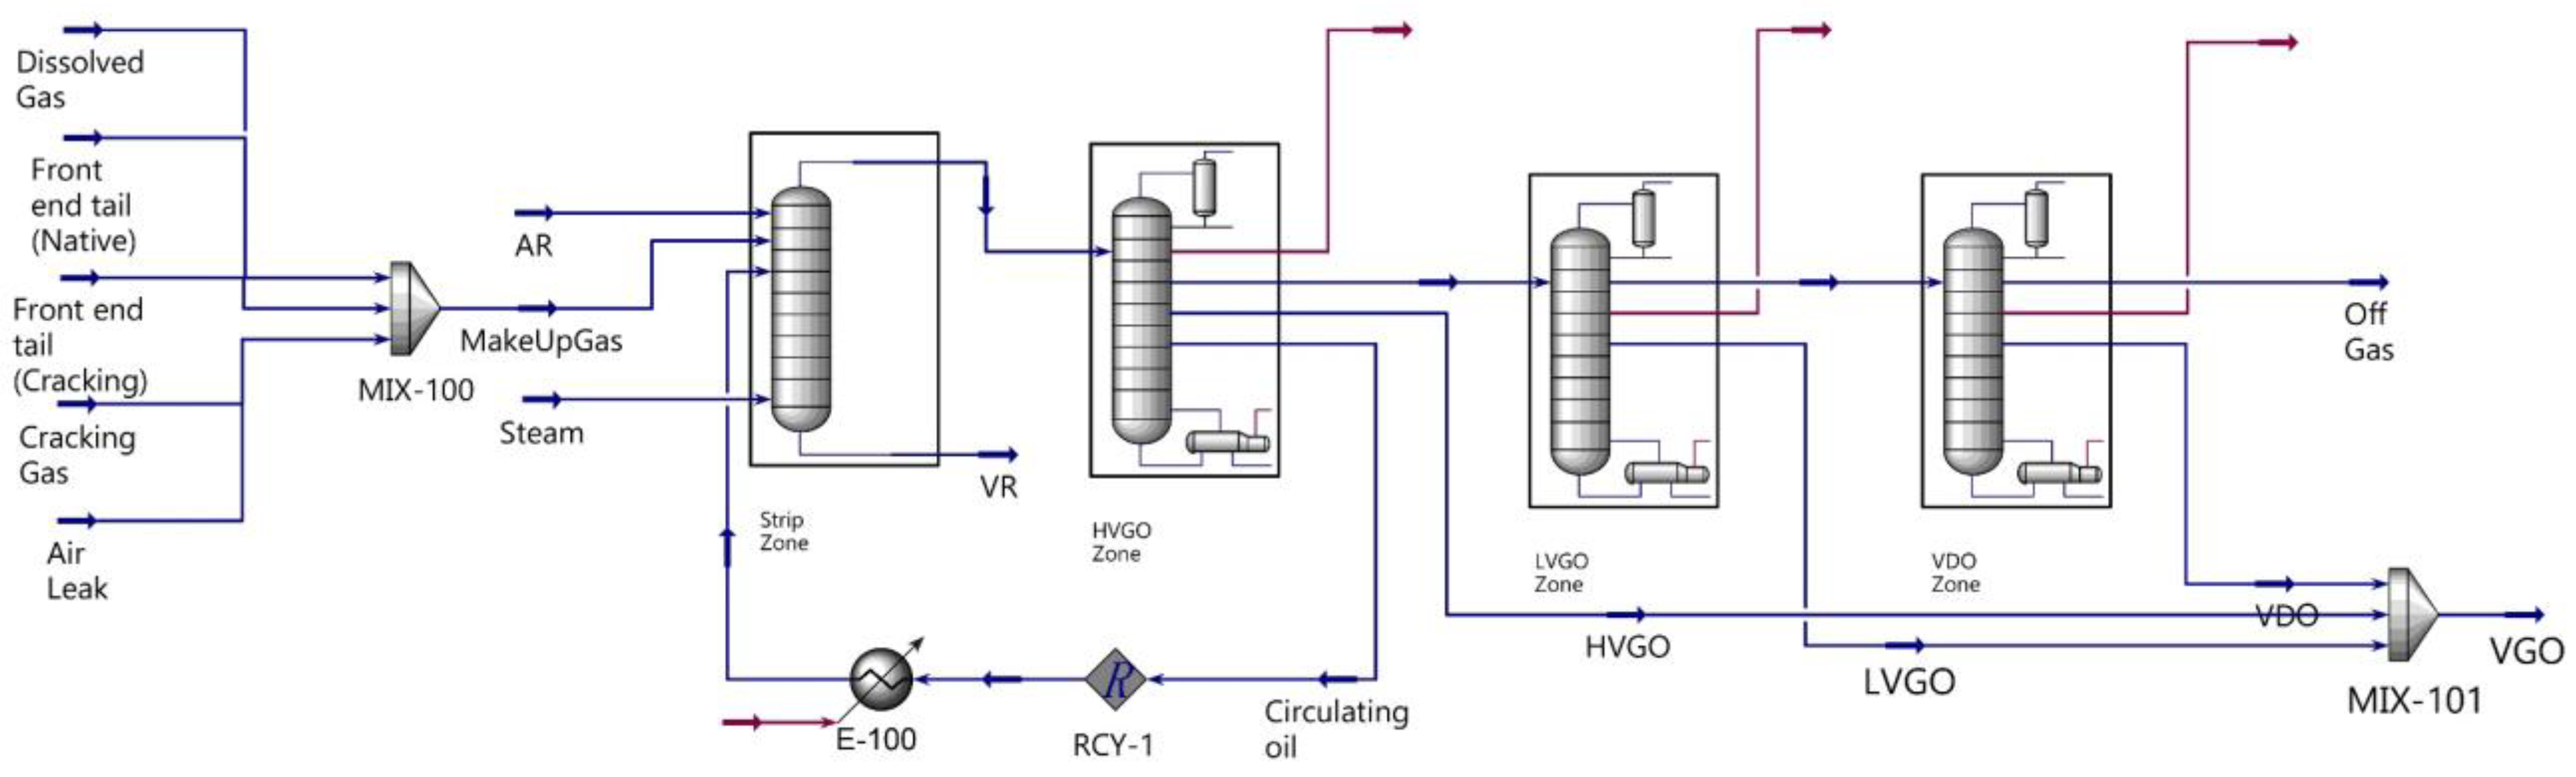
The simple model is established by dividing the vacuum column into four independent absorber modules, shown in Figure 2. The functions of these four absorption columns are: (a) stripping and flash, (b) washing and HVGO output, (c) LVGO output, (d) VDO output. In the simple simulation process, it is necessary to define the components, properties and oil product data according to the obtained data [26]. The simulation data obtained by PR and GS physical property methods for the atmospheric tower are in good agreement with the actual production data, while BK10 is more suitable for the simulation calculation of the vacuum column [27,28]. Therefore, we chose the BK10 method for simulation. Then, we defined the feed, gas stream and stripping steam, added four absorption towers in turn and set the relevant operation parameters. Because the previous data parameters are set correctly and the model is divided into four regions for sequential simulation, the model is easy to converge. A special point to note is the simulation of the pre-furnace circulating oil, which comes from the over-vaporization oil and the entrained oil in the stripping section, and its circulating amount needs to be controlled within 0.2%~5% of the feed amount of AR [29]. The simple model is more likely to converge to the design specification than the rigorous model because the units are relatively independent [30]. Figure 3 shows the simple model process flow in Aspen HYSYS.
2.2.2. Establishment of Rigorous Model
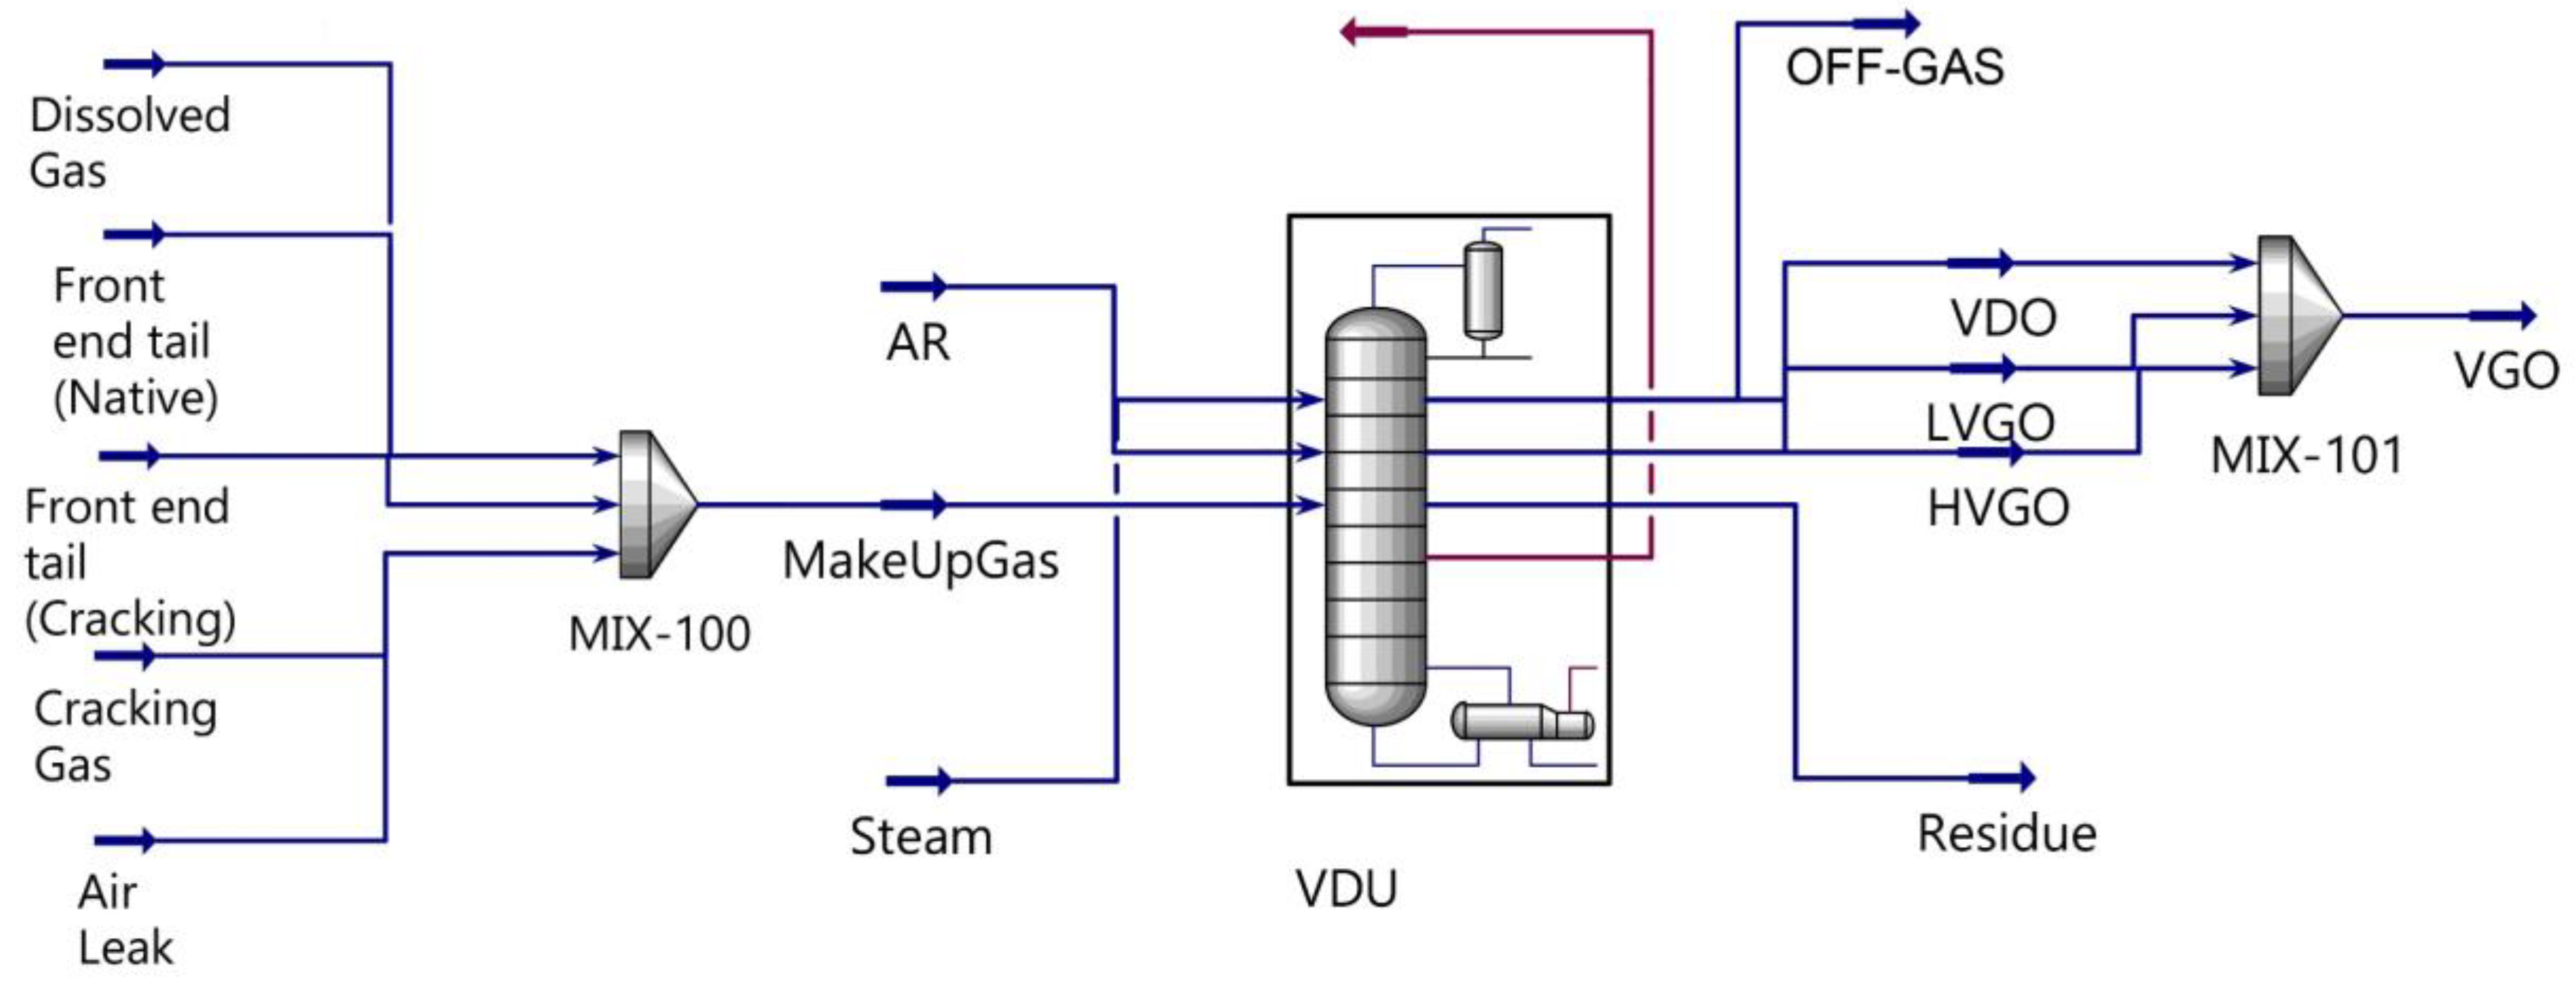
The main data involved in simple model and rigorous model simulation are shown in Table 3. As the parameters of the rigorous model for the VDU are similar to those of the simple model for the VDU, they include the flow rate and temperature difference for each mid-stage cycle, the column top temperature and the flash temperature. Therefore, according to the convergence results of the simple model, the rigorous model can converge quickly. Figure 4 shows the rigorous model of the VDU in Aspen HYSYS, and Figure 5 shows the column environment diagram of the vacuum column sub-model.
3. Results and Discussion
3.1. Analysis of the Main Operating Parameters
In the previous work, we successfully established the rigorous model of the VDU. Next, we need further to determine its compliance with the actual working conditions. First, we check whether the simulated values of the main operating parameters are within the design control range, as shown in Table 4.
The data information in Table 4 shows that the simulation data for this rigorous model are within the control range of the process design parameters.
3.2. Formatting of Mathematical Components
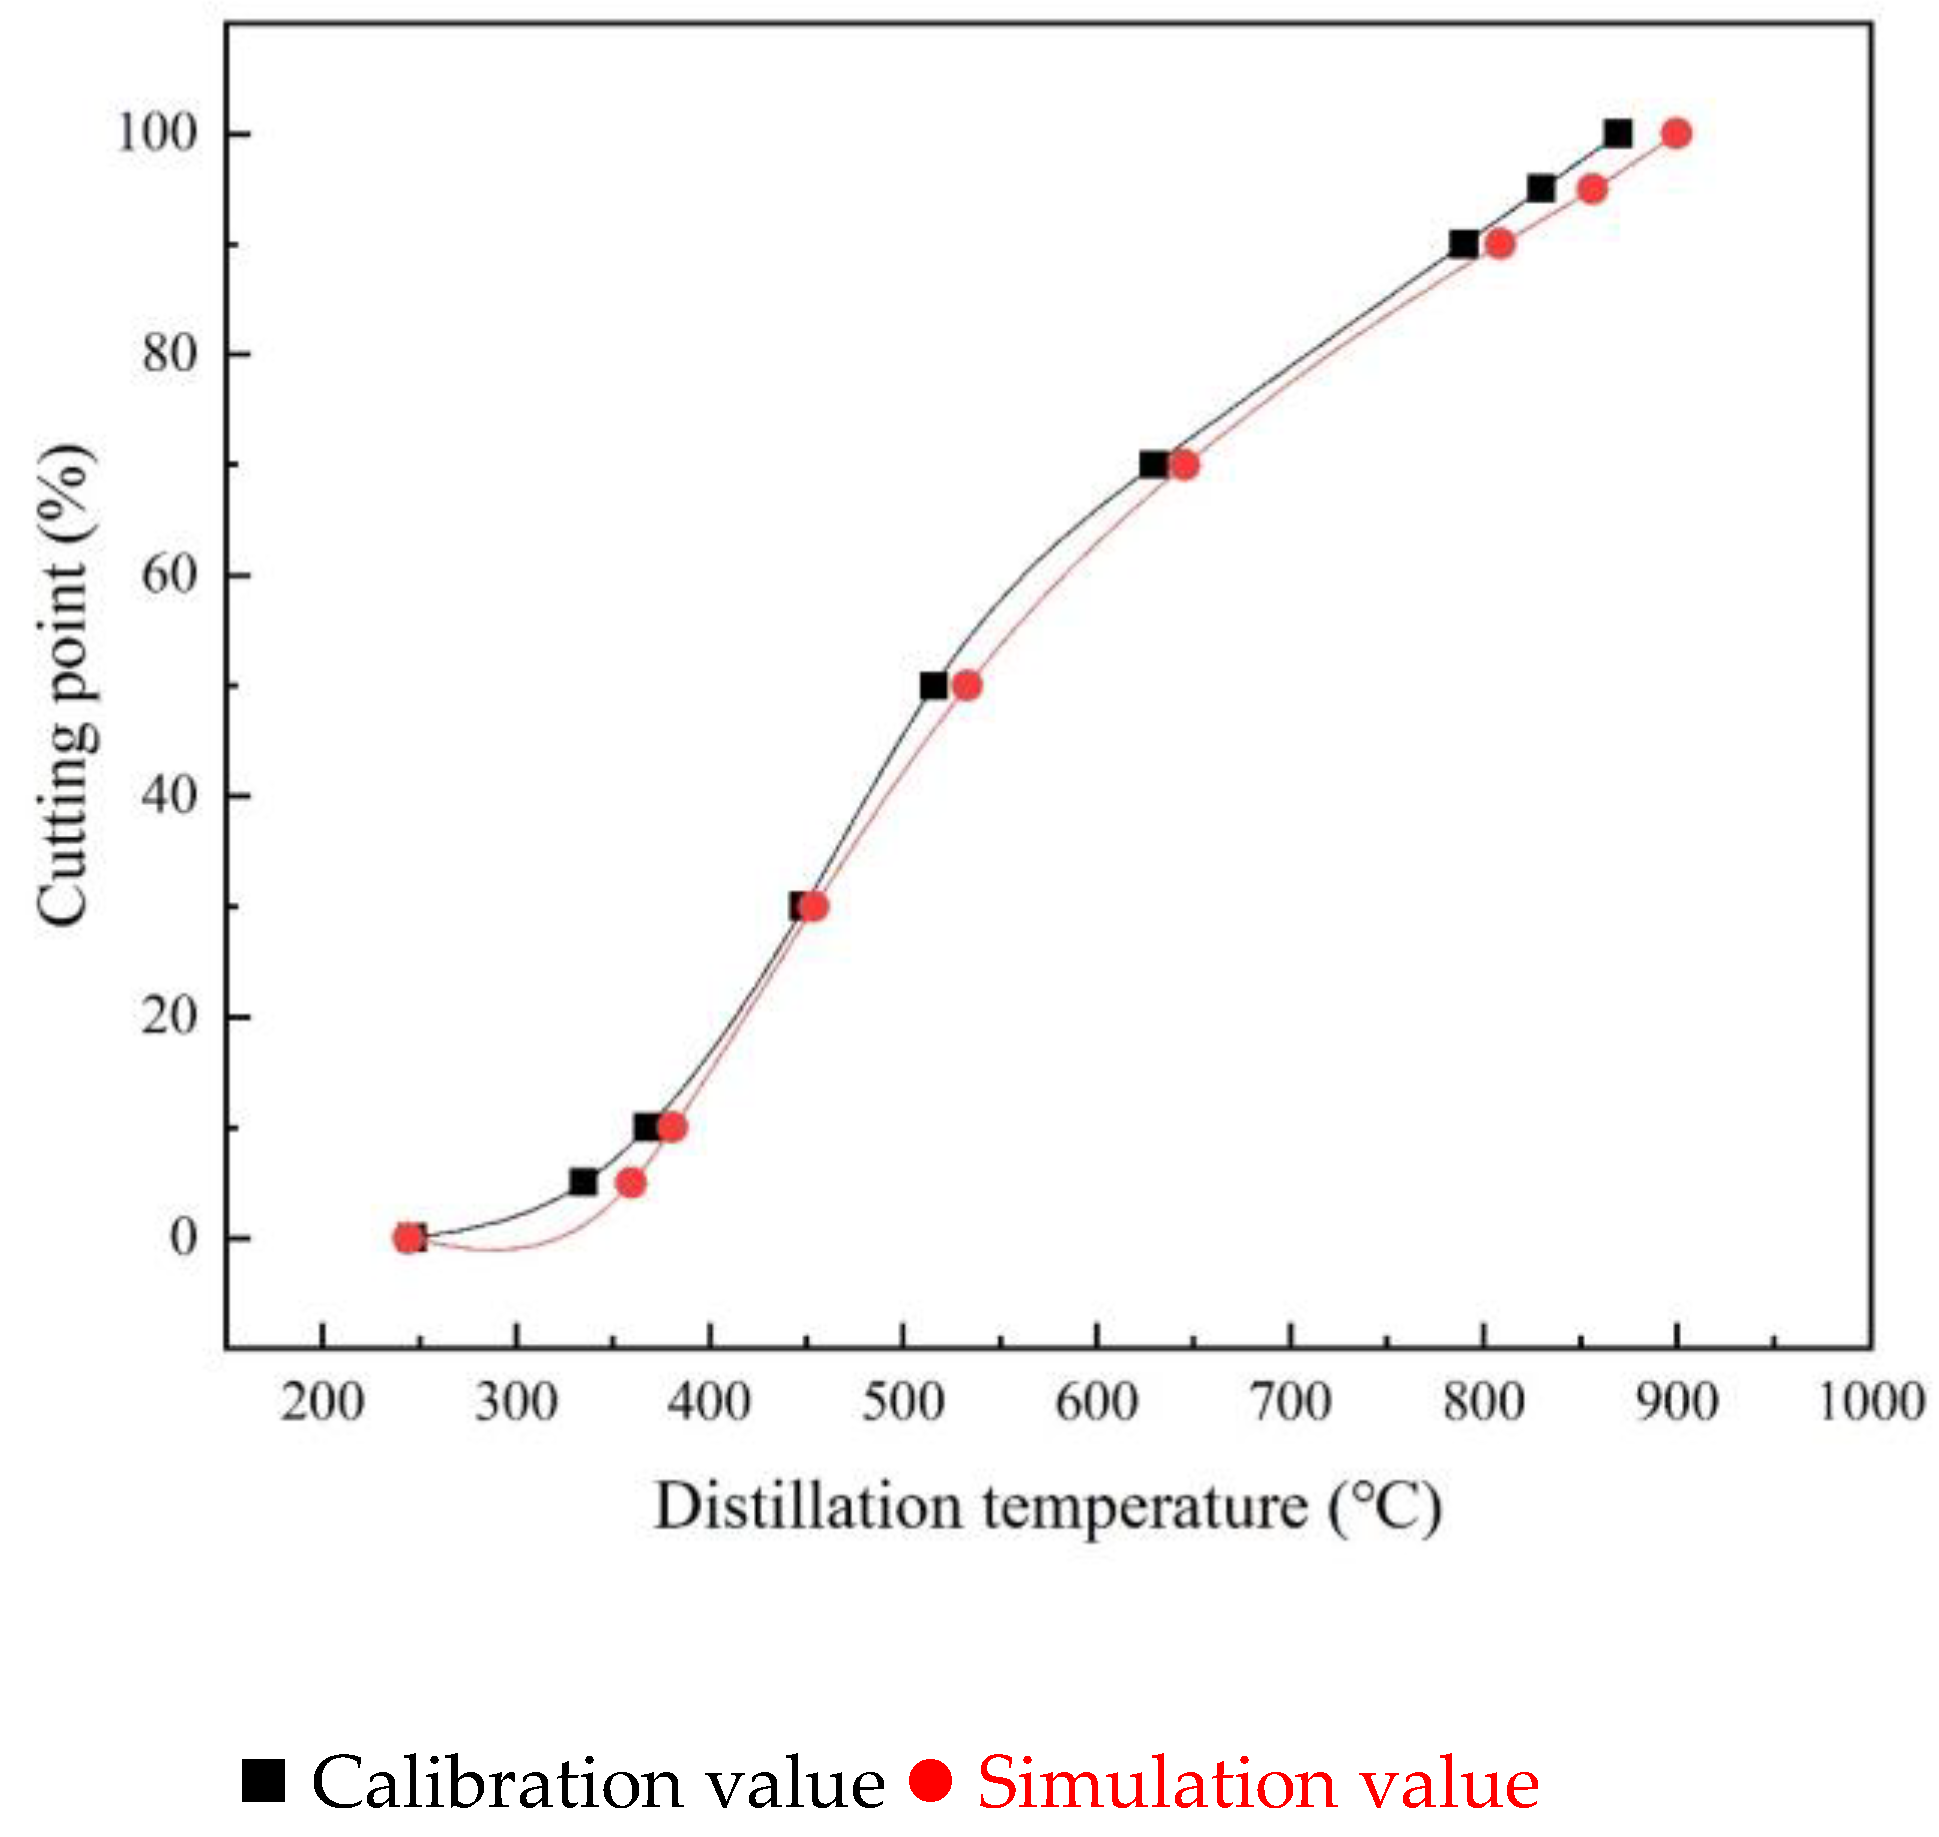
In order to obtain accurate products, it is very important to represent the feed of AR accurately [31]. We focus on two requirements: (a) many virtual components represent AR, (b) high-quality AR analysis data. According to the collected limited feed distillation data, we use the statistical function in Aspen to extrapolate the distillation curve [32,33] and compare it with the simulated feed distillation information, as shown in Figure 6 below.
It can be seen from Figure 6 that the distillation data of the simulated synthetic feed and the actual feed are consistent. This also further ensures the accuracy of the simulation and provides a prerequisite for obtaining authentic products in the follow-up.
3.3. Analysis of Vacuum Column Tray Temperature and Pressure
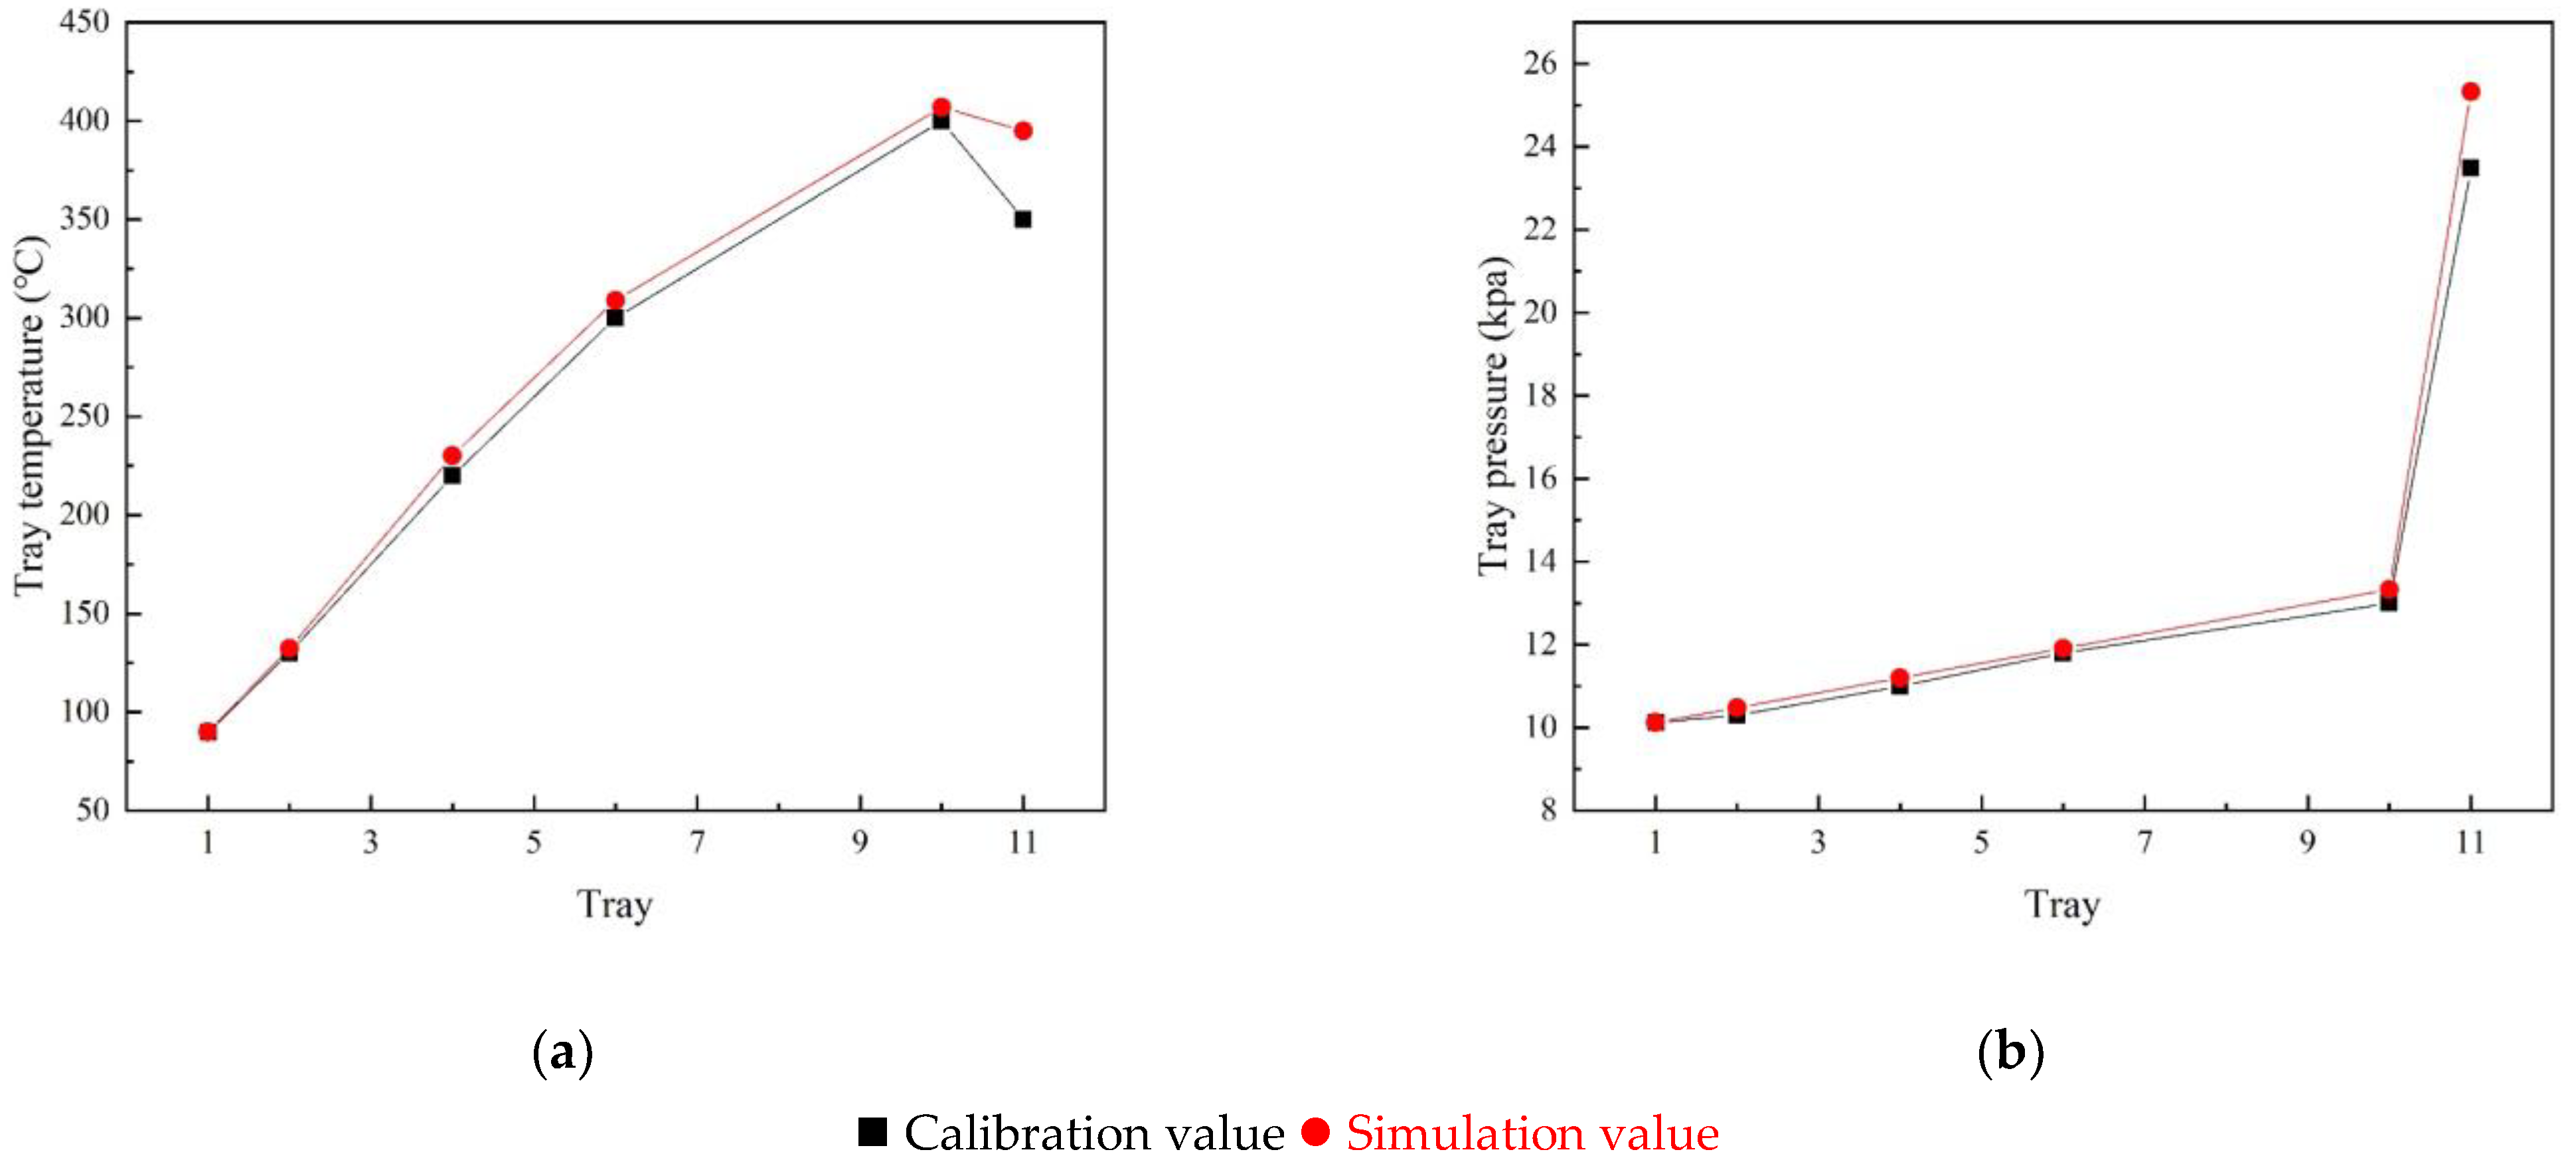
For this simulation, it is necessary to analyze the contrast column environment further to determine whether the model is accurate. The two important analysis and measurement parameters for the vacuum column are the tray temperature and the tray pressure [34]. The following analysis compares the temperature and pressure of the vacuum column tray of the rigorous model with the actual column tray temperature and pressure, as shown in Figure 7 below.
Figure 7 shows that the temperature and pressure curve of the vacuum column tray in the model is consistent with the temperature and pressure curve fitted by the actual tray, which further proves that the simulated column environment is consistent with the actual situation. For the eleventh tray shown in Figure 7a, there is a certain degree of temperature difference because the tower bottom temperature needs to be adjusted to achieve model convergence in this simulation. The temperature change at this place has little impact on the actual products, especially on the HVGO studied.
3.4. Analysis of the Yield of the Main Products
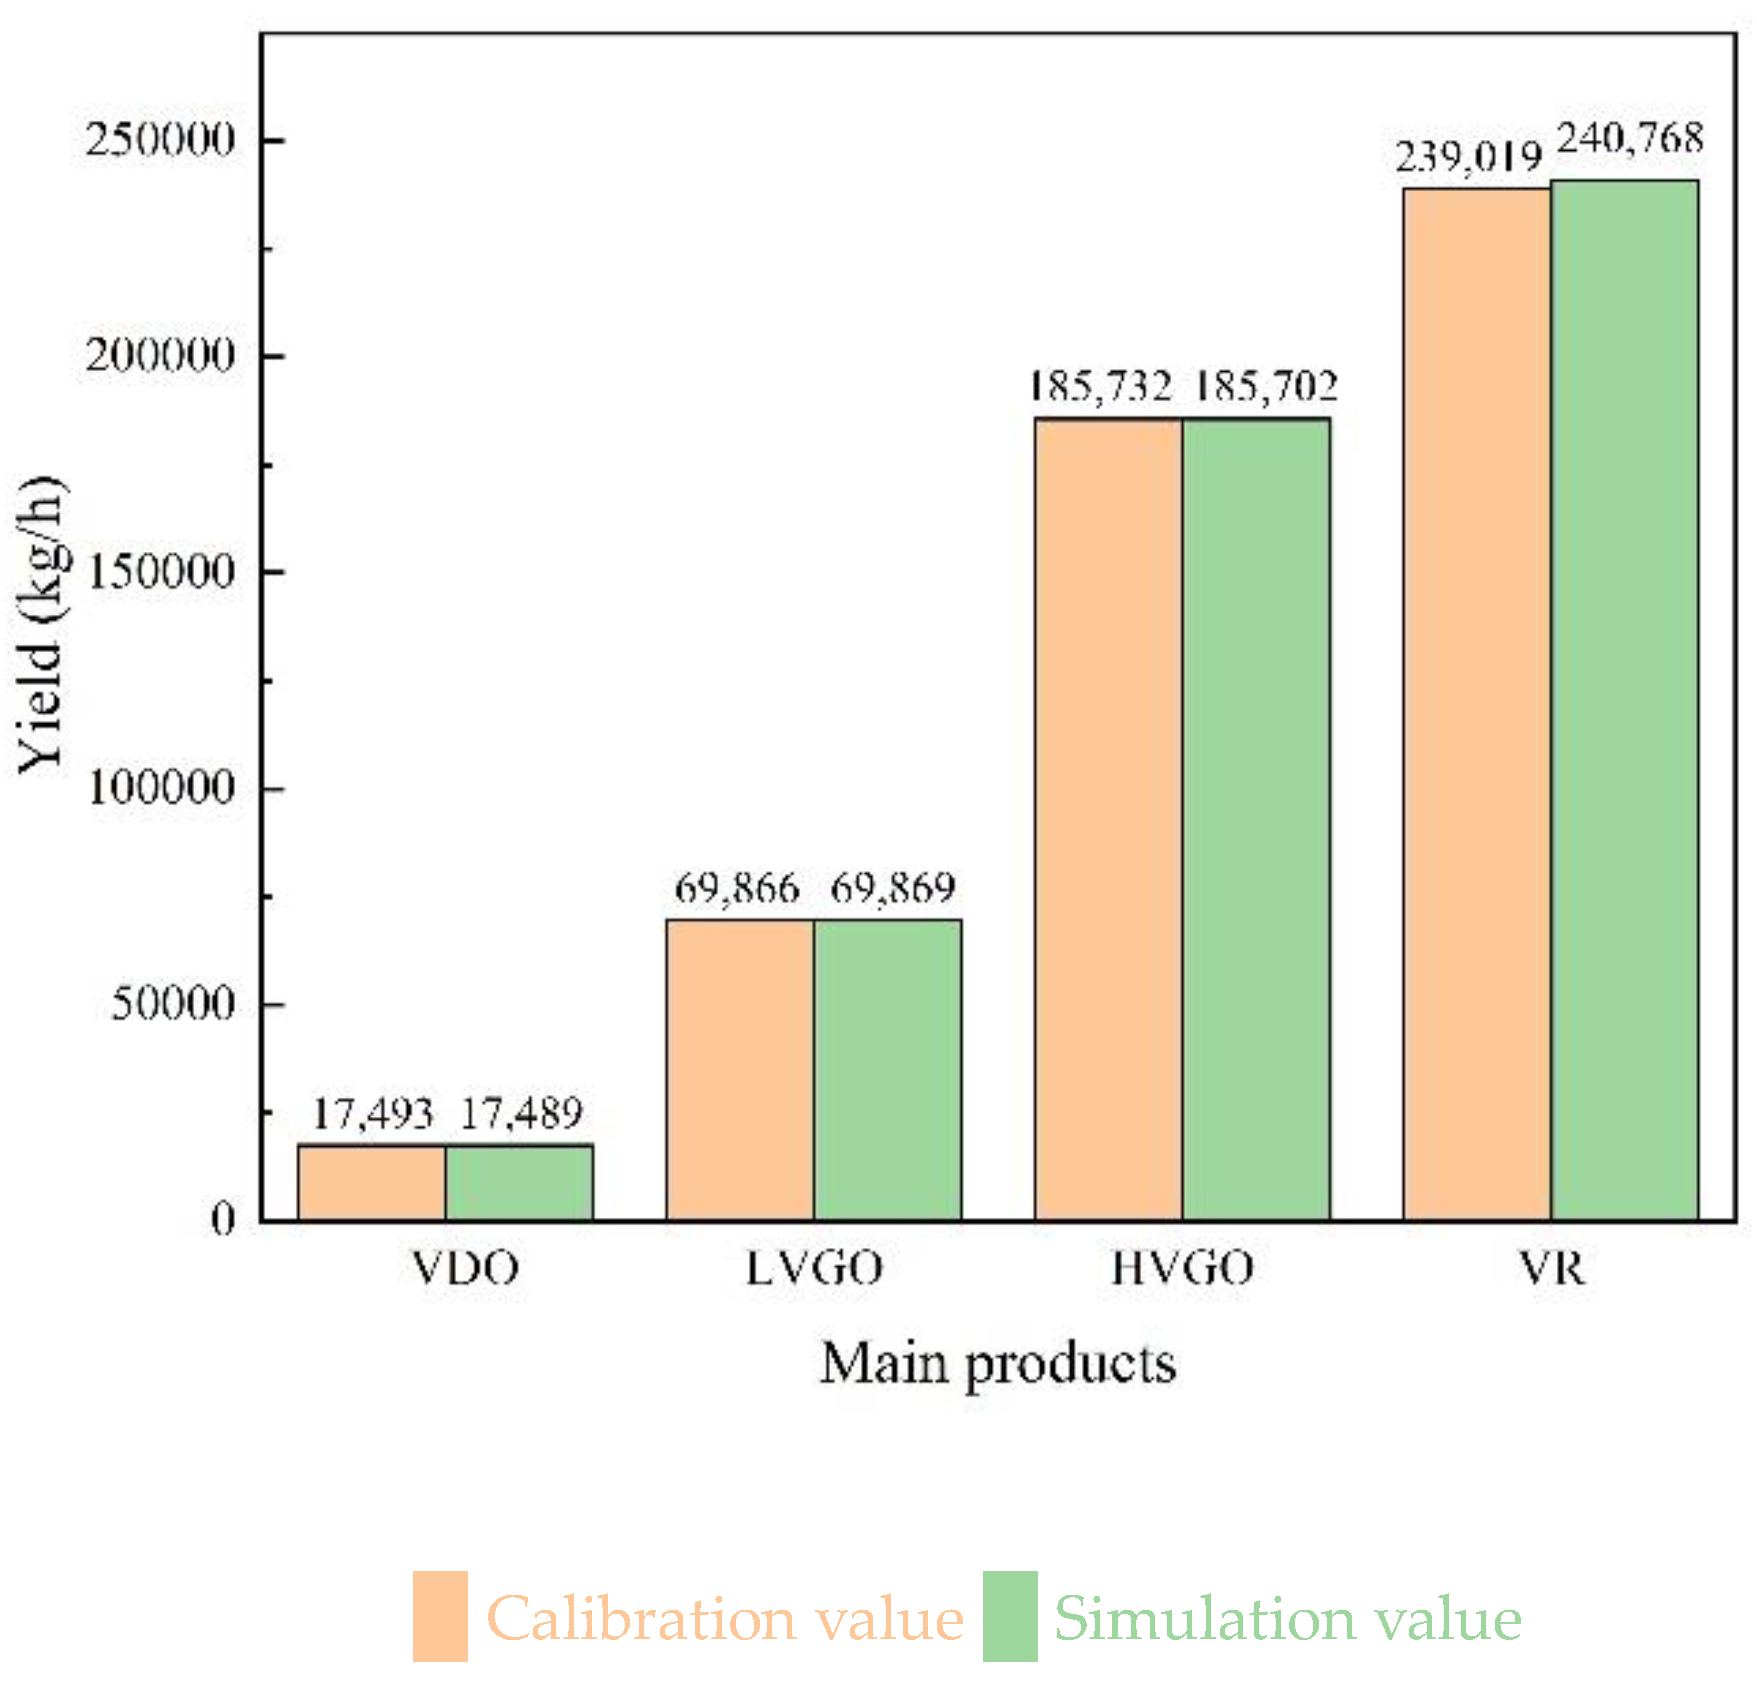
The main products of the VDU include VDO, LVGO, HVGO and VR. We compared the calibration results of the simulated output and the actual working conditions to draw a histogram. It can be seen from Figure 8 that the deviation between the simulated and the actual results is very small. The rigorous model simulates the process consistently with the actual product output.
3.5. Analysis of the Main Product Distillation Data
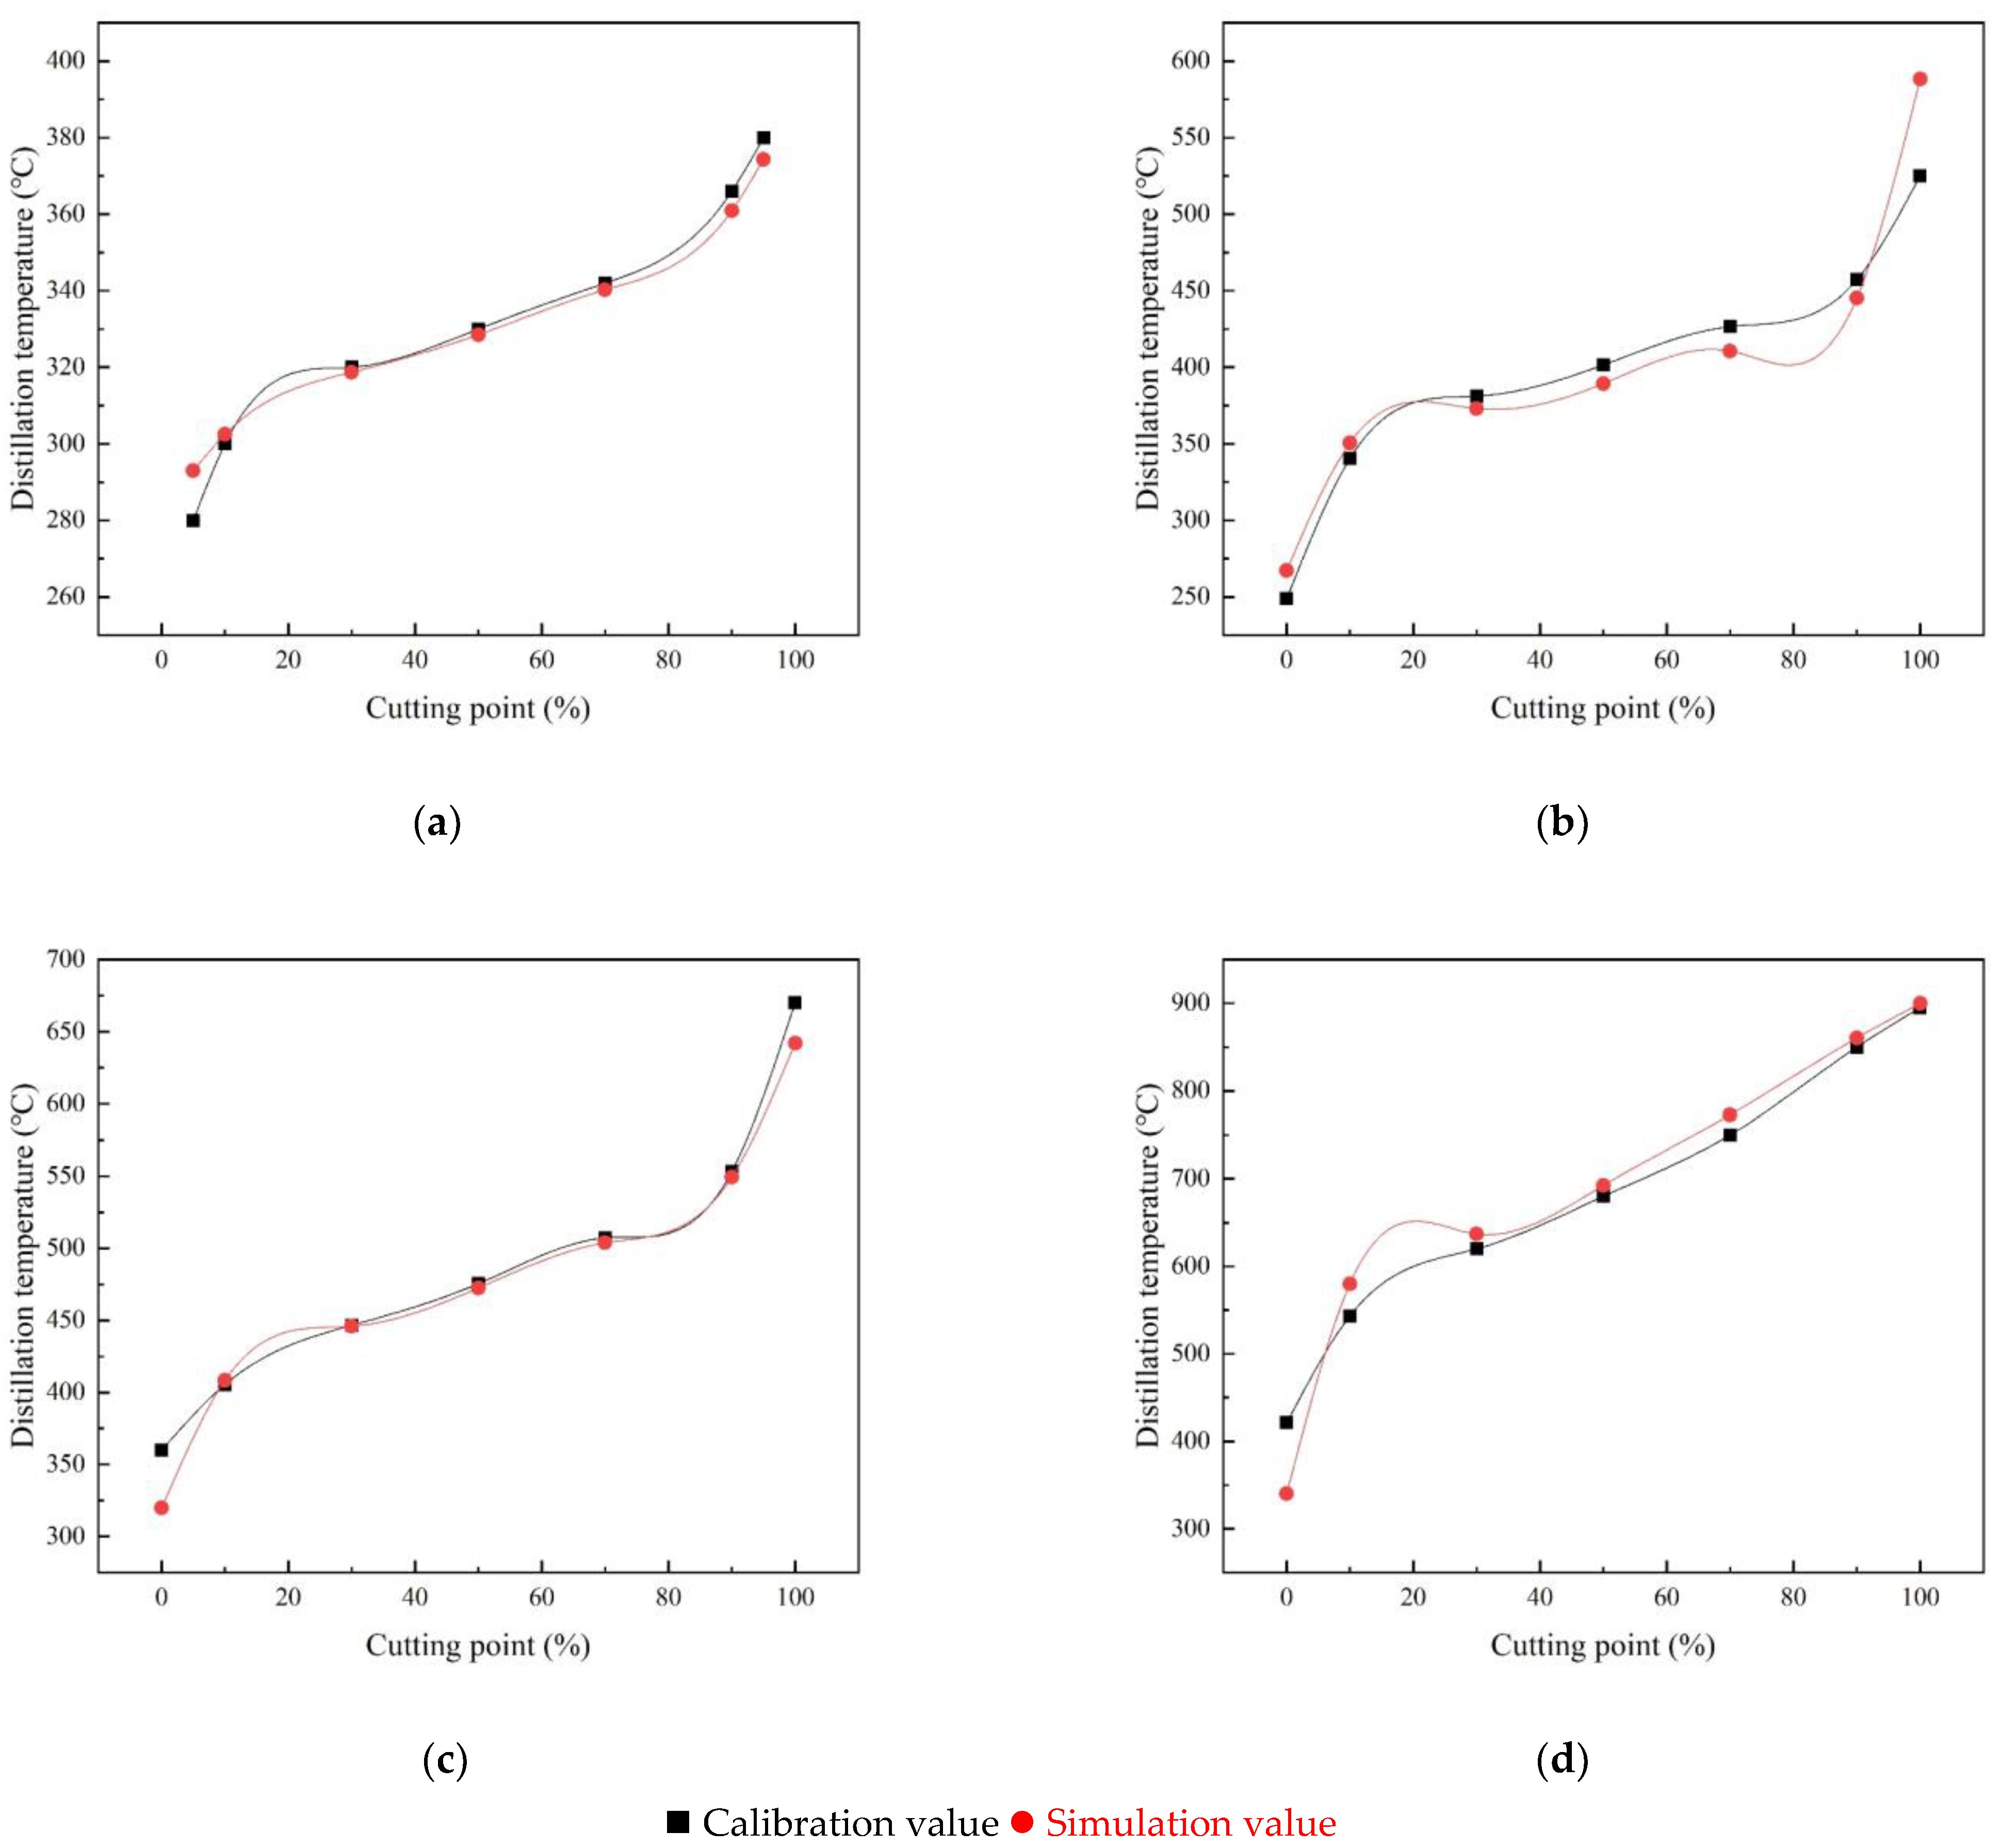
In addition to the analysis of the yield of the main products of the VDU, whether one can obtain qualified products is an important assessment index of the process flow, which requires oil evaluation [35]. Therefore, we compared and analyzed the distillation curves of the main products, as shown in Figure 9 below. The distillation curves of the VDO, HVGO and VR are in good agreement with each other, which further indicates that the simulations obtained a qualified product that matches the properties of the actual product. There are some differences in the distillation curve in Figure 9b. It can be seen that the LVGO within 90% of the cutting point are relatively consistent, while the fitting of the parts beyond 90% of the cutting point needs to be significantly improved. Since the difference has little influence on the properties of LVGO and has little relationship with the research of HVGO, it can be ignored.
The above data comparison and analysis prove that the simulation results of the rigorous model derived from the simple model can accurately reflect the actual operation of the refinery. Next, the strict model can be further used to study the optimization of deep- cut vacuum distillation.
3.6. Optimization Analysis of Deep-Cut Vacuum Distillation
With the increasing demand for heavy oil processing in refineries, vacuum distillation simulation has become an important industrial application to optimize the deep-cut processing of heavy crude oil [36]. Production efficiency can be increased by increasing the D86 95%-point temperature of HVGO above 565 °C to produce more VGO for downstream units (such as the catalytic cracking unit). In contrast, for the rigorous model obtained above, the D86 95%-point temperature of HVGO is only 539 °C, and the yield is only 36.1%. There is still much room for optimizing and improving the refinery’s production process. In the optimization process, it should be noted that the residual carbon content of HVGO and the light component content of VR lower than 538 °C should not exceed 5%. Next, we carry out the deep-cut vacuum distillation transformation of the VDU from the two aspects of increasing the feed vaporization rate and optimizing the stripping steam. Then, we improve the cutting point temperature and yield of HVGO.
In this optimization process, we use Aspen’s case study tool [37,38]. The tool can observe the response of dependent variables when the process-independent variables change in steady-state simulation. For each independent variable, the user specifies the up/down line and step size. Aspen HYSYS will change the independent variables and calculate the dependent variables according to the upper and lower limits and steps specified by the user. The details of the independent variables set in this study are shown in Table 5 below.
3.6.1. Increasing the Feed Vaporization Rate
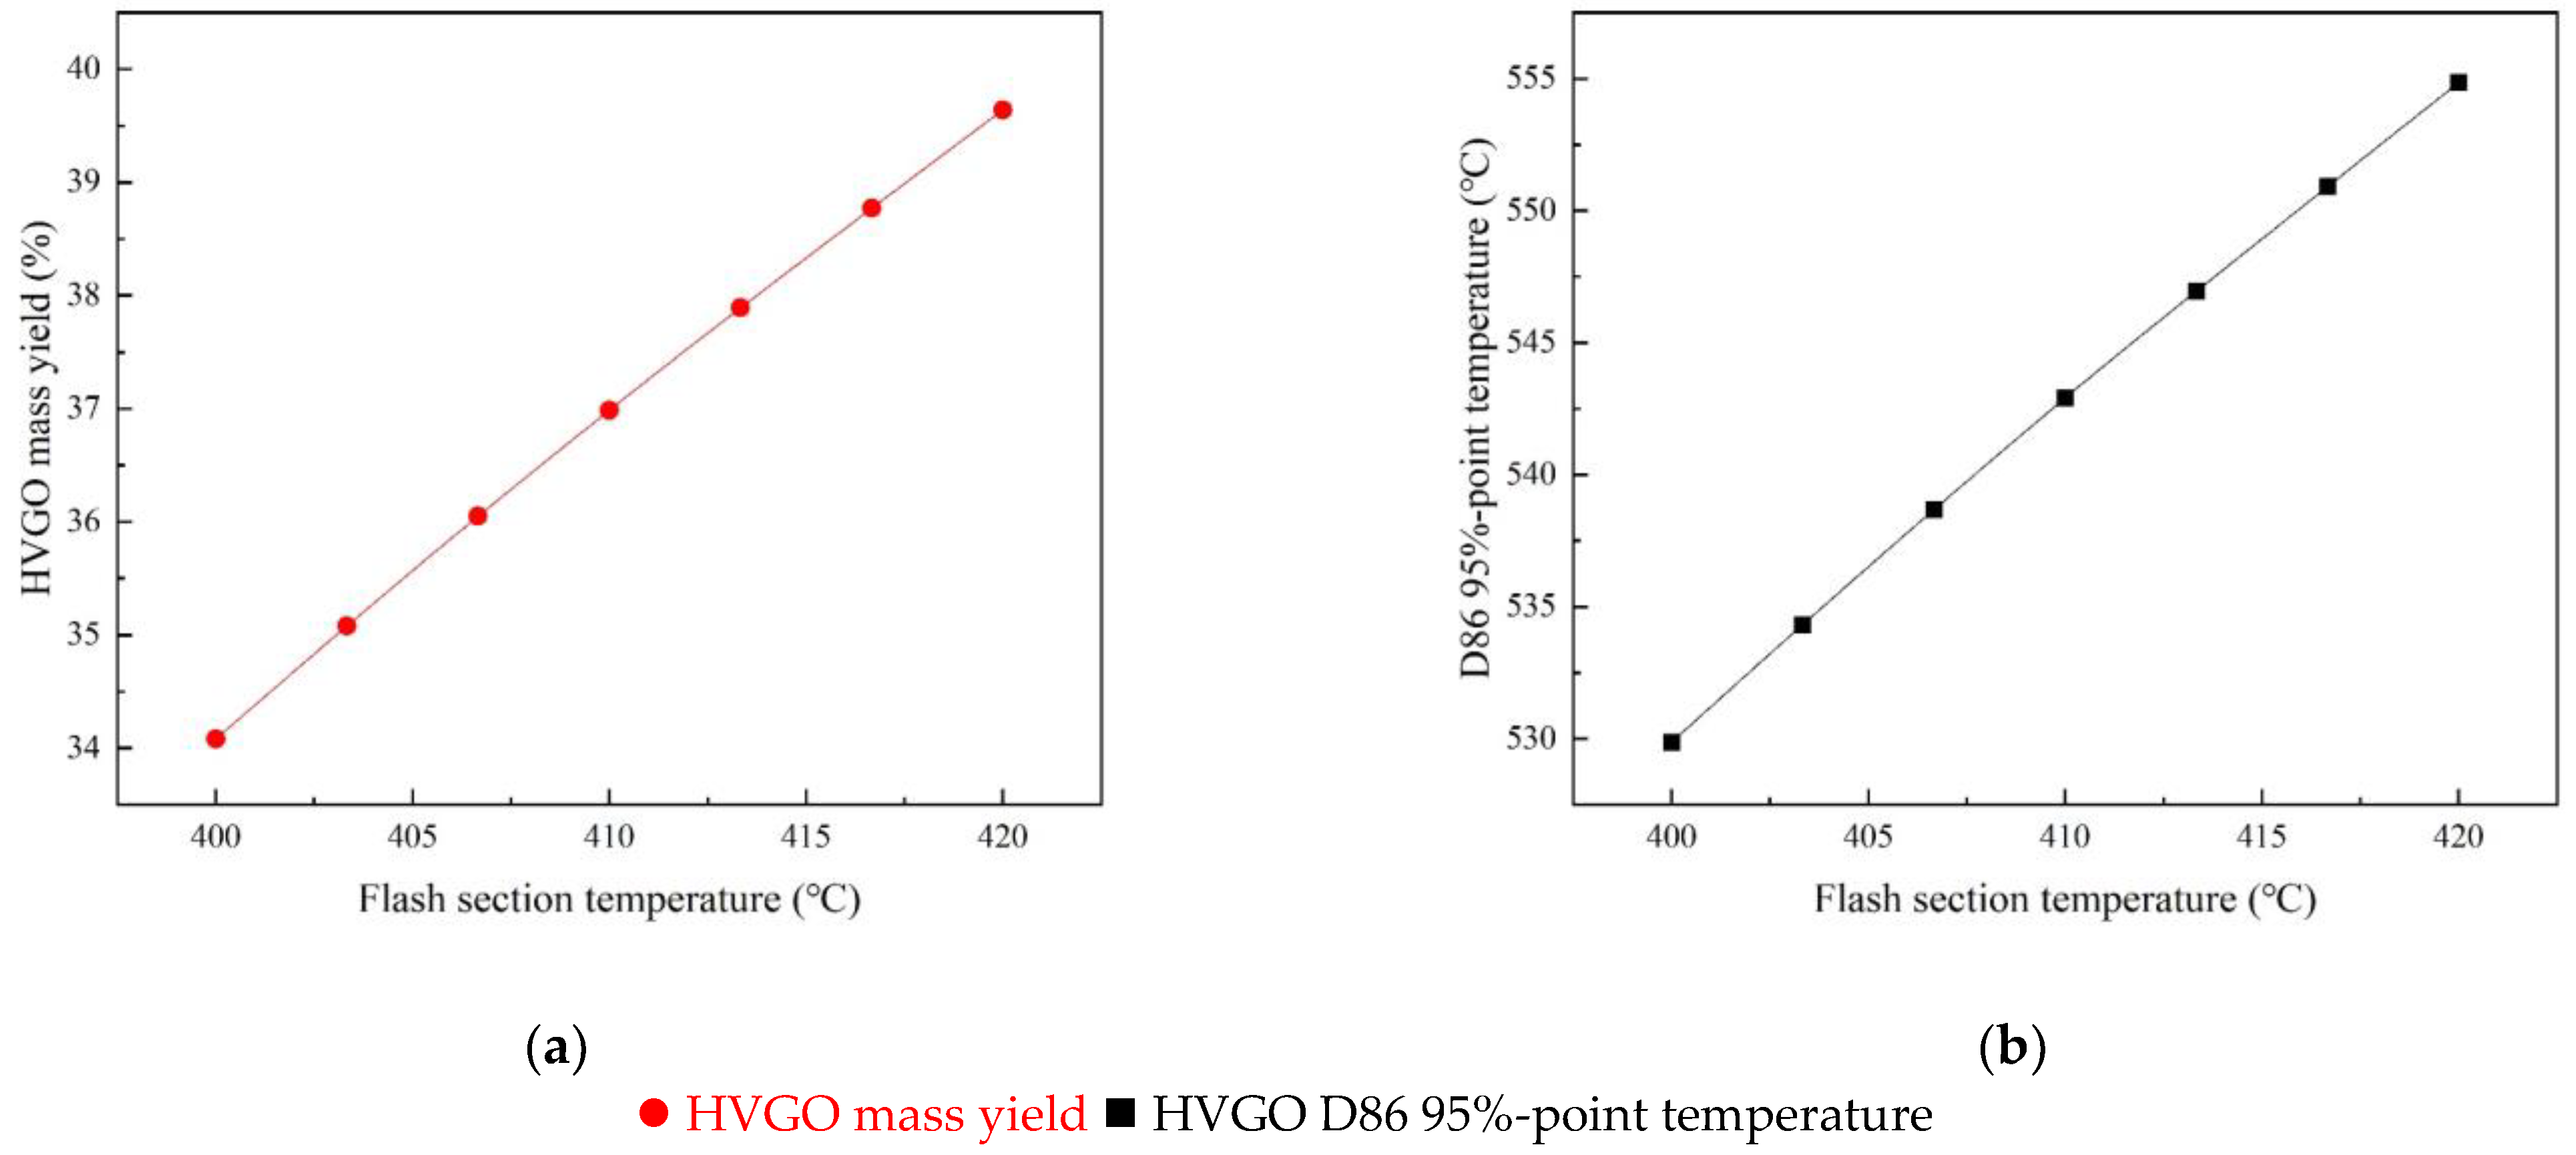
The higher the vaporization degree of the feed, the better the distillation effect of the vacuum column, and the more HVGO will be separated [39]. In vacuum distillation, the two key operating parameters affecting the feed vaporization rate are the flash section temperature and flash section pressure. In order to improve the gasification rate, it is necessary to increase the flash section temperature or reduce the flash section pressure. For these two operating parameters, the former is easier to operate and change, so we decided to use Aspen HYSYS’s case study tool [37,38] to determine the effect of FST on the HVGO yield and D86 95%-point temperature. The FST setting was changed from 400 °C to 420 °C, and Figure 10 shows the experimental results.
Figure 10 shows that as the FST increases, the mass yield of HVGO can reach up to 39.6%, and the D86 95%-point temperature reaches up to 554.8 °C. Therefore, the higher the temperature in the temperature control range of the flash section, the more conducive it is to improving the HVGO yield and D86 95%-point temperature.
3.6.2. Optimizing Stripping Steam Flow Rate
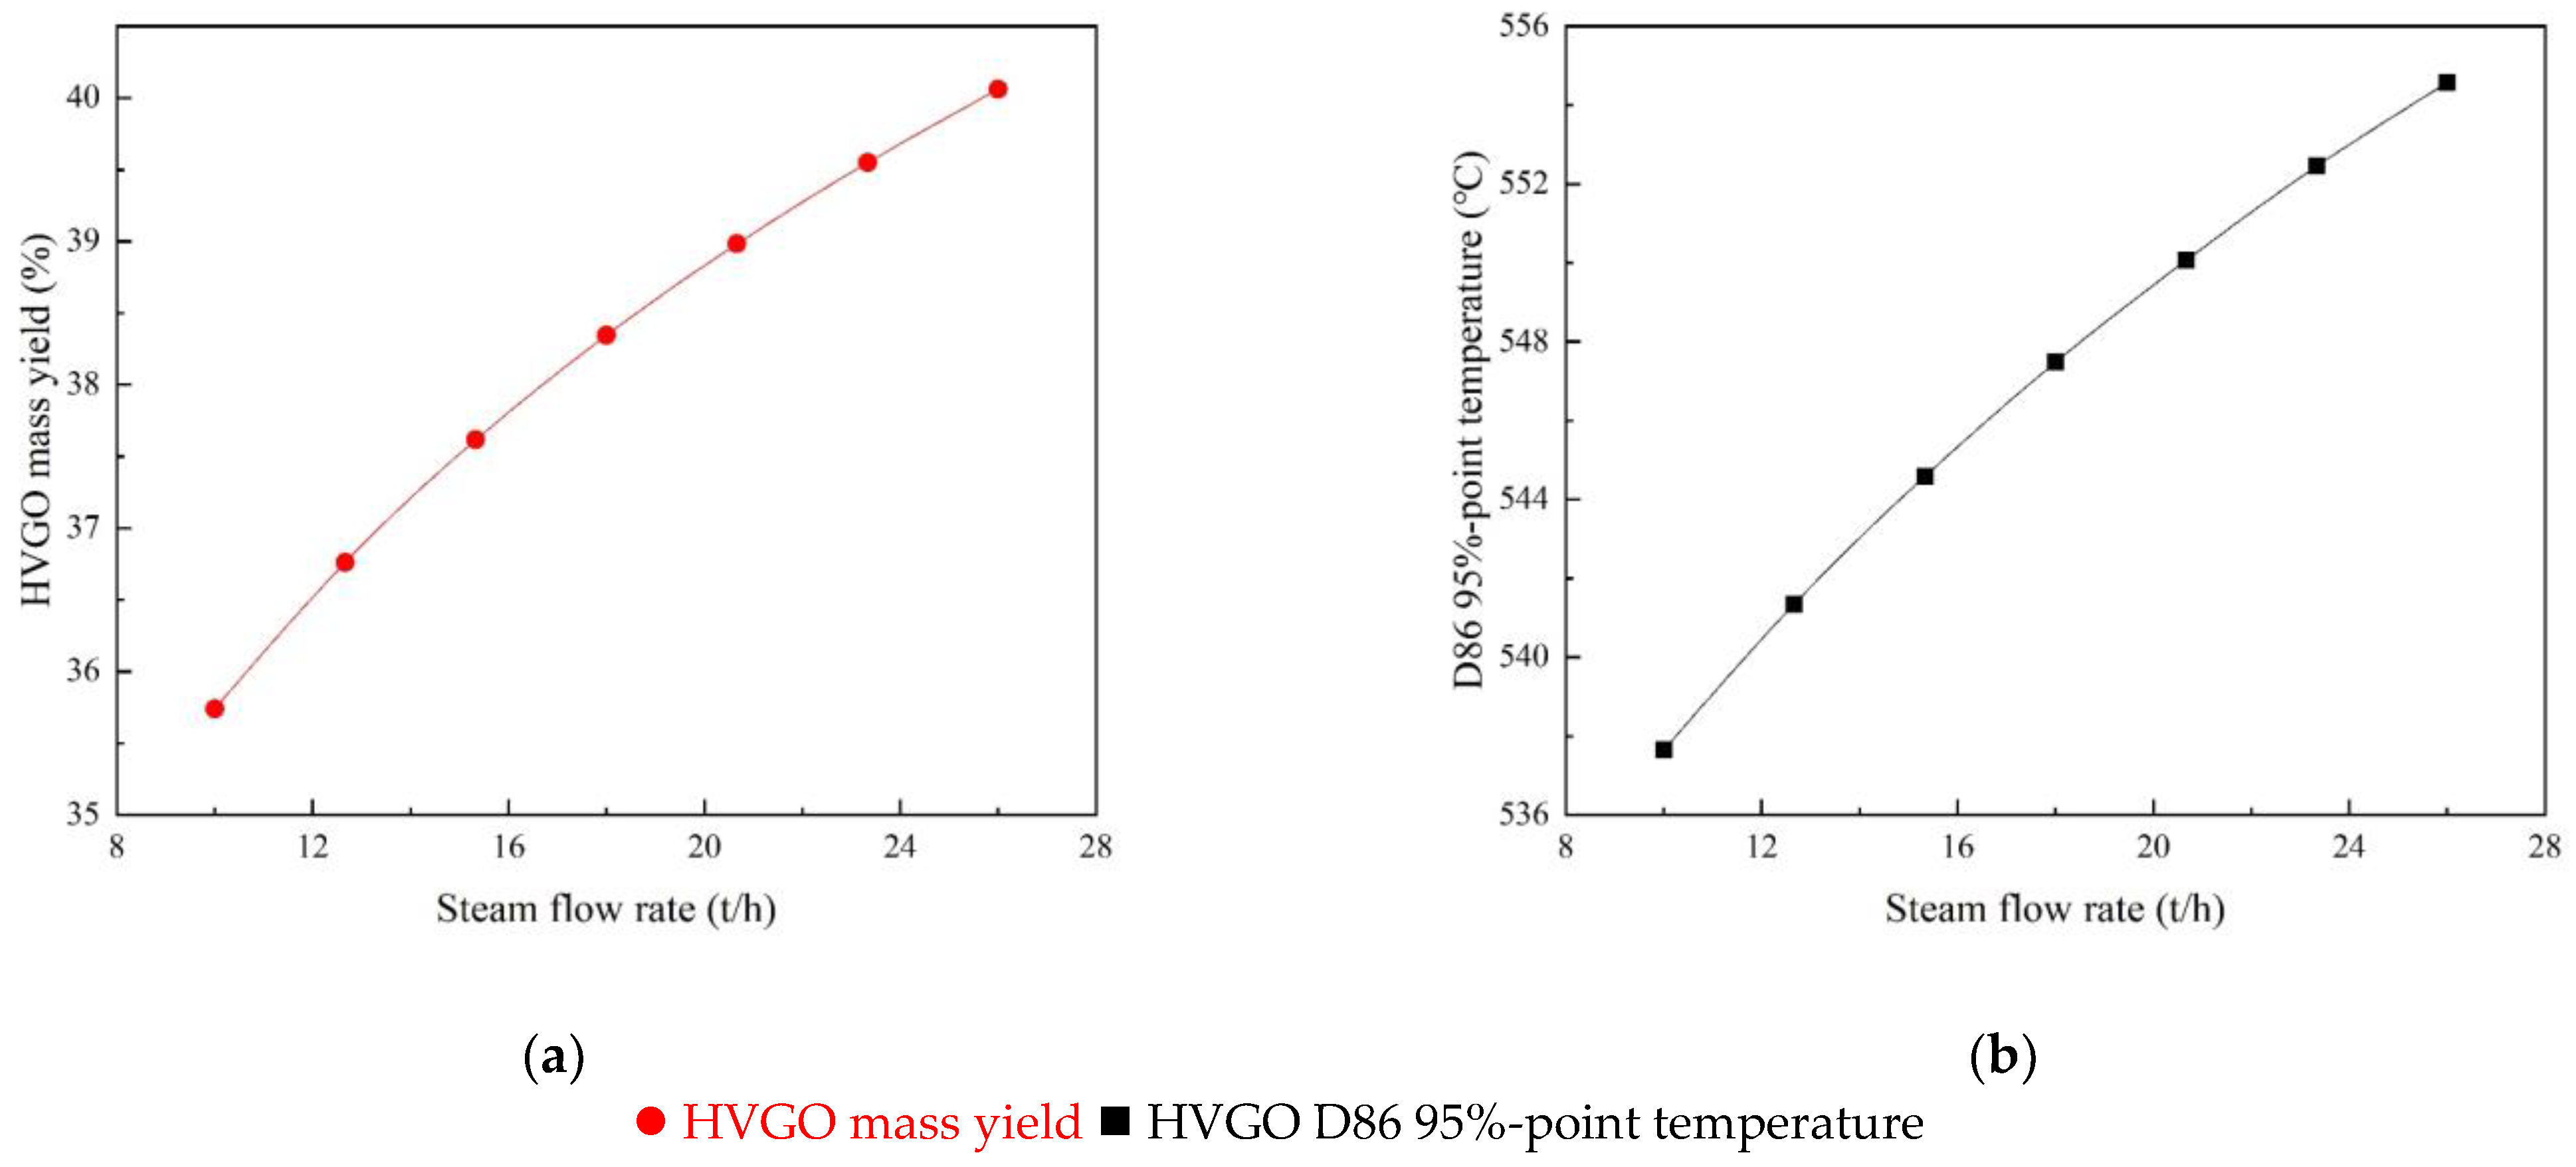
The stripping section of the vacuum column plays a very important role [40]. When the stripping steam enters the bottom of the column, the AR can be stripped and dispersed into fine droplets and then enters the upper end of the column for distillation. The more fully stripped, the better the fractionation effect [41]. For the work of the stripping section, the stripping SFR is the key factor affecting the stripping process. Next, we use the case study tool [37,38] to conduct an experimental study on the effect of stripping SFR on the HVGO yield and D86 95%-point temperature. The SFR setting was changed within 10–26 t/h, and Figure 11 shows the experimental results.
It can be seen from Figure 11 that with the increase in SFR, the maximum yield of HVGO can reach 40.1%, and the maximum D86 95%-point temperature can reach 554.6 °C.
3.6.3. Analysis and Study with Comprehensive Consideration of FST and SFR
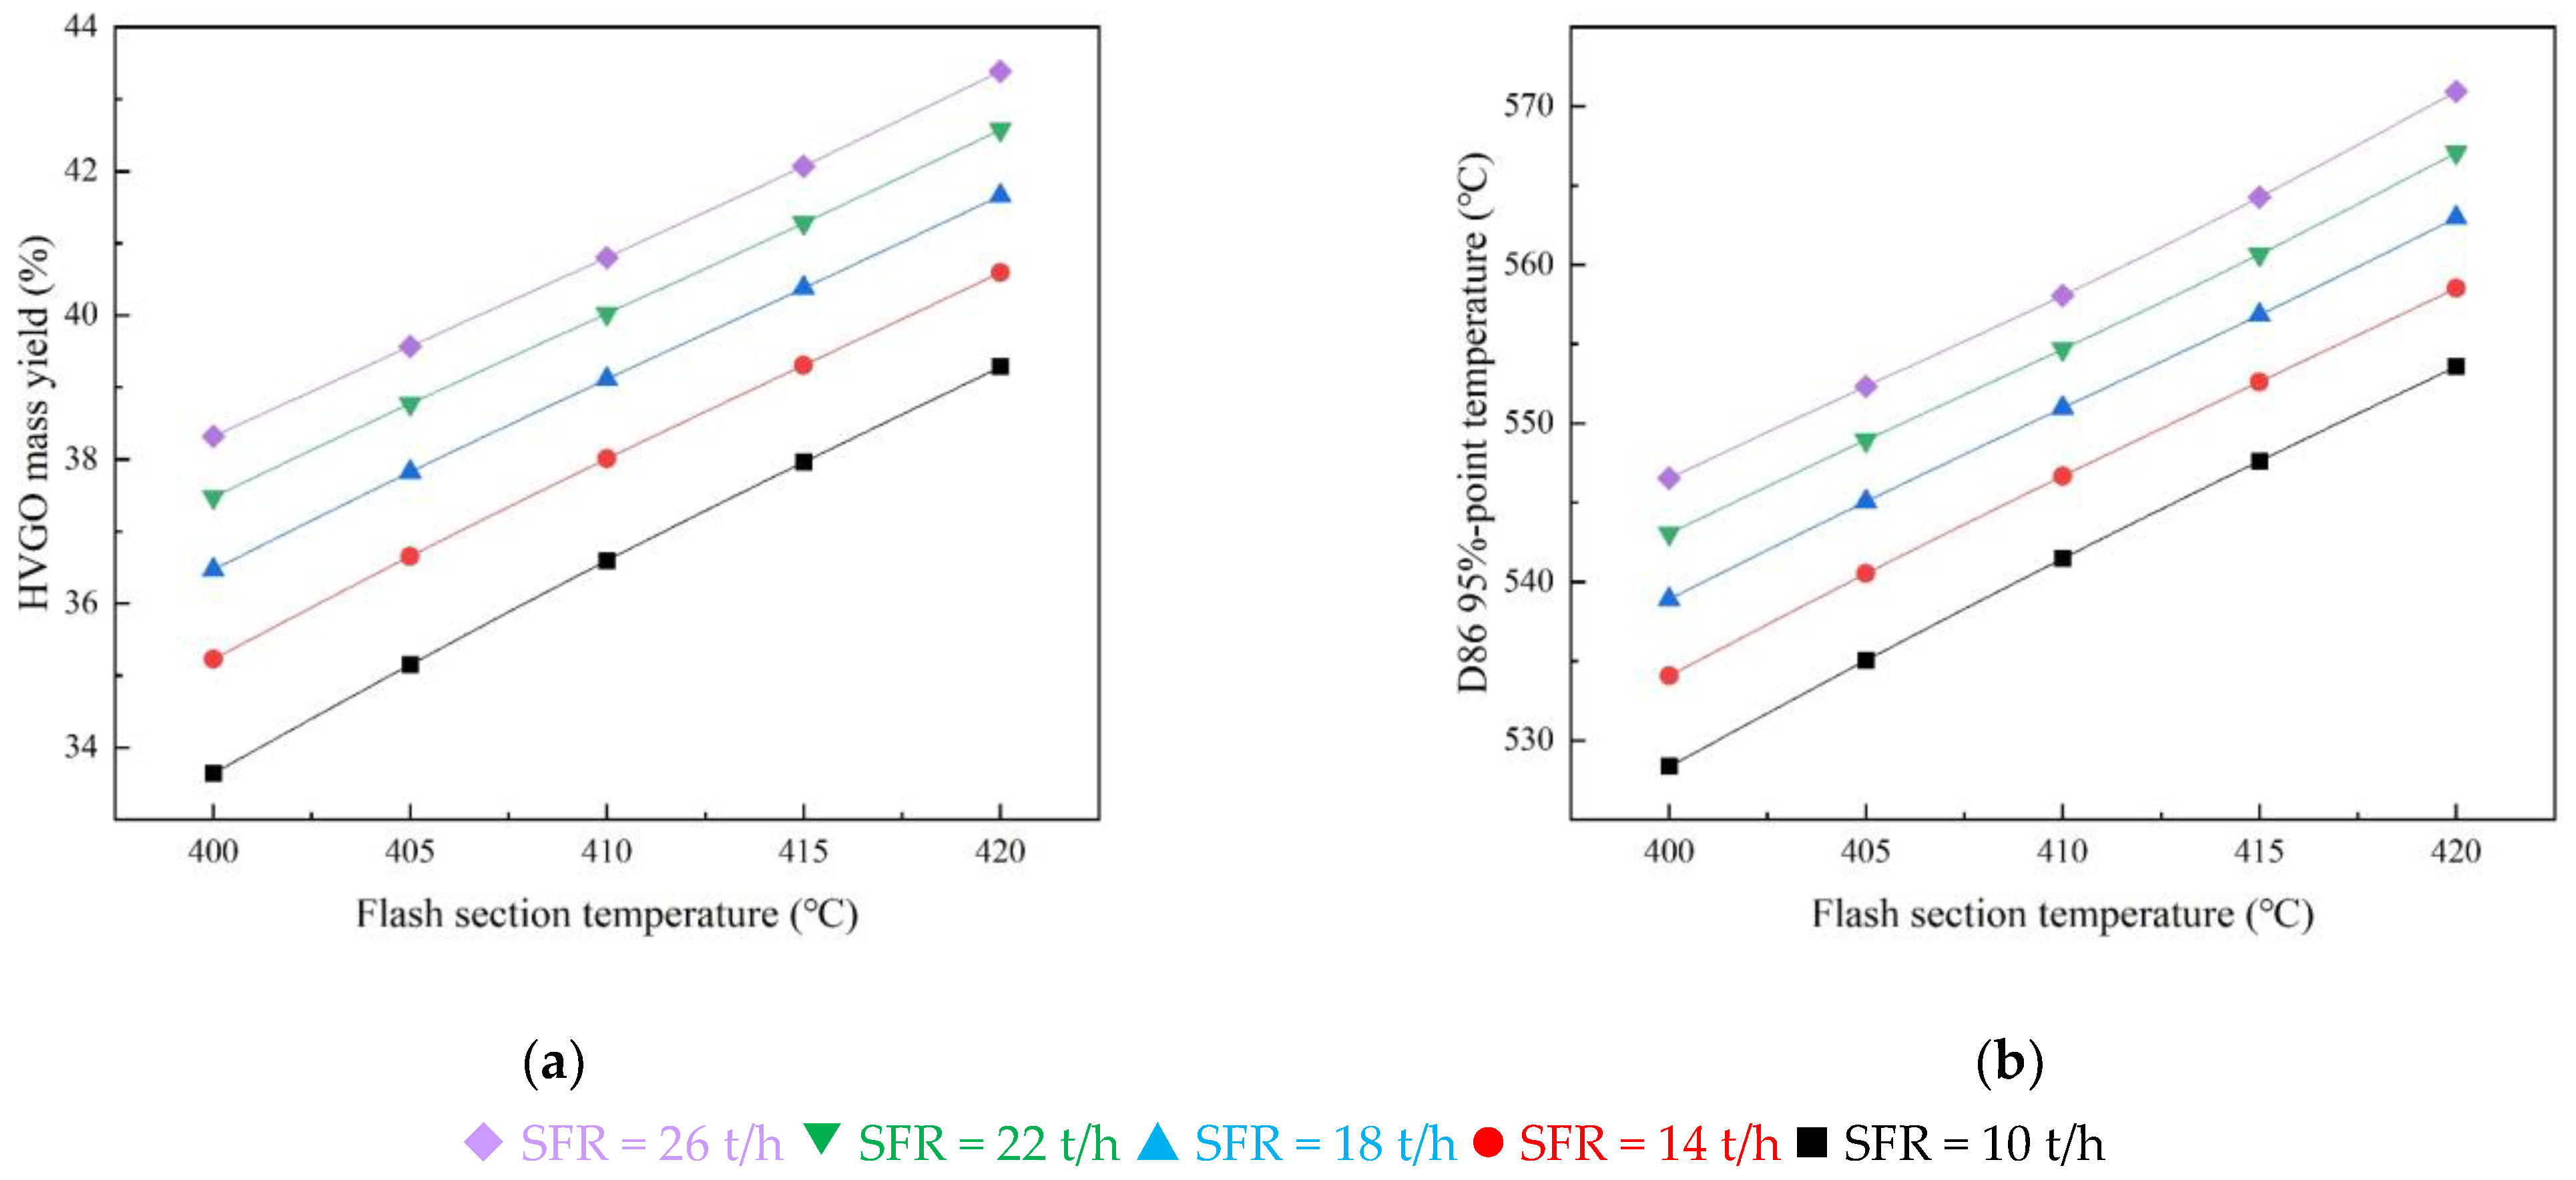
In order to maximize the extraction rate of HVGO, we use the case study tool [38,39] to optimize the two key operating parameters of FST and SFR. The rigorous model is used to simulate the process of the device under different FST and different SFR. Our final results are shown in Figure 12.
At the beginning of the study, the HVGO yield at the original operating point (FST = 407 °C; SFR = 11 t/h) was 36.1%, and the D86 95%-point temperature was 539.0 °C. It can be seen from Figure 12 that the optimal HVGO yield and D86 95%-point temperature can be achieved under the operating condition of the FST of 420 °C and the SFR of 26 t/h. The optimum yield was 43.4%, and the D86 95%-point temperature was 570.9 °C. Therefore, we can conclude that increasing the FST and SFR within the control range can greatly improve the yield of HVGO and the D86 95%-point temperature to achieve a good decompression and deep-cut effect.
4. Conclusions
Because the direct establishment of a rigorous model of the VDU is difficult and cannot be consistent with reality, a new simulation method from a simple model to a rigorous model is proposed in this article. We first establish a simple model of the VDU connected by four absorption columns using Aspen HYSYS software. We obtain the accurate key initial values through the simple model, and then the rigorous model of the VDU is established quickly and accurately. After verification and comparison in many aspects, we prove that the rigorous model can accurately reflect the actual operation of the refinery and has a certain prediction ability. We conduct an optimization study of the deep-cut vacuum distillation under the original working conditions through the rigorous model. We directly use the case study tool to analyze the operating parameters. Finally, by increasing the FST to 420 °C and the SFR to 26 t/h, the HVGO yield is increased by 6.3 percentage points to 43.4%. At the same time, the D86 95%-point temperature of HVGO is also increased by 31.9 °C to 570.9 °C. Our optimization research on the deep-cut vacuum distillation of the refinery indicates that very good results can be achieved only through operation adjustment with strong operability, high safety and good effect. This study can provide a better simulation process for chemical industry practitioners, and this study has a strong guiding role for the actual production of the refinery and can directly promote the economic benefits of the refinery.
Author Contributions
Conceptualization, Q.J.; methodology, Z.L.; software, Z.L.; validation, B.W., Z.L.; formal analysis, Q.J.; investigation, Z.L.; resources, Q.J.; data curation, Z.L.; writing—original draft preparation, Z.L.; writing—review and editing, Z.L.; visualization, Z.W.; supervision, Z.Y.; project administration, Q.J. All authors have read and agreed to the published version of the manuscript.
Funding
This research received no external funding.
Institutional Review Board Statement
Not applicable.
Informed Consent Statement
Not applicable.
Conflicts of Interest
The authors declare no conflict of interest.
References
- Speight, J.G. Crude Oil–Distillation. In Rules of Thumb for Petroleum Engineers; Scrivener Publishing LLC: New York, NY, USA, 2017; pp. 185–186. [Google Scholar] [CrossRef]
- Theodore, L.; Dupont, R.R.; Ganesan, K. Distillation. In Unit Operations in Environmental Engineering; Scrivener Publishing LLC: New York, NY, USA, 2017; pp. 493–502. [Google Scholar] [CrossRef]
- Stuart, F. Distillation in Refining. In Distillation Operation and Applications; Academic Press: New York, NY, USA, 2014; pp. 155–190. [Google Scholar] [CrossRef]
- Zhao, R.F. Progress and Application of Atmospheric and Vacuum Distillation Technology; China Petrochemical Press: Beijing, China, 2020. [Google Scholar]
- Kulprathipanja, S.; Rekoske, J.E.; Wei, D.; Slone, R.V.; Pham, T.; Liu, C. Distillation. In Modern Petrochemical Technology; WILEY-VCH GmbH: Weinheim, Germany, 2021; pp. 179–201. [Google Scholar] [CrossRef]
- Bartholomew, C.H.; Farrauto, R.J. Petroleum Refining and Processing. In Fundamentals of Industrial Catalytic Processes.; John Wiley & Sons, Inc.: Hoboken, NJ, USA, 2005; pp. 635–704. [Google Scholar] [CrossRef]
- Xue, J.W. Study on Deep-cut Vacuum Distillation of Atmospheric and Vacuum Distillation Unit. Chem. Manag. 2021, 20, 135–136. [Google Scholar] [CrossRef]
- He, H.H.; Guan, Z.; Song, J. Study on the Rate of Distillate in Crude Unit. Shandong Chem. Ind. 2021, 4, 155–158. [Google Scholar] [CrossRef]
- Chang, A.F.; Pashikanti, K.; Liu, Y.A. Vacuum Distillation Unit. In Refinery Engineering; WILEY-VCH GmbH: Weinheim, Germany, 2013; pp. 117–144. [Google Scholar] [CrossRef]
- Lin, Z.W.; Mao, F.Z.; Jiang, B.; Chen, K.B. Deep-Cut Vacuum Distillation in the 10 Mt/a CDU/VDU. China Pet. Process. Pet- Rochem. Technol. 2009, 2, 9–13. [Google Scholar]
- Krikorian, K.V.; Brice, J.C. FCC′s Effect on Refinery Yields. Hydrocarlxm Process. 1987, 66, 63–66. [Google Scholar]
- Li, X.Z.; Lin, M.J.; Wang, Y.L. Study on Deep Vacuum Distillation of Atmospheric and Vacuum Unit. Petrochem. Technol. 2005, 12, 10–14. [Google Scholar] [CrossRef]
- Cao, Z.J. Discussion on Deep Cut Technology for Atmospheric and Vacuum Distillation Unit. Petrochem. Des. 2009, 26, 1–4. [Google Scholar]
- Zhang, L.; Qi, H.M.; Li, B.Z. Influence of Using Structural Packing in Stripping Section of Vacuum Tower on Pull-Out Rate. J. Liaoning Shi Hua Univ. 2010, 30, 15–18. [Google Scholar] [CrossRef]
- Jiang, B.; Feng, X.L.; Zhang, L.H.; Sun, Y.L. Vacuum Deep-Cut Process for Quench Oil. Mod. Chem. Ind. 2013, 13, 126–129. [Google Scholar] [CrossRef]
- Liu, G.H.; Lin, C.; Zhu, Y.Z.; Zhuang, Z.H. Studies on The Intensifying of Atmospheric Vacuum Distillation by Adding Activator to Enhance Yields of Light Oils Mixture. J. Fuzhou Univ. 2002, 3, 13–14. [Google Scholar] [CrossRef]
- Li, S.P.; Zhang, Q.; Shen, B.X.; Zhang, B.L. Intensifying Distillation Yield of Atmospheric Residue by Blending Different Additives. J. East China Univ. Sci. Technol. 2006, 32, 916–921. [Google Scholar] [CrossRef]
- Wei, Z.; Yang, Y.H. Taking Advantage of PRO/II Software to Simulate Distillation Plant. Shenyang Chem. Ind. 2000, 29, 171–175. [Google Scholar] [CrossRef]
- Cheng, H.N.; Wang, F.; Wang, R.Q.; Xiang, S.G. Simulation and analysis of atmospheric and vacuum distillation unit for 200 Mt/Y Koweit oil. Comput. Appl. Chem. 2004, 21, 552–556. [Google Scholar] [CrossRef]
- Hou, H.F.; Ye, F.; Ye, S.N.; Wang, Z.B. Simulation of The Crude Oil Atmospheric and Vacuum Distillation Process with Aspen Plus. J. Chem. Ind. Eng. 2010, 31, 8–11. [Google Scholar]
- Li, Z.Q.; Zheng, S.G. Crude Oil Distillation Process and Engineering; China Petrochemical Press: China, Beijing, 2010. [Google Scholar]
- Haydary, J. Economic Evaluation. In Chemical Process Design and Simulation; John Wiley & Sons, Inc.: Hoboken, NJ, USA, 2018; pp. 181–263. [Google Scholar] [CrossRef]
- Xia, M.S.; Fang, W.; Wang, F. The Study of the Typical Oil Refining Unit Data Reconciliation. Comput. Appl. Chem. 2009, 26, 882–888. [Google Scholar] [CrossRef]
- Hamid, M.K.A. HYSYS: An Introduction to Chemical Engineering Simulation for UTM Degree++ Program. Simulation. 2007. Available online: http://eprints.utm.my/id/eprint/3030/2/HYSYS_for_UTM_Degree++_Program.pdf (accessed on 4 August 2015).
- Gernaey, K.V.; Glassey, J.; Skogestad, S.; Krämer, S.; Weiß, A.; Engell, S.; Pistikopoulos, E.N.; Cameron, D.B. Process Systems Engineering, 5. Process Dynamics, Control, Monitoring, and Identification. In Ullmann′s Encyclopedia of Industrial Chemistry; Wiley-VCH Verlag GmbH: Weinheim, Germany, 2013. [Google Scholar] [CrossRef]
- Sun, L.Y.; Liu, L.X.; Bo, S.S.; Jin, H.G. Process Simulation Using Aspen HYSYS; Sinopec Press: Beijing, China, 2018. [Google Scholar]
- Zhang, M.; Ma, F.Y.; Jin, X.S. Atmospheric Distillation Process and Energy Saving Optimization Simulation Studies. Mod. Chem. Ind. 2017, 37, 186–190. [Google Scholar] [CrossRef]
- Zhu, J. Establishing Process Flowsheet Simulation of Atmospheric Vacuum Distillation Unit with HYSIM. China Petrochem. Des. 1996, 13, 21–25. [Google Scholar]
- JonesDavid, S.J. Handbook of Petroleum Processing; Springer International Publishing Author Affiliation: Calgary, AB, Canada, 2015; pp. 125–198. [Google Scholar] [CrossRef]
- Upreti, S.R. Process Simulation. In Process Modeling and Simulation for Chemical Engineers; John Wiley & Sons Ltd.: Toronto, ON, Canada, 2017; pp. 227–294. [Google Scholar] [CrossRef]
- Huang, X.L.; Wang, S.F.; Wang, H.B.; Liu, S.F. Study on Coking Tendency of Feedstock in Vacuum Furnace of Atmospheric-Vacuum Distillation Unit. Pet. Process. Petrochem. 2013, 44, 28–32. [Google Scholar] [CrossRef]
- Ahmmed, S.I.; Aref, W. HYSYS Software for Chemical and Petroleum Engineering; LAP LAMBERT Academic Publishing: Saarbrucken, Germany, 2014. [Google Scholar]
- Luyben, W.L. Distillation Design and Control Using Aspen™ Simulation; John Wiley & Sons: Hoboken, NJ, USA, 2013. [Google Scholar] [CrossRef]
- Yin, W.B.; Luo, X.L.; Shi, W. Process Simulation for Atmospheric Vacuum Distillation Column of Crude Oil. Control Instrum. Chem. Ind. 2010, 37, 88–93. [Google Scholar] [CrossRef]
- Al-Malah, K.I. Aspen Plus: Chemical Engineering Applications; John Wiley & Sons: Hoboken, NJ, USA, 2016. [Google Scholar] [CrossRef]
- Wang, J.Q.; Tian, Y.Y.; Zhang, J.T. Optimization study on deep vacuum distillation technology. Energy Chem. Ind. 2016, 37, 1–5. [Google Scholar] [CrossRef]
- Chang, A.F.; Pashikanti, K.; Liu, Y.A. Refinery Engineering: Integrated Process Modeling and Optimization. In Refinery Engineering: Integrated Process Modeling and Optimization; John Wiley & Sons: Hoboken, NJ, USA, 2013. [Google Scholar] [CrossRef]
- Nishanth, C.; Siewhui, C. Basics of Process Simulation with Aspen HYSYS. Chem. Eng. Process Simul. 2017, 233–252. [Google Scholar] [CrossRef]
- Mao, J.Y.; Qin, Y.; Yuan, Q. Development of New Evaporation Technology for Vacuum Distillation. Pet. Process. Petrochem. 2016, 47, 24–28. [Google Scholar]
- Du, X.; Wu, S.M.; Yuan, X.G. Simulation and analysis on mass transfer of steam stripping process for vacuum distillation column in crude unit. Chem. Eng. 2012, 40, 69–74. [Google Scholar] [CrossRef]
- Li, Y. Optimization of the Stripping Steam Amount of Atmospheric and Vacuum Crude Distillation Unit with Petro-SIM. Guangzhou Chem. Ind. 2014, 42, 176–178. [Google Scholar] [CrossRef]
Figure 1.
Process flow diagram of VDU.

Figure 2.
Simple model process flow diagram.

Figure 3.
Process flow diagram for the simple model of VDU in Aspen HYSYS.

Figure 4.
Process flow diagram for the rigorous model of VDU in Aspen HYSYS.

Figure 5.
Vacuum column environment of the rigorous model of VDU in Aspen HYSYS.

Figure 6.
Comparative analysis of feed distillation data.

Figure 7.
Comparison of tray data of strict model. (a) Tray temperature comparison; (b) tray pressure comparison.
Figure 7.
Comparison of tray data of strict model. (a) Tray temperature comparison; (b) tray pressure comparison.

Figure 8.
Comparison of main product yields of rigorous model.

Figure 9.
Comparison of D86 or D1160 distillation data of the main products of the rigorous model. (a) D86 distillation data of VDO; (b) D1160 distillation data of LVGO; (c) D1160 distillation data of HVGO; (d) D1160 distillation data of VR.
Figure 9.
Comparison of D86 or D1160 distillation data of the main products of the rigorous model. (a) D86 distillation data of VDO; (b) D1160 distillation data of LVGO; (c) D1160 distillation data of HVGO; (d) D1160 distillation data of VR.

Figure 10.
Effect of FST on deep-cut vacuum distillation. (a) HVGO yield change; (b) HVGO D86 95%-point temperature change.
Figure 10.
Effect of FST on deep-cut vacuum distillation. (a) HVGO yield change; (b) HVGO D86 95%-point temperature change.

Figure 11.
Effect of SFR on deep-cut vacuum distillation. (a) HVGO yield change; (b) HVGO D86 95%-point temperature change.
Figure 11.
Effect of SFR on deep-cut vacuum distillation. (a) HVGO yield change; (b) HVGO D86 95%-point temperature change.

Figure 12.
The effect of FST at different SFR on the effect of deep-cut vacuum distillation. (a) HVGO yield change; (b) HVGO D86 95%-point temperature change.
Figure 12.
The effect of FST at different SFR on the effect of deep-cut vacuum distillation. (a) HVGO yield change; (b) HVGO D86 95%-point temperature change.


Table 1.
Data requirements for VDU model.
| Data Category | Specific Data |
|---|---|
| Rate of flow | Feed and product flow |
| Middle circulating flow | |
| Middle circulating cooling flow | |
| Heating steam and stripping steam | |
| Pressure | Flash section |
| Column top | |
| Column bottom | |
| Temperature | Flash section |
| Column top | |
| Column bottom | |
| Side line product extraction position | |
| Inlet and outlet temperature of heating furnace | |
| Oil transfer line temperature | |
| Recovery and return temperature of middle section circulation | |
| Inlet and outlet temperature of middle section circulating cooling flow | |
| Assay analysis data | Distillation curve and specific gravity of atmospheric residue |
| Distillation curve and specific gravity of all product streams | |
| Composition of overhead gas |
Table 2.
Setting data information of each column.
| Column Data | Simple Model | Rigorous Model | |
|---|---|---|---|
| Flash and Stripping Zone, LVGO Zone, VDO Zone | HVGO Zone | ||
| Number of trays | 2 | 5 | 11 |
| Tray spacing (m) | 0.5 | 0.5 | 0.5 |
| Tray volume (m3) | 0.8836 | 0.8836 | 0.8836 |
| Tray diameter (m) | 1.5 | 1.5 | 1.5 |
| Column type | sieve-plate | sieve-plate | sieve-plate |
| Weir height (mm) | 50 | 50 | 50 |
| Weir length (m) | 1.2 | 1.2 | 1.2 |
| Downcomer volume (m3) | 0.0884 | 0.0884 | 0.0884 |
| Effective area (m2) | 1.26 | 1.26 | 1.26 |
| Leakage factor | 1.00 | 1.00 | 1.00 |
| Foaming Factor | 1.00 | 1.00 | 1.00 |
| Sieve diameter (mm) | 12.70 | 12.70 | 12.70 |
| Sieve spacing (mm) | 34.87 | 34.87 | 34.87 |
| Opening area (%) | 12 | 12 | 12 |
| Type of side weir | vertical | vertical | vertical |
| Downcomer type | vertical | vertical | vertical |
Table 3.
The main data involved in simple model and rigorous model simulation.
| Project | Unit | Simple Model | Rigorous Model | |||
|---|---|---|---|---|---|---|
| Input Value | Output Value | Input Value | Output Value | |||
| VDO zone | Non-condensable gas flow | kg/h | / | 14,413 | / | 14,764 |
| VDO flow rate | kg/h | / | 24,402 | 17,490 | 17,489 | |
| Top temperature | °C | 90 | 90 | 90 | 90 | |
| Top pressure | kPa | 10.13 | 10.13 | 10.13 | 10.13 | |
| Tray 1 temperature | °C | 123 | 123 | / | 132.3 | |
| LVGO zone | LVGO flow rate | kg/h | 69,870 | 69,870 | 69,870 | 69,869 |
| HVGO zone | HVGO flow rate | kg/h | 185,700 | 185,698 | 185,700 | 185,702 |
| Strip zone | Tray 10 temperature | °C | 407 | 407 | 407 | 407 |
| Tray 10 pressure | kPa | 13.33 | 13.33 | 13.33 | 13.33 | |
| Tray 11 temperature | °C | / | 395.2 | 395 | 395 | |
| Tray 11 pressure | kPa | 25.33 | 25.33 | 25.33 | 25.33 | |
| VR flow rate | kg/h | / | 234,210 | 243,300 | 240,768 | |
| 1st middle cycle | Circulating flow | kg/h | 100,000 | 159,575 | 100,000 | 99,995 |
| Temperature difference | °C | 45 | 45 | 45 | 62 | |
| Thermal load | kJ/h | / | −1.43 × 10⁷ | / | −1.25 × 10⁷ | |
| 2nd middle cycle | Circulating flow | kg/h | 220,000 | 237,814 | 220,000 | 219,998 |
| Temperature difference | °C | 55 | 55 | 55 | 55 | |
| Thermal load | kJ/h | / | −3.08 × 10⁷ | / | −2.83 × 10⁷ | |
| 3rd middle cycle | Circulating flow | kg/h | 858,600 | 858,582 | 858,600 | 858,607 |
| Temperature difference | °C | 55 | 55 | 55 | 55 | |
| Thermal load | kJ/h | / | −1.24 × 10⁸ | / | −1.24 × 10⁸ | |
Table 4.
Comparison between design and simulation values of operating parameters.
| Project | Unit | Design Control Range | Simulated Values |
|---|---|---|---|
| Bottom feed temperature | °C | 400–410 | 407 |
| Stripping steam flow rate | t/h | 10–26 | 11 |
| Stripping steam temperature | °C | 150–170 | 160 |
| Flash section temperature | °C | 400–420 | 407 |
| Column top pressure | kPa | 10.00–10.20 | 10.13 |
| VD production tray pressure | kPa | 10.40–10.60 | 10.49 |
| LVGO production tray pressure | kPa | 11.10–11.30 | 11.20 |
| HVGO production tray pressure | kPa | 11.80–12.00 | 11.91 |
| Flash section pressure | kPa | 13.20–13.40 | 13.33 |
| Column bottom pressure | kPa | 25.20–25.50 | 25.33 |
Table 5.
Parameter setting of independent variables in case study.
| Project Section No. | Study Type | Variable Name | Unit | Start Value | End Value | Step Length |
|---|---|---|---|---|---|---|
| 3.6.1 | Sensitivity | FST | °C | 400 | 420 | 3.33 |
| 3.6.2 | Sensitivity | SFR | t/h | 10 | 26 | 2.67 |
| 3.6.3 | Nested | FST | °C | 400 | 420 | 5 |
| SFR | t/h | 10 | 26 | 4 |
Publisher’s Note: MDPI stays neutral with regard to jurisdictional claims in published maps and institutional affiliations. |
© 2022 by the authors. Licensee MDPI, Basel, Switzerland. This article is an open access article distributed under the terms and conditions of the Creative Commons Attribution (CC BY) license (https://creativecommons.org/licenses/by/4.0/).
Share and Cite
MDPI and ACS Style
Jin, Q.; Li, Z.; Yan, Z.; Wang, B.; Wang, Z. Optimization Study on Enhancing Deep-Cut Effect of the Vacuum Distillation Unit (VDU). Processes 2022, 10, 359. https://doi.org/10.3390/pr10020359
AMA Style
Jin Q, Li Z, Yan Z, Wang B, Wang Z. Optimization Study on Enhancing Deep-Cut Effect of the Vacuum Distillation Unit (VDU). Processes. 2022; 10(2):359. https://doi.org/10.3390/pr10020359
Chicago/Turabian StyleJin, Qibing, Ziming Li, Zhicheng Yan, Bin Wang, and Zeyu Wang. 2022. "Optimization Study on Enhancing Deep-Cut Effect of the Vacuum Distillation Unit (VDU)" Processes 10, no. 2: 359. https://doi.org/10.3390/pr10020359
Note that from the first issue of 2016, this journal uses article numbers instead of page numbers. See further details here.