Article

Nozzle Jet Deviation from Bucket Pitch Circle’s Effect on the Stability and Efficiency of Pelton Turbine

1
Key Laboratory of Fluid and Power Machinery, Ministry of Education, Xihua University, Chengdu 610039, China
2
CHN Energy Dadu River Geshizha Hydropower Development Co., Ltd., Danba 626300, China
3
College of Water Resources and Civil Engineering, China Agricultural University, Beijing 100083, China
*
Authors to whom correspondence should be addressed.
Processes 2023, 11(5), 1342; https://doi.org/10.3390/pr11051342
Submission received: 12 March 2023 / Revised: 6 April 2023 / Accepted: 21 April 2023 / Published: 26 April 2023

Abstract

:
During the operation of a Pelton turbine, the centerline of the nozzle jet may deviate from the bucket pitch circle due to the low installation and maintenance accuracy, which will reduce the operating efficiency and the stability of the turbine and even cause severe vibrations and damages. Based on the VOF (Volume of Fluid) two-phase flow model and the SST k-ω turbulence model, the flow characteristics of a Pelton turbine were simulated with the nozzle jet deviating from the bucket pitch circle. The pressure pulsation inside the bucket and the force distribution of the runner were obtained, the turbine oscillation and efficiency were measured before and after the jet deviation, and the effects of the radial and axial deviations on the stability and efficiency of the Pelton turbine were analyzed. The results show that both the radial and axial deviations of the jet cause a significant increase in the axial force and the pressure pulsation amplitude of the turbine; the radial and tangential forces on the runner are slightly reduced; the maximum axial force on the runner is increased by 4 times and 2 times, respectively, after the axial and radial deviations within the maximum value allowed by the industry standard; and the efficiency of the turbine is reduced by 0.4% and 0.3%, respectively. The maximum relative amplitude of pressure pulsation in the radial offset case appears in the center of the bucket blade, while the axial offset case causes uneven pressure distribution on both sides of the diverter blade, uneven force on the bucket blade of the runner, and fatigue damage. By comparing the operation of the runner under the two offset cases, we can find that the axial offset of the jet has a greater impact on the stability of the runner than the radial offset, and the unit is more prone to vibration, increasing the risk of the unit lifting.

1. Introduction

Turbine stability is a complex and comprehensive problem, which involves hydraulic, mechanical, electrical and many other aspects, among which the imbalanced flow in the turbine is the main factor affecting the hydraulic vibration. Therefore, in recent years, scholars have adopted the numerical simulation method to study the internal flow and stability of Pelton turbines with a complex flow. Avellan F et al. [1] used the VOF multiphase flow model to verify the accuracy of this method in calculating the jet flow and the water film flow on the surface of the bucket. Christian Vessaz et al. [2] simulated the internal flow of the Pelton turbine through the Finite-Volume Particle Method (FVPM) and VOF (Volume of Fluid) models and tracked the pressure changes on the surface of the bucket. Kvicinsky et al. [3] studied the pressure distribution inside the bucket by immobilizing it. You J et al. [4] adopted the VOF two-phase flow model and the DOF dynamic grid method to simulate the influence of the runaway process of a Pelton turbine on the unit operating stability and efficiency. Santoli A et al. [5] conducted a numerical study on the interaction between the jet flow and the bucket in a Pelton turbine and analyzed the influence of the jet shape on energy loss and operation efficiency of the turbine. Panagiotopoulos A et al. [6] adopted the Euler grid method to simulate the flow in a runner and found that there was a high-pressure area when the back of the bucket cut into the jet. They believed that the jet flows out of the prior bucket may strike the back of the trailing edge of the succeeding bucket, which would hinder the rotation of the bucket and reduce the hydraulic performance of the bucket. Xiao YX et al. [7] used CFX software to analyze the variation pattern of the unsteady free-surface flow state and the torque with the rotation of the bucket, and they studied the interaction between the back of the bucket and the jet. Through comparative analysis of the experimental and simulation results, Perrig A [8,9,10] studied the flow condition on the free surface inside the bucket, compared the pressure fields and torques in five different areas on the leading face of the bucket and found the area with the maximum load. At the same time, they analyzed the internal flow pattern, the water film thickness and the pressure distribution of the bucket under stable operating conditions. Gupta V et al. [11] conducted multiphase flow analysis on Pelton turbines; estimated the turbine efficiency, blade load, velocity and gas–liquid distribution in the bucket under different working conditions; and found that the mesh size, turbulence model and time step have important effects on the accuracy of the transient multiphase flow simulation. Zoppe B et al. [12] analyzed the pressure distribution, torque change and internal flow pattern of the leading face of the bucket through a jet striking experiment and numerical simulation of a fixed bucket, and they optimized the bucket through flow analysis on the edge and notch of the fixed bucket. Zeng C et al. [13] simulated the entire flow path in a prototype four-nozzle Pelton turbine under three water heads and found that the pressure pulse on the bucket surface pulsates with the spreading of the water sheet flow and takes up 10–25% water energy. They also found there is a potential for interference between two adjacent jets if the water head or the angle between the two jets decreases. Xiao Y et al. [14,15,16] analyzed the hydraulic mechanism of the water film on the free surface of the runner bucket and the influence of the surface roughness on bucket rotation and cavitation by comparing the simulated and tested results under different unit flow rates. The studies of Mack R et al. [17] and Rachel Zidonis A [18] show that in the process of a jet being cut by a bucket, the jet being pushed back by the leading face of the bucket may strike the back of the adjacent bucket, which may cause jet interference, which would decrease the power capacity of the jet and thus affect the turbine performance. Egusquiza M et al. [19] analyzed the vibration characteristics measured before, during and after the damage and conducted a test study on the runner by using modal analysis technology (EMA). They found that if the jet flow was not aimed, the dynamic stress distribution would increase at the bucket side, and the maximum stress was located at the crack. Xiao Yexiang et al. [20] used the VOF model to analyze the flow state of the Pelton turbine jet, dynamically analyzed the change in the free jet, and found that the free jet exhibits a serious interference phenomenon. Chen Zhu et al. [21] simulated the unsteady gas–water two-phase flow in the internal flow field of the turbine, including the runner, nozzle, casing, cover, etc., and analyzed the reasons for the decline in turbine efficiency. Han Fengqin et al. [22] adopted the animation analysis method to analyze the unsteady flow of the Pelton turbine and discussed the factors affecting the stable operation of the turbine. Jung IH et al. [23] studied the influence of an eccentric injection needle on the jet mass of a Pelton turbine, and they found that pressure deviation and jet velocity imbalance caused by the eccentricity are the main reasons for jet diffusion. Huang et al. [24] studied the eccentric operation condition of the needle through numerical simulation, and they concluded that jet eccentricity increases with the eccentricity of the needle and the eccentric jet presents an asymmetric phenomenon. Meanwhile, the eccentric operation leads to an efficiency drop in the injector and the increasing of energy loss. Petley S et al. [25] conducted a three-dimensional CFD numerical simulation of the interaction between the jet and the runner of a double-nozzle horizontal Pelton turbine, and they found that there was an optimal combination to maximize the operating efficiency of the turbine by changing the angle of the nozzle and the needle. Hahn et al. [26] conducted numerical simulations of flow losses and secondary flows in the turbine flow tube and verified that the K-w shear stress transport model predicts head losses and secondary flows with high accuracy. It is also proposed that when the fluid turbulence intensity is below 4%, the secondary flow in the upstream of the distribution loop pipe increases significantly.
During the operation of a Pelton turbine, the centerline of the nozzle jet may be deviated from the pitch circle of the runner bucket due to the lack of installation and maintenance accuracy, which will reduce the operational stability and efficiency of the turbine and cause severe vibration and damage to the unit in serious cases, resulting in safety accidents. In this paper, the radial and axial deviations of the jet centerline from the pitch circle of the bucket in the Pelton turbine of Jiniu Hydropower Station were simulated to study the internal flow and the pressure pulsation of the runner bucket, and the turbine oscillation and efficiency were measured to analyze the influence of the jet deviation on the stability and efficiency of the Pelton turbine.

2. Materials and Methods

2.1. Two-Phase Flow Model

The internal flow of a Pelton turbine is a gas–liquid two-phase flow, and the VOF model was used to analyze the complex gas–liquid two-phase interface problems. The basic equations of the VOF model are as follows [27]:
ρ = Cρw + (1 − C)ρa
μ = Cμw + (1 − C)μa
where ρ is the mix fluid density; ρw is the water density; ρa is the gas density; μ is the mix fluid viscosity; μw is the water viscosity; μa is the gas viscosity; C is the volume fraction of the liquid phase; 1 − C is the volume fraction of the gas phase; and the sum of the volume fraction of the gas phase and the liquid phase is 1. C = 1 means all the fluid is in the liquid phase, C = 0 means all the fluid is in the gas phase, and 0 ˂ C ˂ 1 means the gas and the liquid phases coexist.

2.2. Basic Control Equations

The gas phase is air in the flow through a Pelton turbine. The water phase and gas phase are usually considered as incompressible Newtonian fluid, so the basic control equations for the internal flow of the turbine are
u i x i = 0
u i t + u j u i x j = 1 ρ p x i + v 2 u i x j x j + f i
where u is the velocity; x is the coordinate; t is the time; p is the pressure; ν is the kinematic viscosity; f is the mass force; and subscripts i and j are the tensor coordinates.

2.3. Turbulence Model

In order to verify the effects of different turbulence models on the impact turbine, numerical simulations are performed for all three turbulence models: Standard k-ε, RNG k-ε and SST k-ω. The simulation results are shown in Table 1 below:
Comprehensive analysis of the above table shows that the turbulence model has the smallest relative error using the SST k-ω model, and it also verifies the accuracy of the numerical simulation.
The SST k-ω model combines the advantages of the k-ω and the k-ε turbulence models, using the k-ω model in the boundary layer and switching to the k-ε model in the free shear flow away from the wall [28]. The SST k-ω model was used here.
The turbulent kinetic energy k equation is as follows:
( ρ k ) t + ( ρ k u i ) x i = x j ( Γ k k x j ) + G k Y k + S k
The dissipation rate ω equation is as follows:
( ρ ω ) t + ( ρ ω u i ) x i = x j ( Γ ω ω x j ) + G ω Y ω + S ω + D ω
where Γ k = μ + μ t σ k , Γ ω = μ + μ t σ ω , μt is the turbulent eddy viscosity, σk and σω are the turbulent Prandtl numbers of k and ω, respectively, σk = (1 − 0.15F1)−1, σω = (0.856 − 0.356F1)−1, and F1 is the value of the wall function; Gk is the turbulent kinetic energy k-generating term, G k = μ t S 2 , S = 2 S i j S i j , S i j = 1 2 ( u j x i + u i x j ) ; Gω is the ω-generating term, G ω = ρ G k μ t ; Yk and Yω are the effective dispersion terms of k and ω, respectively, Yk = 0.09 ρkω, Yω = (0.0828 − 0.0078F1) ρkω2; Sω and Sk are the user-defined source terms; and Dω is the orthogonal dispersion term, D ω = 2.336 ( 1 F 1 ) ρ ω k x j ω x j .

3. Water Model and Boundary Conditions of the Computational Domain

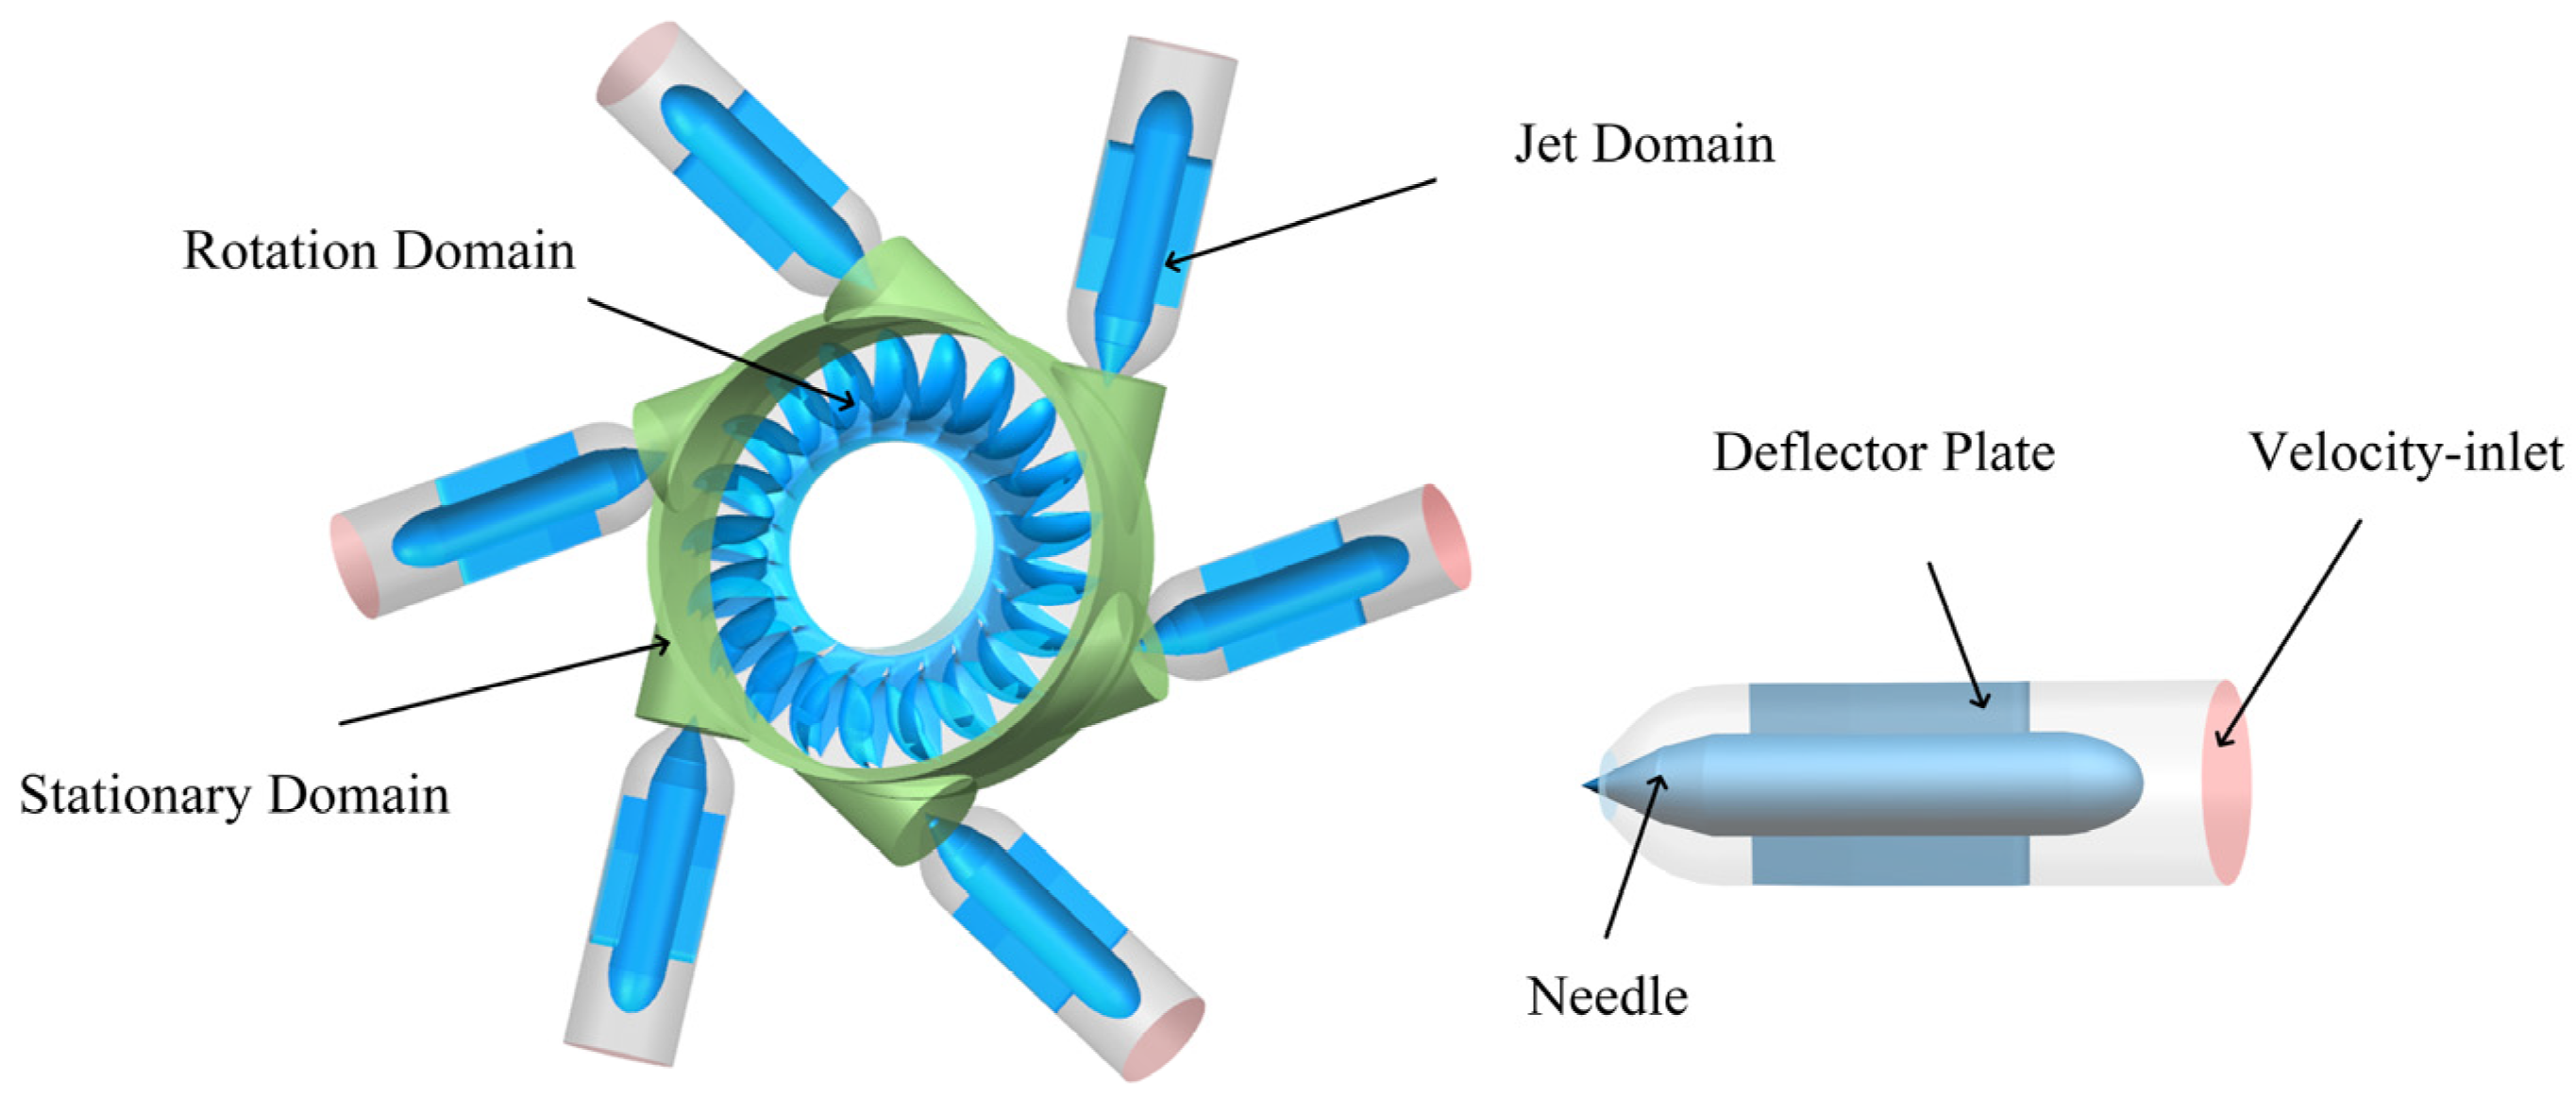
3.1. Establishment of Three-Dimensional Water Model of Overflow Components

The Pelton turbine contains structures such as the needle, the nozzle, and the bucket. In order to ensure the accuracy of the runner flow and the force calculation, it is necessary to establish the water domain and the air domain models of the Pelton turbine. This study was based on the vertical Pelton turbine of Jiniu Hydropower Station in Geshizha River, Sichuan Province, China. According to the turbine design information provided by the station, the 3D computational domain (including the water domain of the injector, the rotating domain of the runner and the stationary domain) of the turbine was established. The basic design parameters of the turbine are listed in Table 2, and the 3D model of the computational domain is shown in Figure 1.
The physical radial upward deviation of the centerline of the nozzle jet from the bucket pitch circle was defined as the offset S1. The deviation toward the outer edge of the bucket was defined as +S1, and the deviation toward the axis of the bucket was defined as −S1, as shown in Figure 2a. The physical axial upward deviation was defined as the offset S2, as shown in Figure 2b, which is actually the deviation towards both sides of the splitter. Since the two cups of the Pelton bucket are symmetrical along the splitter, the axial deviation has no effect on the results, so the downward deviation was chosen here. S1 and S2 are the maximum physical offsets of the studied turbine as allowed by the industry standards 29: S1 = 5.78 mm and S2 = 4.425 mm.

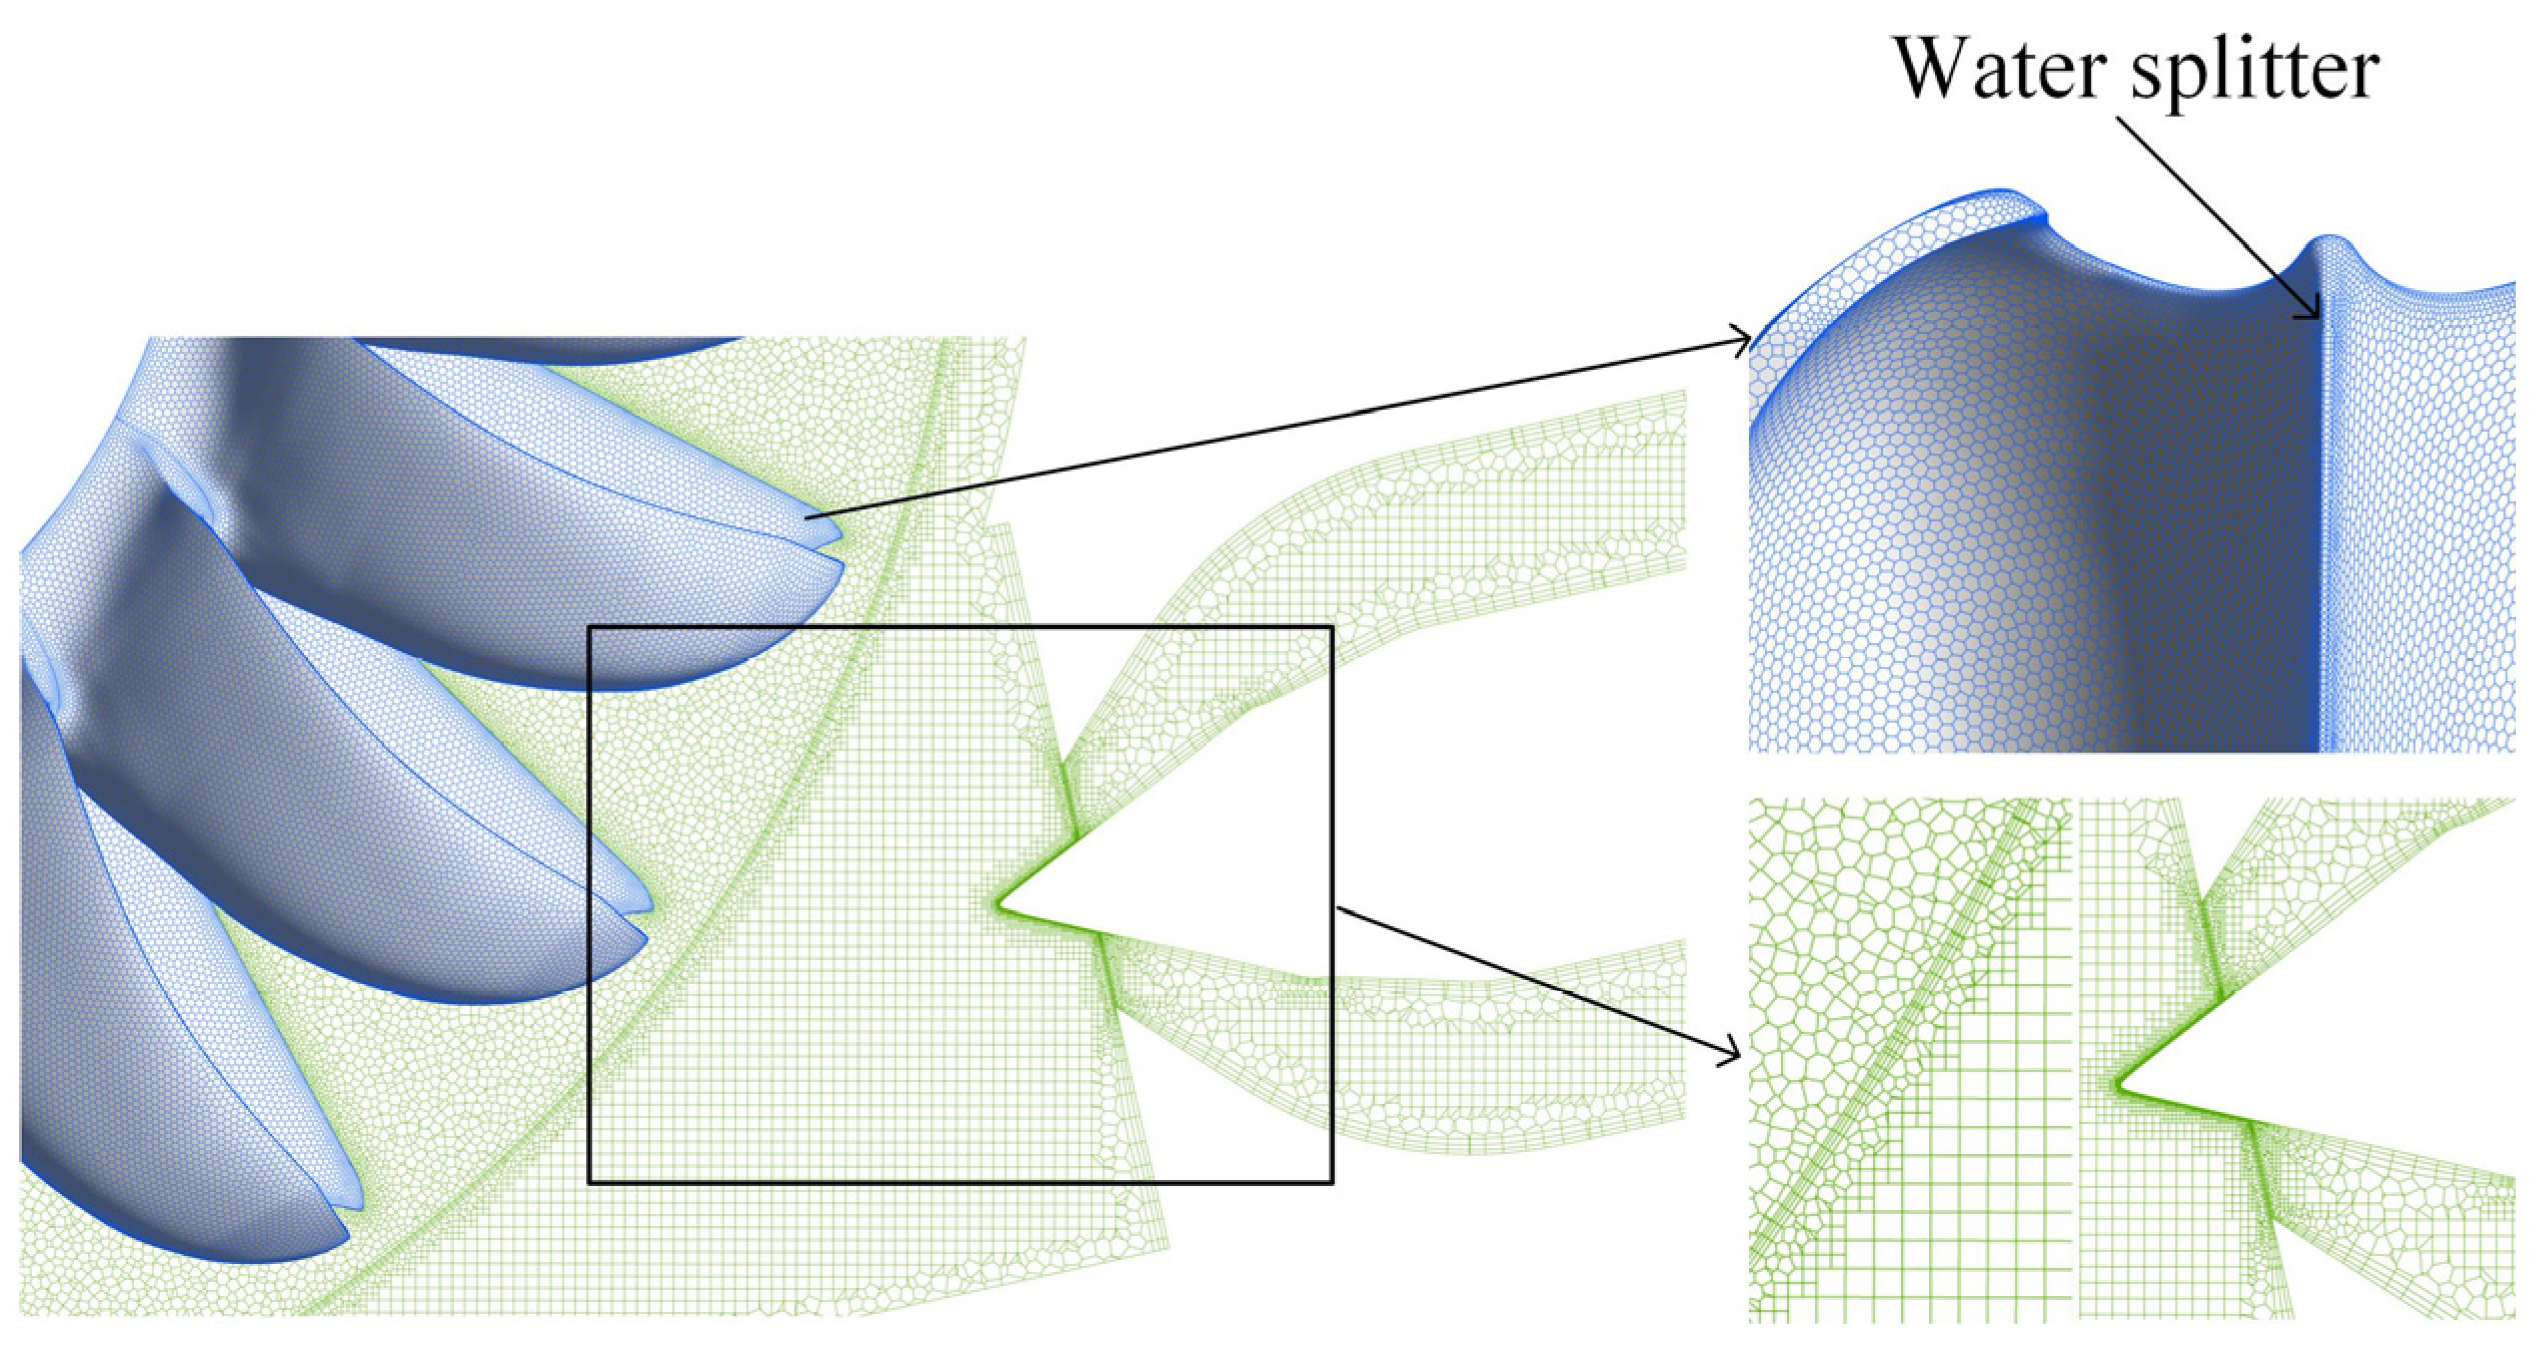
3.2. Computational Meshing and Irrelevance Validation

An unstructured poly-hexcore composite mesh was used to grid the computational domain of the geometric model, and its grid-independence was verified with the goal of efficiency, as listed in Table 3. Scheme ⅲ was selected as the computational grid model with 6.98 million meshes in the nozzle, the air domain and the static domain and 5.14 million meshes in the rotating domain. Based on the focus area of this study being the spray needle and water bucket surface, the y+ value range of the grid model of Scheme ⅲ in the focus study area is 10~100, which basically meets the requirements of the SST k-ω turbulence model for grid quality. The geometric model local grid division is shown in Figure 3.

3.3. Boundary Condition Setting

The boundary conditions were set according to the flow conditions of the rated operating conditions of the Pelton turbine in Jiniu Hydropower Station. The finite-element volume method is used to discretize the control equations, the pressure-based solver is used, and the SIMPLEC algorithm, which has a fast computational convergence, is used for the calculation. The inlet boundary condition was set as the velocity inlet, the outlet boundary condition was set as the pressure outlet, and the cylindrical jet velocity at the nozzle was 93.22 m/s (the jet velocity coefficient was 0.985). The rotor was set up by using the moving wall as the interface with the rotating domain. The Transient Rotor Stator model was used to transfer information between the rotating domain and the stationary domain, and the standard wall function was used in the near-wall area. Each rotation of the rotor was chosen as one time step, the calculation time step was set as 0.000556 s, and the total calculation time was 1 s.

4. Flow Calculation and Stability and Efficiency Analysis

Under the rated operating conditions of the Pelton turbine in Jiniu Hydropower Station, four operating conditions of PY0 (no deviation), PY+ (deviating 5.78 mm towards the outer edge of the runner), PY− (deviating 5.78 mm towards the axis line of the runner) and PYZ (deviating 4.425 mm towards the axis) were studied [29]. The VOF multiphase flow model, the SST k-ω turbulence model and the SIMPLEC algorithm were used to calculate the flow characteristics and the forces on the turbine, and the influence of the jet deviation on the stability and efficiency of the turbine was analyzed.

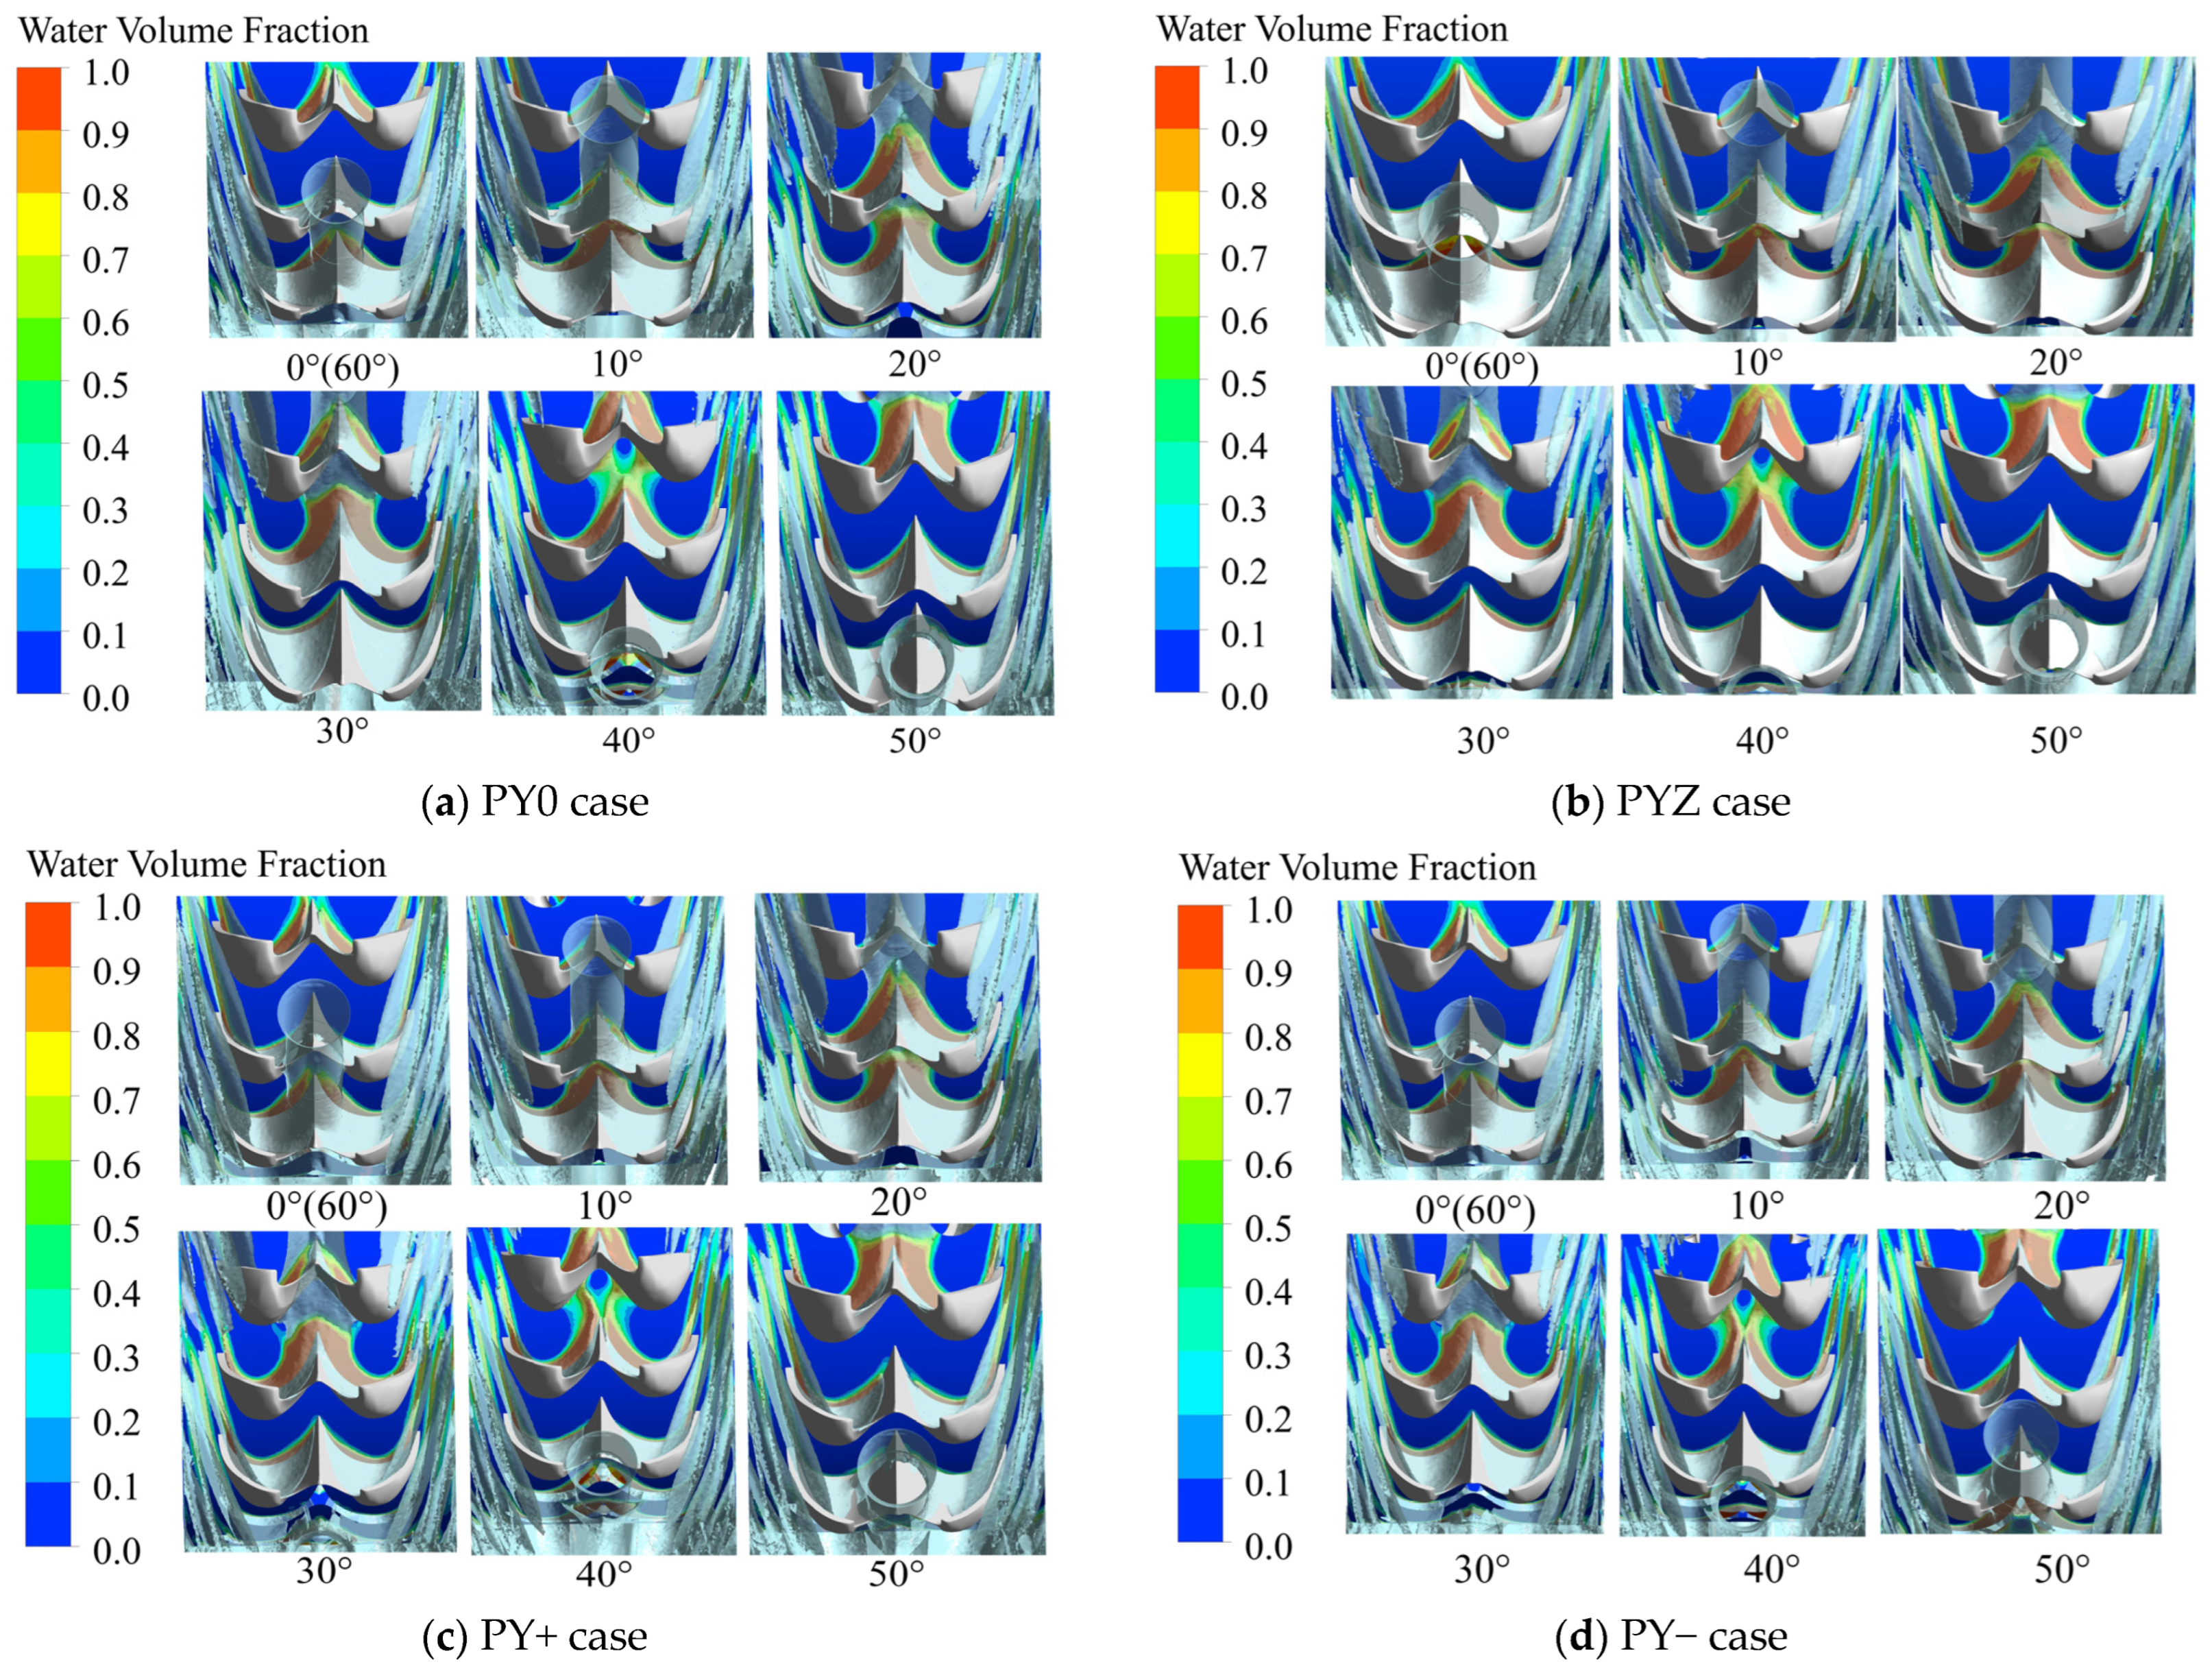
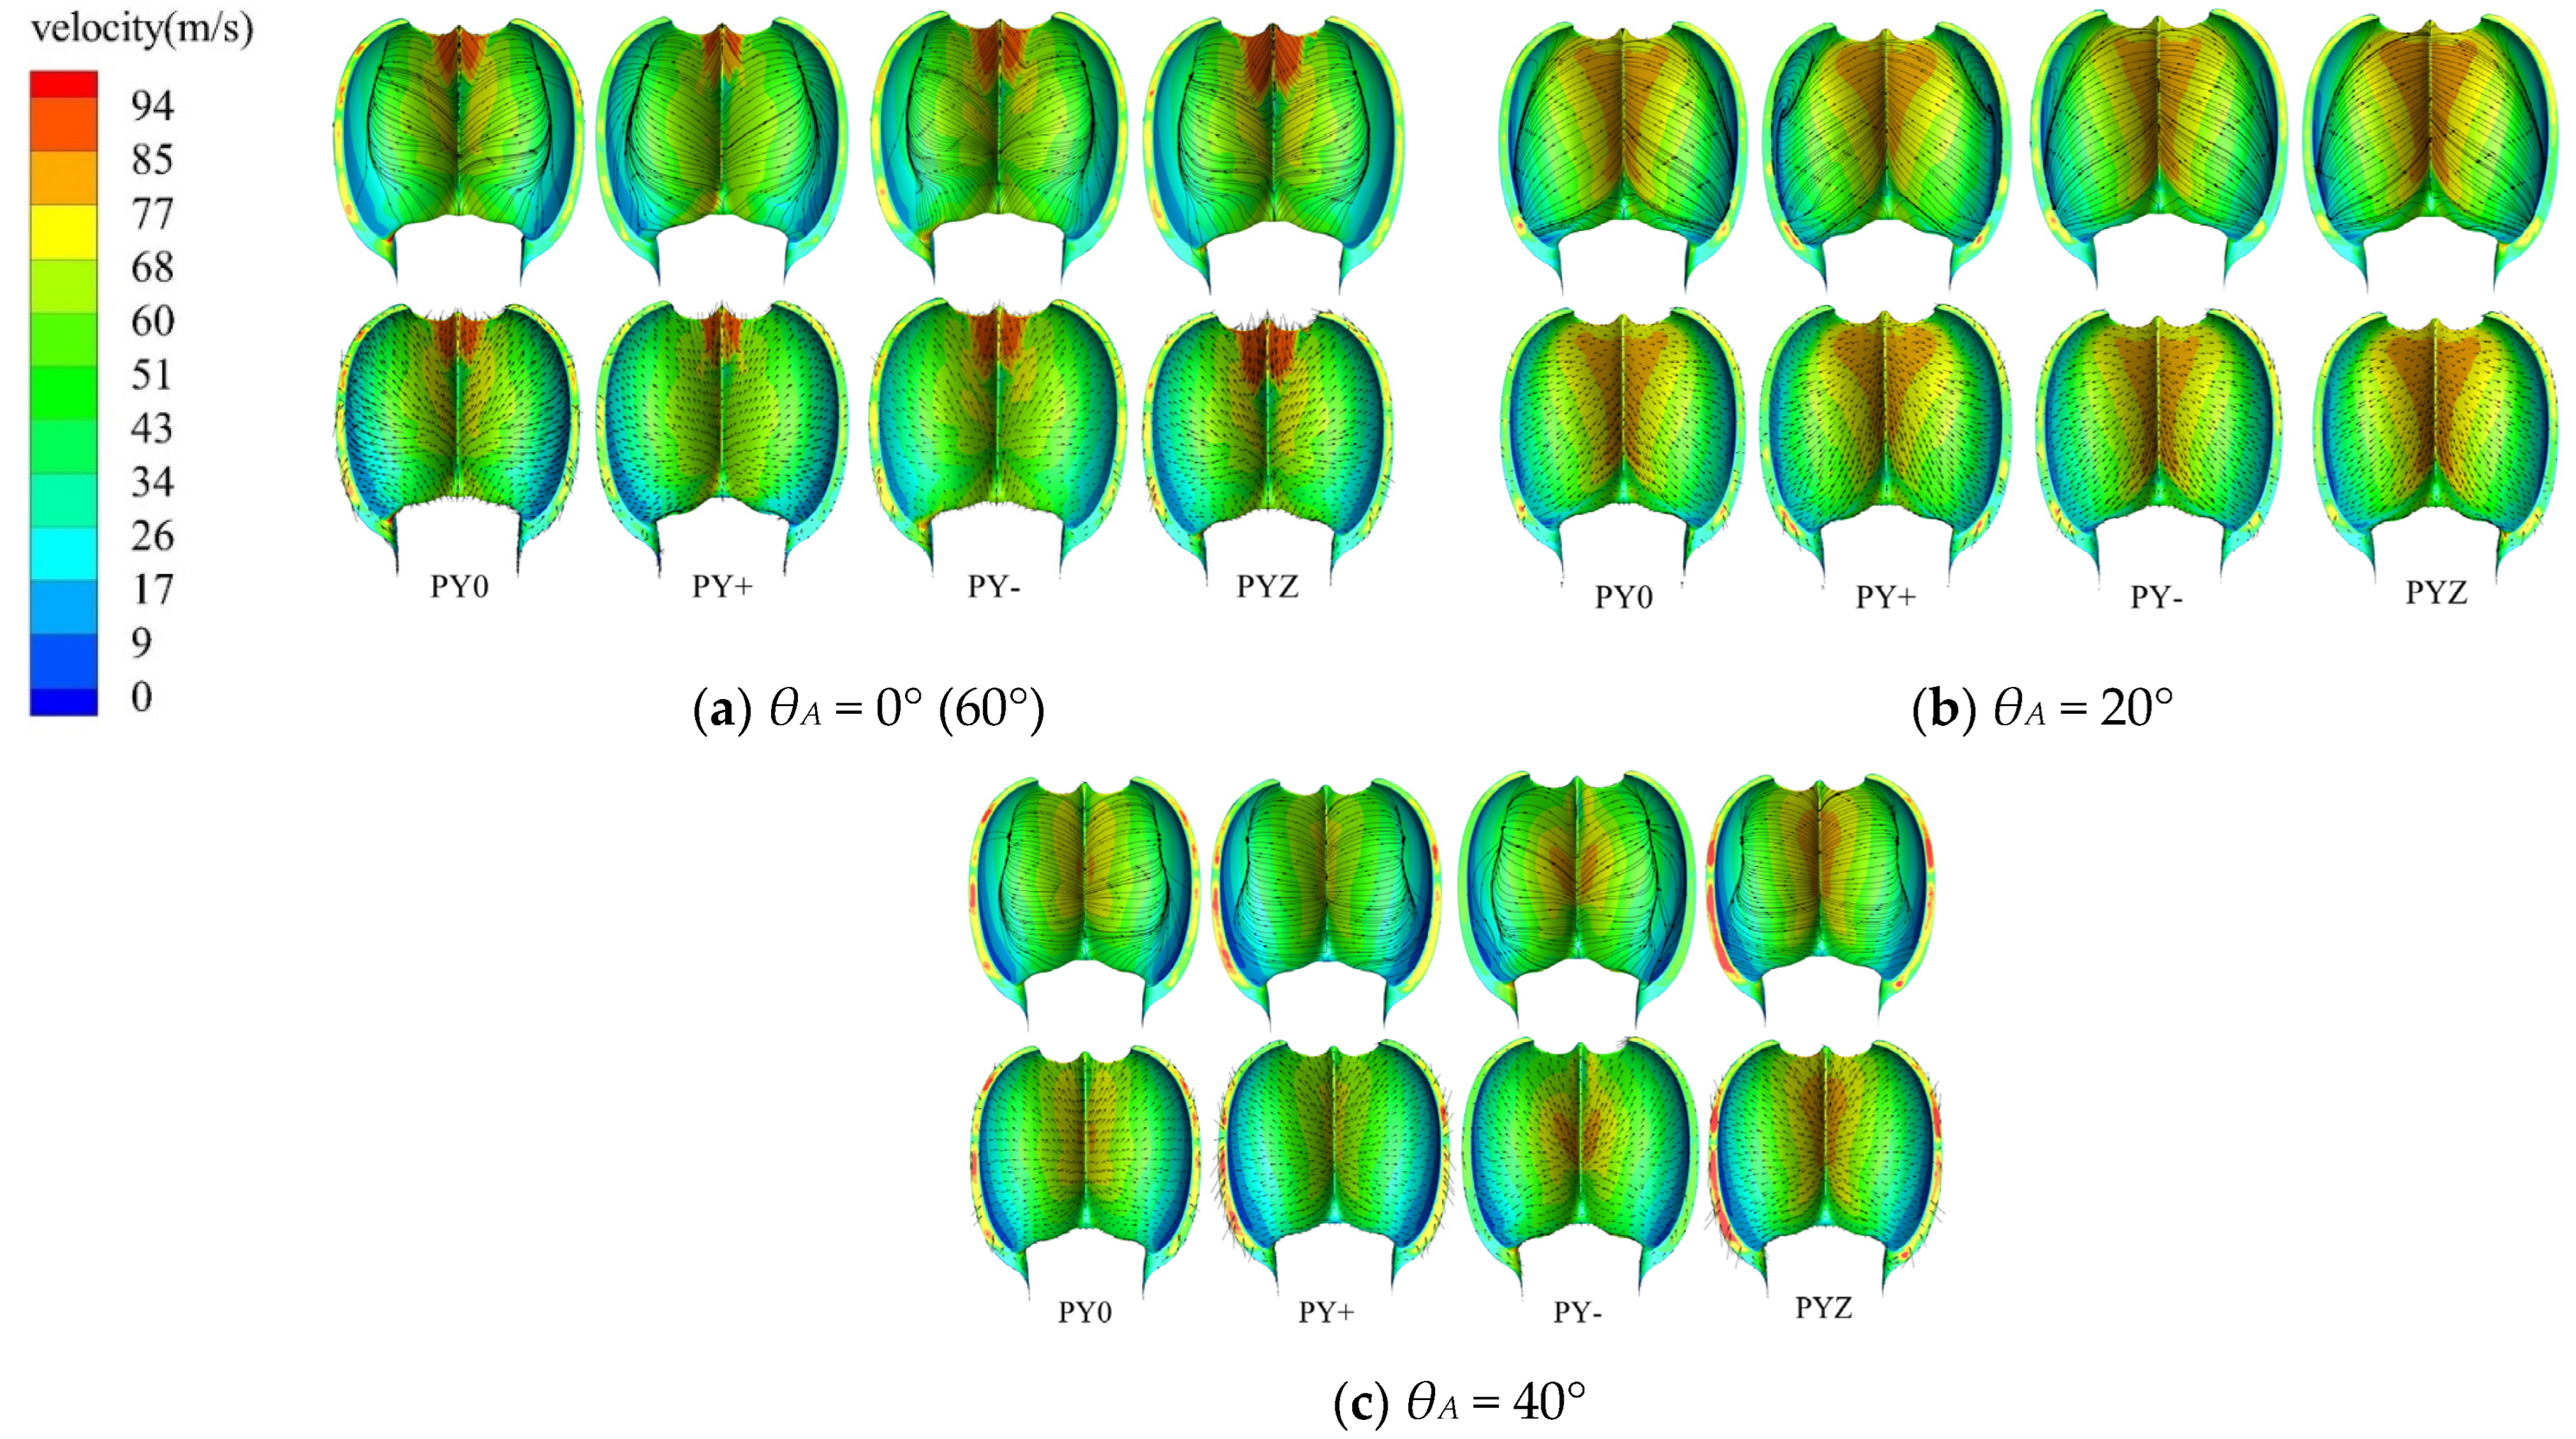
4.1. Effect of Deviation on the Internal Flow of the Bucket

This Pelton turbine has six nozzles, and the angles covered by the individual nozzle jets are from 0° to 60°. The calculation results show that the flow pattern of the water film and the pressure distribution on a single bucket are periodic and are related to the number of nozzles. In the numerical calculation, the position where the individual jet just touches the splitter was chosen as the starting position of the bucket rotation, and θA was the bucket rotation angle (defined as the angle between the splitter of an individual bucket and the starting position of the bucket rotation at different moments), as shown in Figure 4. Three adjacent buckets, Buc1, Buc2 and Buc3, were selected at every 10° interval of θA to analyze the formation of the water film and the pressure distribution on the leading face of the bucket after the jet deviation.
The jet flow states and the volume fractions of the water phase on the pitch circle plane under four conditions of PY0, PY+, PY− and PYZ with different bucket rotation angles are shown in Figure 5. The dark blue part is the gas phase, the red part is the water phase, and the light blue transparent part is the flow isosurface. The three buckets are defined as Buc1, Buc2 and Buc3 from top to bottom, and the flow state of Buc2 is mainly discussed here. As can be seen from Figure 4, the volume fraction distribution of water on the leading face of the bucket changes with the rotation angle of the bucket. When θA = 0° (60°), the jet strikes the tip of the splitter, the water film develops from the splitter to the root of the leading face and to both sides of the trailing edge, and the water film thickness is low at the pitch circle. When θA is from 20° to 40°, the jet develops from the tip of the splitter to its middle, and the water film thickness also increases. When θA = 40°, the jet vertically strikes the splitter, the water film thickness at the pitch circle reaches the maximum, and the undesired phenomenon of “back interference” can be observed at the back of the bucket. A negative pressure area can be observed near the trailing edge under all four deviation conditions, and the jet leaving the trailing edge of Buc3 will strike the back of the trailing edge of Buc2. It can also be seen in the PY0 condition at θA = 40°, and the jet interference phenomenon of the former bucket will be brought about due to the vertical striking of the bucket splitter. This interference may cause cavitation, damage the bucket and reduce the stability and efficiency of the Pelton turbine.
The pressure distribution clouds on the leading face of Buc2 at different rotation angles after jet deviation are shown in Figure 6. It can be seen that when the jet is radially deviated, it is still equally divided by the splitter, but there is a slight difference in the time when the jet enters the bucket surface, and the jet under PY+ enters the bucket later than it does under PY0. When θA = 20°, after the axial deviation (deviating towards the right of the bucket splitter, as shown in Figure 6), the pressure distribution on both sides of the splitter is uneven, and the high-pressure area is larger on the side towards which the jet is deviated, which will cause fatigue damage to the leading face of the bucket if the power station has operated under this condition for a long time.
The streamlines and vectors at different rotation angles after the jet deviation are shown in Figure 7. It can be seen that at the stage of striking the leading face of the bucket, the location of the jet strikes on the bucket will move from the notch to the root. When the jet is deviated, the water film in the bucket diffuses the fastest under PY− and the slowest under PY+, while the PYZ condition has almost no effect on the rate of water film formation.
When θA = 0° (60°), the jet starts to enter the leading face of the bucket from the tip of the splitter. When compared with the condition without deviation, it can be seen that the jet under PY− is the first to enter the bucket, and the high-velocity area on both sides of the splitter is the largest; the jet under PY+ is the last to enter the bucket, and the high-velocity area is distributed at the tip of the splitter and is equally divided by the splitter. With the rotation of the rotor, the water film gradually spreads from the splitter to the root of the bucket. Under PYZ, the velocity distribution of the flow on both sides of the splitter appears to be unevenly distributed, but the axial deviation of the jet does not affect the velocity of the water film formation in the bucket.
When θA = 20°, the streamlines cover the whole surface of the bucket and gradually spread from the splitter to the edge of the leading face. As the runner rotates, the water film will cover most of the leading face of the bucket. Under PYZ, the uneven distribution of the jet on both sides of the splitter gradually decreases, the flow state on the leading face of the bucket is stable, and the jet moves along the splitter towards the direction of the axis.
When θA = 40° and under PY−, the water film streamlines formed after the jet enters the bucket first flow into the bottom of the bucket and then flow out from the trailing edge near the root of the bucket, while under PY+, the velocity of the water film flowing through the bottom of the bucket is slow. Therefore, the radial deviation of the jet will affect the diffusion rate of the water film on the bucket at the leading face. Under PYZ, the diffusion rate of the water film in the bucket is lower than that under PY0, and the streamlines inside the bucket change slightly with uneven distribution on both sides of the bucket, which reduces the operating stability of the runner.

4.2. Effect of Deviation on the Forces on the Runner

The effect of deviation on the forces on the runner was studied by monitoring the forces in the axial z, radial r and tangential τ directions during operation. The data within one cycle after the calculation converges and stabilizes were used for analysis. The oscillation and efficiency of the turbine were measured. The calculated and measured results under the four conditions of PY0, PY+, PY− and PYZ are listed in Table 4.

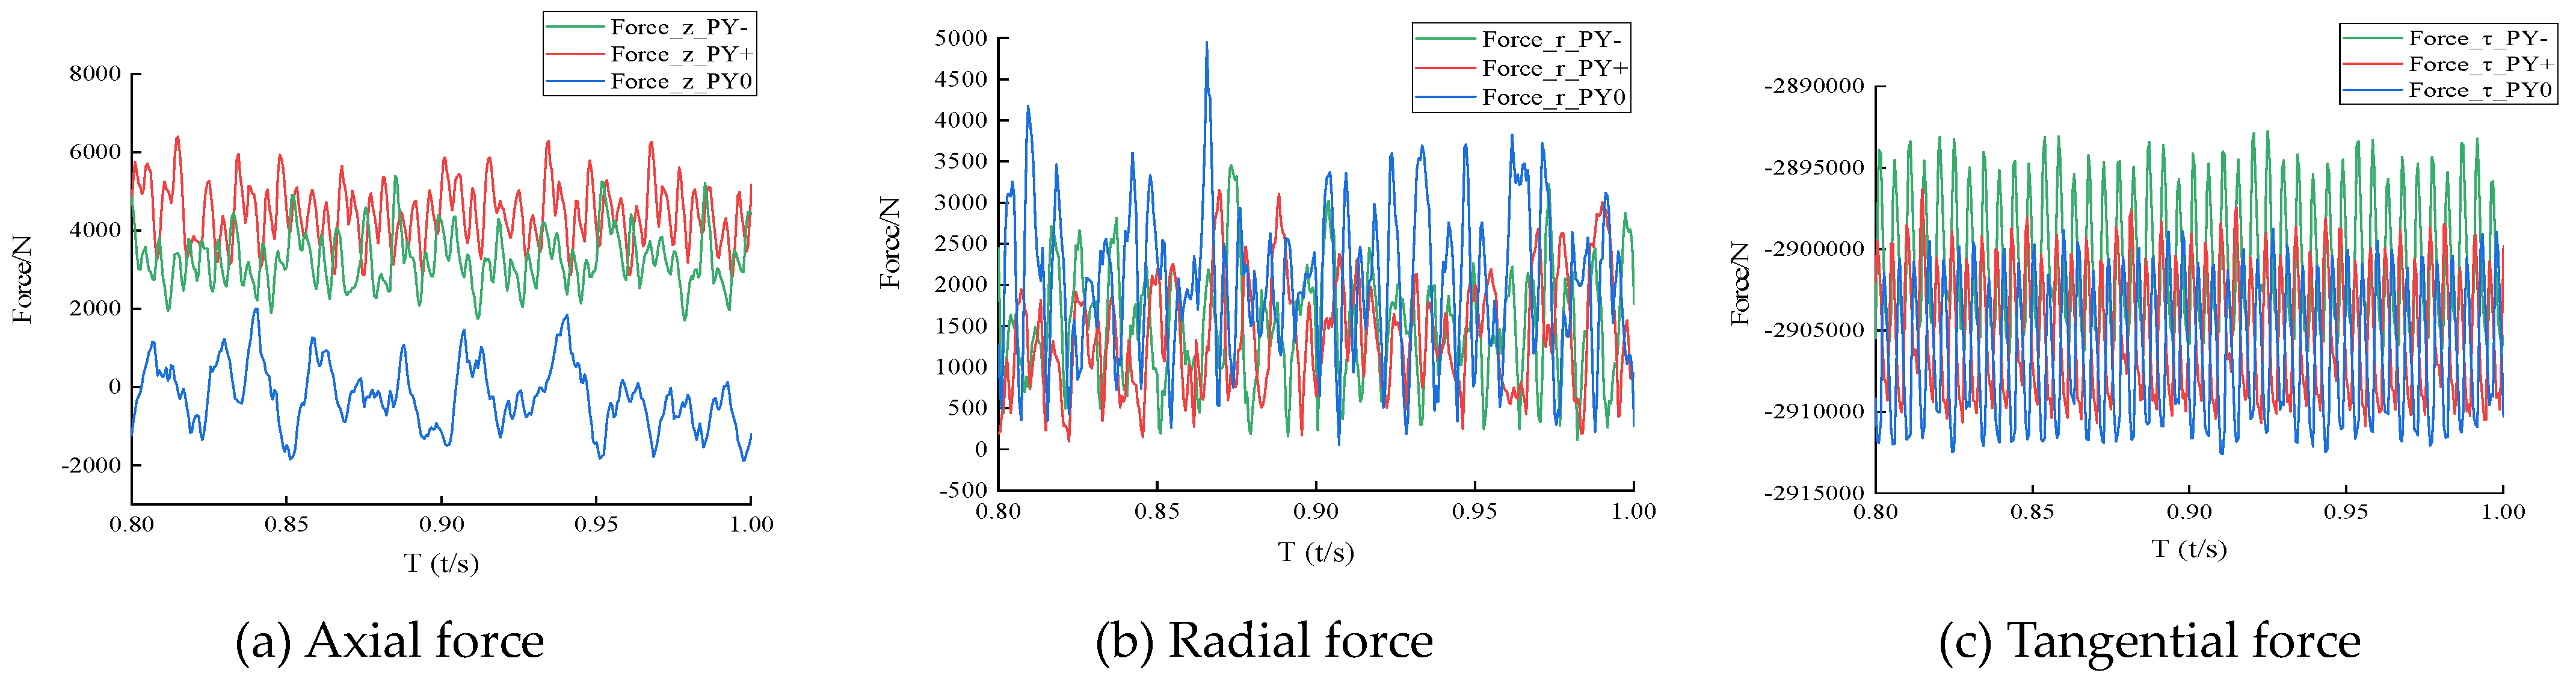
4.2.1. Effect of Radial Deviation on the Forces on the Runner

The variations in forces on the runner in directions of z, r and τ under the conditions of PY0, PY+ and PY− are shown in Figure 8. The results in Figure 8 and Table 4 show that the forces on the runner in all three directions have an irregular oscillation. After the radial deviation, the maximum force on the runner axis in the z direction increases significantly. The maximum axial force on the runner increases by 2.27 times under PY+ when compared with that under PY0, and the axial force under PY− increases by 1.79 times, indicating that the radial deviation has a great effect on the axial vibration of the turbine, increasing the risk of the turbine lifting. The maximum force in the radial r direction of the runner is reduced, the radial force under PY+ is 12.58% less than that under PY0, and the radial force under PY− is 30.22% less than that under PY0, indicating that the radial deviation of the jet reduces the radial oscillation of the runner. The effect of jet deviation on the forces in the tangential τ direction is small, the tangential force under PY+ is 0.22% lower than that under PY0, and under PY−, it is 0.3% lower than that under PY0. However, since the tangential force is related to the runner torque, its reduction will affect the output and efficiency of the turbine. The test results show that the radial deviation of the jet leads to a reduction in the efficiency of the turbine, which is 0.27% under PY+ and 0.33% under PY−.

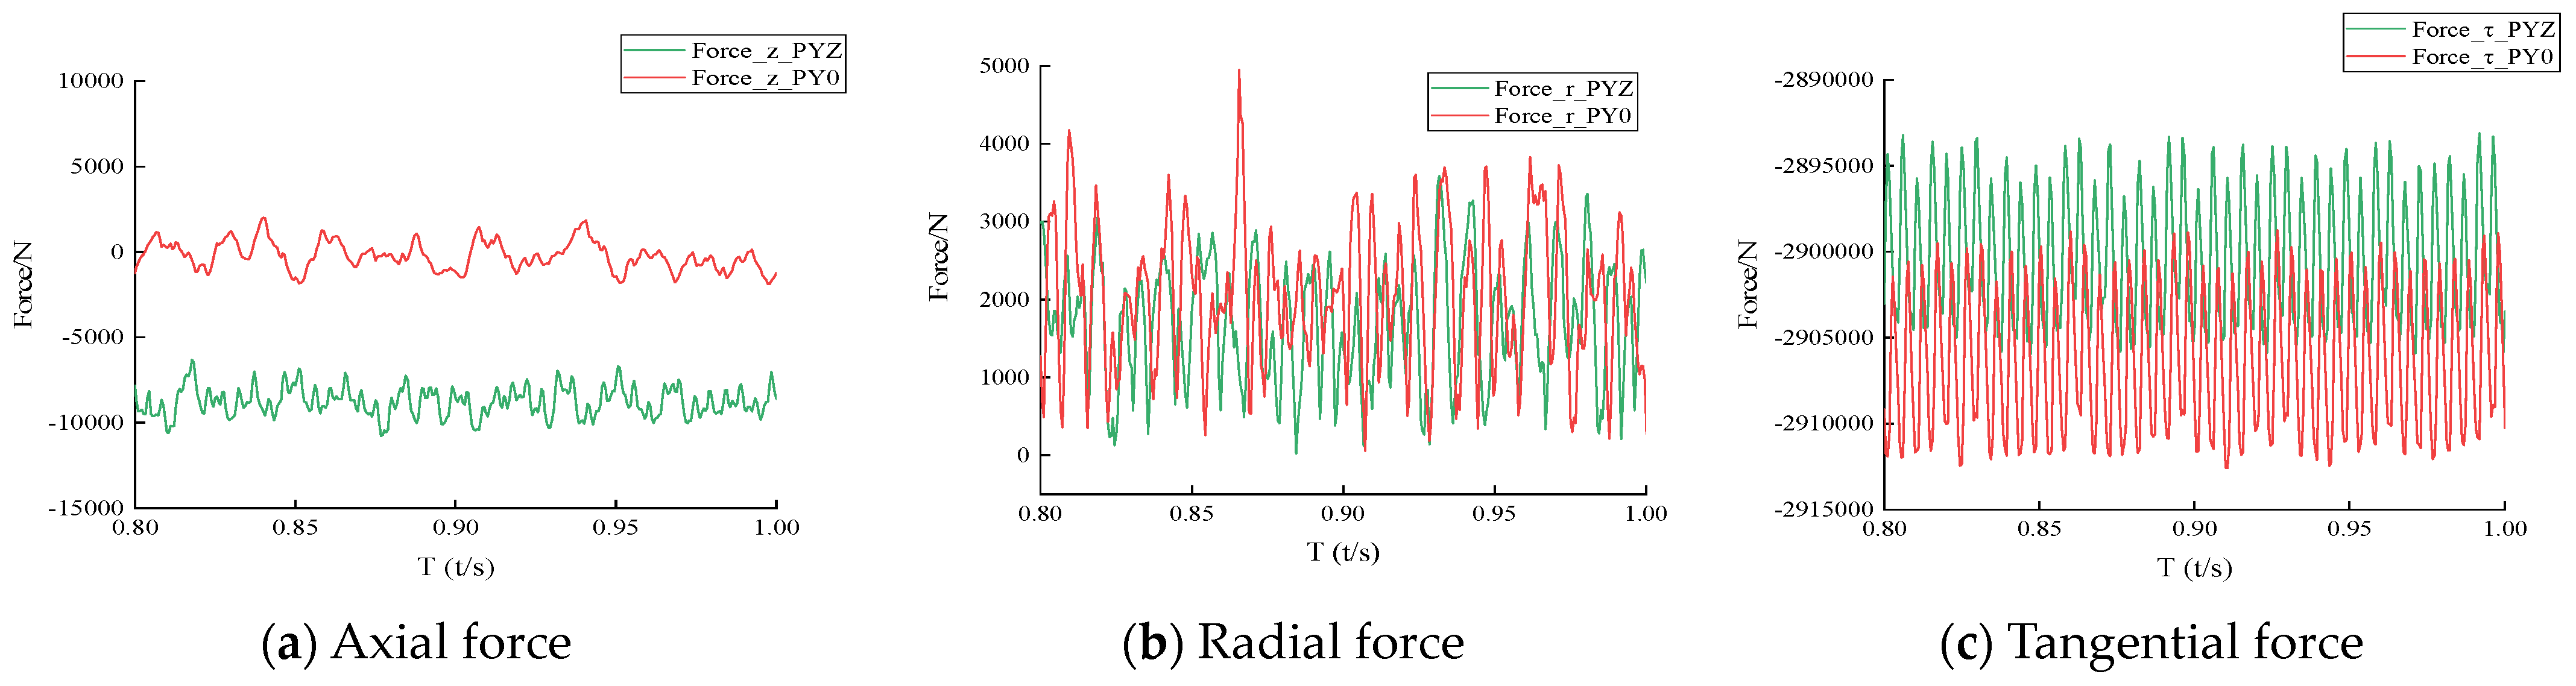
4.2.2. Effect of Axial Deviation on the Forces on the Runner

The variations in forces on the runner in the directions of z, r and τ under the conditions of PY0 and PYZ are shown in Figure 9. The results in Figure 9 and Table 4 show that the forces on the runner in all three directions also have an irregular oscillation. After the axial deviation, the axial forces on the runner increase significantly, while both the tangential and the radial forces decrease. The maximum axial force on the runner under PYZ is about four times larger than that under PY0, indicating that the axial deviation of the jet has a larger effect on the axial force than the radial deviation and has a larger effect on the axial vibration of the turbine. The radial force on the runner under PYZ is reduced by 25% when compared with that under PY0, indicating that the radial deviation of the jet can reduce the radial oscillation of the turbine. The impact of the axial deviation on the force in the tangential τ direction of the runner is also small, decreasing by 0.4%. However, compared with the radial deviation, the tangential force is reduced more under the axial deviation, indicating that the turbine output and efficiency are also reduced more, i.e., the jet axial deviation has a larger effect on the turbine output and efficiency. The test results show that the turbine efficiency is reduced by 0.42% after the jet axial deviation.

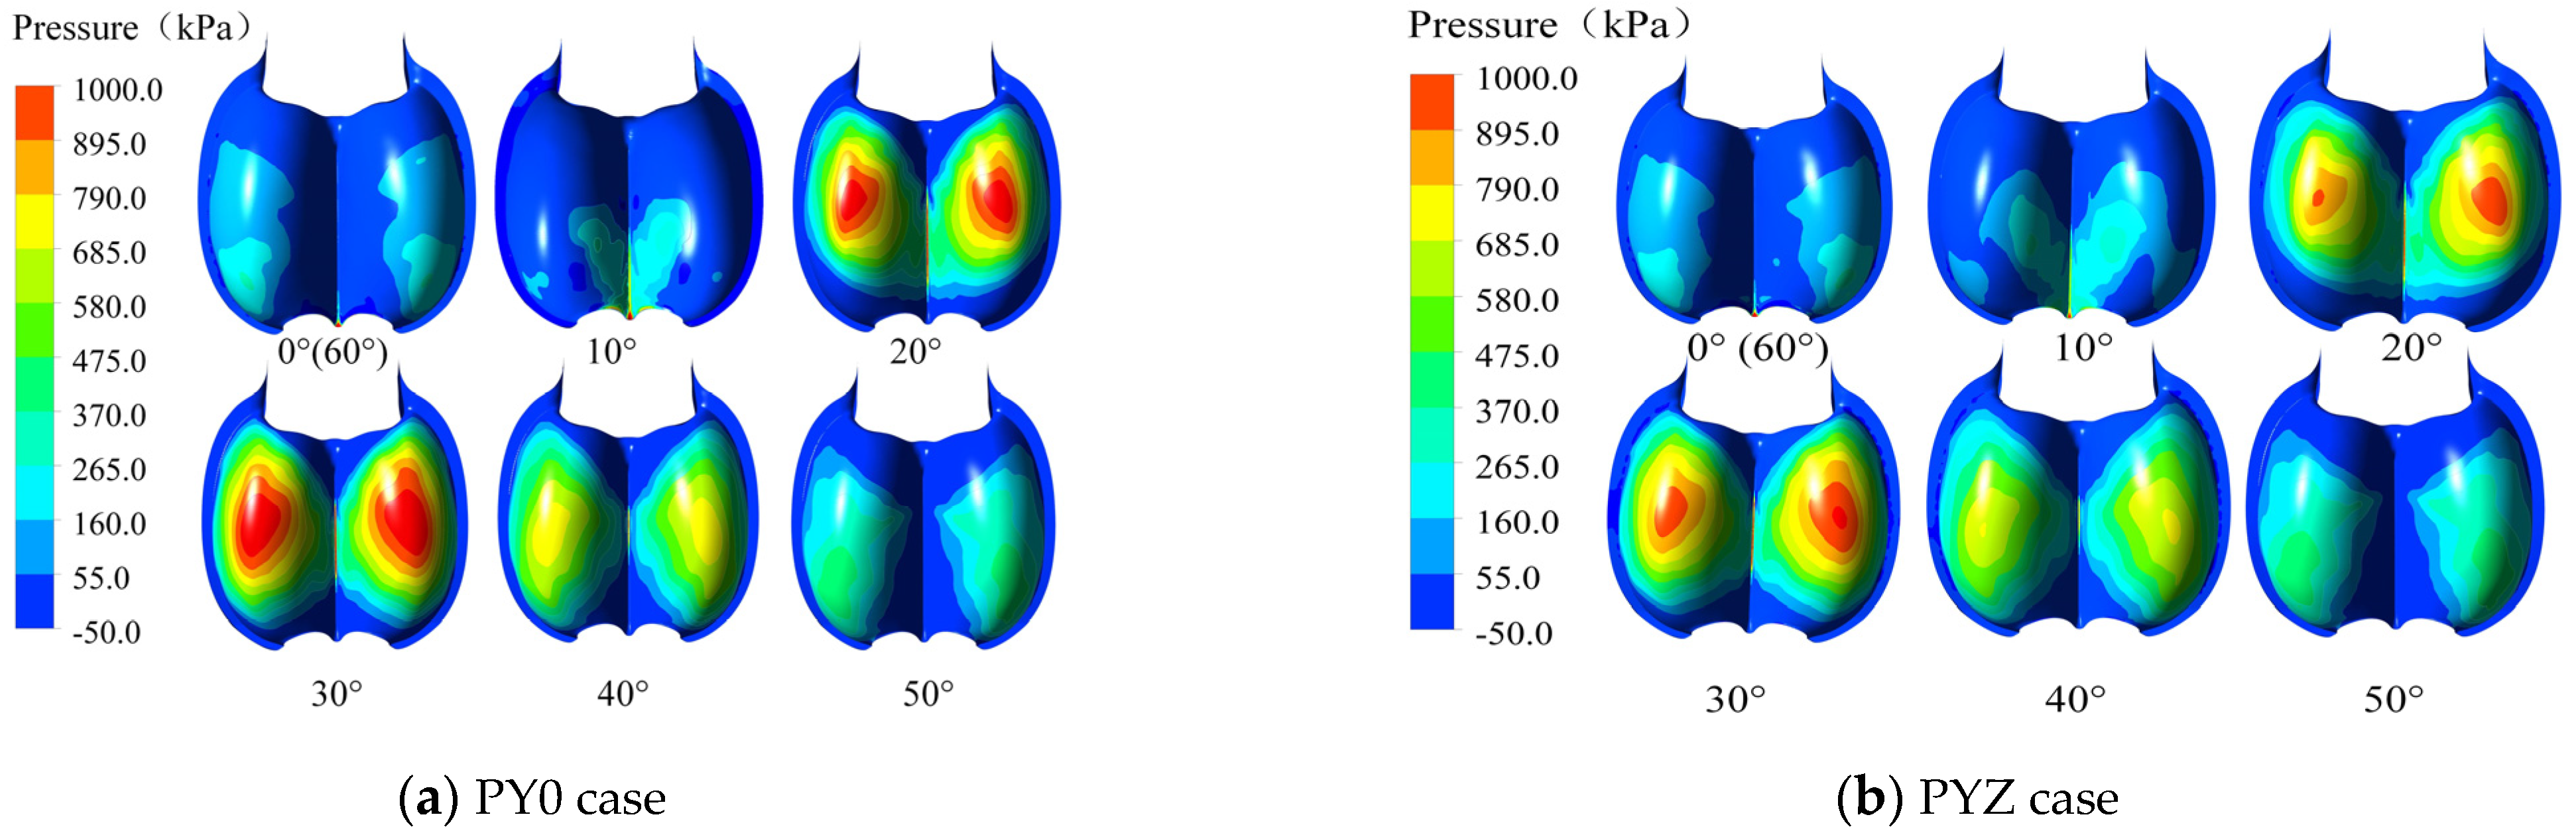
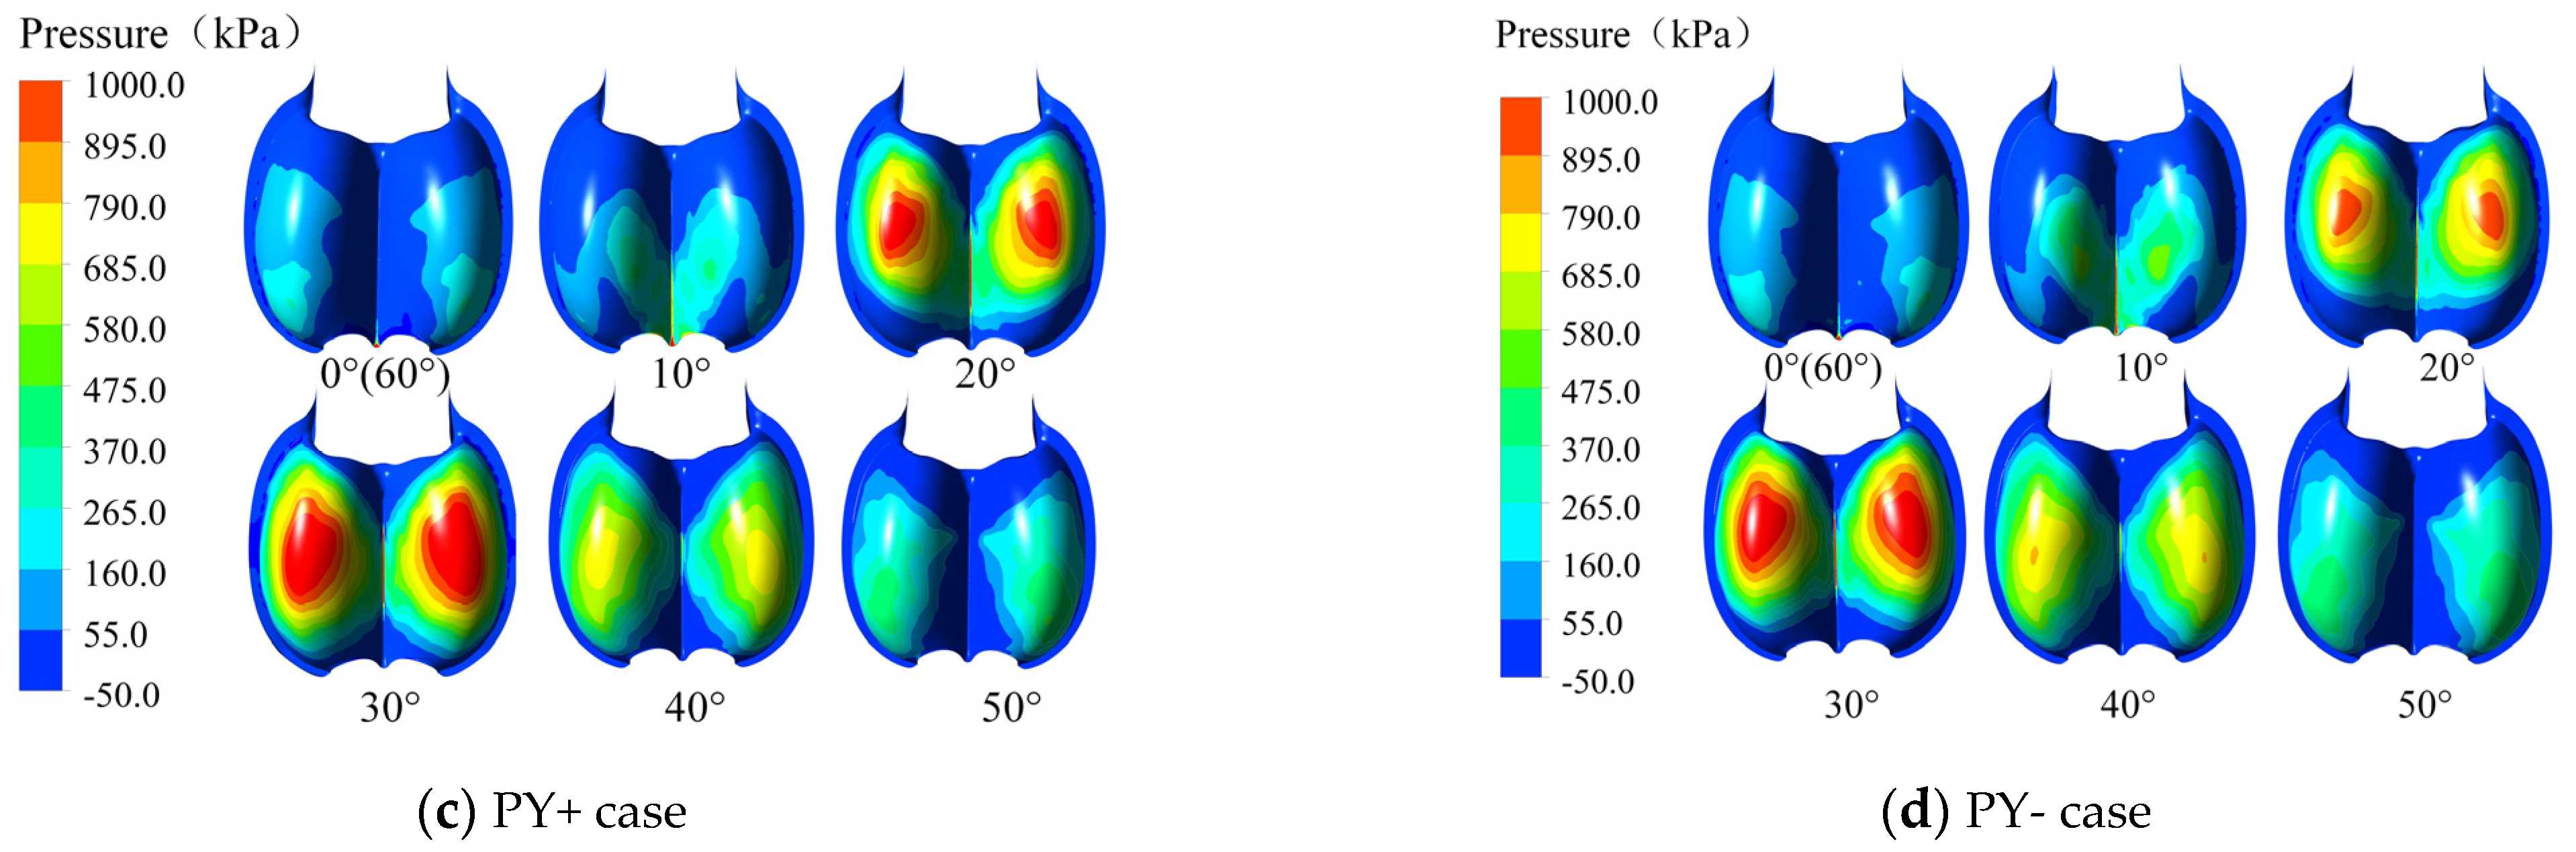
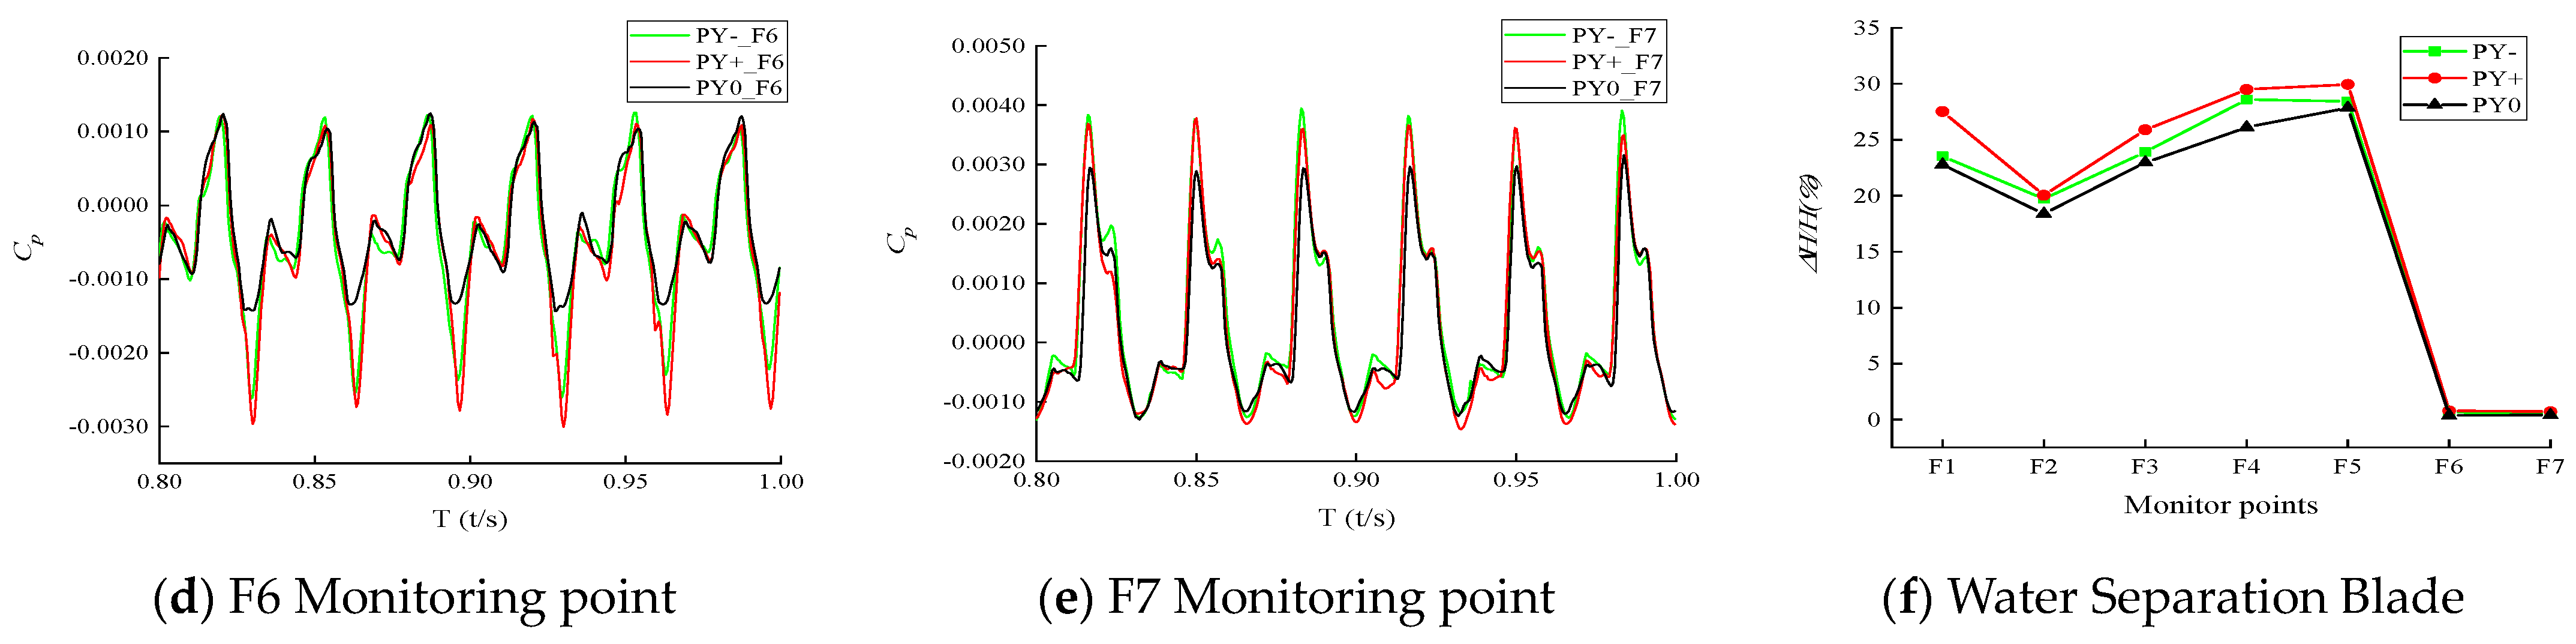
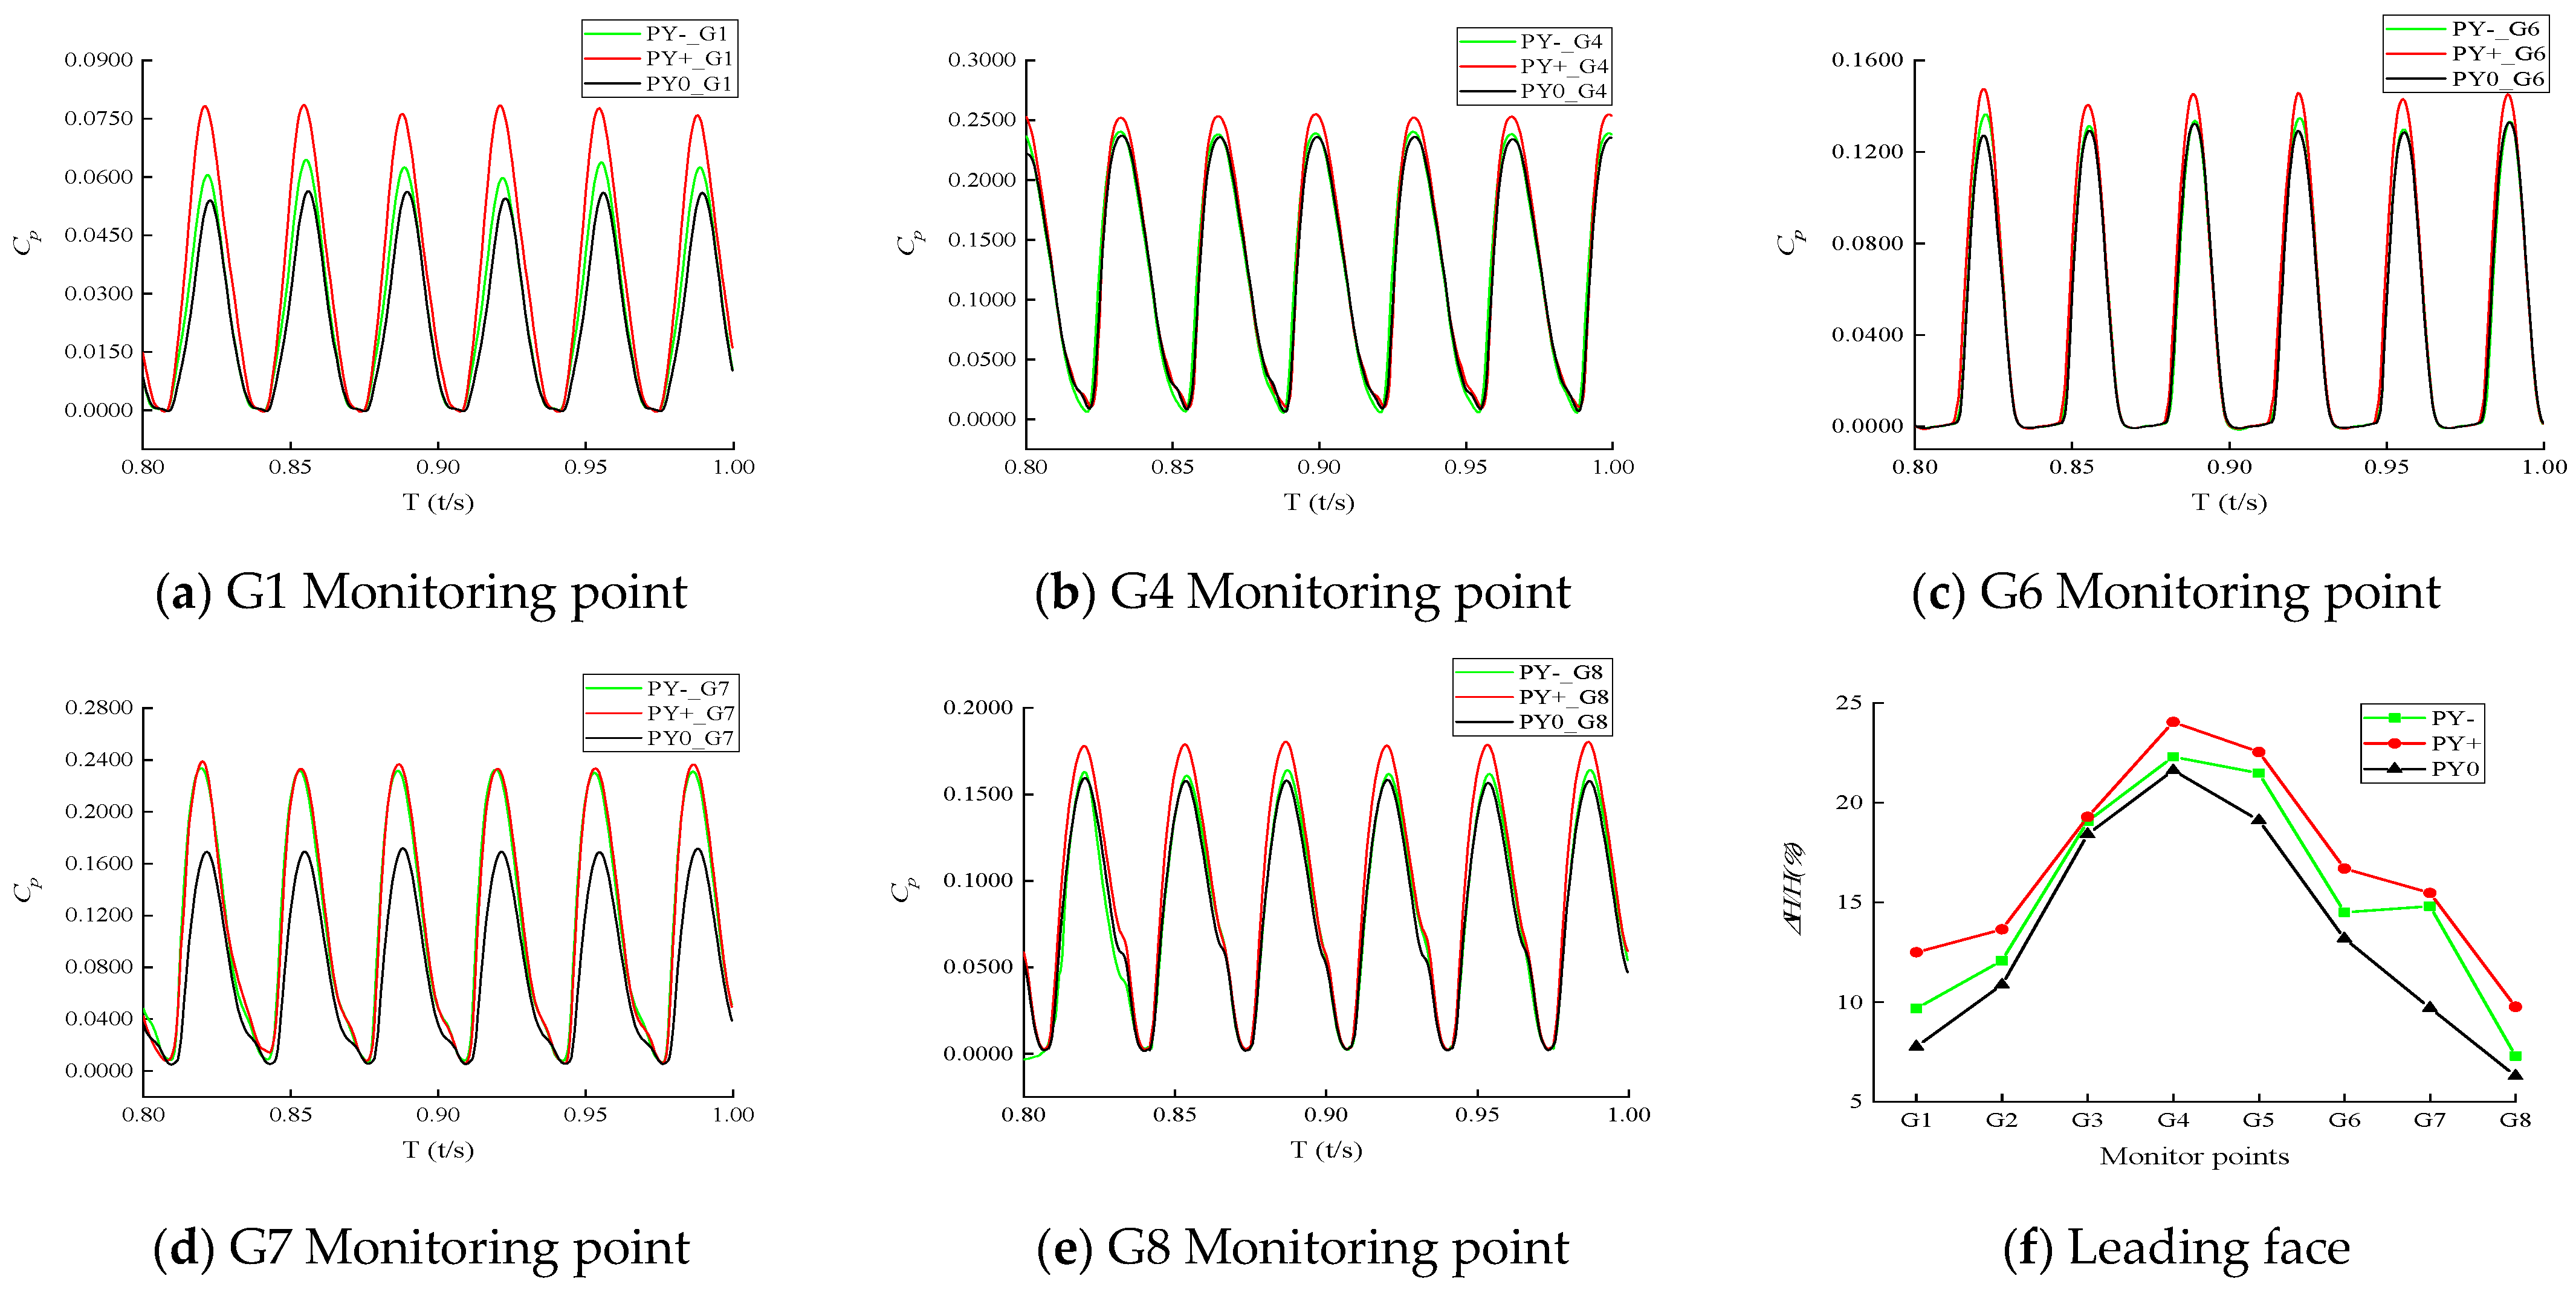
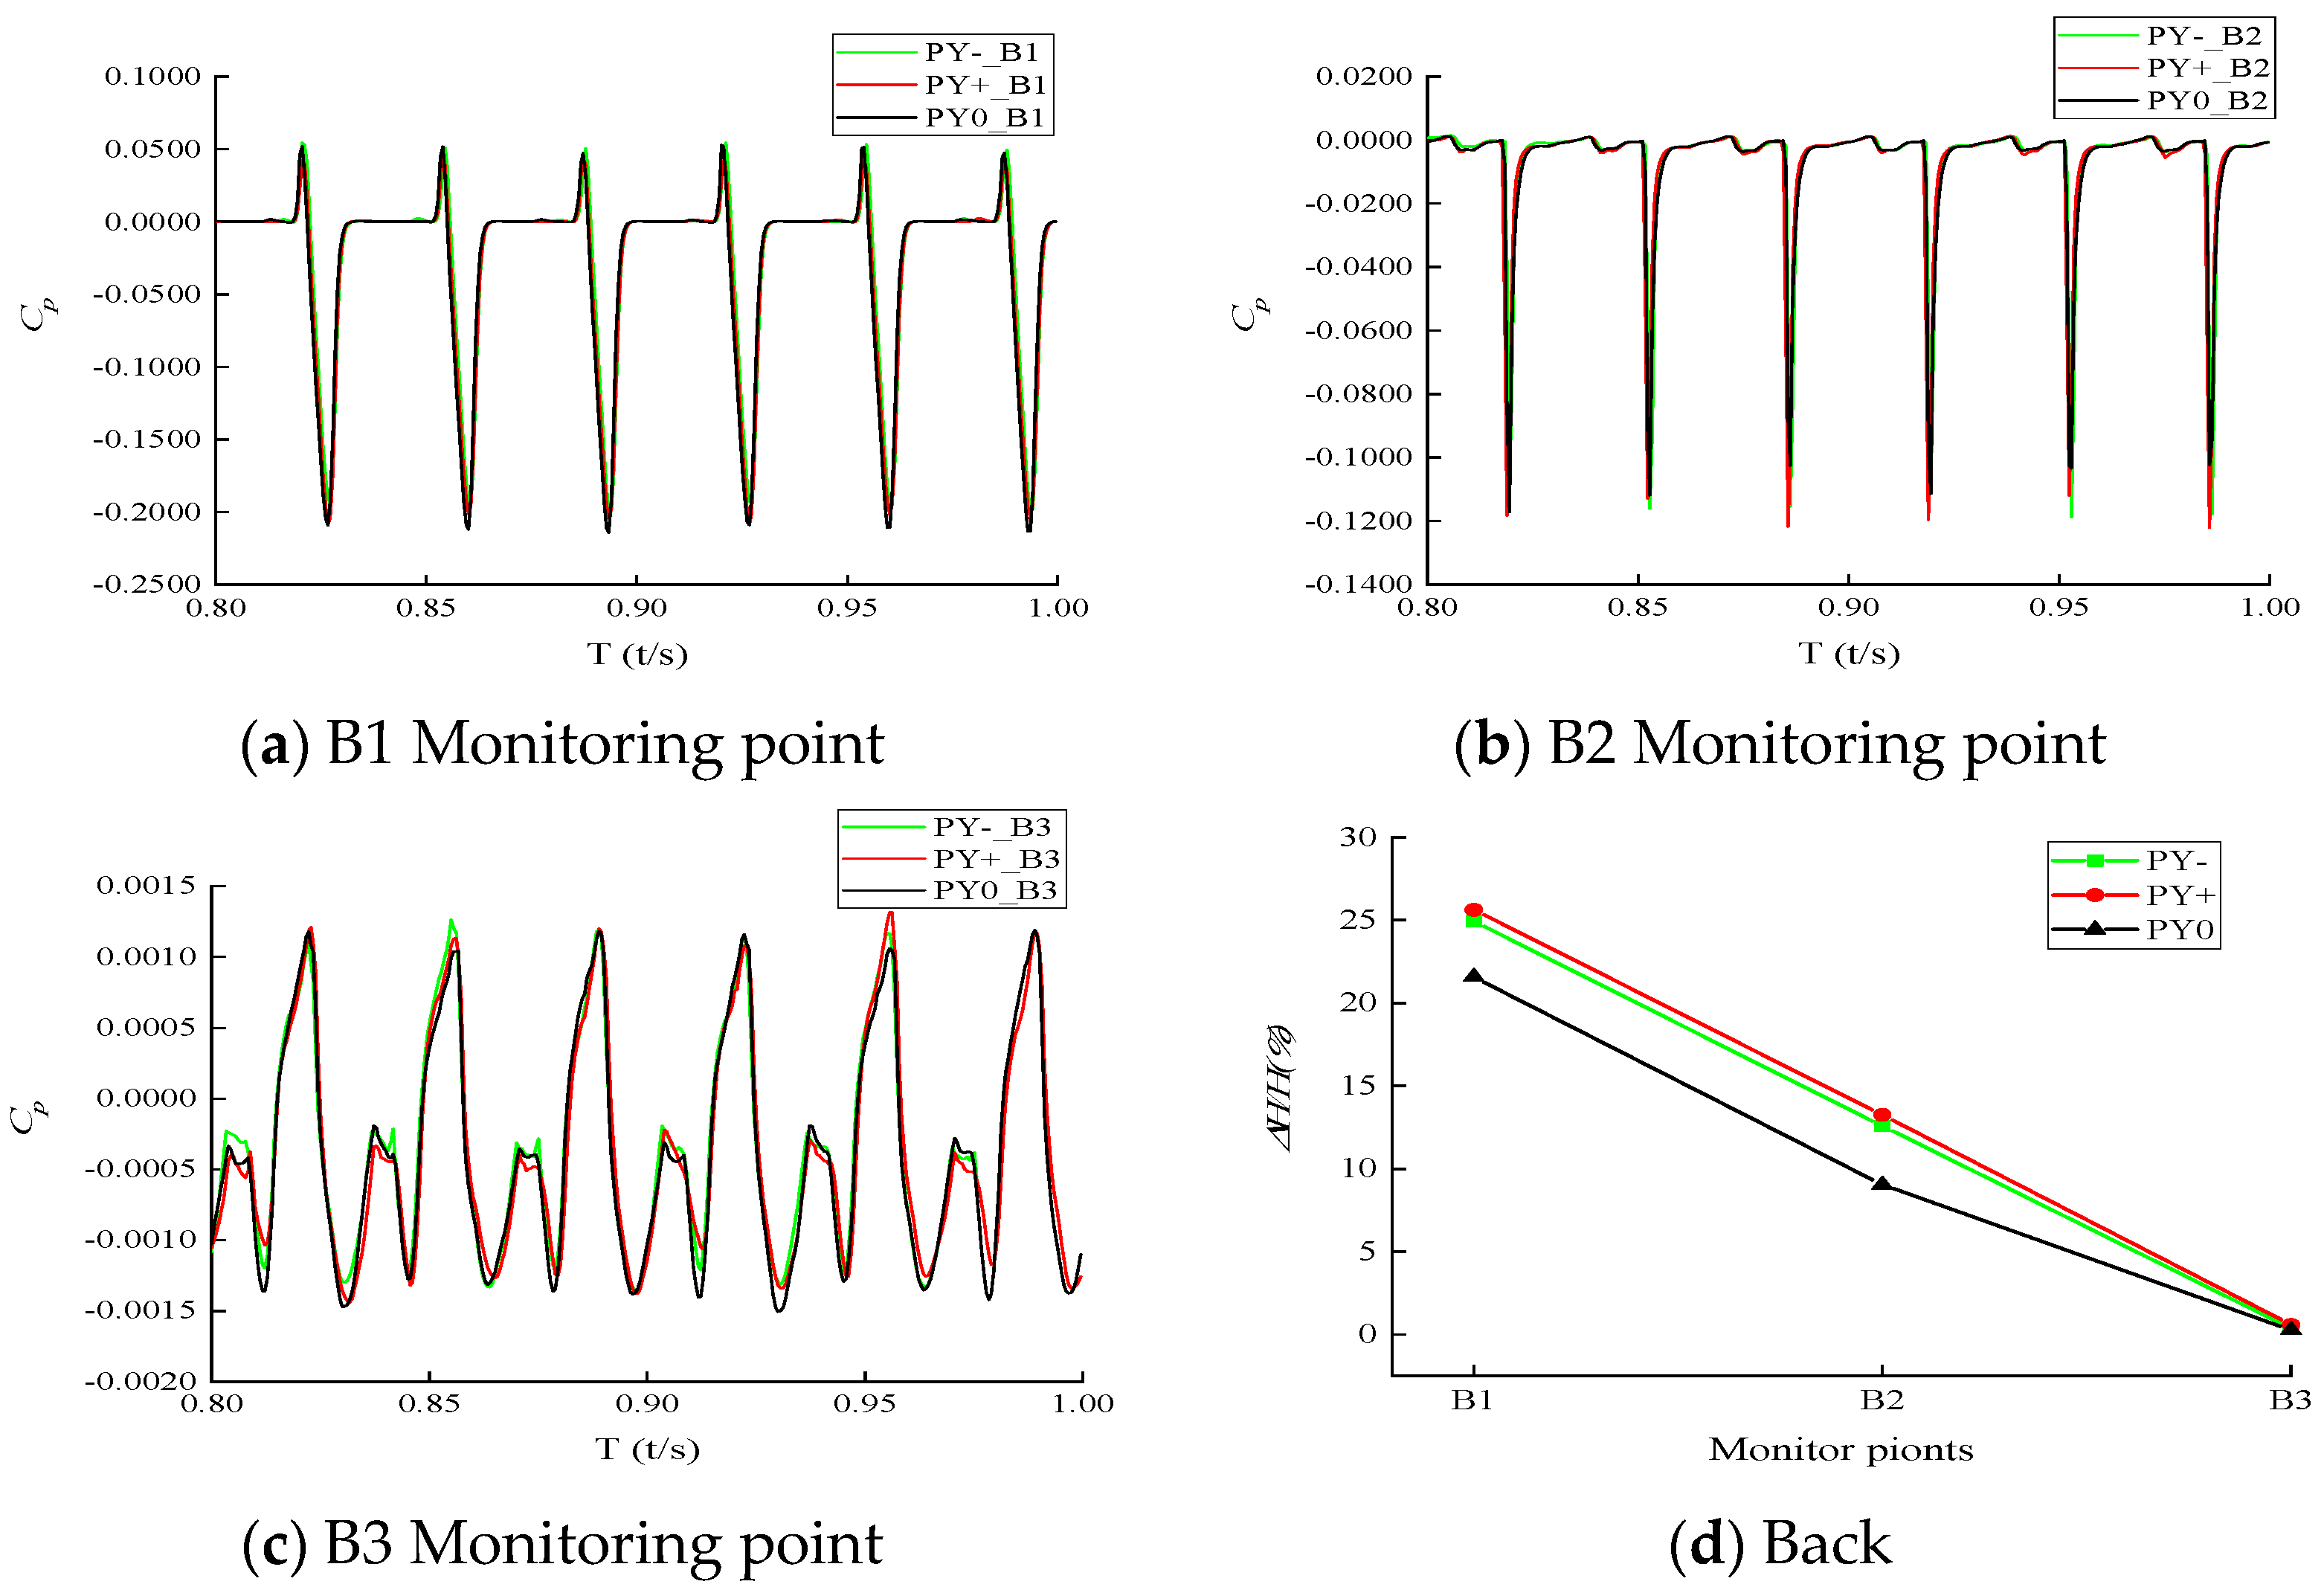
4.3. Effect of Deviation on Runner Pressure Pulsation

Two dimensionless numbers, pressure coefficient Cp and relative amplitude of pressure pulsation ΔH/H, were defined to quantify the intensity of pressure pulsation in Pelton turbines. The expressions are as follows:
Δ H H = p u max p u min ρ g H
C p = p u p ref ρ g H
where ΔH is the peak value of pressure pulsation; Cp is the dimensionless pressure coefficient; pu is the pressure corresponding to point u; pref is 1 atm; H is the head; and pumax and pumin are the maximum and minimum values of pressure at point u, respectively.
In order to observe the pressure pulsation inside the turbine runner, monitoring points were set at equal intervals of 100 mm on the leading face and the splitter of the bucket. The monitoring points were also set at equal intervals on the back of the bucket to observe the influence of the flow interference phenomenon on the pressure pulsation at the back of the splitter. The monitoring points for the radial deviation were set as G1 to G8, F1 to F7 and B1 to B3, while for the axial deviation, the monitoring points G9 to G13 were added. A schematic diagram of the monitoring point arrangement is shown in Figure 10.
In order to analyze the pressure pulsations at different monitoring points under different deviation conditions, the data with a calculated duration of one rotation cycle from 0.8 s to 1.0 s were used for analysis. The relative magnitudes of pressure coefficients and pressure pulsations in one rotation cycle for the bucket under four conditions are listed in Table 5.

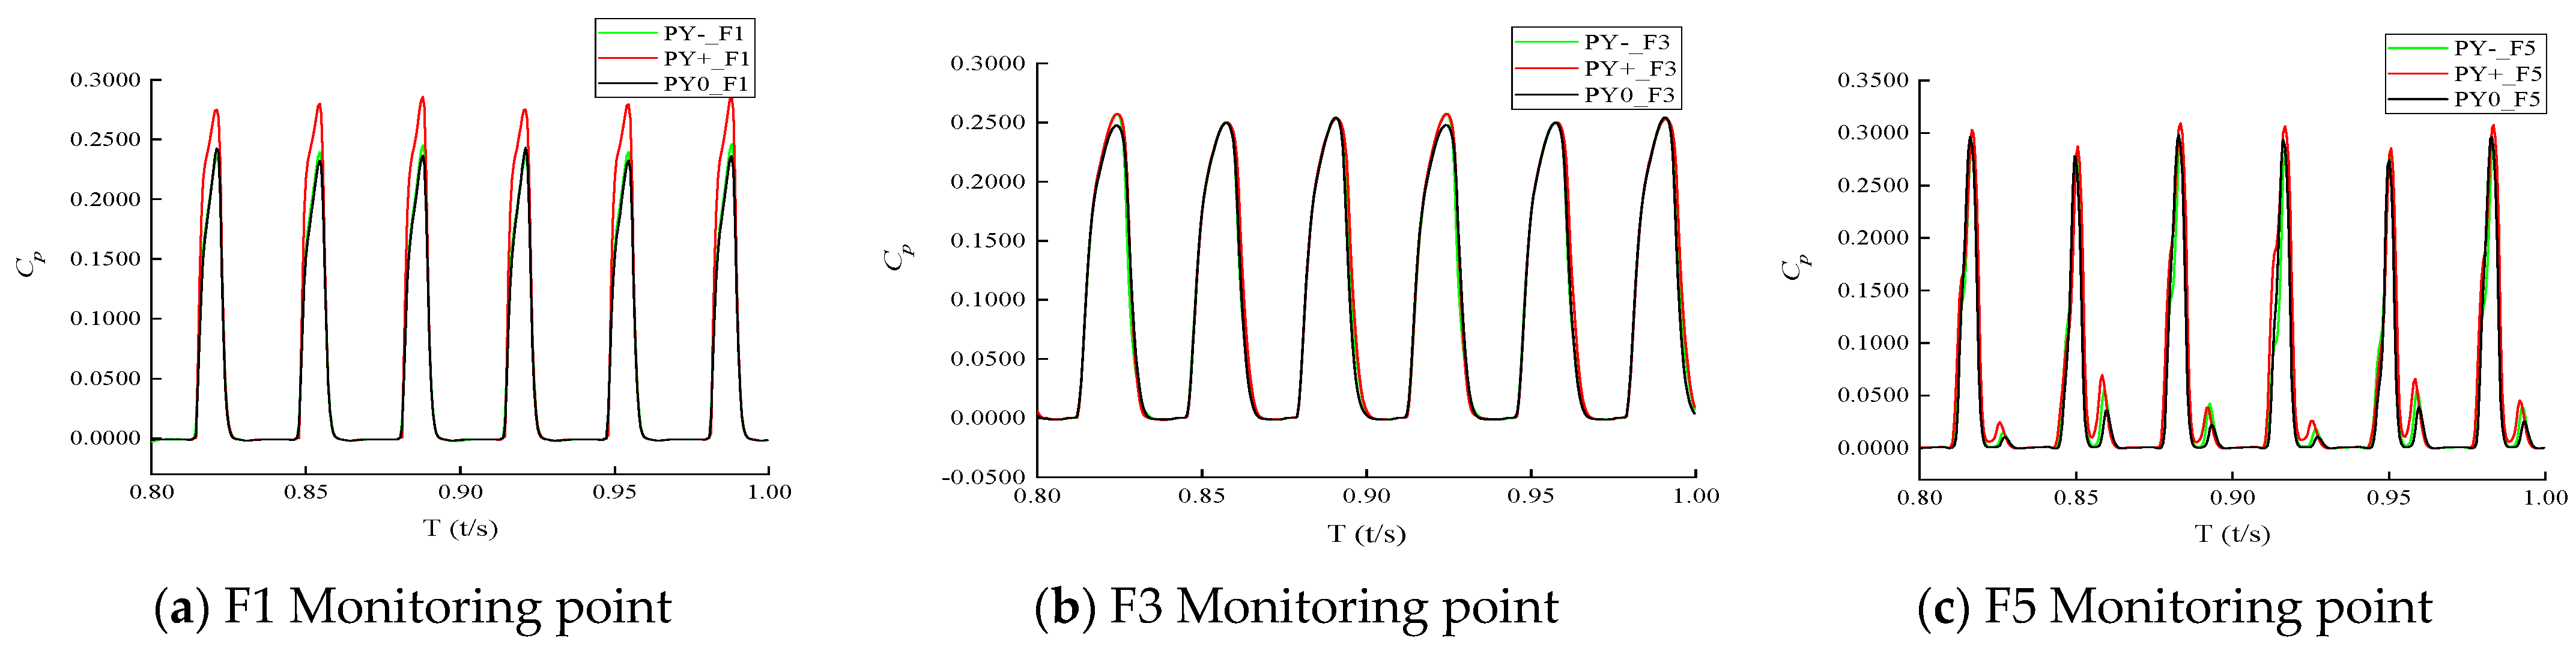
4.3.1. Effect of Radial Deviation on Pressure Pulsation of the Runner

The pressure coefficients and the relative amplitudes of pressure pulsation at some monitoring points on the splitter and leading face under the radial deviation are shown in Figure 11. The results in Figure 11 and Table 5 show that the radial deviation of the jet will aggravate the bucket pressure pulsation and increase the relative amplitude of the pressure pulsation. The relative amplitude of pressure pulsation from the tip of the splitter to the root of the bucket tends to increase first and then decrease, from 25% at the front of the splitter to 0 at the root of the splitter. The radial deviations under PY+ and PY− have the same effect on the pressure pulsation in the bucket, the center of the bucket is the main impact area of the high-speed jet, and the radial deviation has a significant impact on the relative amplitude of pressure pulsation in this area.
The pressure coefficients and the relative amplitudes of pressure pulsation at some monitoring points on the bucket leading face under the radial deviation are shown in Figure 12. The results in Figure 11 and Table 5 show that the relative amplitude of pressure pulsation on the leading face of the bucket tends to increase first and then decrease from the inlet to the root of the bucket, and the relative amplitude of pressure pulsation is larger in the center of the bucket. The relative amplitudes of pressure pulsation under the radial deviation at all monitoring points are larger than those without the deviation, and they are increased significantly near the tip of the splitter and at the root of the bucket. The relative amplitude of pressure pulsation under PY+ is larger than that under PY−, indicating that the pressure pulsation of the turbine is more intense when the jet is deviated towards the outer edge of the runner.
The pressure coefficients and relative amplitudes of pressure pulsation at the monitoring point on the splitter at the back of the bucket under the radial deviation are shown in Figure 13. The results in Figure 13 show that the relative amplitudes of pressure pulsations at the back of the bucket vary linearly, with the largest at the inlet of the bucket and the lowest at the root of the splitter. The absolute values of pressure pulsations and pressure coefficients under the radial deviation are small, decreasing from the outer edge to the root of the bucket, indicating that the radial deviation of the jet has little effect on the stability. The pressure coefficients at the back of the bucket are mostly negative because there is a concave area on the back, and a cavity area will be formed between the flow of the jet and the back of the bucket, resulting in a negative pressure. The positive pressure at monitoring point B1 is formed due to the striking of that point by part of the jet striking the notch of the bucket.
The results also show that the pressure coefficients are positive at most monitoring points on the leading face and the splitter and negative on the back under PY0, PY+ and PY−. The difference between the pressure coefficients of the monitoring points does not exceed 30% except for the monitoring point G7, but the difference in relative amplitude of the pressure pulsation is large, especially under PY+. The relative amplitude of pressure pulsation after the radial deviation of the jet shows an increasing trend. Compared with the condition without deviation, the relative amplitudes of pressure pulsation at some monitoring points under PY+ and PY− are increased by 60%, among which G1 monitoring point is increased by 82.2% under PY+ and 24.5% under PY−, while G7 monitoring point is increased by 59.3% under PY+ and 52.5% under PY−. The maximum relative amplitude of pressure pulsation under the radial deviation occurs at the center of the bucket, which indicates that it is closely related to the striking effect of the jet. The relative amplitude of pressure pulsation and the pressure coefficient at all monitoring points on the bucket under PY+ are larger, indicating that the pressure pulsation caused by PY+ is much worse.

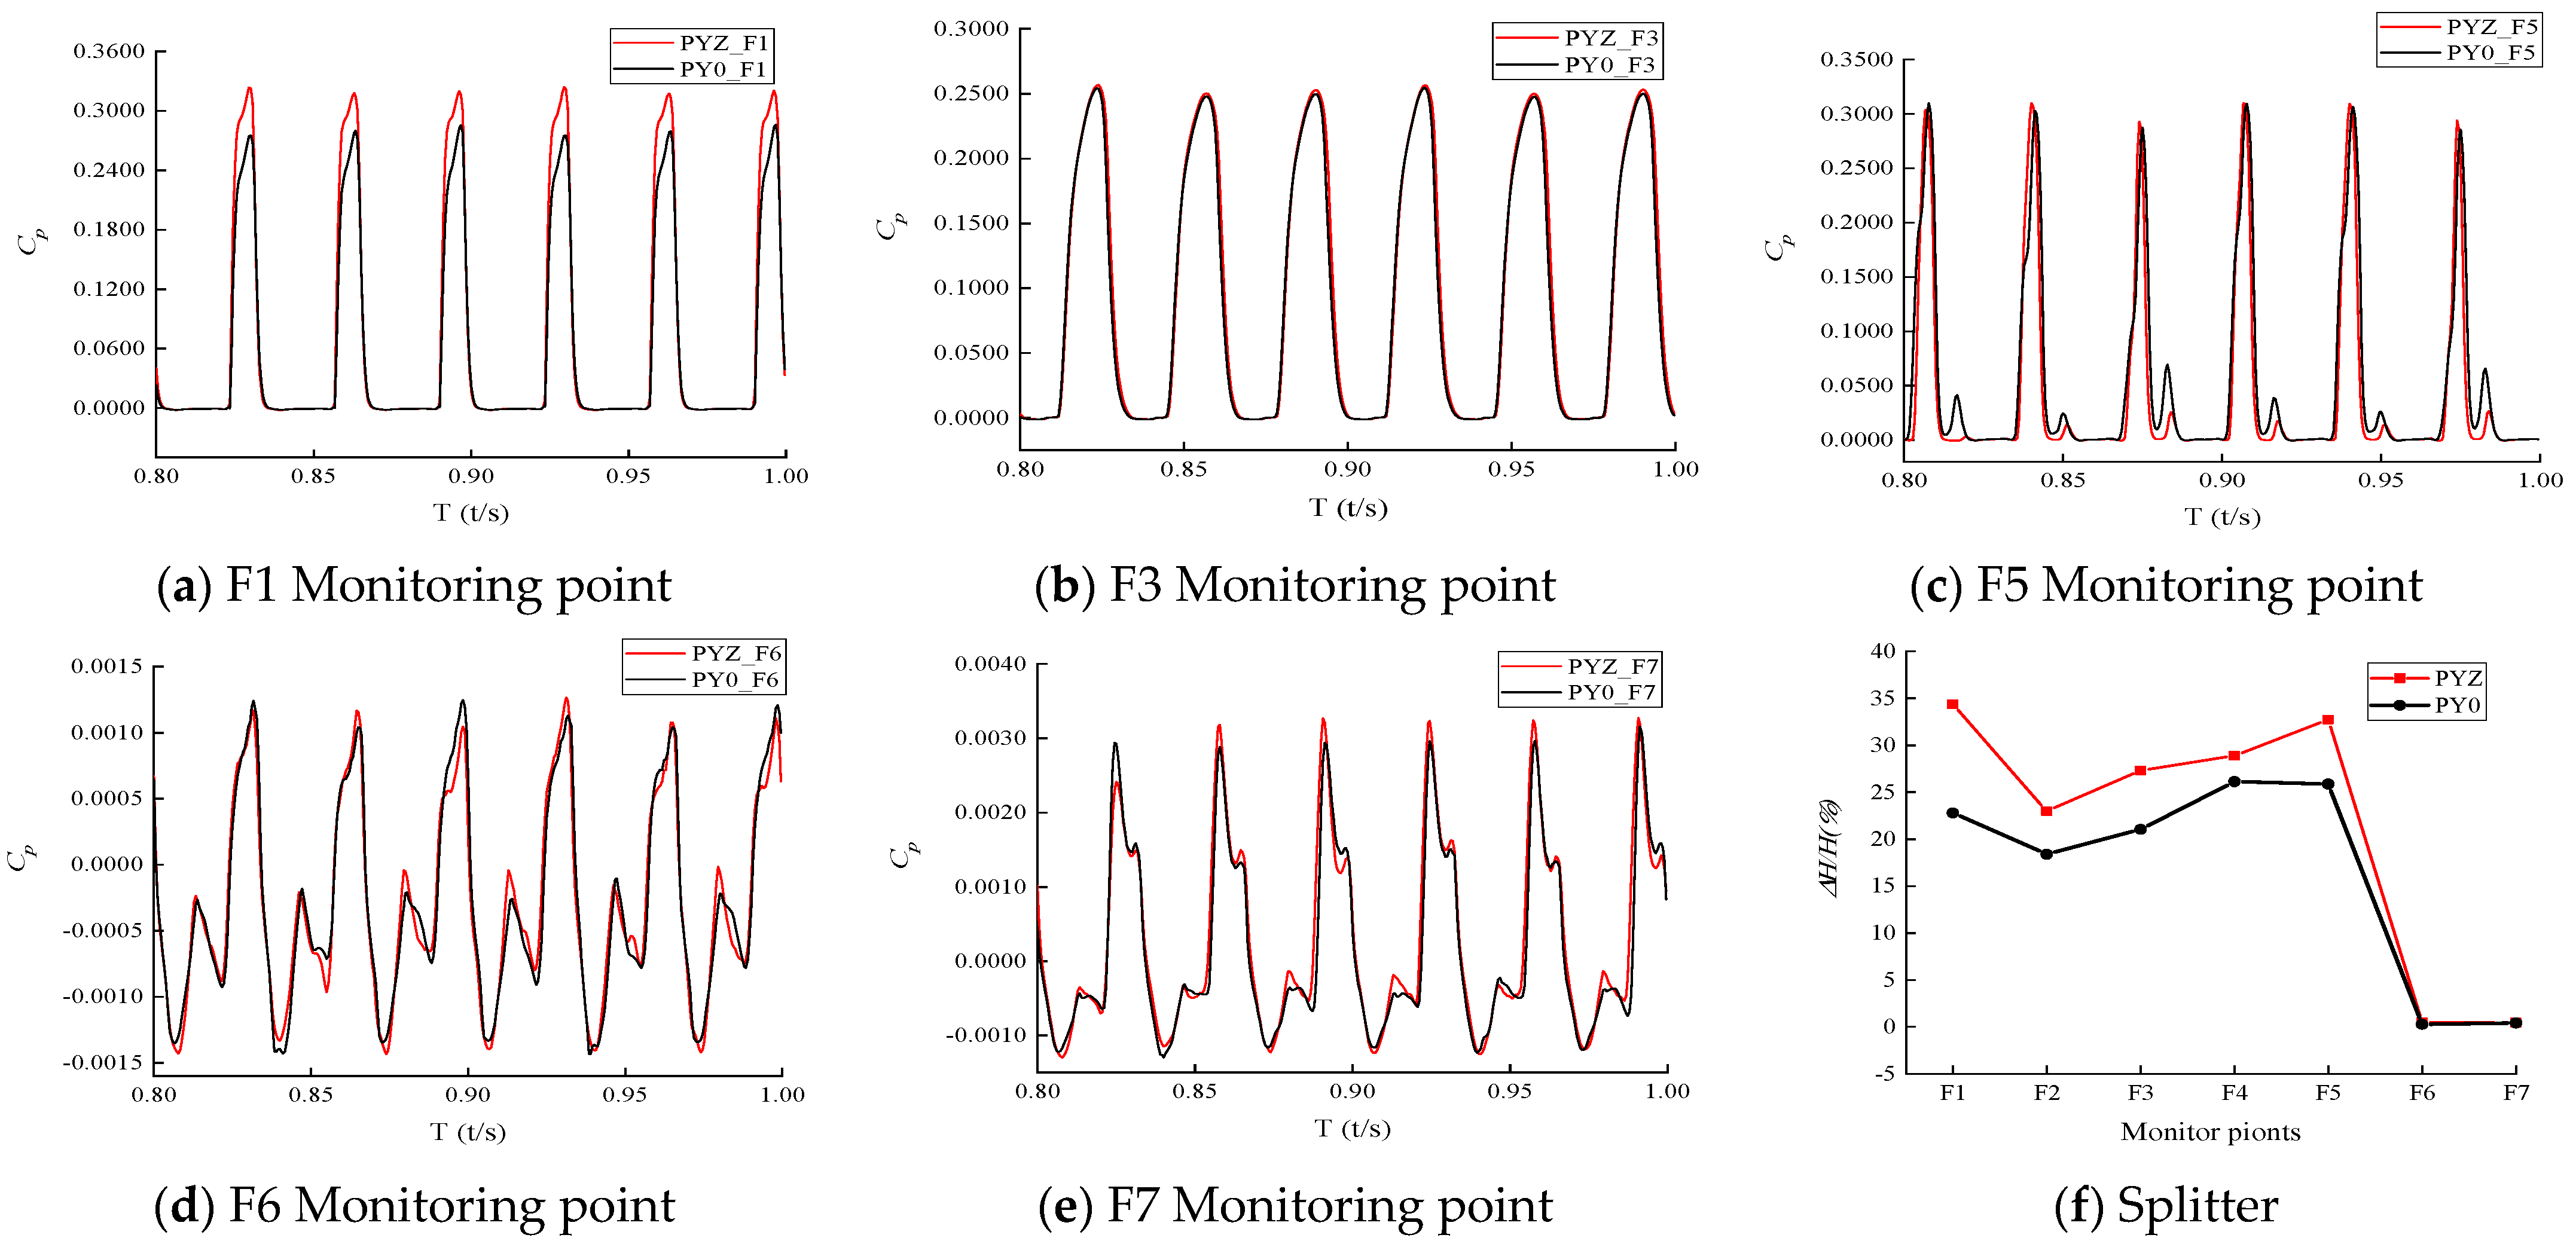
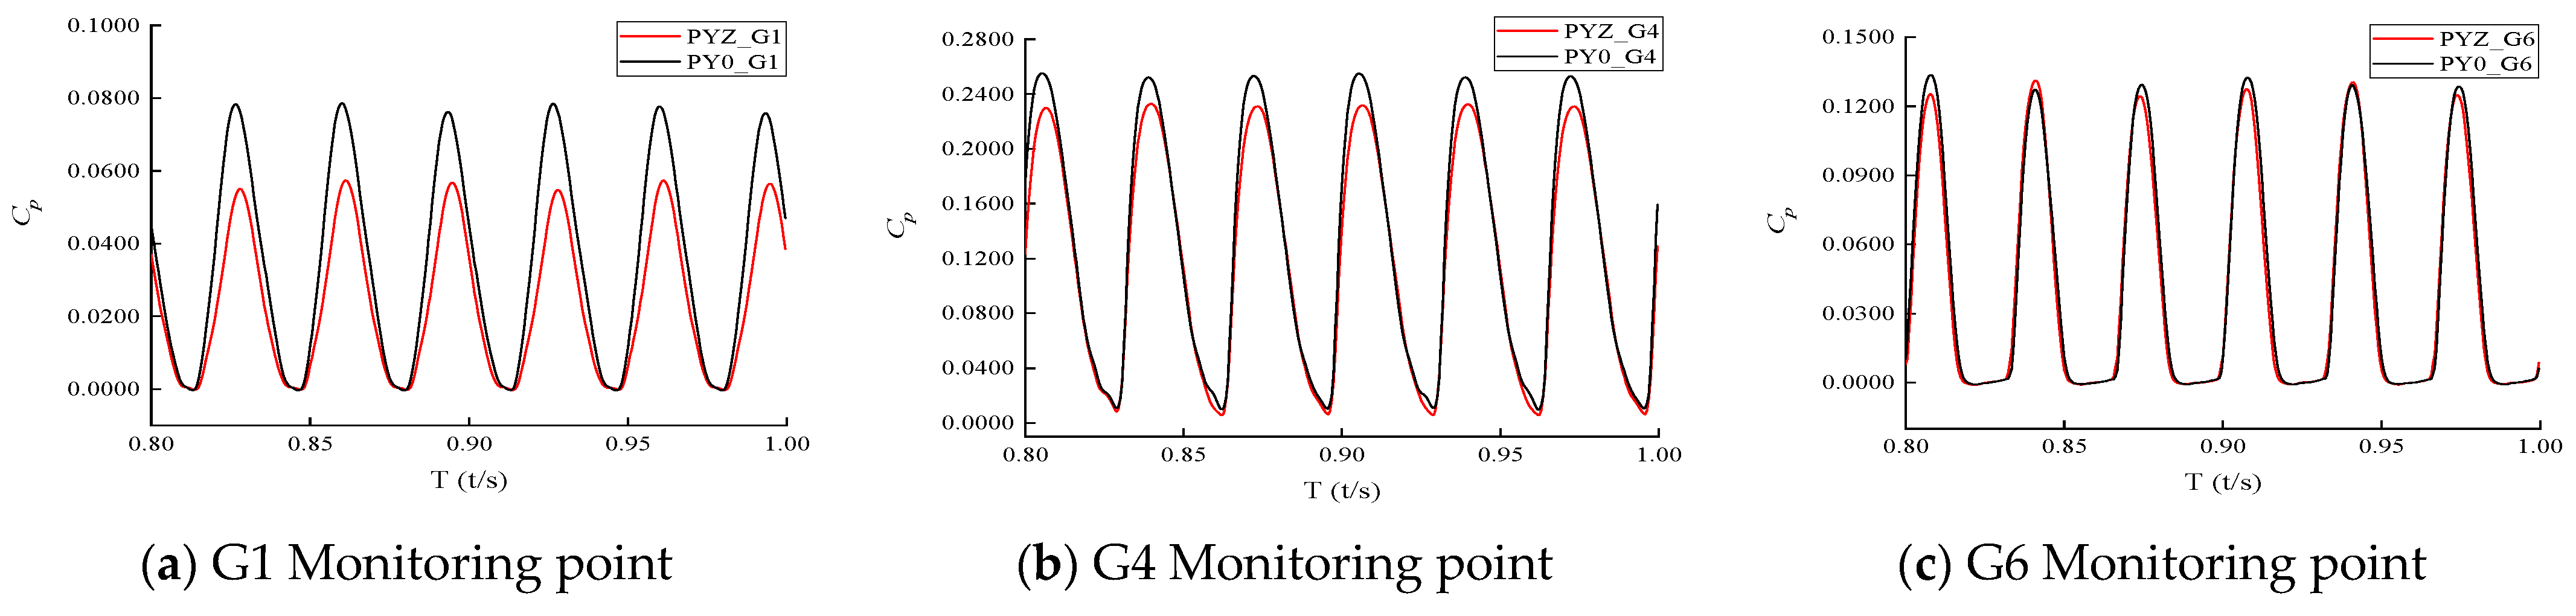
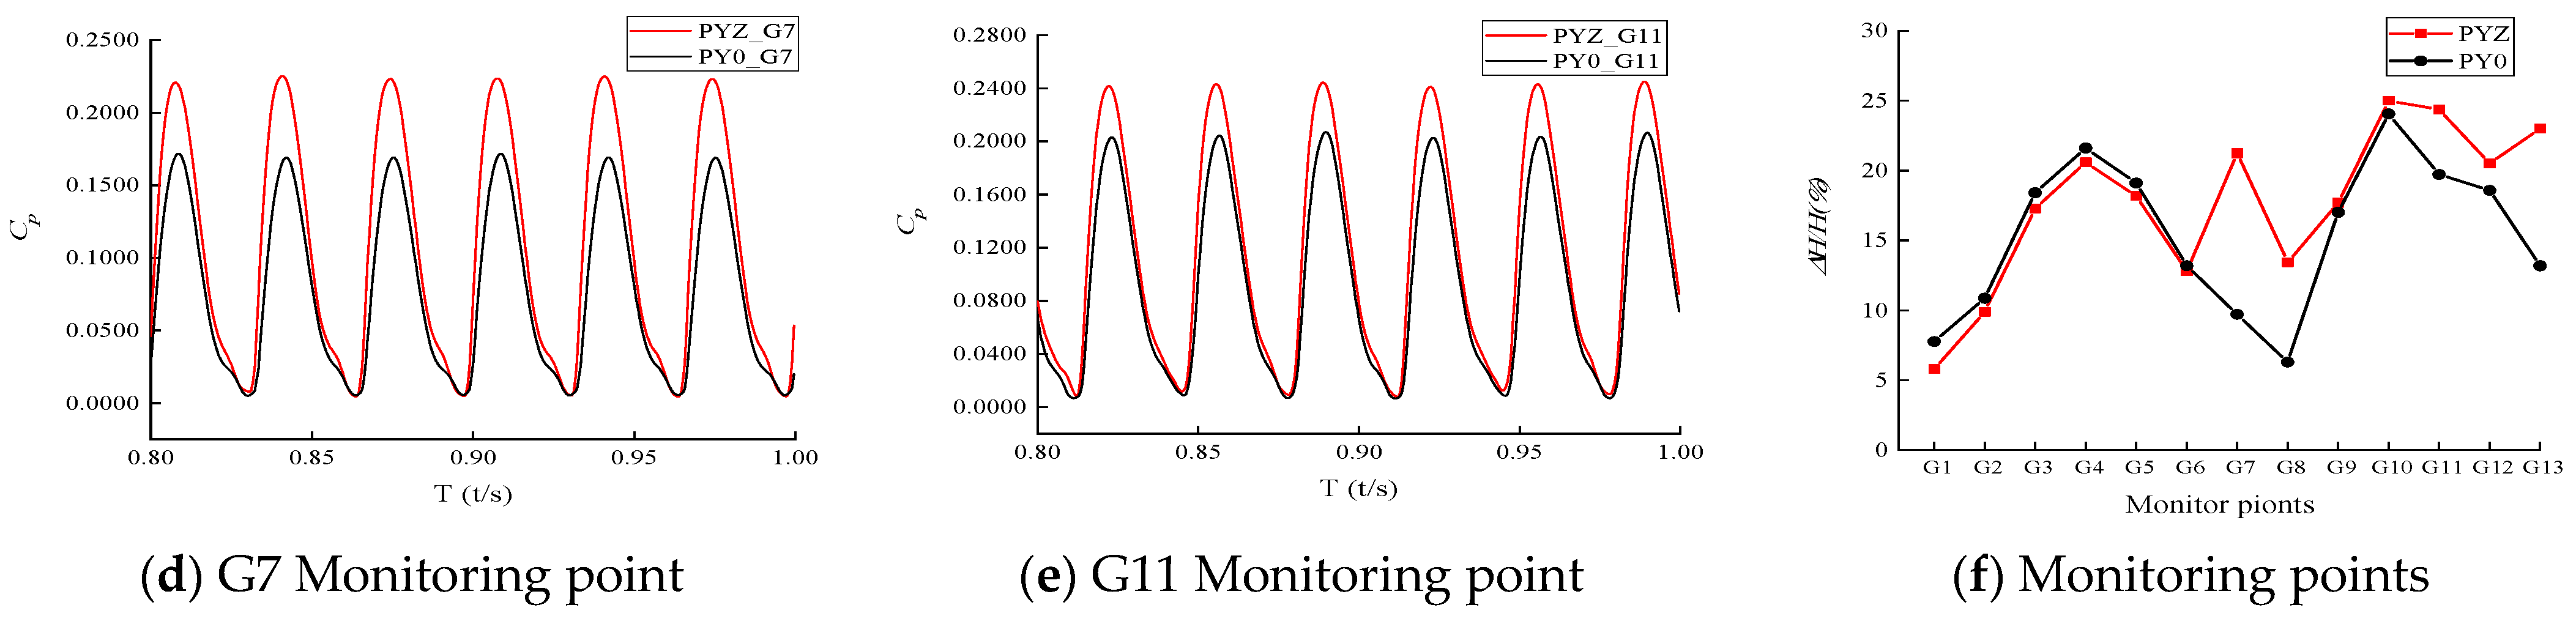
4.3.2. Effect of Axial Deviation on the Pressure Pulsation of the Runner

The pressure coefficients and the relative amplitudes of pressure pulsation at some monitoring points on the splitter of the bucket leading face under the axial deviation are shown in Figure 14. The results in Figure 14 and Table 4 show that the pressure pulsation coefficient in the bucket after the jet deviation is larger than that in the case without deviation, and the pressure coefficient in the area where the jet hits the center of the bucket also increases because the jet is axially deviated. The pressure pulsation of the splitter is reducing from the tip of the splitter to the root of the bucket and reaches the minimum at the root. Therefore, the axial deviation of the jet will make the mechanical parts at the tip of the splitter and at the center of the bucket more susceptible to fatigue damage from jet striking.
The pressure coefficients and the relative amplitudes of pressure pulsation at some monitoring points in the bucket leading face under the axial deviation are shown in Figure 15. The results in Figure 15 and Table 4 show that on the leading face, the pressure pulsation coefficient reaches to 0.25 at the location near the outlet edge of the splitter and the center of the bucket where the jet strikes the bucket, indicating that the axial deviation of the jet has a greater impact on the pressure pulsation in this area. The relative amplitude of pressure pulsations is larger than that without deviation. The closer to the trailing edge of the bucket, the larger the relative amplitude of pressure pulsation caused by the axial deviation. After the axial deviation of the jet, the pressure pulsation in the half cup where the jet is deviated towards the bucket is larger than that in the other half and much larger than that without deviation.
The pressure coefficients and the relative magnitudes of pressure pulsation at the monitoring points on the back of the bucket under the axial deviation are shown in Figure 16. The results in Figure 16 and Table 4 show that the absolute values of the pressure pulsation amplitude and the pressure coefficient on the back of the bucket under the axial deviation are small, and they gradually decrease from the bucket inlet to the root of the splitter. The pressure coefficient under the axial deviation is consistent with that without deviation, indicating that the axial deviation of the jet has little effect on the stability of the back of the bucket. The pressure coefficients on the back of the bucket are mostly negative because it has a complex concave area, and when the jet starts to strike the bucket inlet, part of the cylindrical jet will strike the back of the bucket. Due to the fast rotation speed of the bucket, a cavity will be quickly formed between the concave area on the back of the bucket and the cylindrical jet, which leads to the pressure reduction in the cavity and the formation of a negative pressure area. The positive pressure area at the monitoring point B1 on the back of the bucket is generated by the continuous striking of the cylindrical jet on the back of the bucket. The changes in the relative amplitude of pressure pulsation show that the axial deviation of the jet increases the amplitude of pressure pulsation at the back of the bucket and intensifies the pressure pulsation of the turbine, which increases the risk of turbine lifting.
The results also show that the pressure coefficients are positive at most monitoring points on the leading face and the splitter and negative on the back. The difference between the pressure coefficients at most monitoring points does not exceed 20%. The difference in the relative amplitudes of pressure pulsation is large, and the axial deviation of the jet significantly increases the relative amplitude of the pressure pulsation. Compared with the condition without deviation, the relative amplitude of pressure pulsation is increased by 14.7% at monitoring points G7 and G11 and by 74.6% at monitoring point G13. When the jet is axially deviated, the cylindrical jet is deviated towards the right cup as shown in Figure 11, and the cylindrical jet is not equally divided by the splitter, resulting in a higher relative amplitude of pressure pulsation and more intense pressure pulsation in the right cup. As affected by the reduced flow, the relative amplitude of the pressure pulsation on the left cup is reduced. The uneven pressure distribution between the left and right cups will lead to an uneven force on the bucket, increasing the oscillation of the runner in the axial direction, causing vibration of the turbine and leading to fatigue damage of the bucket.

5. Conclusions

The VOF multiphase flow model, the SST k-ω turbulence model and the SIMPLEC algorithm are used to calculate the internal flow and analyze the influence on turbine stability and efficiency of the phenomenon of jet deviation from the centerline in the Pelton turbine in Jiniu Hydropower Station. The influence of the jet deviation on the stability and efficiency of the turbine is analyzed through comparing the flow characteristics, the force conditions, the relative amplitude of pressure pulsation and the time domain characteristics of the pressure pulsation. The following results are obtained:
(1)
A negative area will be formed on the area near the trailing edge of the bucket after the jet deviation, and the phenomena of “back interference” and “jet interference” appear at the same time, which are the main factors causing the decrease in turbine efficiency. The jet deviation affects the flow pattern inside the bucket, which affects the formation of water film and the diffusion rate on the surface of the bucket.
(2)
The jet deviation will affect the time of the jet entering the bucket. In the case of radial deviation, the axial force increases by about 2 times and the tangential force decreases by 0.25%. In the case of axial deviation, the axial force of the runner increases 4 times and the tangential force decreases by 0.4%. Since the tangential force is related to the runner torque and directly affects the output of the turbine, the test results show that the occurrences of the radial and axial deviations reduce the turbine efficiency by 0.3% and 0.4%, respectively. This indicates that the effect of axial offset on runner operation is greater than the effect of radial offset on it.
(3)
The relative amplitude of pressure pulsation after radial deviation shows an increasing trend compared with that without deviation, the relative amplitudes of pressure pulsation at some monitoring points increase by 60%, and the maximum relative amplitude of pressure pulsation appears in the center of the bucket, which is closely related to the striking effect of the jet. The relative amplitude of pressure pulsation in the case of jet deviation towards the outer edge of the runner increases more than that in the case of deviation towards the runner center, indicating that the pressure pulsation of the turbine will be more intense when the jet is deviated to the outer edge of the runner.
(4)
The axial deviation of the jet causes an uneven pressure distribution on both sides of the splitter and an uneven force on the bucket, the relative amplitude of pressure pulsation of the turbine increases significantly, the axial force and axial oscillation of the runner increase, and the bucket is susceptible to vibration and fatigue damage.

Author Contributions

H.D., X.L., Z.Y. and Y.Z. (Yongzhong Zeng) proposed the simulation method. H.D., Y.H., Y.Z. (Yijin Zhou) and B.Q. completed the numerical simulations. H.D., J.P., X.L. and K.S. analyzed the data and wrote the paper. J.P. and X.L. revised and reviewed the paper. K.S., F.D. and T.L. provided some data support for the study. All authors have read and agreed to the published version of the manuscript.

Funding

This research is supported by the National Key Research and Development Program of China (approval No. 2018YFB0905200), and the Hydropower Energy Innovation Capacity Construction Project in Sichuan Province, China (approval No. 2022-510124-04-01-622476).

Data Availability Statement

Not applicable.

Conflicts of Interest

The authors declare no conflict of interest.

References

  1. Avellan, F.; Dupont, P.; Kvicinsky, S.; Chapuis, L.; Parkinson, E.; Vullioud, G. Flow Calculations in Pelton Turbines—Part 2: Free Surface Flows. In Proceedings of the 19th IAHR Symposium on Hydraulic Machinery and Cavitation, Singapore, 9–11 September 1998. [Google Scholar]
  2. Vessaz, C. Finite Particle Flow Simulation of Free Jet Deviation by Rotating Pelton Buckets. Ph.D. Thesis, EPFL, Lausanne, Switzerland, 2015. [Google Scholar]
  3. Kvicinsky, S.; Kueny, J.L.; Avellan, F.; Parkinson, E. Experimental and Numerical Analysis of Free Surface Flows in a Rotating Bucket. In Proceedings of the 21st IAHR Symposium on Hydraulic Machinery and Systems, Lausanne, Switzerland, 9–12 September 2002. [Google Scholar]
  4. You, J.; Lai, X.; Zhou, W.; Cheng, Y. 3D CFD simulation of the runaway process of a Pelton turbine. Proc. Inst. Mech. Eng. Part A J. Power Energy 2016, 230, 234–244. [Google Scholar] [CrossRef]
  5. Santolin, A.; Cavazzini, G.; Ardizzon, G.; Pavesi, G. Numerical investigation of the interaction between jet and bucket in a Pelton turbine. Proc. Inst. Mech. Eng. Part A J. Power Energy 2009, 223, 721–728. [Google Scholar] [CrossRef]
  6. Panagiotopoulos, A.; Židonis, A.; Aggidis, G.A.; Anagnostopoulos, J.S.; Papantonis, D.E. Flow modeling in Pelton turbines by an accurate Eulerian and a fast Lagrangian evaluation method. Int. J. Rotating Mach. 2015, 2015, 255–267. [Google Scholar] [CrossRef]
  7. Xiao, Y.X.; Cui, T.; Wang, Z.W.; Yan, Z.G. Numerical simulation of unsteady free surface flow and dynamic performance for a Pelton turbine. IOP Conf. Ser. Earth Environ. Sci. 2012, 15, 052033. [Google Scholar] [CrossRef]
  8. Perrig, A.; Farhat, M.; Avellan, F.; Parkinson, E.; Garcin, H.; Bissel, C.; Valle, M.; Favre, J.M. Numerical Flow Analysis in a Pelton Turbine Bucket. In Proceedings of the 22nd IAHR Symposium on Hydraulic Machinery and Systems, Stockholm, Sweden, 29 June–2 July 2004. [Google Scholar]
  9. Perrig, A.; Avellan, F.; Kueny, J.-L.; Farhat, M.; Parkinson, E. Flow in a Pelton Turbine Bucket: Numerical and Experimental Investigations. ASME. J. Fluids Eng. 2006, 128, 350–358. [Google Scholar] [CrossRef]
  10. Perrig, A. Hydrodynamics of the Free Surface Flow in Pelton Turbine Buckets. Ph.D. Thesis, EPFL, Lausanne, Switzerland, 2007. [Google Scholar]
  11. Gupta, V.; Prasad, V.; Khare, R. Numerical simulation of six jet Pelton turbine model. Energy 2016, 104, 24–32. [Google Scholar] [CrossRef]
  12. Zoppé, B.; Pellone, C.; Maitre, T.; Leroy, P. Flow Analysis Inside a Pelton Turbine Bucket. J. Turbomach. 2006, 128, 500–511. [Google Scholar] [CrossRef]
  13. Zeng, C.; Xiao, Y.; Luo, Y.; Zhang, J.; Wang, Z.; Fan, H.; Ahn, S.-H. Hydraulic performance prediction of a prototype four-nozzle Pelton turbine by entire flow path simulation. Renew. Energy 2018, 125, 270–282. [Google Scholar] [CrossRef]
  14. Xiao, Y.; Wang, Z.; Zhang, J.; Zeng, C.; Yan, Z. Numerical and experimental analysis of the hydraulic performance of a prototype Pelton turbine. Proc. Inst. Mech. Eng. Part A J. Power Energy 2014, 228, 46–55. [Google Scholar] [CrossRef]
  15. Xiao, Y.X.; Zeng, C.J.; Zhang, J.; Yan, Z.G.; Wang, Z.W. Numerical Analysis of the Bucket Surface Roughness Effects in Pelton Turbine. In Proceedings of the 6th International Conference on Pumps and Fans with Compressors and Wind Turbines, Beijing, China, 19–22 September 2013. [Google Scholar]
  16. Zeng, C.J.; Xiao, Y.X.; Zhu, W.; Yao, Y.Y.; Wang, Z.W. Numerical Simulation of Cavitation Flow Characteristic on Pelton Turbine Bucket Surface. In Proceedings of the ISCM2014, Beijing, China, 18–21 October 2014. [Google Scholar]
  17. Mack, R.; Aschenbrenner, T.; Rohne, W.; Farhat, M. Validation of Bucket Flow Simulation using Dynamic Pressure Measurements. In Proceedings of the 22nd IAHR Symposium on Hydraulic Machinery and Systems, Stockholm, Sweden, 29 June–2 July 2004. [Google Scholar]
  18. Židonis, A.; Aggidis, G. Pelton turbine: Identifying the optimum number of buckets using CFD. J. Hydrodyn. Ser. B 2016, 28, 75–83. [Google Scholar] [CrossRef]
  19. Egusquiza, M.; Egusquiza, E.; Valentin, D.; Valero, C.; Presas, A. Failure investigation of a Pelton turbine runner. Eng. Fail. Anal. 2017, 81, 234–244. [Google Scholar] [CrossRef]
  20. Xiao, Y.; Zheng, A.; Han, F.; Ding, E.; Kubota, T. CFD method to study jet interference of multi-nozzle impact turbine. J. South China Univ. Technol. (Nat. Sci. Ed.) 2007, 35, 66–70. [Google Scholar]
  21. Chen, Z.; Liu, Y.; Yu, B.; Lei, H. Analysis of the causes of efficiency decline of impact hydraulic turbine and its improvement scheme. Hydroelectr. Power Gener. 2016, 42, 49–52. [Google Scholar]
  22. Han, F.; Kubota, J.; Liu, J. Numerical Simulation of Unsteady Flow on Pelton Buckets. J. Huazhong Univ. Technol. 2000, 11, 14–16. [Google Scholar]
  23. Jung, I.H.; Kim, Y.S.; Shin, D.H.; Chung, J.T.; Shin, Y. Influence of spear needle eccentricity on jet quality in micro Pelton turbine for power generation. Energy 2019, 175, 58–65. [Google Scholar] [CrossRef]
  24. Huang, J.; Ge, X.; Chu, D.; Zhang, J.; Xu, B.; Gao, F.; Zheng, Y. Research on the Effect of Needle Eccentricity on the Jet Flow Characteristics. Front. Energy Res. 2022, 10, 882747. [Google Scholar]
  25. Petley, S.; Panagiotopoulos, A.; Benzon, D.S.; Židonis, A.; Aggidis, G.A.; Anagnostopoulos, J.S.; Papantonis, D.E. Investigating the influence of the jet from three nozzle and spear design configurations on Pelton runner performance by numerical simulation. IOP Conf. Ser. Earth Environ. Sci. 2019, 240, 022004. [Google Scholar] [CrossRef]
  26. Hahn, F.J.J.; Semlitsch, B.; Bauer, C. On the numerical assessment of flow losses and secondary flows in Pelton turbine manifolds. IOP Conf. Ser. Earth Environ. Sci. 2022, 1079, 012082. [Google Scholar] [CrossRef]
  27. Jiang, Y. Numerical Simulation Study on Fluid-Solid Coupling of Impinging Hydraulic Turbine. Master’s Thesis, Wuhan University, Wuhan, China, 2017. [Google Scholar]
  28. Pang, J.; Liu, X.; Ren, M.; Zhang, P. Analysis of the causes of oil mist in the lower guide bearing of hydro generator set. Therm. Power Eng. 2021, 36, 13–19. [Google Scholar] [CrossRef]
  29. Zhang, Y. Technical Specifications for the Installation of Hydro-Generator Sets; Hubei Province, China Gezhouba Water Conservancy and Hydropower Engineering Group Co., Ltd.: Yichang, China, 2016. [Google Scholar]
Figure 1. Three-dimensional water diagram of the Pelton turbine computational domain.
Processes 11 01342 g001
Figure 2. Schematic diagram of jet centerline deviation.
Processes 11 01342 g002
Figure 3. Local meshing of the geometric model.
Processes 11 01342 g003
Figure 4. Definition of bucket rotation angle.
Processes 11 01342 g004
Figure 5. The jet states of adjacent Buc1, Buc2 and Buc3 and the water phase distribution under different deviation conditions and rotation angles.
Processes 11 01342 g005
Figure 6. Pressure distribution clouds on the surface of Buc2 under different deviation conditions and rotation angles.
Processes 11 01342 g006aProcesses 11 01342 g006b
Figure 7. Streamline and vector diagrams of the leading face of Buc2 under different deviation conditions and rotation angles.
Processes 11 01342 g007
Figure 8. Variation in forces with time in the z, r and τ directions under radial deviation.
Processes 11 01342 g008
Figure 9. Variations in forces with time in z, r and τ directions under axial deviation.
Processes 11 01342 g009
Figure 10. Location of monitoring points for pressure pulsation on the runner bucket.
Processes 11 01342 g010
Figure 11. Pressure coefficients and relative amplitudes of pressure pulsation on the splitter under radial deviation.
Processes 11 01342 g011aProcesses 11 01342 g011b
Figure 12. Pressure coefficients and relative amplitudes of pressure pulsation on the leading face under radial deviation.
Processes 11 01342 g012
Figure 13. Pressure coefficients and relative amplitudes of pressure pulsation on the back of the bucket under radial deviation.
Processes 11 01342 g013
Figure 14. Pressure coefficient and relative amplitude of pressure pulsation at the monitoring point of the partition edge section under axial deviation.
Processes 11 01342 g014
Figure 15. Pressure coefficients and relative amplitudes of pressure pulsation on the leading face under axial deviation.
Processes 11 01342 g015aProcesses 11 01342 g015b
Figure 16. Pressure coefficients and relative amplitudes of pressure pulsation on the back of the bucket under axial deviation.
Processes 11 01342 g016
Table 1. Comparison of different turbulence models.
Turbulence ModelComputational Efficiency (%)Rated Efficiency (%)Relative Error (%)
Standard k-ε81.6691.79−11.04
RNG k-ε88.9391.79−3.12
SST k-ω90.9891.79−0.88
Table 2. Basic design parameters of the turbine.
Name and UnitValueName and UnitValue
Number of nozzles6Rated speed nr (rpm)300
Jet diameter d (mm)258Rotor pitch circle diameter D1 (mm)2890
Rated flow Qr (m3/s)30.14Maximum width of bucket B (mm)890.4
Rated head Hr (m)457Maximum width inside the bucket W (mm)835
Rated output Pr (MW)123Number of buckets21
Table 3. Grid-independent verification.
SchemeNumber of GridsCalculated Efficiency (%)Rated Efficiency (%)Relative (%)
7,860,00082.6791.79−9.94
10,210,00089.7691.79−2.21
12,120,00091.3391.79−0.50
14,030,00091.5991.79−0.22
Table 4. Calculated forces on the runner and measured turbine oscillation and efficiency.
Operating ConditionsDirectionCalculated Maximum Value (N)Measured ValueEarly Warning Value
PY0z2003Vibration 5 μm30 μm
r4954Oscillation 352 μm400 μm
τ−2,912,600Efficiency 91.79%
PY−z5588Vibration 14 μm30 μm
r3457Oscillation 273 μm400 μm
τ−2,903,990Efficiency 91.46%
PY+z6555Vibration 17 μm30 μm
r4331Oscillation 328 μm400 μm
τ−2,906,220Efficiency 91.52%
PYZz−11,057Vibration 28 μm30 μm
r3705Oscillation 287 μm400 μm
τ−2,901,000Efficiency 91.37%
Table 5. Pressure coefficients and relative amplitudes of pressure pulsations at monitoring points.
ParametersConditionG1G2G3G4G5G6G7G8G9G10G11G12
Average CpPY00.03360.06960.10250.11970.08140.0420.01430.03520.03610.1170.01410.1023
PY−0.04250.07740.10650.12480.09710.04740.08070.0426
PY+0.07510.08310.10890.12810.10110.05270.08490.0466
PYZ0.02260.07210.10260.11840.08890.04020.10490.06330.09110.13240.11720.116
ΔH/H
(%)
PY07.7710.8718.4121.6119.1113.199.716.317.0124.0519.7218.58
PY−9.6712.0819.0623.5521.4715.0214.817.29
PY+14.1613.6519.2824.0422.5316.715.477.76
PYZ5.809.8919.2823.5921.1814.2221.2414.1217.6925.1924.3620.52
ParametersConditionG13F1F2F3F4F5F6F7B1B2B3
Average CpPY00.08110.03690.04130.05600.11810.0322−0.00030.0002−0.0171−0.0043−0.0004
PY− 0.04580.04560.09420.12080.0413−0.00050.0004−0.0226−0.0061−0.0005
PY+ 0.04690.04730.09870.12310.0444−0.00060.0005−0.0256−0.0067−0.0006
PYZ0.10120.07000.04930.09580.11470.0448−0.00020.0004−0.0412−0.0084−0.0005
ΔH/H
(%)
PY013.1822.7818.3821.0426.1225.870.270.4121.589.030.26
PY− 24.6319.7223.9128.629.450.450.5424.9312.580.37
PY+ 24.8320.0425.929.529.950.670.725.6213.250.57
PYZ23.0134.3622.9827.3028.8932.720.490.4436.9920.930.59
Disclaimer/Publisher’s Note: The statements, opinions and data contained in all publications are solely those of the individual author(s) and contributor(s) and not of MDPI and/or the editor(s). MDPI and/or the editor(s) disclaim responsibility for any injury to people or property resulting from any ideas, methods, instructions or products referred to in the content.

