Image Spherizing-Based Three-Dimensional Displacement Measurement Technique for Microscope with Single Camera
by
Ran Zhao
1,2, 
Xuan Li
3,
Ping Sun
4,
Yuxin Tang
4,
Peng Jiao
1,
Yonggang Huang
1 and
Jinsheng Jia
1,2,* 1
State Key Laboratory of Green Building Materials, China Building Materials Academy, Beijing 100024, China
2
Beijing Key Laboratory of Solar Energy and Building Energy-Saving Glass Materials Processing Technology, China Building Materials Academy, Beijing 100024, China
3
China Testing and Certification International Group Co., Ltd., Beijing 100024, China
4
Shandong Provincial Key Laboratory of Optics and Photonic Device, Shandong Normal University, Jinan 250358, China
*
Author to whom correspondence should be addressed.
Photonics 2022, 9(3), 148; https://doi.org/10.3390/photonics9030148
Submission received: 12 February 2022
/
Revised: 26 February 2022
/
Accepted: 28 February 2022
/
Published: 3 March 2022
Abstract
:The detection of three-dimensional displacement, caused by micro-nano scale deformation, is of great significance for the industrial production of glass or quartz optical fiber products. Considering the detection cost and practicability, an image spherizing-based three-dimensional displacement measurement method for a monocular microscopic imaging system (a microscope with a normal industrial camera) is proposed. Differential theory tells us that an arbitrary large-scale deformation can be approximatively considered as the sum of slope-shaped deformations. In this paper, an ordinary slope model is presented by the idea of image spherizing and differential theory, which reveals the mathematical relation between in-plane displacement and out-of-plane displacement in the deformed images captured by an optical microscope. After obtaining the in-plane displacement field, the out-of-plane displacement field can be extracted from the in-plane displacement field by the ordinary slope model, which indicates that the out-of-plane displacement information carried by the in-plane displacement is fully utilized. Simulation and application experiments are performed to demonstrate the effectiveness and all the absolute errors of the measurement by optical microscope with a magnification of 50× are less than 0.2 μm. Unlike conventional methods, the new method does not need a phase unwrapping process during detection and has many attractive characteristics such as low-cost, simple arrangements and good applicability. Because the measurement precision of this technique can meet the detection requirement, it has been applied to the industrial detection of glass or quartz optical fiber products.
1. Introduction
For glass or quartz optical fiber products, such as a fiber image inverter and micro-channel plate, micro-nano-scale deformation will seriously affect their key performances and bring a potential risk of security [1,2]. Therefore, deformation detection of these materials is always an important research topic in industrial production, and the key to detection is the three-dimensional (i.e., in-plane and out-of-plane) displacement measurement. For instance, the in-plane displacement generated during deformation carries a lot of information related to the physical properties of materials, which can characterize the parameters such as uniformity and density. It is of great significance for the evaluation of material properties; the out-of-plane displacement is directly related to the surface shape, which is the focus of many researchers and users. Hence, enterprises and research institutes have to invest a lot of time and money for the three-dimensional displacement measurement of material [3,4], whereas microscopic observation is the major detection technique.
Currently, microscopic fringe projection profilometry [5,6], digital holographic microscopy [7,8], white light interference microscopy [9,10] and three-dimensional digital image correlation (3D-DIC) [11,12] are the main three-dimensional displacement measurement techniques for a microscopic imaging system. Nevertheless, the experimental arrangements of microscopic fringe projection profilometry and digital holographic microscopy are too complicated and expensive to realize batch inspection. Further, the inevitable phase unwrapping process of these methods will cause more errors and increase computation time during the detection. Although the experimental arrangement of white light interference microscopy is simple, it will take several minutes to capture multiple images, which cannot satisfy the requirement of rapid industrial measurement. Digital image correlation (DIC) is a mature and robust in-plane displacement measurement technique [13]. With the development of research in recent years, many 3D-DIC methods have been proposed by researchers and have been applied in the real-time dynamic measurement field. However, these methods always need a 3CCD camera (a camera with three chips) or two cameras to complete detection [12]. The inevitable disturbance and oscillation in an industrial environment will increase the detection error of the binocular or beam splitting technique. On the other hand, since the monocular microscopic imaging system (i.e., an optical microscope with a normal industrial camera) is the most popular device in the industrial production of glass or quartz optical fiber products, considering the practicability and cost, researchers in enterprise are more interested in the monocular microscopy technique for three-dimensional displacement measurement. To meet these requirements, Jia et.al. presented correlation-based and optical-flow-based algorithms to extract the out-of-plane displacement from the images taken by the optical microscope and they obtained good experimental results [3,4]. However, since the models used in these methods are the simplest slope model, they need several minutes or even an hour to complete the direction calibration and image processing before measurement. Although these schemes simplified the optical arrangement, they cannot realize rapid three-dimensional displacement measurement and the detection efficiency still needs to be improved in practical application.
Image spherizing algorithm is a machine vision technique put forward by Zhao et.al. [14]. By using this algorithm, the research group has successfully explained the image twisting phenomenon of the microchannel plate (MCP) in 2019. Because the image spherizing algorithm can simulate the reflection pattern of a deformed object, it offers a novel approach for microscopic three-dimensional displacement detection. In this paper, an image spherizing-based three-dimensional displacement measurement technique for a monocular microscopic imaging system is proposed. First of all, an ordinary slope model is proposed by the idea of image spherizing and differential theory, which reveals the mathematical relation between in-plane displacement and out-of-plane displacement in the deformed images captured by an optical microscope. Subsequently, the images of the sample before and after deformation are captured by the microscopic imaging system, and the in-plane displacement field between the images is estimated. Finally, the out-of-plane displacement field can be extracted from the in-plane displacement field by the ordinary slope model, which indicates that the out-of-plane displacement information carried by the in-plane displacement is fully utilized. It can be seen from the whole process that the key to achieve three-dimensional displacement extraction is the in-plane displacement estimation. Because DIC method [13] and optical flow (OF) method [15] are mature and robust in-plane displacement measurement techniques, in order to ensure the accuracy of three-dimensional displacement measurement, we utilize these two methods to estimate in-plane displacement in computer simulation experiments and application experiments, respectively. The absolute errors of out-of-plane displacement measurement results in all experiments are smaller than 0.2 μm, which proves the effectiveness of the new method. It is noteworthy that this is a microscopic three-dimensional displacement measurement method without phase unwrapping or beam splitting. Only one industrial camera and two images are required to complete a measurement, which is appropriate for industrial detection of glass or quartz optical fiber products.
2. Principle
2.1. Image Spherizing Algorithm and Differential Theory
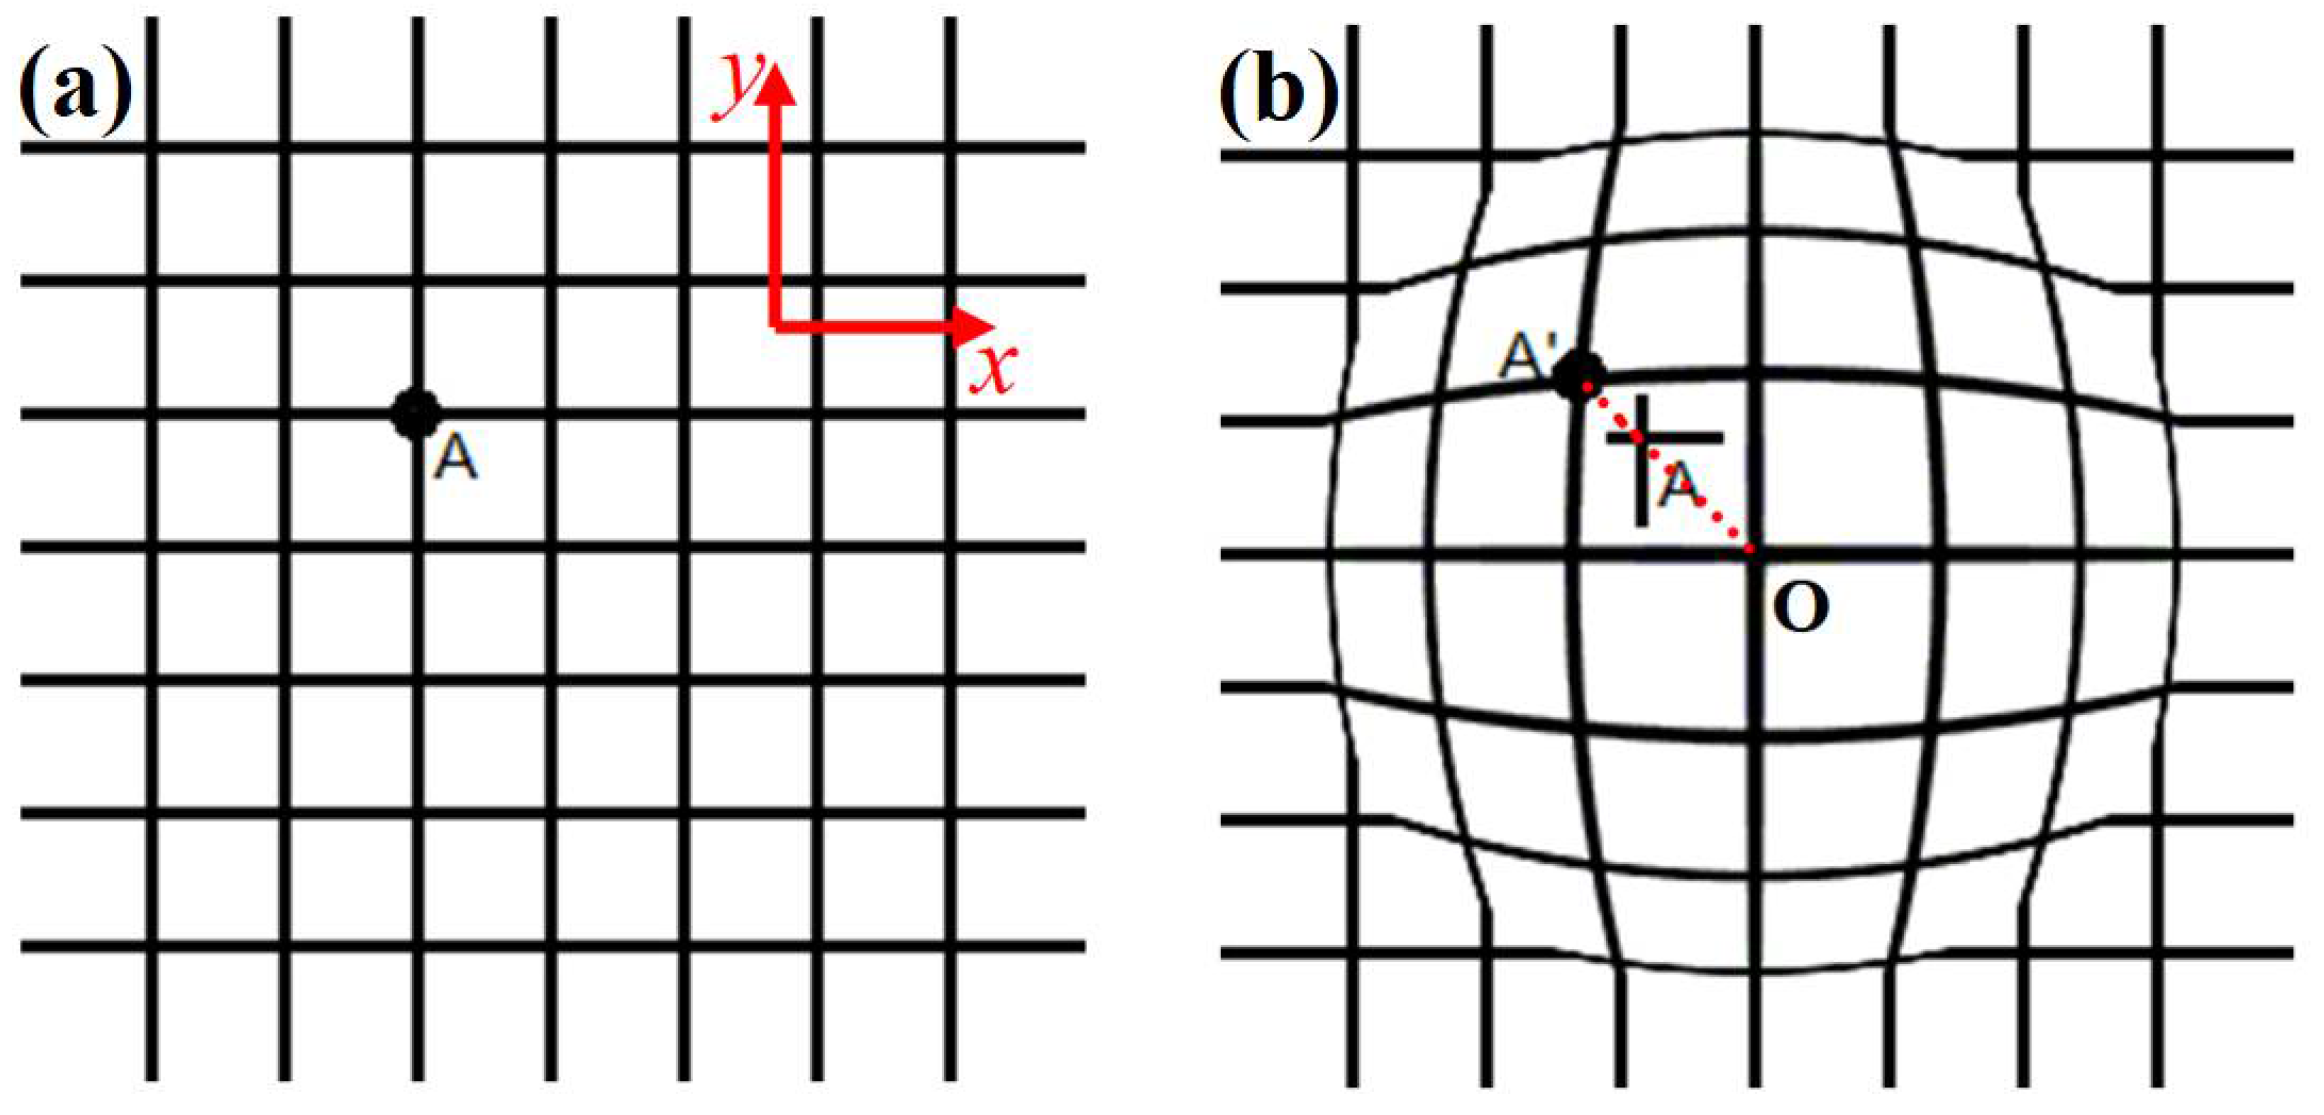
The definition of image spherizing can be expressed as the expansion or contraction movement of a two-dimensional pattern in x-y plane along normal line direction (i.e., z axis) [14]. In general, if a grid pattern is projected onto a spherical object, the reflected pattern can be considered as the spherized image, as shown in Figure 1a,b. It can be seen from these pictures that point A, an arbitrary point in the initial image, will move to A’ after spherizing. Note that point A moves along the line connect A, A’ and the center of the hemisphere, which indicates that the movements of all points under the hemisphere are two-dimensional motion in the x-y plane. Interestingly, although this is in-plane motion, it carries the information of out-of-plane movement, which reminds us that the parameters of three-dimensional motion can be extracted from these two-dimensional pictures. More details of the image spherizing algorithm can be found in Ref. [14].
According to differential theory, an arbitrary curve can be divided into an infinite straight line segment, thereby we can deduce that an arbitrary sphere or hemisphere can be divided into infinite small wedges, as illustrated in Figure 2. In analogy to this conclusion, since optical microscope shows only a small region of the object surface, the deformation in this region can be considered as part of slope-shaped deformation. In other words, an arbitrary large-scale deformation can be approximatively considered as the sum of slope-shaped deformations.
2.2. The Simplest Slope Model
The simplest slope model that reveals the mathematical relation between in-plane displacement and out-of-plane displacement is shown in Figure 3a, where the adjacent of the slope is the projection of the hypotenuse of the slope in the x-y plane and parallel to the x axis. For convenience of analysis, Figure 3b displays the cross-sectional view of the simplest slope model in the x-z plane after coordinate axis translation (i.e., point O becomes the origin of x-y-z coordinate system), where is the width of the image, θ is the angle between the slope and x-y plane. Once the object is deformed, point A will move to point A1, whereas the observer will see that point A moves to point A’ due to the downward viewing direction. Therefore, AA’ and A1A’ (i.e., d and w) can be treated as the resultant in-plane displacement and the out-of-plane displacement for this deformation. As mentioned earlier, the in-plane displacement can be estimated by the DIC method and OF method when the images before and after deformation are captured by the monocular microscopic imaging system. According to the mathematical relation shown in Figure 3b, it can be found that:
where R is a constant. Hence, the angle of the slope θ and the out-of-plane displacement w can be calculated by Equations (2) and (3), respectively. Note that the out-of-plane displacement w is extracted from the in-plane displacement d, which indicates that only two continuous images are required to complete the measurement.
2.3. The Ordinary Slope Model
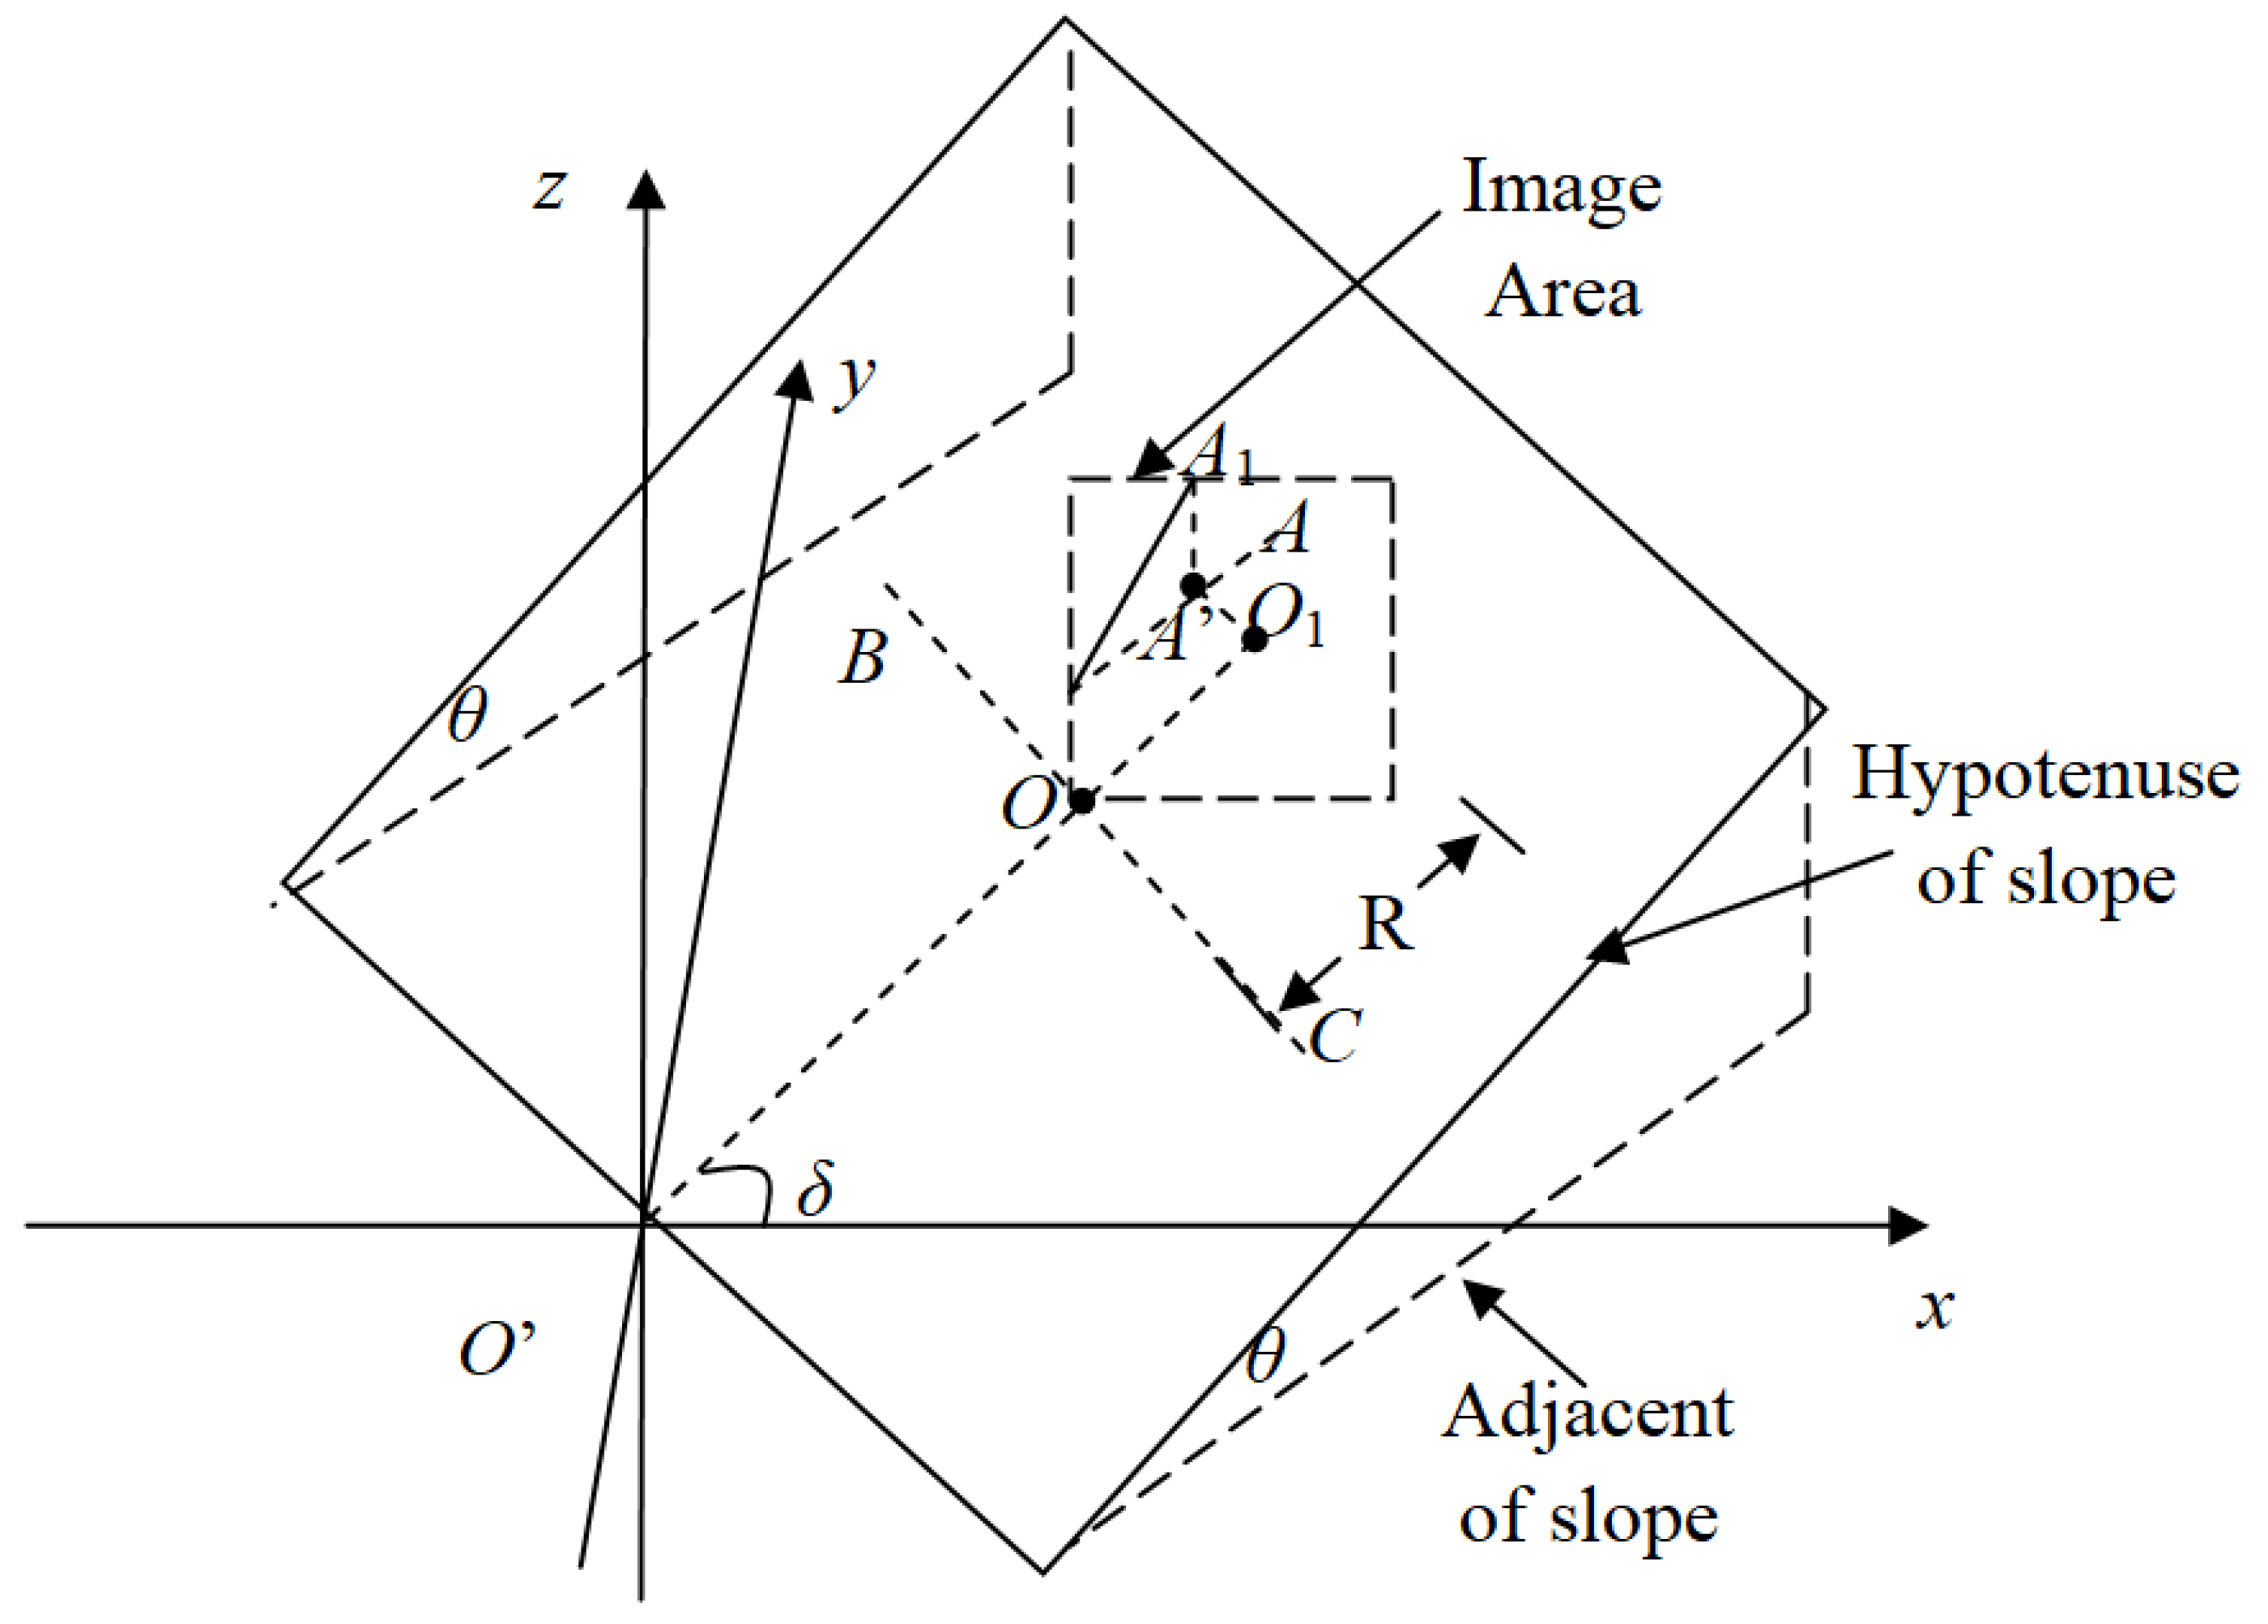
It is worth mentioning that the adjacent of the slope is parallel to the x axis in Figure 3a, i.e., point A, point A’ and origin point O lie on the x axis after the coordinate axis translation. However, for an arbitrary point A in the ordinary slope model, line AA’ is not parallel to the x axis, as shown in Figure 4, where O(0,0) is the origin of the image area, O1(xo,yo) is a point in the x-y plane and is parallel to . δ is the angle between and the x axis in the x-y plane, and are perpendicular to . In this case, for all the points in the image area, the width of image R is not constant and it is easy to see from Figure 4 that the variable R(xi,yi) for an arbitrary point A’ (xi,yi) is equal to the distance from point A’ to , i.e., the length of . Define k = tan δ is the gradient of , then the line equation of can be expressed as y = kx and the gradients of and are . Hence, the line equation of can be expressed as . It is important to point out that the rotation angle can be estimated by DIC method or OF method in advance, where u(xi,yi) and v(xi,yi) are the in-plane displacement components in x and y directions, respectively. According to Equation (4)
the solution of the coordinates of point O1 is , . Subsequently, the expression of variable R(xi,yi) is given as:
Finally, the out-of-plane displacement w can be obtained based on Equations (2) and (3).
In conclusion, the process of the image spherizing-based three-dimensional displacement measurement can be expressed as follows:
- Take the images before and after deformation by the monocular microscopic imaging system.
- Estimate the in-plane displacement fields u(xi,yi) and v(xi,yi) between two images by DIC method or OF method.
- Calculate the rotation angle .
- Calculate the R(xi,yi) for all the points in images based on Equations (4) and (5).
- According to Equations (2) and (3), calculate the out-of-plane displacement field w.
3. Simulation Results and Analysis
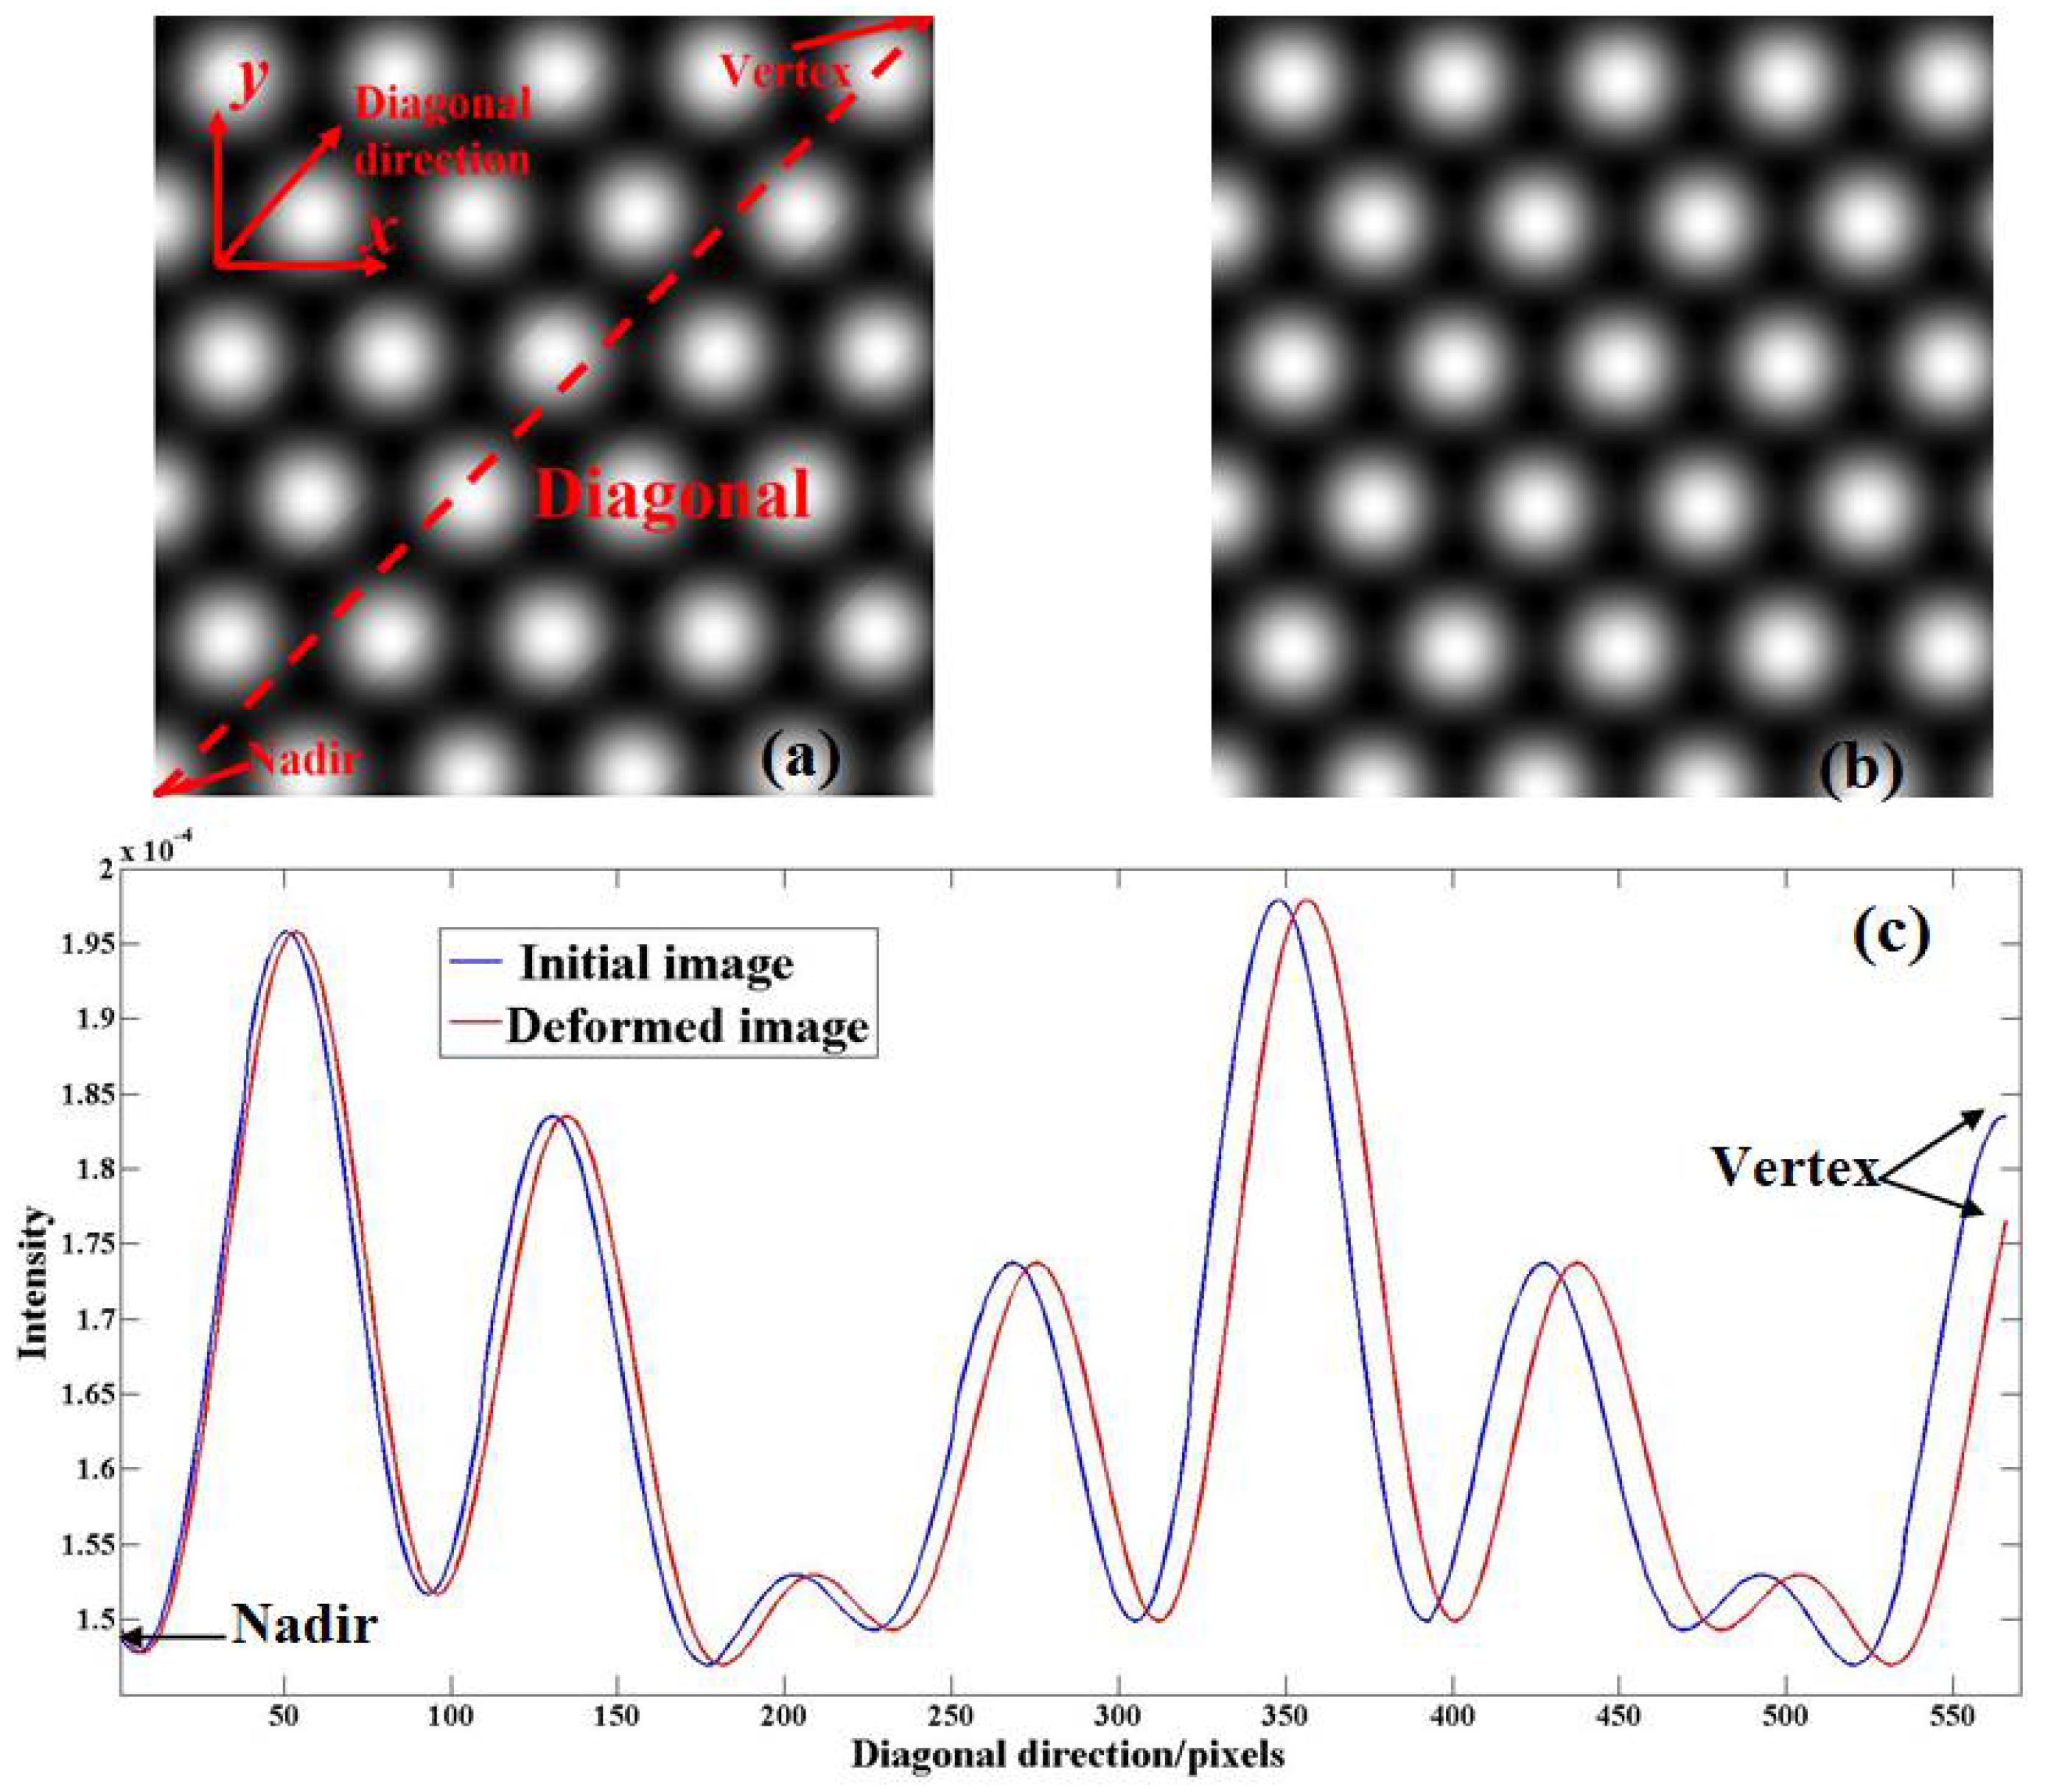
In general, the images of glass or quartz optical fiber products viewed by optical microscope can be treated as a Gaussian function array [3,16]. Two computer-generated Gaussian array images are illustrated in Figure 5a,b to simulate the initial and deformed images, where the deformation is added by image spherizing algorithm (slope angle θ = 0.2 rad ≈ 11.46°, rotation angle δ = 45°). It should be emphasized that the adjacent of the slope is parallel to the diagonal lines of Figure 5a,b since the angle between and the x axis is 45°. For this reason, all the points in Figure 5a will move along the diagonal direction after deformation and the nadir and the vertex of the diagonal line should be the positions with the minimum and maximum resultant in-plane displacement, respectively. The sizes of Figure 5a,b are 400 pixels × 400 pixels and the thickness ratio of core-cladding glass is set as 5:1. Figure 5c displays the intensity distributions of Figure 5a,b along the diagonal direction. In accord with the ordinary slope model, we can see from Figure 5c that there is an intensity shift along the diagonal direction after deformation and the shift reach minimum and maximum at the nadir and vertex of the diagonal line.
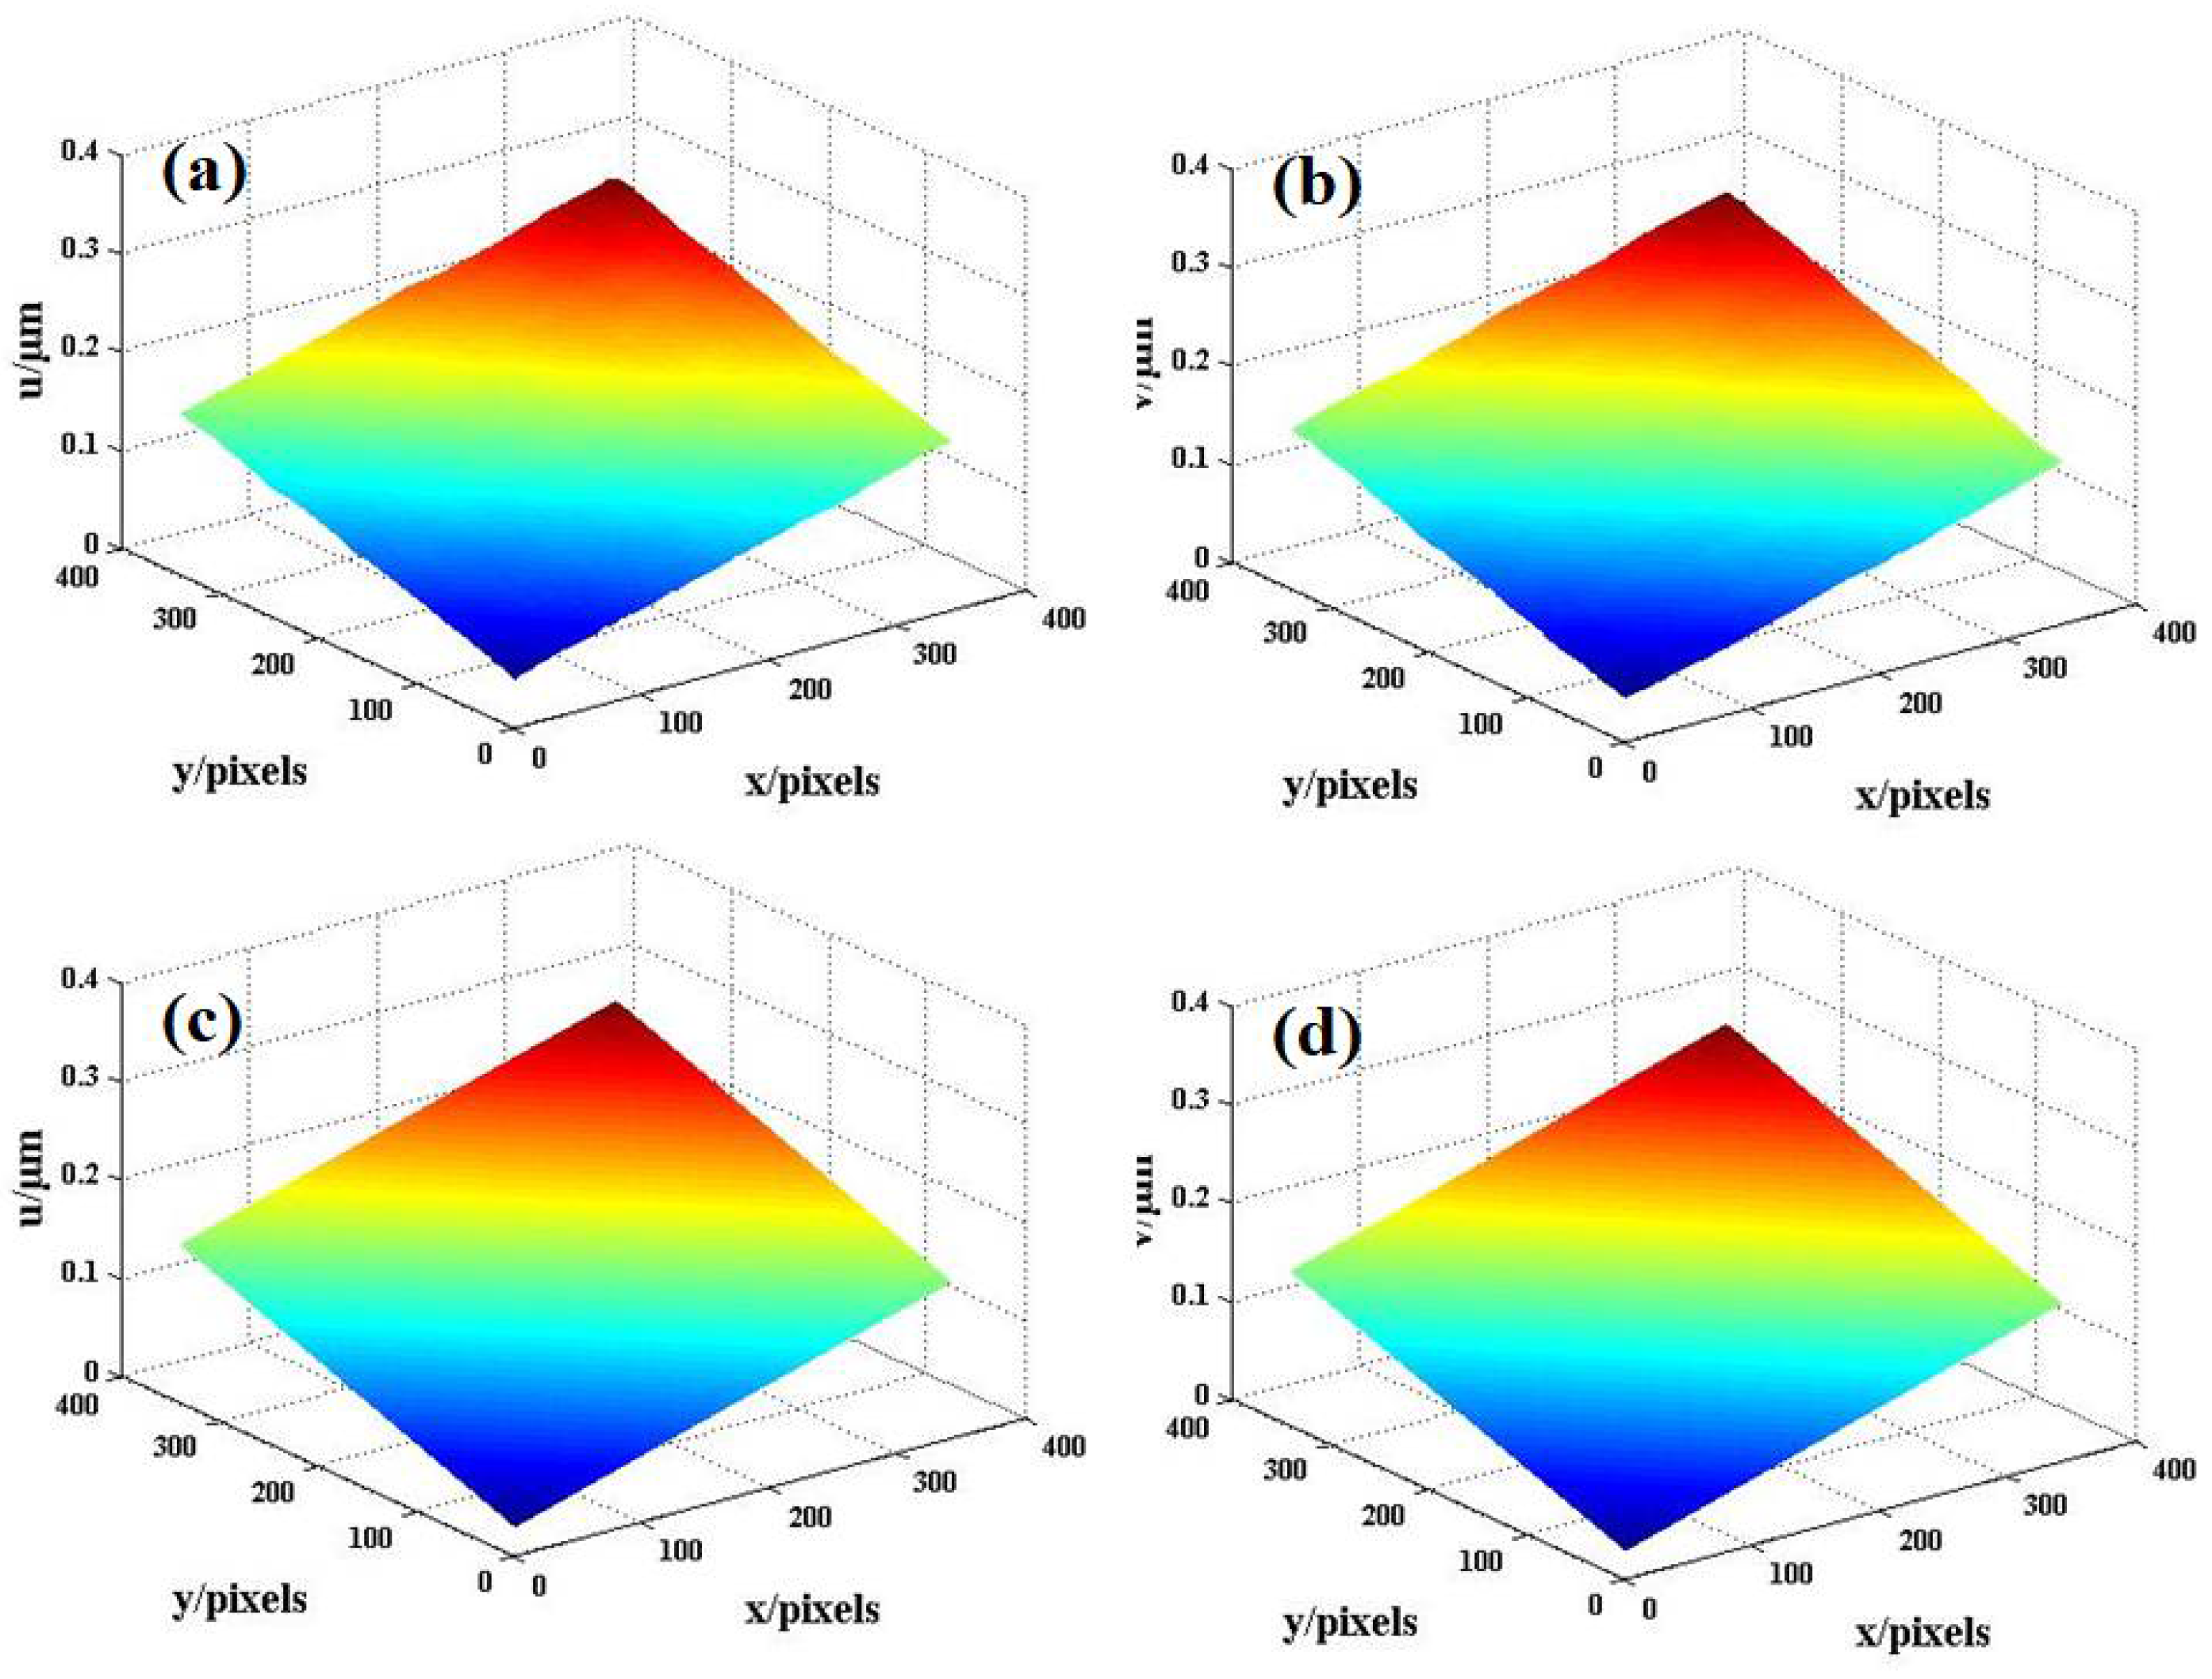
In order to obtain more reliable results, we utilize gradient-based DIC method [13] and Brox OF method [15] to extract the in-plane displacement field between Figure 5a,b. Subsequently, the out-of-plane displacement can be calculated by Equations (1)–(5). Because of the inherent boundary effects of DIC method and OF method, the valid area of data is 340 pixels × 340 pixels around the center of the picture. That is to say, there are 115,600 valid data points in the image and the length of the diagonal line of the valid area is 480.8 pixels. Figure 6a–d show the simulated results of in-plane displacement fields measured by DIC method and OF method. It is necessary to point out that the horizontal and vertical components of in-plane displacement fields u(xi,yi) and v(xi,yi) should be equal due to δ = 45°. The theoretical values of vertexes and the nadirs in Figure 6a–d are 7.355 pixel and 0.598 pixel, whereas the measurement results are 7.375 pixels, 0.586 pixel, 7.461 pixel, 0.588 pixel, 7.335 pixel, 0.599 pixel, 7.336 pixel and 0.598 pixel, respectively. Simultaneously, based on the data in Figure 6a–d and the equation , the rotation angle δ(xi,yi) for the points in the valid area can be calculated and the mean values of the results for DIC method and OF method are 45.01° and 45.02°, respectively. All these in-plane displacement measurement results can prove the accuracy of DIC method and OF method.
Since the out-of-plane displacement is extracted from the in-plane displacement field, the measurement accuracy of in-plane displacement has a significant influence on the measurement results of out-of-plane displacement. On the other hand, that is, the accuracy of out-of-plane displacement measurement can also prove the accuracy of in-plane displacement measurement. Hence, the next step of analysis will focus on the out-of-plane displacement results measured by DIC method, OF method and the corresponding theoretical values, as shown in Figure 7a–c. To further illustrate the validity of the proposed technique, Figure 7d displays the data comparison of Figure 7a–c along the diagonal direction and Table 1 shows the data of the nadir and vertex in Figure 7d. It is worth mentioning that since the angle of the slope can be calculated by the in-plane displacement and out-of-plane displacement, the angle θ is a suitable parameter to evaluate the accuracy of three-dimensional displacement measurement. If the absolute error and relative error are defined as:
The data in Figure 7d show that the absolute errors of DIC method and OF method at all the points on the diagonal line are smaller than 1 pixel and the means of relative error of these two methods are 2.1% and 1.3%. It can also be seen from Table 1 that the absolute errors of out-of-plane displacement measured by DIC method and OF method are smaller than 0.7 pixel at the nadir and vertex of diagonal line, whereas the relative errors of slope angles measured by these two methods are only 0.5% and 0.7%. Hence, as mentioned above, all these data are sufficient to prove the accuracy of the out-of-plane and in-plane measurement. Besides, the data in Figure 5c and Figure 7d show that OF method has better stability in small displacement measurement (displacement less than 3 pixels), whereas the DIC method is more suitable for larger displacement measurement (the displacement larger than 3 pixels). The sensitivity of the DIC method and OF method has been discussed in Ref. [17]. According to the analysis in reference, it is easy to know that the optimum measurement range of this method is [0°, 12°]. It can also be seen from Table 1 that the error at the vertex by the OF method and the error at the nadir by the DIC method have a slight increase, which is consistent with the analysis in Ref. [17].
4. Application Experiment Results and Analysis
A fiber image inverter with a diameter of 20 mm is chosen as the test sample in the application experiment. As illustrated in Figure 8a, the fiber image inverter is clamped by a holder, and a graduated handwheel on the holder is rotated to tilt the sample. The relationship between screw extension and loaded angle θ is shown in Figure 8b, where s is the screw elongation, the diameter of fiber image inverter S1 = 20 mm, the length of holder S2 = 5 mm. Screw pitch of the handwheel is 200μm, which means the screw will move along the z axis (upward or downward) 200 μm when the handwheel is rotated one revolution. Hence, we can obtain the expression of loaded angle θ: . The experimental apparatus are shown in Figure 8c,d. The main parameters of the experimental setup are listed as:
- Optical Microscope: 50×, Mitutoyo, NA = 0.55, objective lens: PLAN APO L, WD/20.5 mm.
- Industrial Camera: Andor, CMOS sensor chip, C-Mount, chip size 13.3 mm × 13.3 mm, diagonal line 18.8 mm, pixel size 6.5 μm × 6.5 μm, maximum resolution 4632 pixels × 3488 pixels (the observation range of the microscopy system with 50× magnification is 370 μm × 279 μm, i.e., 1 pixel = 80 nm).
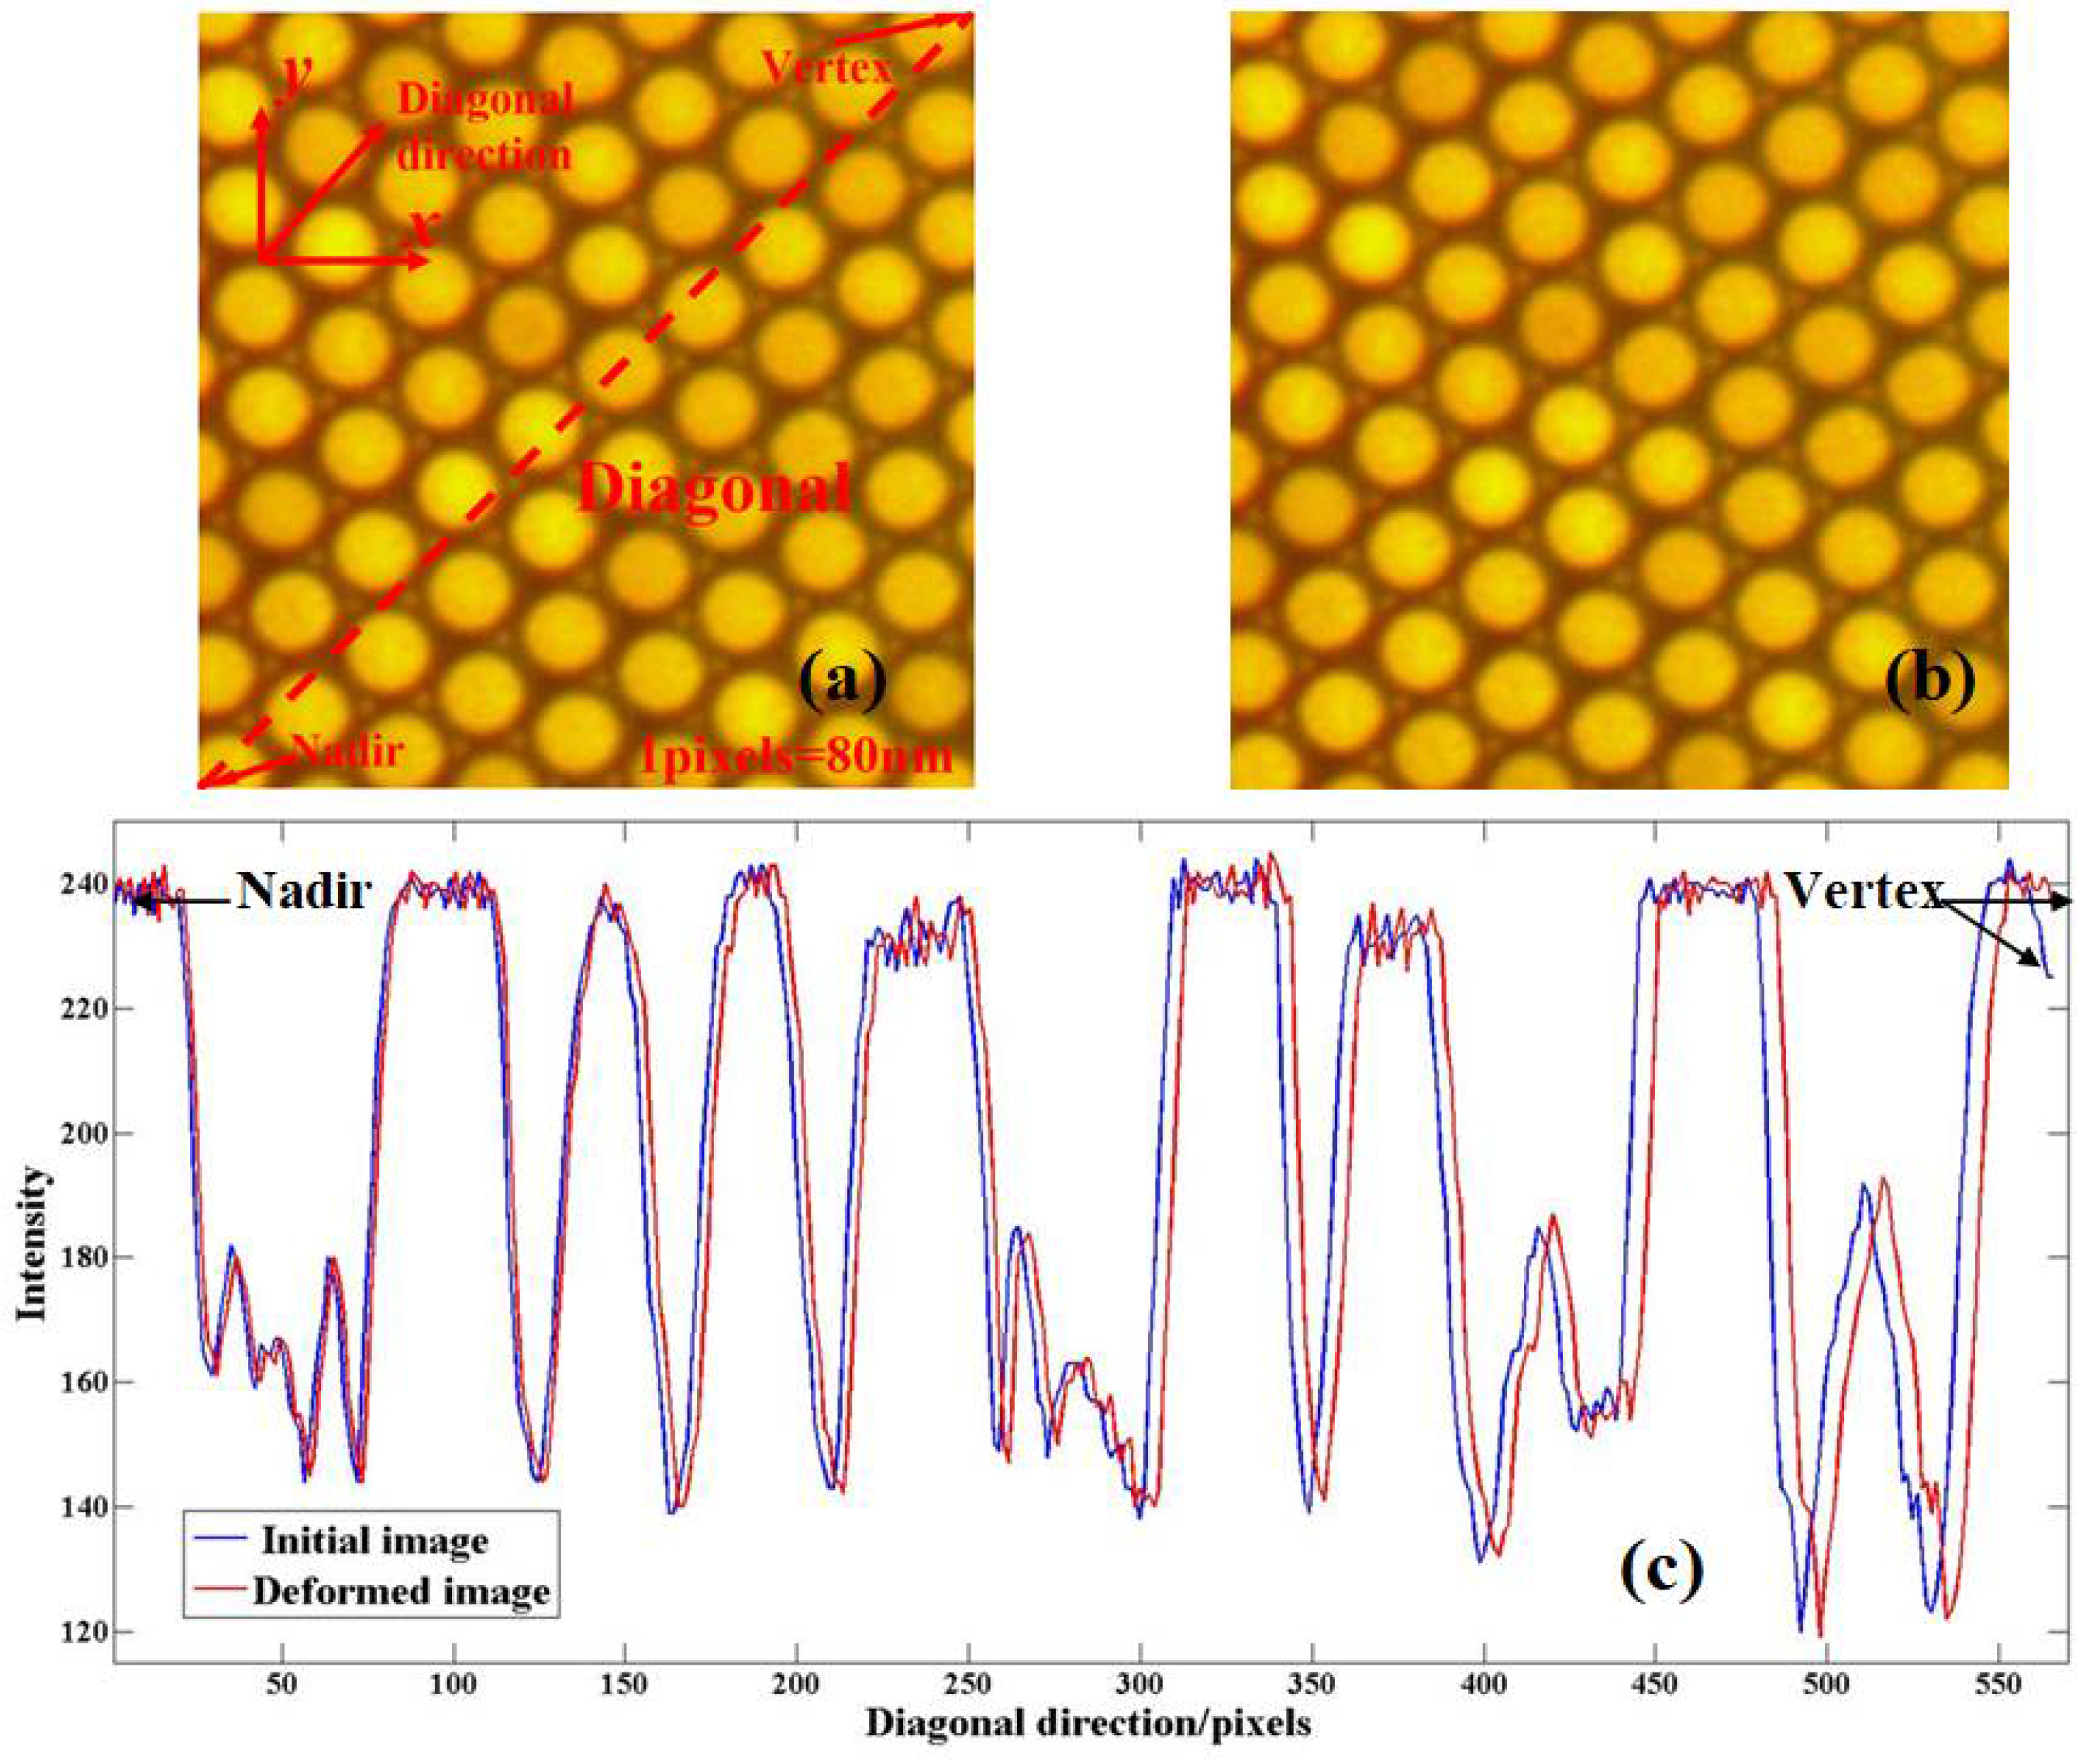
Rotate the handwheel to load the slope deformation with slope angle θ = 8°. In order to be consistent with the simulation experiment, the rotation angle of the slope δ is set as 45° by using the protractor on the platform (note that the ordinary slope model presented in this paper is suitable for any rotation angle δ ∈ (0°, 90°) after calibration). The sizes of the original and deformed images are limited to 400 pixels × 400 pixels, where 1 pixel = 80 nm, as shown in Figure 9a,b. Figure 9c displays the intensity distributions of Figure 9a,b along the diagonal direction. It can be seen from Figure 9c that there is an intensity shift along the diagonal direction after deformation and the shift reach minimum and maximum at the nadir and vertex of the diagonal line, which is consistent with the simulation experiment.
The in-plane displacement results measured by DIC method and OF method in the application experiment are displayed in Figure 10a–d. Likewise, because of the inherent boundary effects of the DIC method and OF method, the valid area of data is 340 pixels × 340 pixels around the center of the picture and the length of the diagonal line of the valid area is 480.8 pixels. The theoretical values of vertexes and the nadirs in Figure 6a–d are 0.2872 μm and 0.0233 μm, whereas the measurement results are 0.2820 μm, 0.0491 μm, 0.2818 μm, 0.0445 μm, 0.2786 μm, 0.0294 μm, 0.2777 μm and 0.0288 μm, respectively. The mean values of the rotation angle δ(xi,yi) measured by DIC method and OF method in the valid area are 45.09° and 45.13°, respectively.
The out-of-plane displacement results measured by DIC method, OF method and the corresponding theoretical values are shown in Figure 11a–c and the computing times of these two methods are 24.36 s and 19.55 s (Intel i5-7400 CPU @3.0 GHz, Matlab software). For the convenience of comparison, Figure 11d displays the data comparison of Figure 11a–c along the diagonal direction, and Table 2 shows the data of the nadir and vertex in Figure 11d. The mean values of the relative errors of the data in Figure 11d are 4.3% (DIC method) and 2.9% (OF method). It is worth noting that, as shown in Table 2, although the absolute error of the DIC method at the nadir is less than 0.1 μm, the relative error reaches 11.35% due to the small displacement measurement (as shown in Figure 10, the in-plane displacement at the nadir smaller than 80 nm, i.e., 1 pixel), whereas the relative error of the OF method at the nadir is only 3.73%; since the in-plane displacement at the vertex is larger than 0.24 μm (i.e., 3 pixels), the absolute error of the OF method at the vertex is larger than 0.1 μm, whereas the absolute error of the DIC method at the vertex is less than 0.05 μm. Overall, the accuracies of the DIC method and OF method will decrease for small and larger displacement measurement, respectively, which is the main reason for the increase in the data error. Fortunately, note in Figure 11 and Table 2 that all the absolute errors of the data measured by the DIC method and OF method are less than 0.2 μm, which can meet the industrial detection standard of glass or quartz optical fiber products and proves the effectiveness of the proposed method [18]. Hence, this method has been applied to the industrial detection of glass or quartz optical fiber products.
5. Conclusions
Considering the detection cost and practicability, an image spherizing-based three-dimensional displacement measurement method for a monocular microscopic imaging system is proposed. The measurement process can be mainly expressed as three steps:
- Take the images before and after deformation by a monocular microscopic imaging system.
- Estimate the in-plane displacement fields between two images.
- Extract the out-of-plane displacement field from in-plane displacement fields by the ordinary slope model, which is proposed based on an image spherizing algorithm and differential theory.
Unlike conventional methods, the new method does not need a phase unwrapping process during detection and has many attractive characteristics such as low-cost, simple optical arrangements and good applicability. Since the measurement precision of the proposed technique can meet the detection requirement, it has been applied to the industrial detection of glass or quartz optical fiber products and provides a new approach for solid material micro-nano scale displacement measurement.
Author Contributions
Conceptualization, R.Z.; methodology, R.Z. and X.L.; software, P.S.; validation, Y.T. and P.J.; formal analysis, R.Z. and P.J.; investigation, R.Z. and J.J.; resources, R.Z.; data curation, P.J.; writing—original draft preparation, R.Z.; writing—review and editing, X.L.; visualization, R.Z.; supervision, R.Z. and P.S.; project administration, R.Z. and Y.H.; funding acquisition, Y.H. and J.J. All authors have read and agreed to the published version of the manuscript.
Funding
This work is supported by the National Natural Science Foundation of China under grant nos. 11902317, 61975099 and 52072357, the major scientific and technological innovation projects in Shandong Province under grant 2019TSLH0122, the Collaborative innovation projects of Beijing Chaoyang District under grant CYXC2108.
Institutional Review Board Statement
This study did not involve humans or animals.
Informed Consent Statement
Not applicable.
Data Availability Statement
This study does not report any data.
Conflicts of Interest
The authors declare no conflict of interest.
References
- Huang, Y.; Gu, Z.; Zhang, Y.; Liu, H.; Li, G. Nano-scale Morphology on Micro-channel Plate Lead Silicate Glass Surface. J. Chin. Ceram. Soc. 2012, 40, 994–999. [Google Scholar]
- Jiao, P.; Jia, J.; Zhang, L.; Wang, Y.; Wang, J.; Zhou, Y.; Shi, P.; Zhao, R.; Huang, Y. Detection of blemish for fiber-optic imaging elements. Opt. Eng. 2020, 59, 053105. [Google Scholar] [CrossRef]
- Zhao, R.; Sun, Y.; Yu, G.; Sun, P.; Huang, Y.; Yang, Z.; Jia, J. Correlation-Based Out-of-Plane Displacement Measurement for Optical Fiber Material. Photonics 2021, 8, 348. [Google Scholar] [CrossRef]
- Zhao, R.; Jiao, P.; Liu, B.; Sun, P.; Tang, Y.; Jia, J. Out-of-plane displacement measurement for an optical fiber image transmission element using optical flow. Appl. Opt. 2021, 60, 10282–10291. [Google Scholar] [CrossRef] [PubMed]
- Hu, Y.; Chen, Q.; Feng, S.; Zuo, C. Microscopic fringe projection profilometry: A review. Opt. Lasers Eng. 2020, 135, 106192. [Google Scholar] [CrossRef]
- José, S.; Amalia, G.; Juan, R.; Miguel, R. LED source interferometer for microscopic fringe projection profilometry using a Gates’ interferometer configuration. Opt. Lasers Eng. 2022, 149, 106822. [Google Scholar]
- Kim, J.; Go, T.; Lee, S. Volumetric monitoring of airborne particulate matter concentration using smartphone-based digital holographic microscopy and deep learning. J. Hazard. Mater. 2021, 418, 126351. [Google Scholar] [CrossRef] [PubMed]
- Pan, J.; Peng, Q.; Zhang, G.; Xie, Q.; Gong, X.; Qian, P.; Ma, C.; Zhang, G. Antifouling mechanism of natural product-based coatings investigated by digital holographic microscopy. J. Mater. Sci. Technol. 2021, 84, 200–207. [Google Scholar] [CrossRef]
- Vishal, S.; Mohammad, I.; Ranjeet, K.; Dalip, M. Single shot white light interference microscopy for 3D surface profilometry using single chip color camera. J. Opt. Soc. Korea 2016, 20, 784–793. [Google Scholar]
- Hernando, M.; Alberto, V.; Andres, M. Robust 3D surface recovery by applying a focus criterion in white light scanning interference microscopy. Appl. Opt. 2019, 58, A101–A111. [Google Scholar]
- Seung, L.; Chikako, T.; Jun, H. Macroscopic and microscopic characterizations of Portevin-LeChatelier effect in austenitic stainless steel using high-temperature digital image correlation analysis. Acta Mater. 2021, 205, 116560. [Google Scholar]
- Li, C.; Dong, B.; Pan, B. A flexible and easy-to-implement single-camera microscopic 3D digital image correlation technique. Meas. Sci. Technol. 2019, 30, 085002. [Google Scholar] [CrossRef]
- Xiao, F.; Zhao, R.; Sun, P. Three-dimensional displacement measurement based on the combination of digital image correlation and optical flow. Appl. Opt. 2016, 55, 8207–8212. [Google Scholar] [CrossRef] [PubMed]
- Zhao, R.; Huang, Y.; Wang, J.; Sun, Y.; Huang, K.; Zhou, Y.; Wang, Y.; Fu, Y. Image spherizing based planeness detecting method for MCP. Appl. Opt. 2019, 58, 554–560. [Google Scholar] [CrossRef] [PubMed]
- Tang, T.; Sun, P.; Dai, Q.; Fan, C.; Lei, Z. Object shape measurement based on Brox optical flow estimation and its correction method. Photonics 2020, 7, 109. [Google Scholar] [CrossRef]
- David, S.; John, H. Laser beam shaping profiles and propagation. Appl. Opt. 2006, 45, 5118–5131. [Google Scholar]
- Lei, Z.; Sun, P.; Hu, C. The sensitivity and the measuring range of the typical differential optical flow method for displacement measurement using the fringe pattern. Opt. Commun. 2021, 487, 126806. [Google Scholar] [CrossRef]
- Pan, G.; He, Y.; Miao, K. Specification for Microchannel Plate. GJB1596-93; Commission of Science, Technology and Industry for National Defense: Beijing, China, 1993. [Google Scholar]
Figure 1.
Image spherizing: (a) initial image; (b) spherized image.

Figure 2.
Differential theory: line-curve model and slope-sphere model.

Figure 3.
The simplest slope model: (a) plan view; (b) cross-sectional view.

Figure 4.
Ordinary slope model.

Figure 5.
Simulated optical-fiber image under microscope: (a) initial image; (b) deformed image; (c) intensity data of (a,b) in diagonal direction.
Figure 5.
Simulated optical-fiber image under microscope: (a) initial image; (b) deformed image; (c) intensity data of (a,b) in diagonal direction.

Figure 6.
In-plane displacement results of simulation experiment: (a) field u (DIC method); (b) field v (DIC method); (c) field u (OF method); (d) field v (OF method).
Figure 6.
In-plane displacement results of simulation experiment: (a) field u (DIC method); (b) field v (DIC method); (c) field u (OF method); (d) field v (OF method).

Figure 7.
Out-of-plane displacement results of simulation experiment: (a) field w (DIC method); (b) field w (OF method); (c) field w (Theoretical result); (d) data of (a–c) in diagonal direction.
Figure 7.
Out-of-plane displacement results of simulation experiment: (a) field w (DIC method); (b) field w (OF method); (c) field w (Theoretical result); (d) data of (a–c) in diagonal direction.

Figure 8.
Experimental apparatus and schematic diagram: (a) measurement schematic; (b) relation between screw extension and slope angle θ; (c) experimental apparatus; (d) holder and material.
Figure 8.
Experimental apparatus and schematic diagram: (a) measurement schematic; (b) relation between screw extension and slope angle θ; (c) experimental apparatus; (d) holder and material.

Figure 9.
Experimental images captured by microscope: (a) original image; (b) deformed image; (c) intensity data of (a,b) in diagonal direction.
Figure 9.
Experimental images captured by microscope: (a) original image; (b) deformed image; (c) intensity data of (a,b) in diagonal direction.

Figure 10.
In-plane displacement results of application experiment: (a) field u (DIC method); (b) field v (DIC method); (c) field u (OF method); (d) field v (OF method).
Figure 10.
In-plane displacement results of application experiment: (a) field u (DIC method); (b) field v (DIC method); (c) field u (OF method); (d) field v (OF method).

Figure 11.
Out-of-plane displacement results of application experiment: (a) field w (DIC method); (b) field w (OF method); (c) field w (theoretical result); (d) data of (a–c) in diagonal direction.
Figure 11.
Out-of-plane displacement results of application experiment: (a) field w (DIC method); (b) field w (OF method); (c) field w (theoretical result); (d) data of (a–c) in diagonal direction.


Table 1.
Data of vertex and nadir in Figure 7d.
Table 1.
Data of vertex and nadir in Figure 7d.
| Data | Absolute Error | Relative Error | |||||||
|---|---|---|---|---|---|---|---|---|---|
| Vertex (Pixel) | Nadir (Pixel) | Angles (°) | Vertex (Pixel) | Nadir (Pixel) | Angles (°) | Vertex | Nadir | Angles | |
| DIC | 104.32 | 8.21 | 11.53 | 0.36 | 0.22 | 0.07 | 0.35% | 2.61% | 0.61% |
| OF | 103.29 | 8.44 | 11.38 | 0.67 | 0.01 | 0.08 | 0.64% | 0.12% | 0.70% |
| Theory | 103.96 | 8.43 | 11.46 | — | — | — | — | — | — |
Table 2.
Data of vertex and nadir in Figure 11d.
Table 2.
Data of vertex and nadir in Figure 11d.
| Data | Absolute Error | Relative Error | |||||||
|---|---|---|---|---|---|---|---|---|---|
| Vertex (μm) | Nadir (μm) | Angles (°) | Vertex (μm) | Nadir (μm) | Angles (°) | Vertex | Nadir | Angles | |
| DIC | 5.7864 | 0.5256 | 7.86 | 0.0392 | 0.0536 | 0.14 | 0.67% | 11.35% | 1.75% |
| OF | 5.7232 | 0.4896 | 7.82 | 0.1024 | 0.0176 | 0.18 | 1.76% | 3.73% | 2.25% |
| Theory | 5.8256 | 0.4720 | 8.00 | — | — | — | — | — | — |
Publisher’s Note: MDPI stays neutral with regard to jurisdictional claims in published maps and institutional affiliations. |
© 2022 by the authors. Licensee MDPI, Basel, Switzerland. This article is an open access article distributed under the terms and conditions of the Creative Commons Attribution (CC BY) license (https://creativecommons.org/licenses/by/4.0/).
Share and Cite
MDPI and ACS Style
Zhao, R.; Li, X.; Sun, P.; Tang, Y.; Jiao, P.; Huang, Y.; Jia, J. Image Spherizing-Based Three-Dimensional Displacement Measurement Technique for Microscope with Single Camera. Photonics 2022, 9, 148. https://doi.org/10.3390/photonics9030148
AMA Style
Zhao R, Li X, Sun P, Tang Y, Jiao P, Huang Y, Jia J. Image Spherizing-Based Three-Dimensional Displacement Measurement Technique for Microscope with Single Camera. Photonics. 2022; 9(3):148. https://doi.org/10.3390/photonics9030148
Chicago/Turabian StyleZhao, Ran, Xuan Li, Ping Sun, Yuxin Tang, Peng Jiao, Yonggang Huang, and Jinsheng Jia. 2022. "Image Spherizing-Based Three-Dimensional Displacement Measurement Technique for Microscope with Single Camera" Photonics 9, no. 3: 148. https://doi.org/10.3390/photonics9030148
Note that from the first issue of 2016, this journal uses article numbers instead of page numbers. See further details here.