
Volatile Organic Compounds and 16S Metabarcoding in Ice-Stored Red Seabream Pagrus major

 , , , ,
  and
and 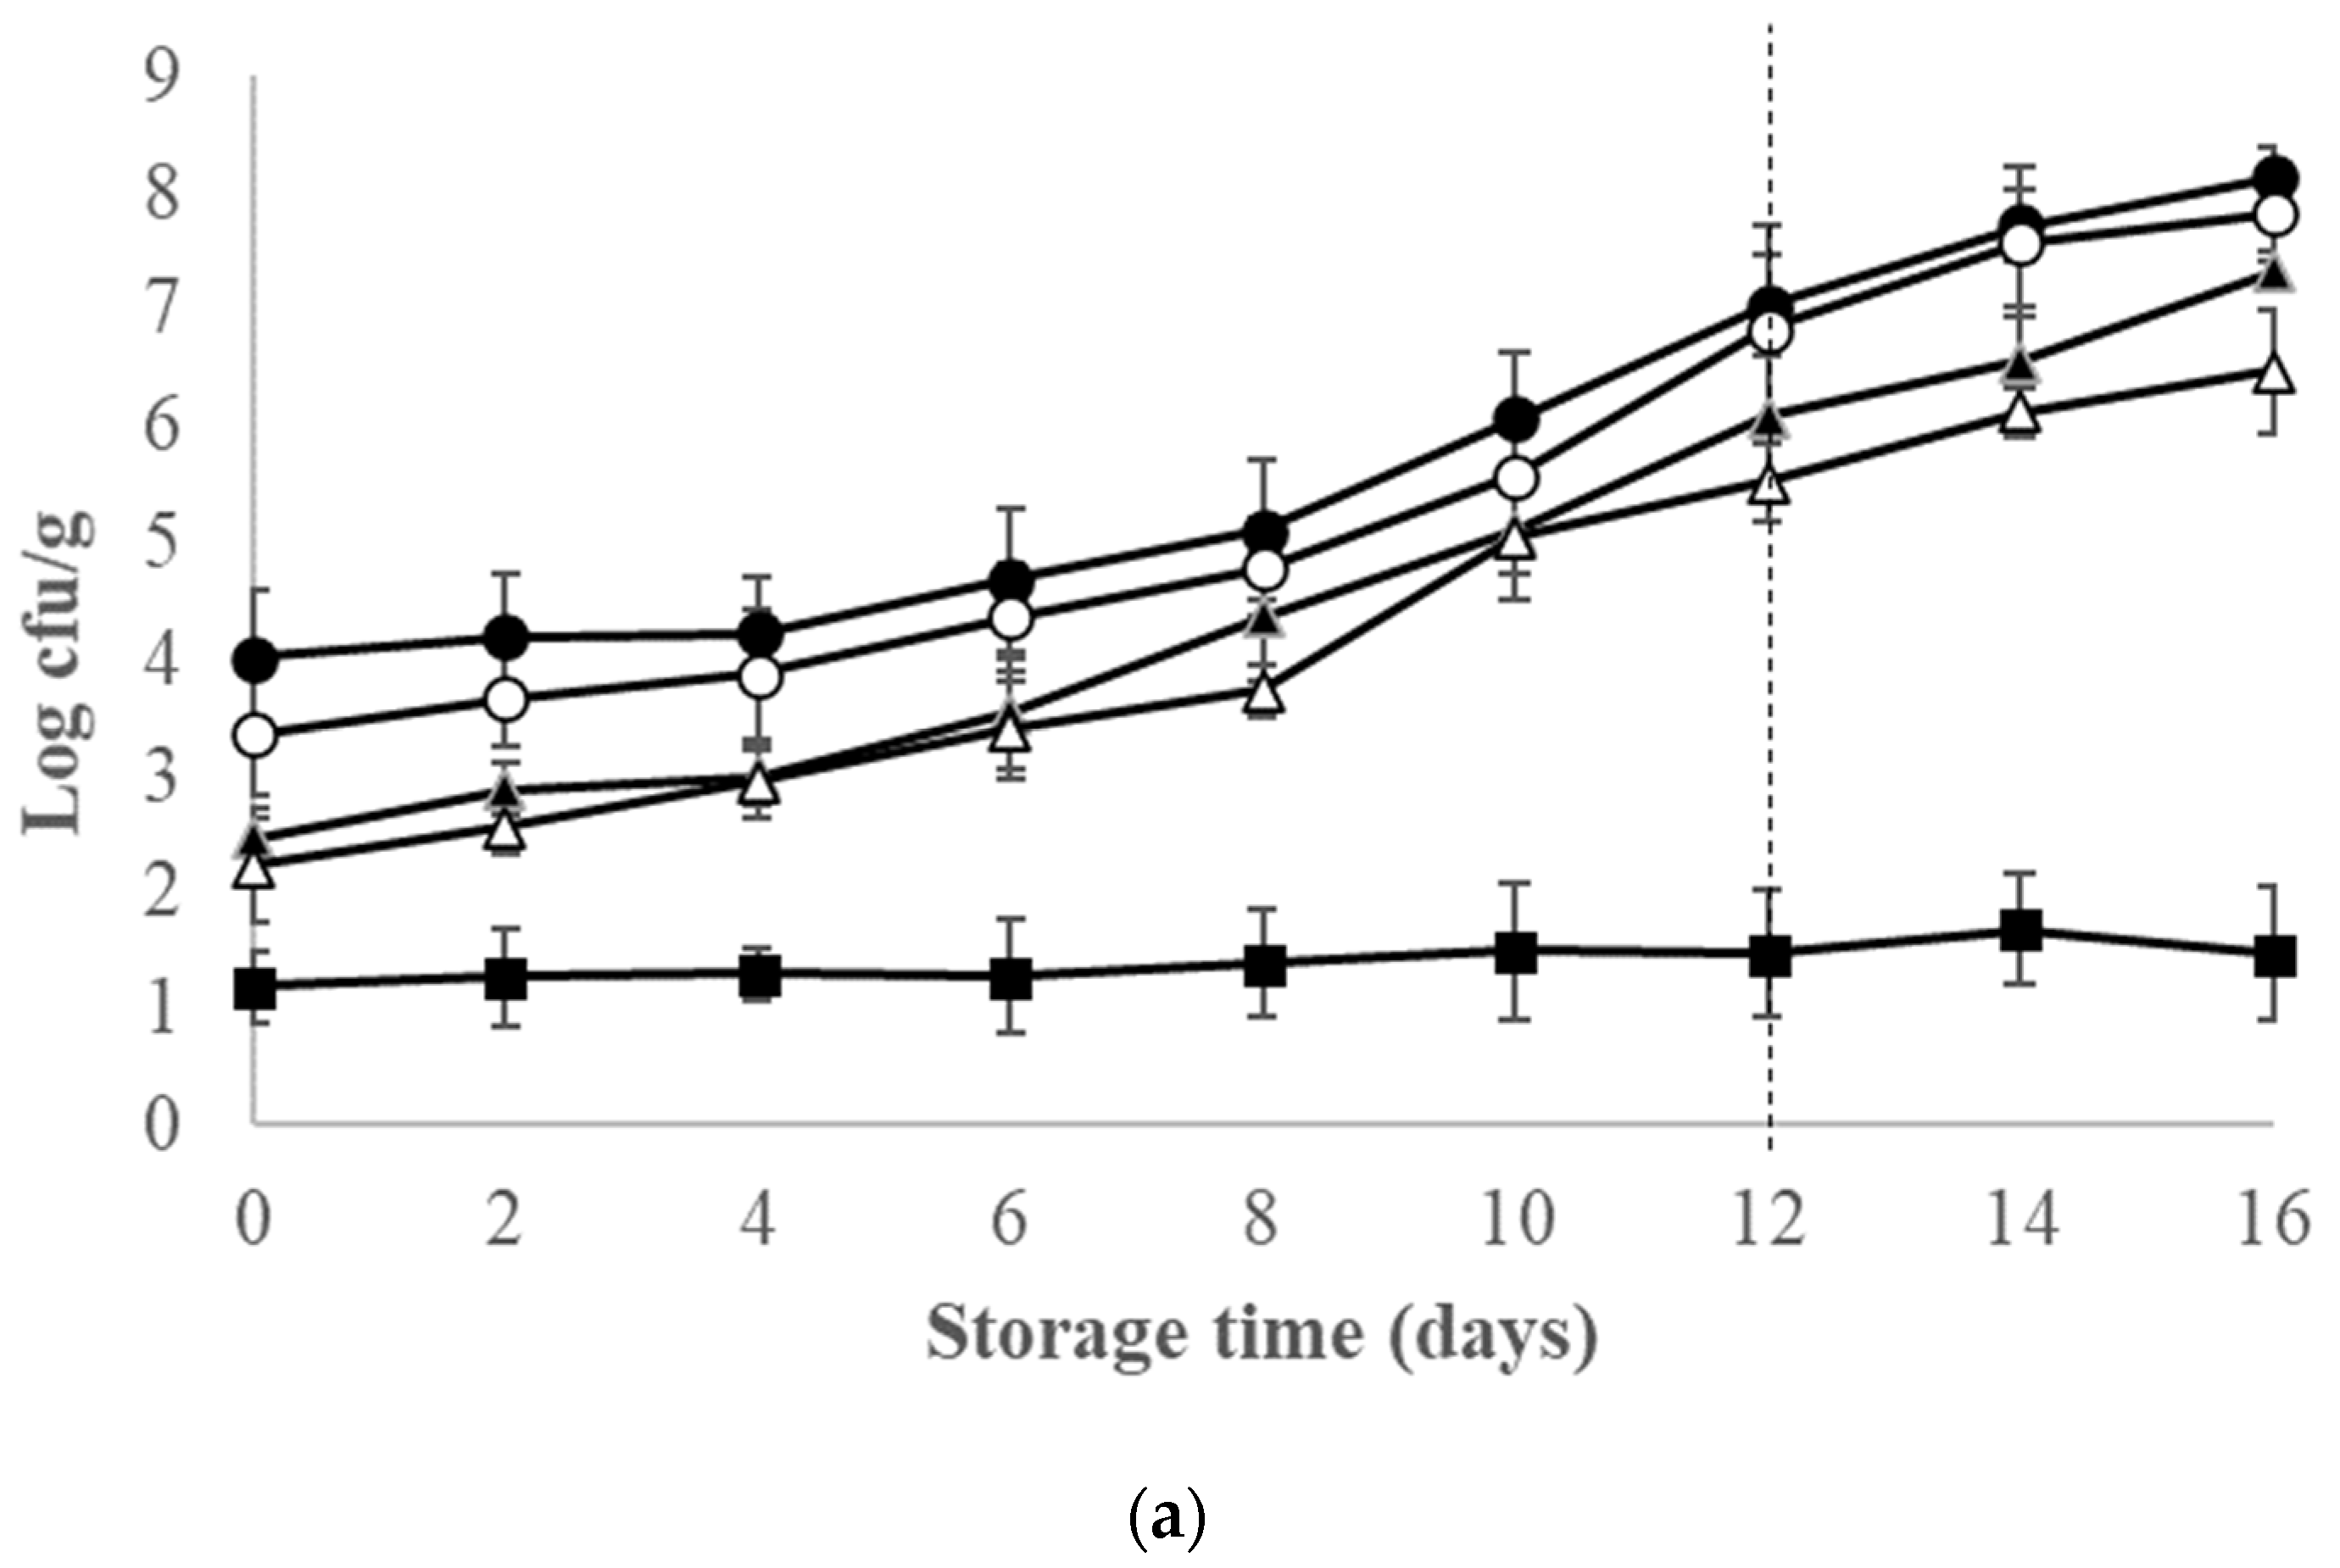
Abstract
:1. Introduction
2. Materials and Methods
2.1. Provision and Storage of Red Seabream
2.2. Evaluation of Red Seabream Sensory Rejection
2.3. Microbiological Analysis
2.4. 16S Metabarcoding
2.4.1. Samples Preparation and DNA Extraction
2.4.2. Library Preparation, Sequencing and Bioinformatic Analysis
2.5. Determination of Volatile Compounds by Headspace SPME-GC/MS
2.6. Statistical Analysis
3. Results
3.1. Sensory Evaluation of Ice-Stored Red Seabream
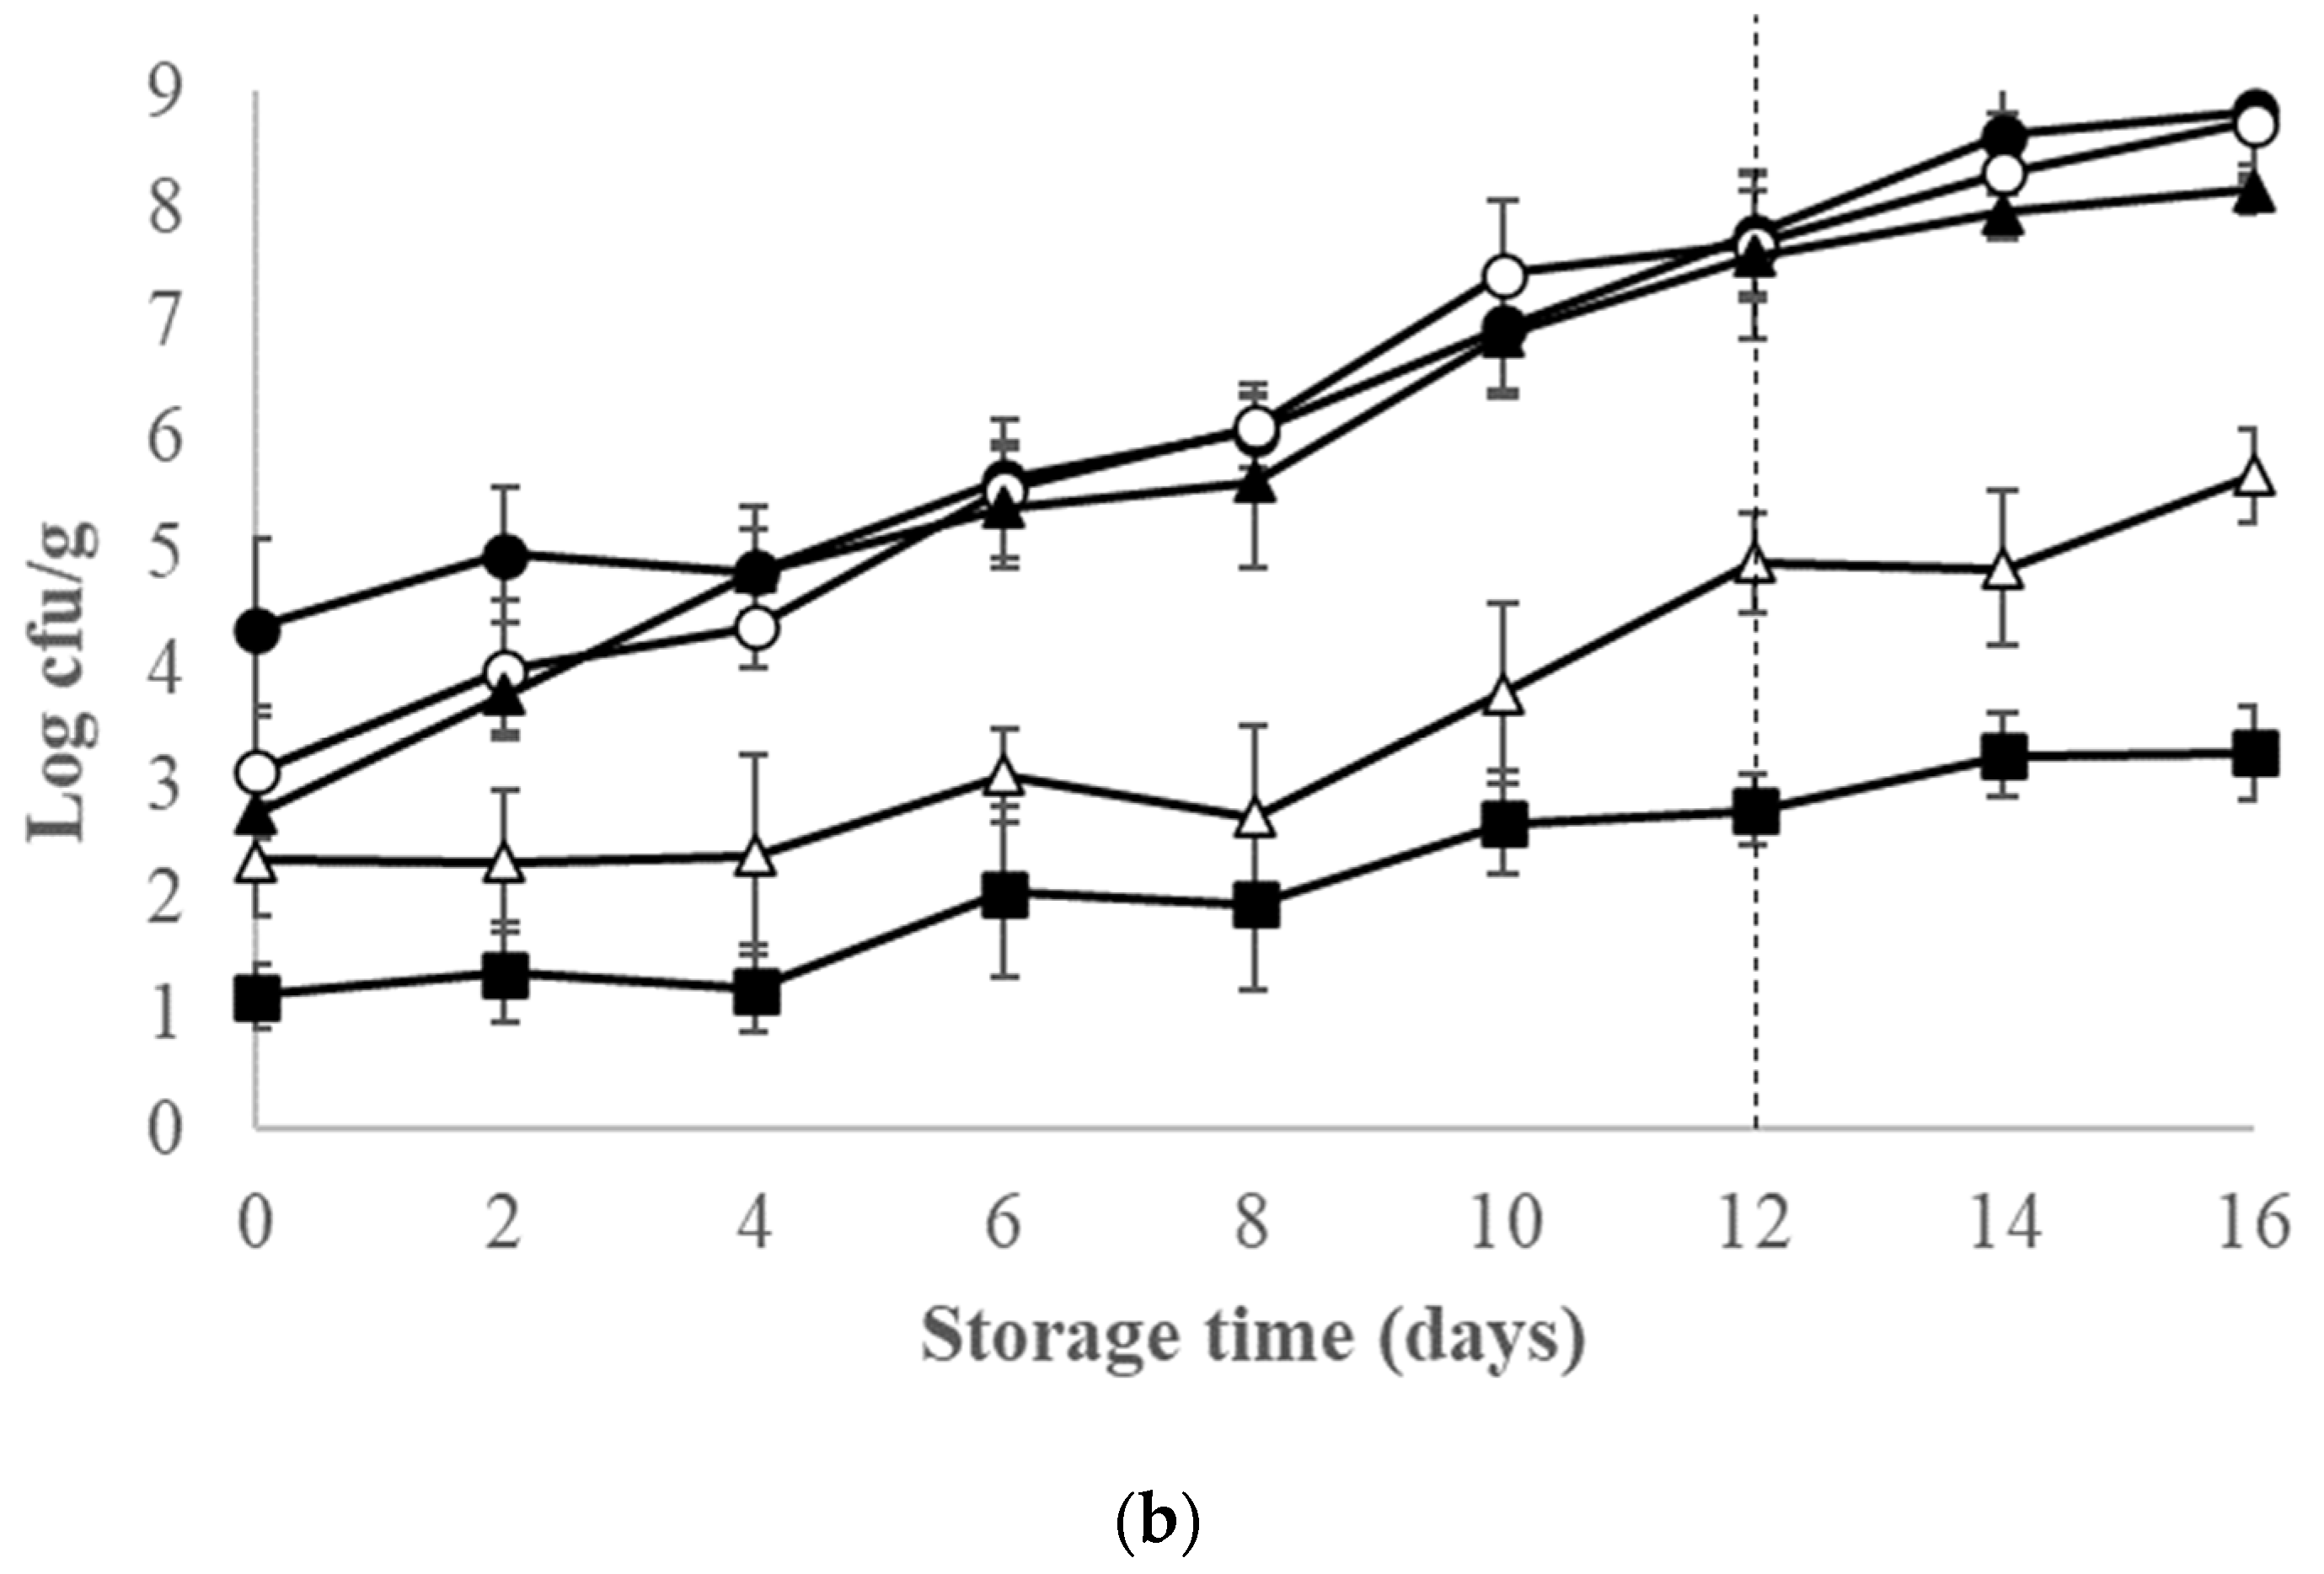
3.2. Microbiological Changes of Ice-Stored Red Seabream
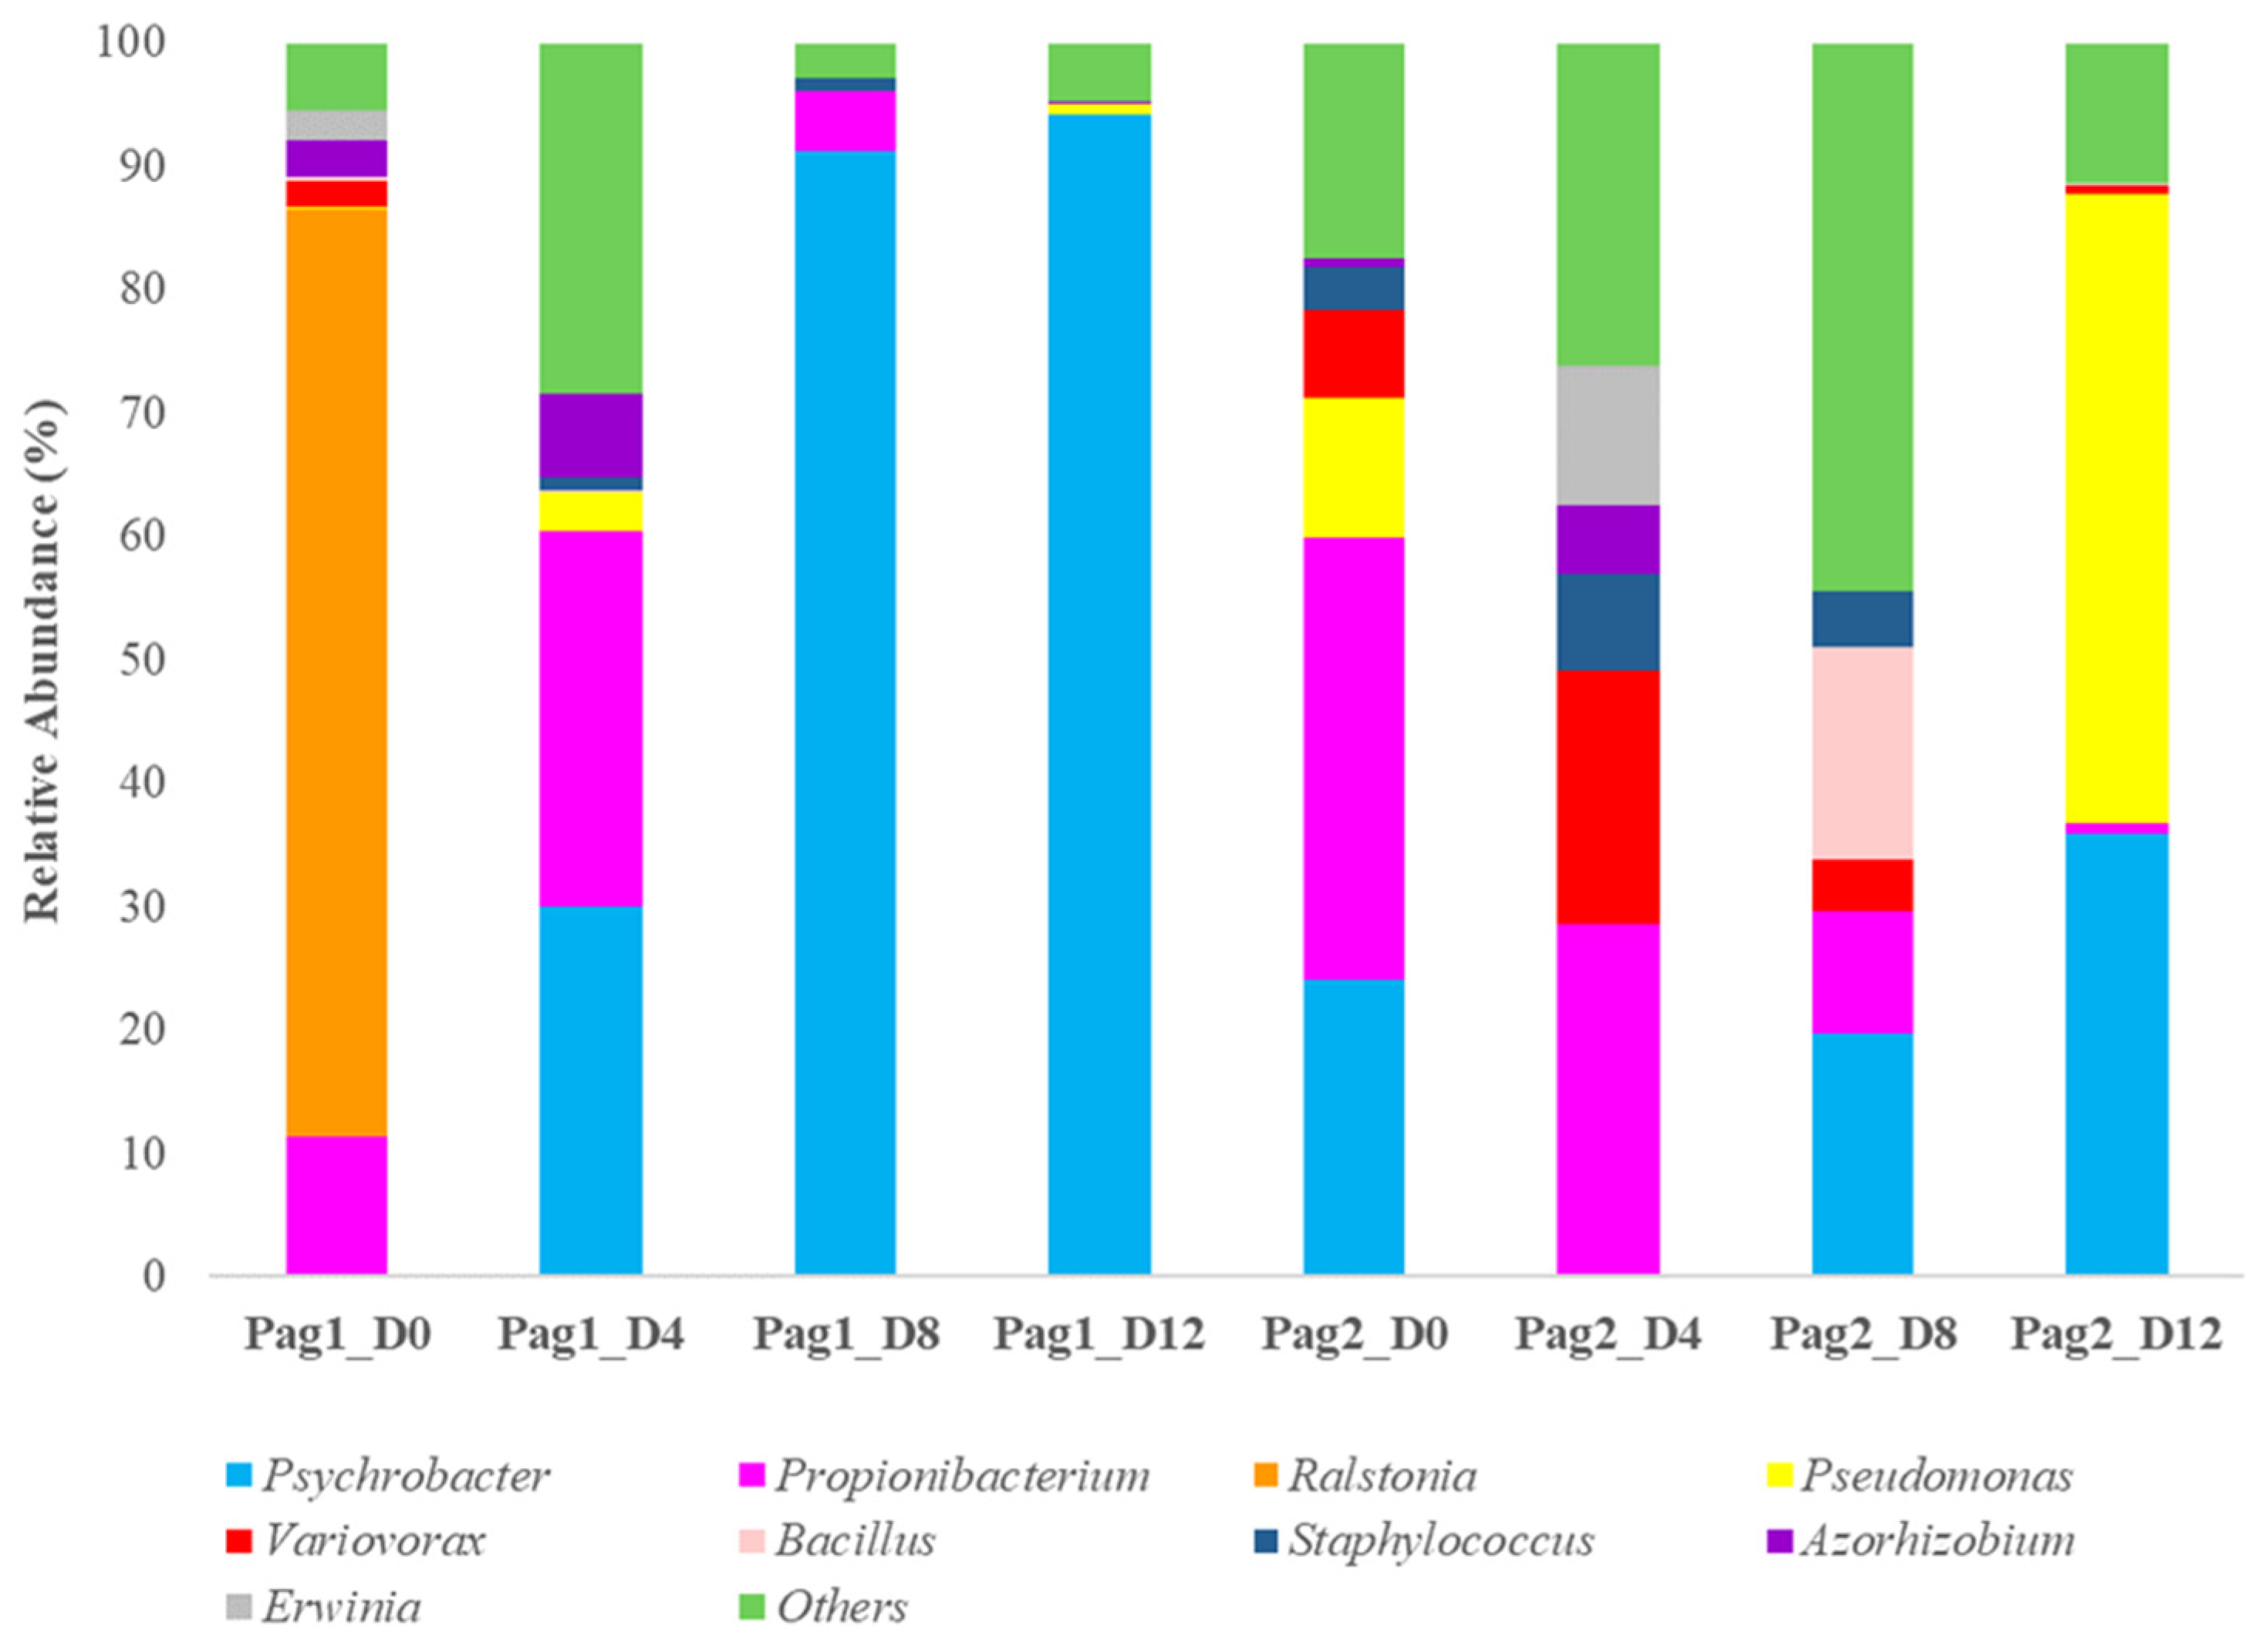
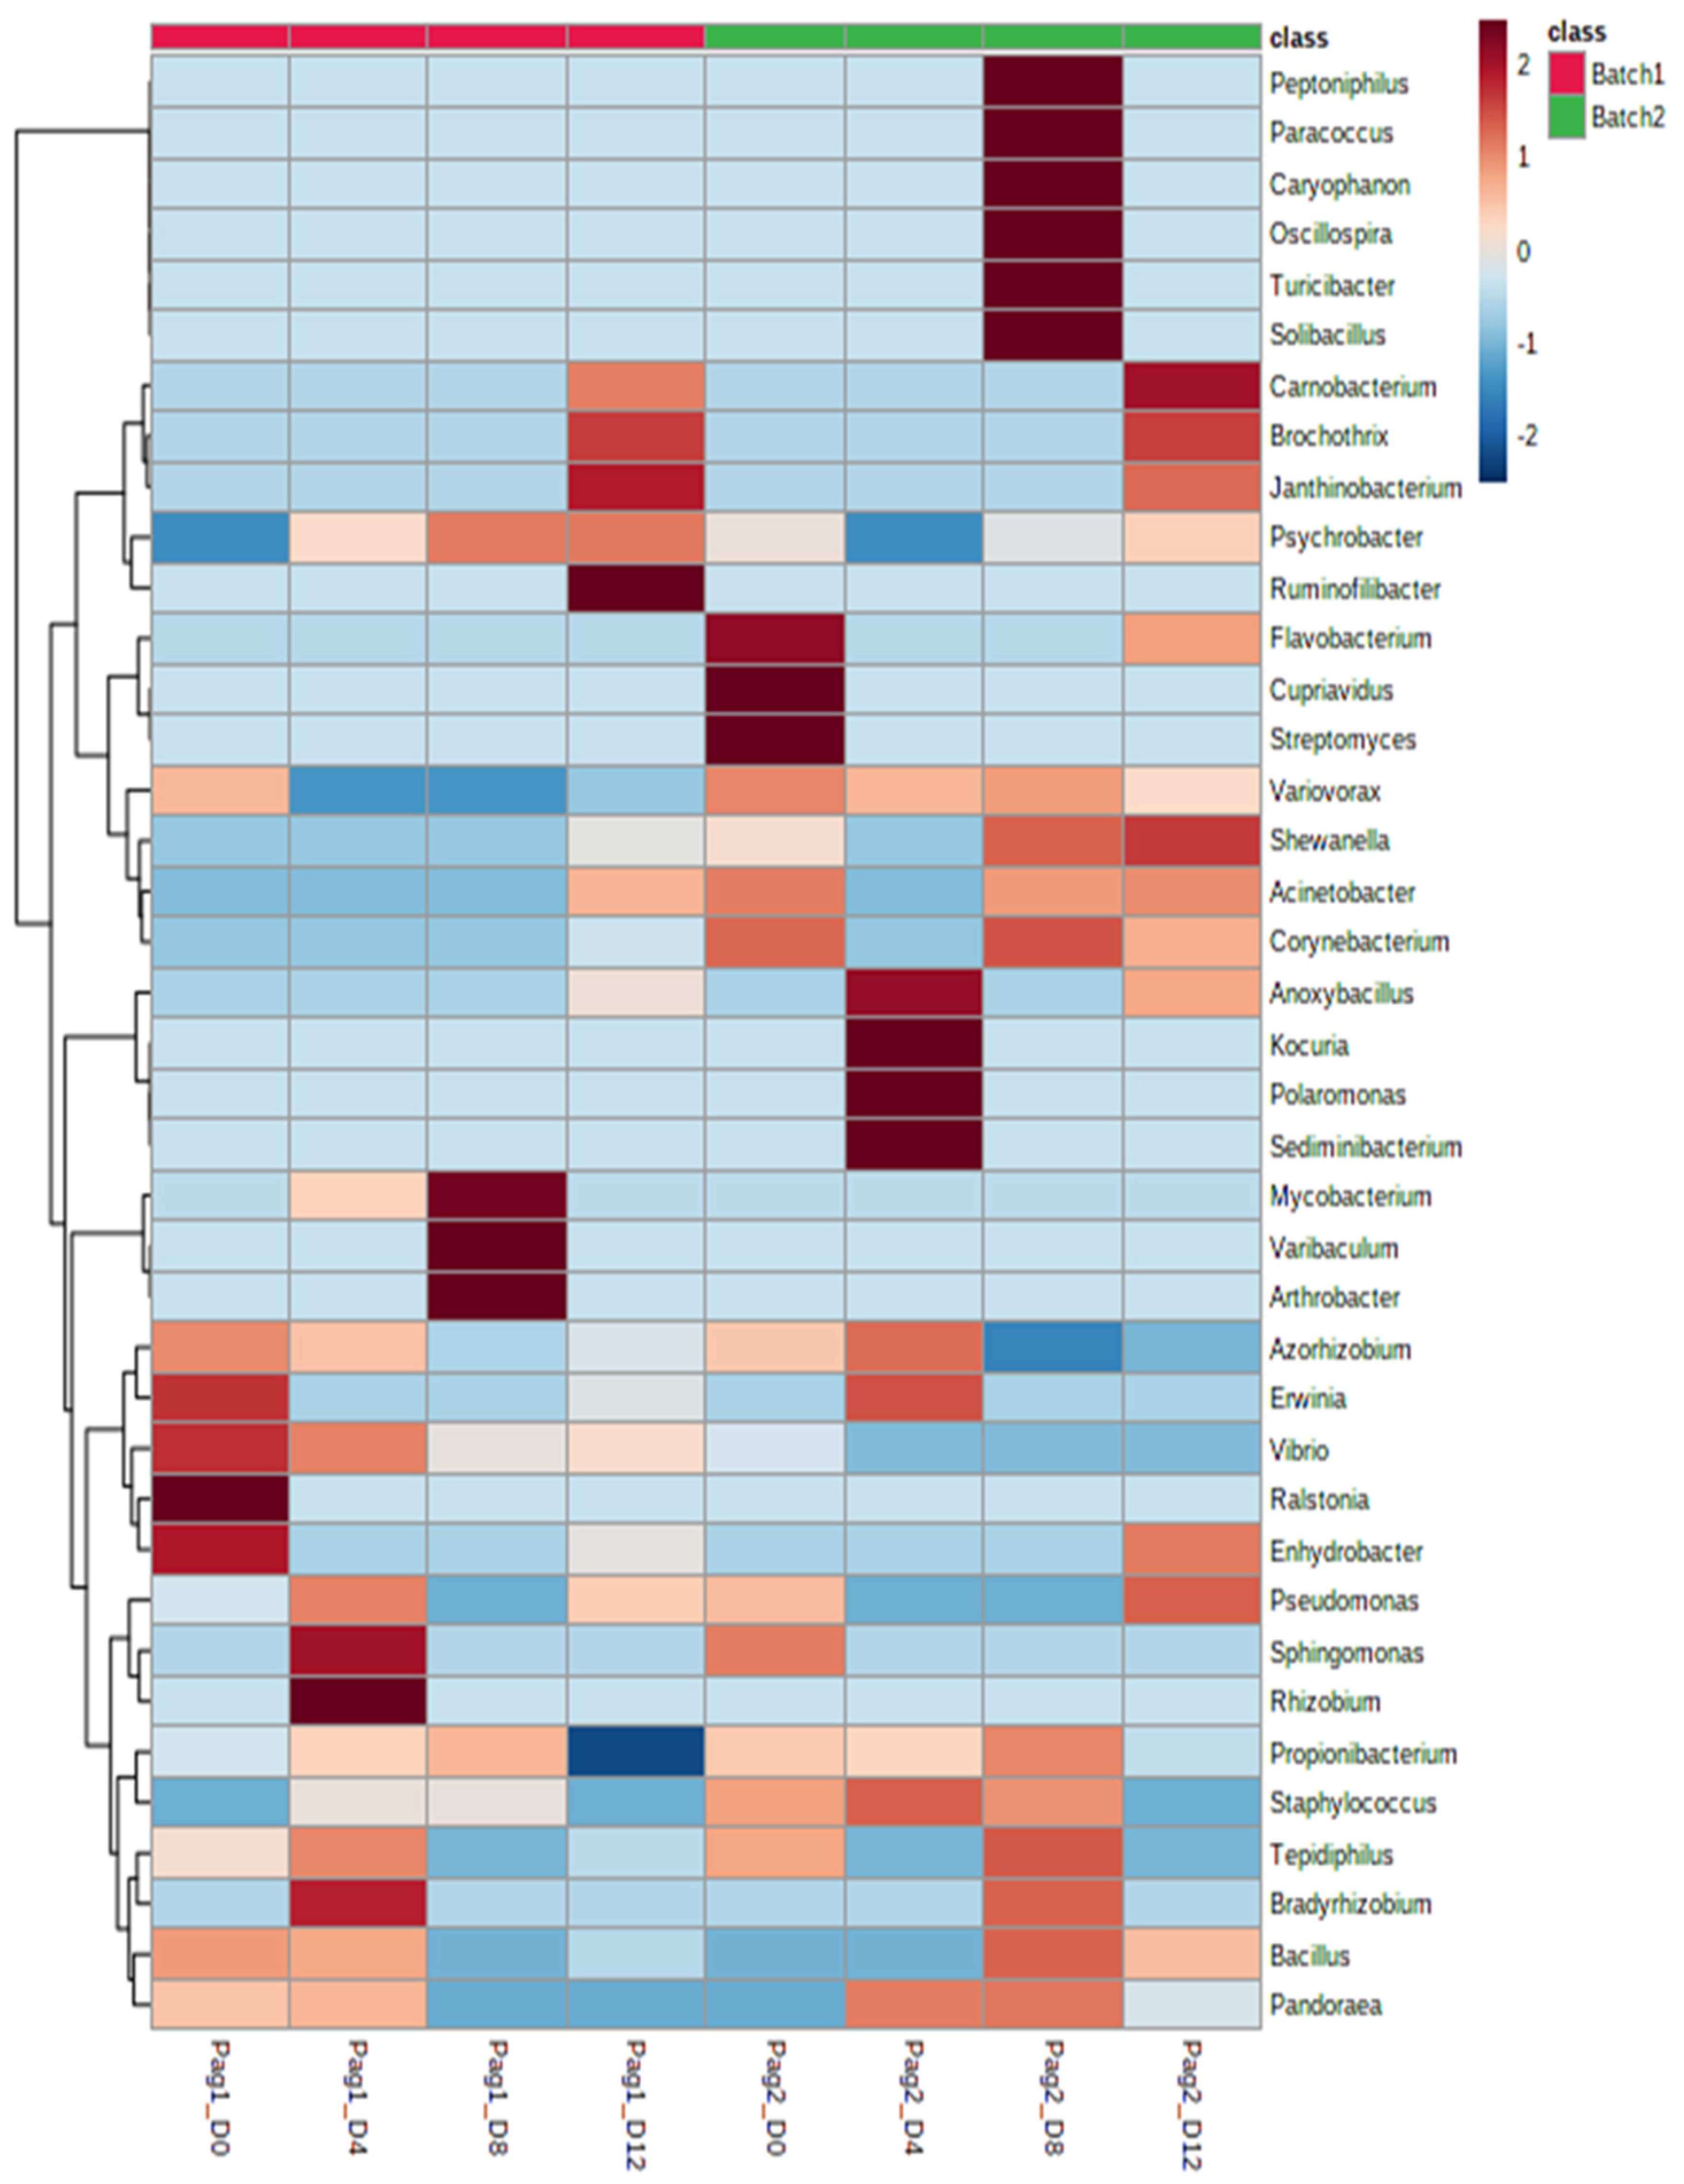
3.3. Microbial Communities of Ice-Stored Fish
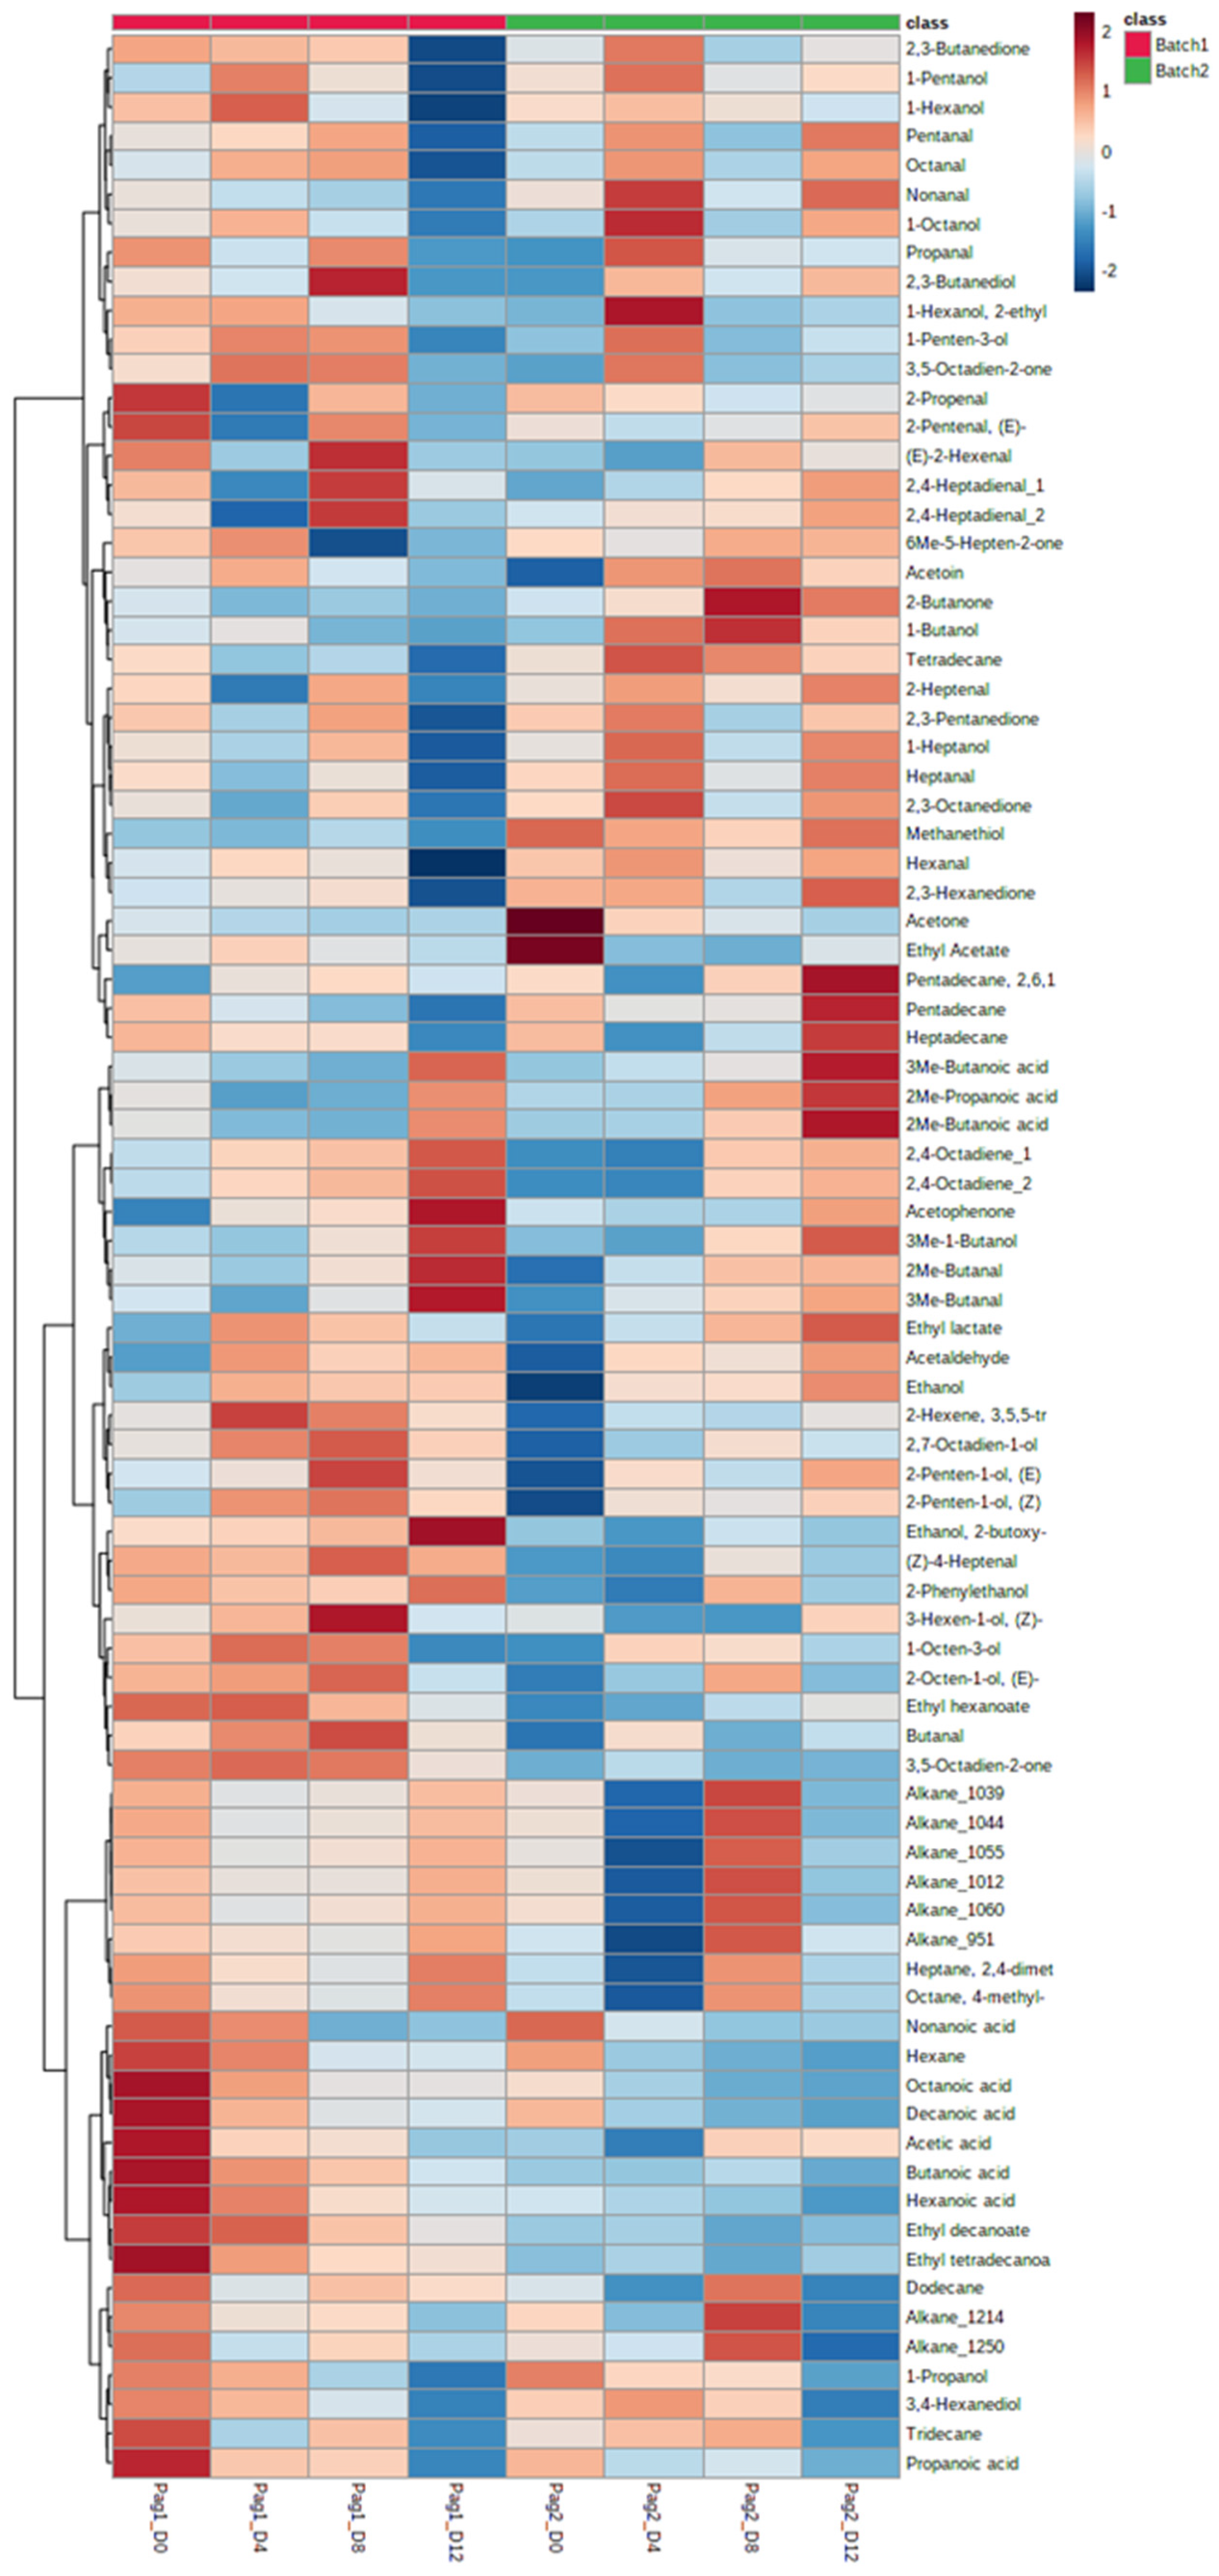
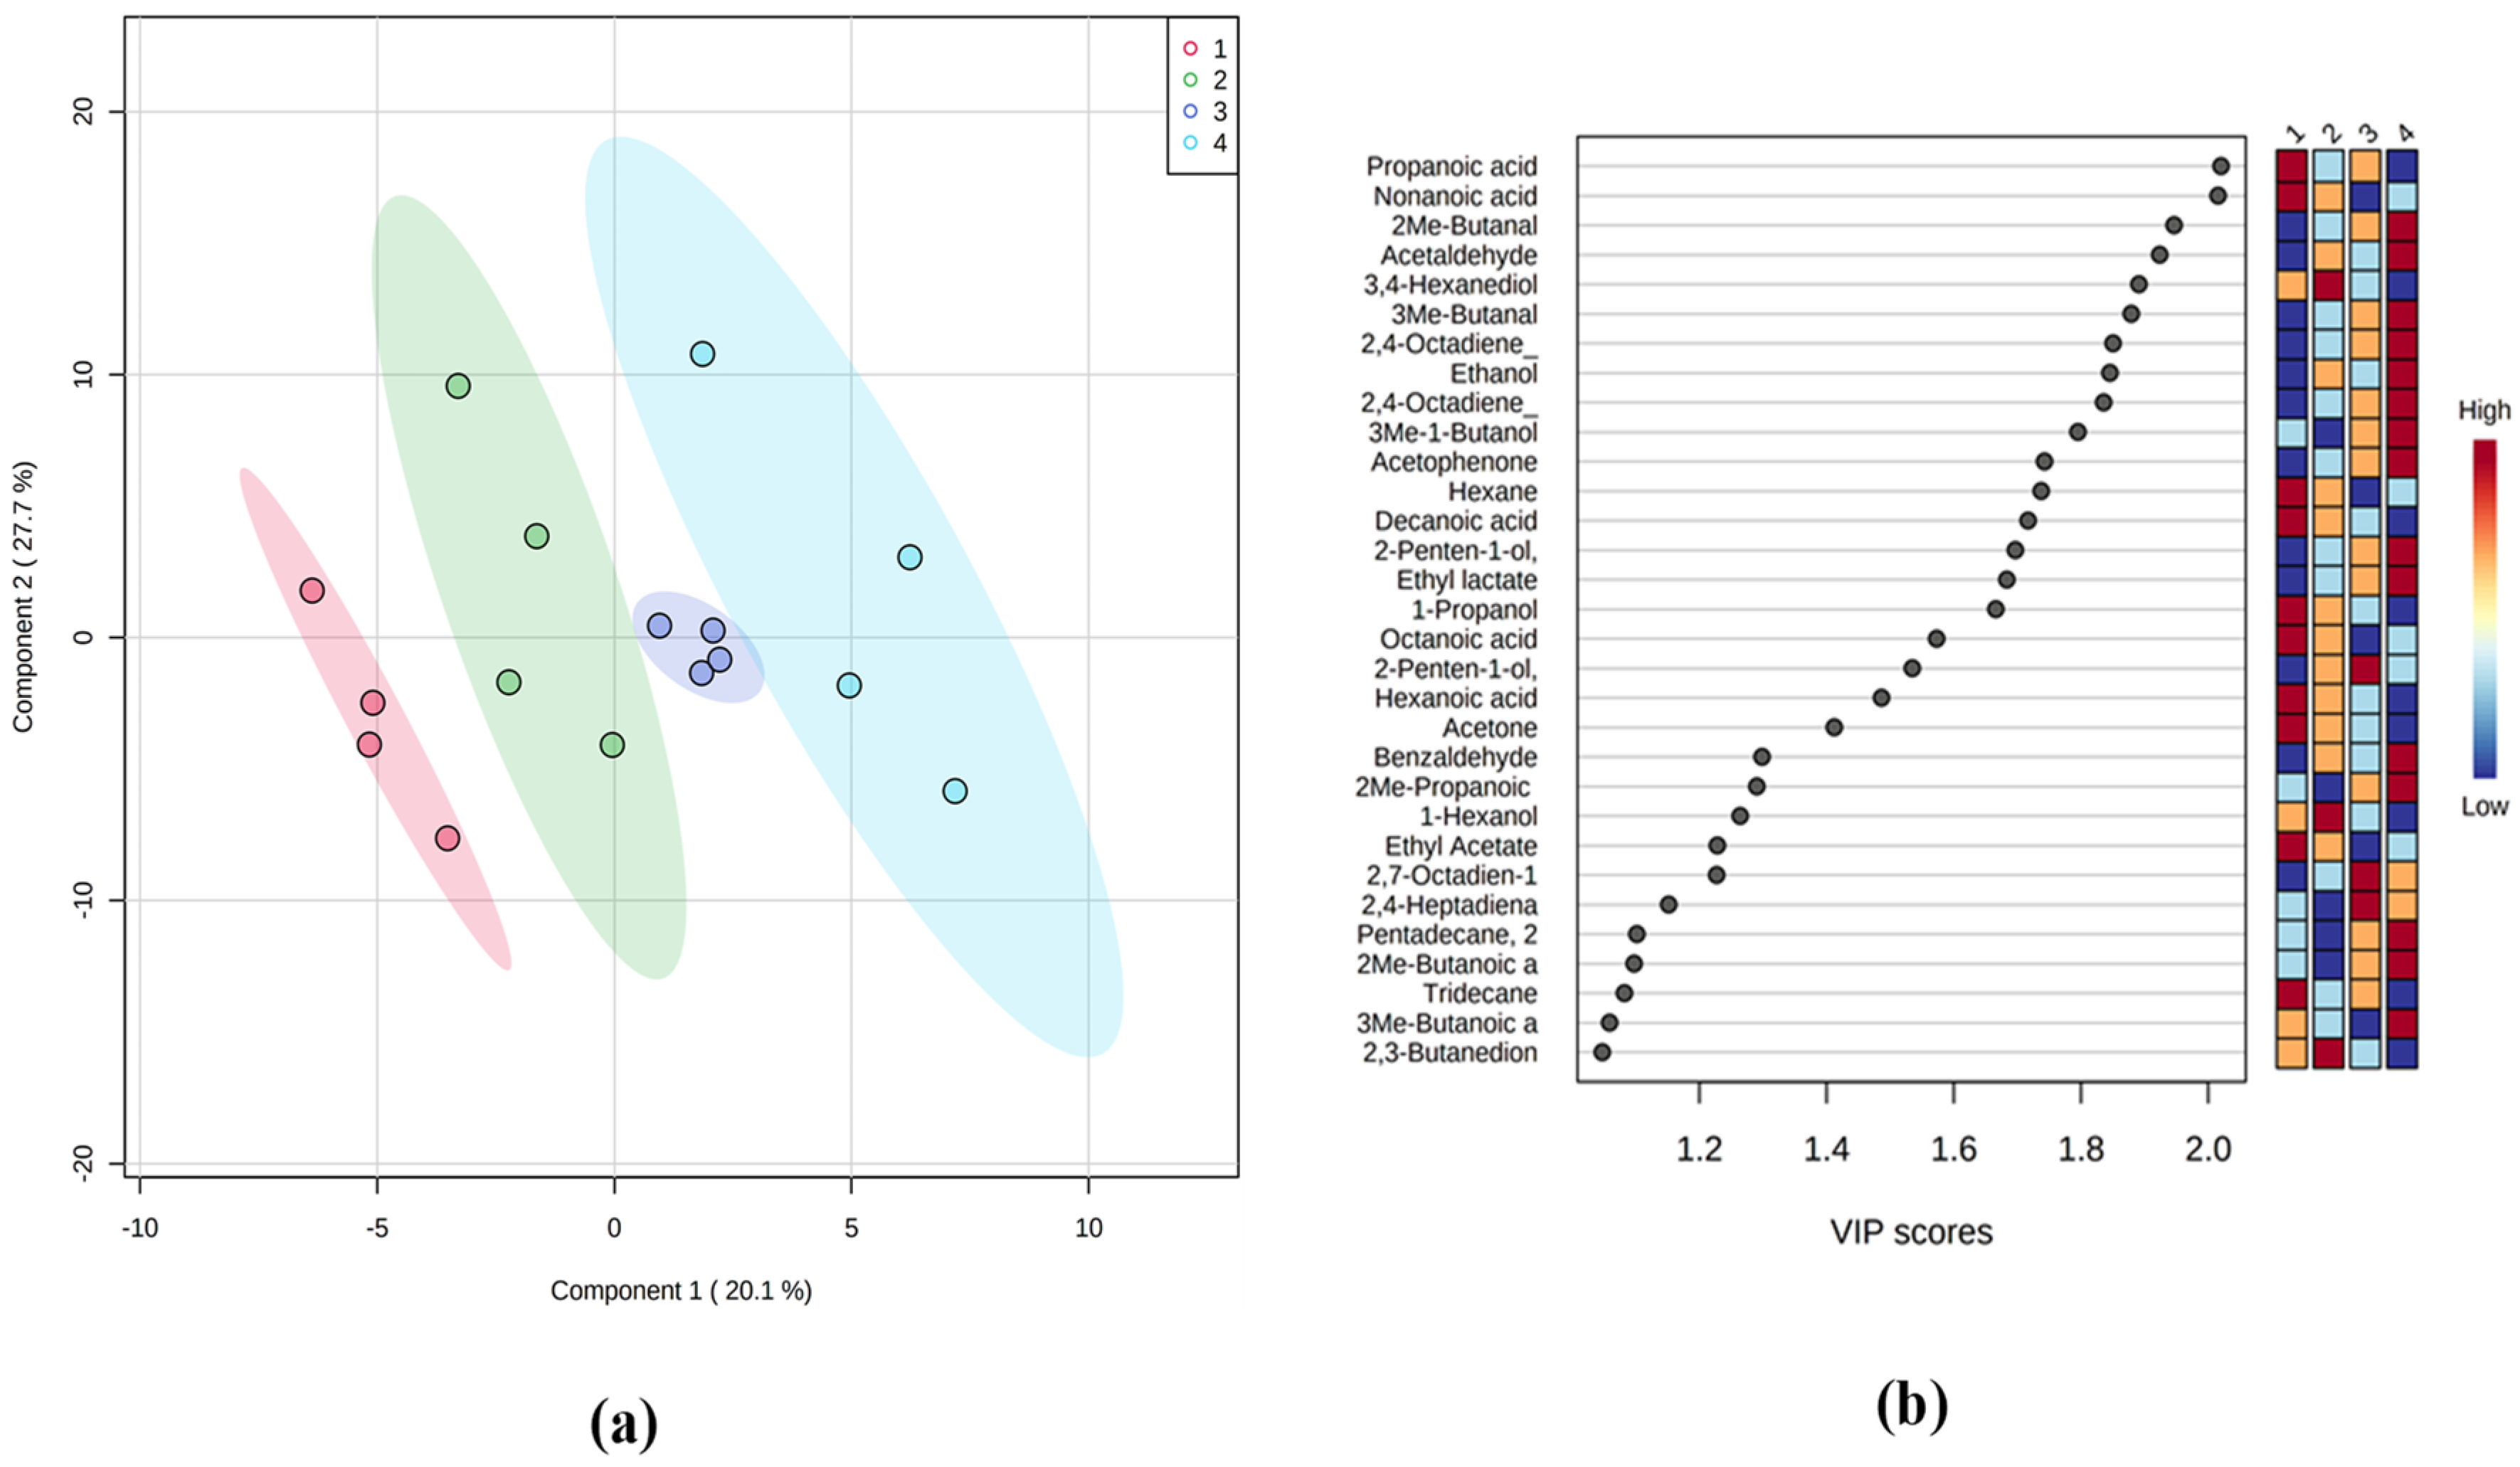
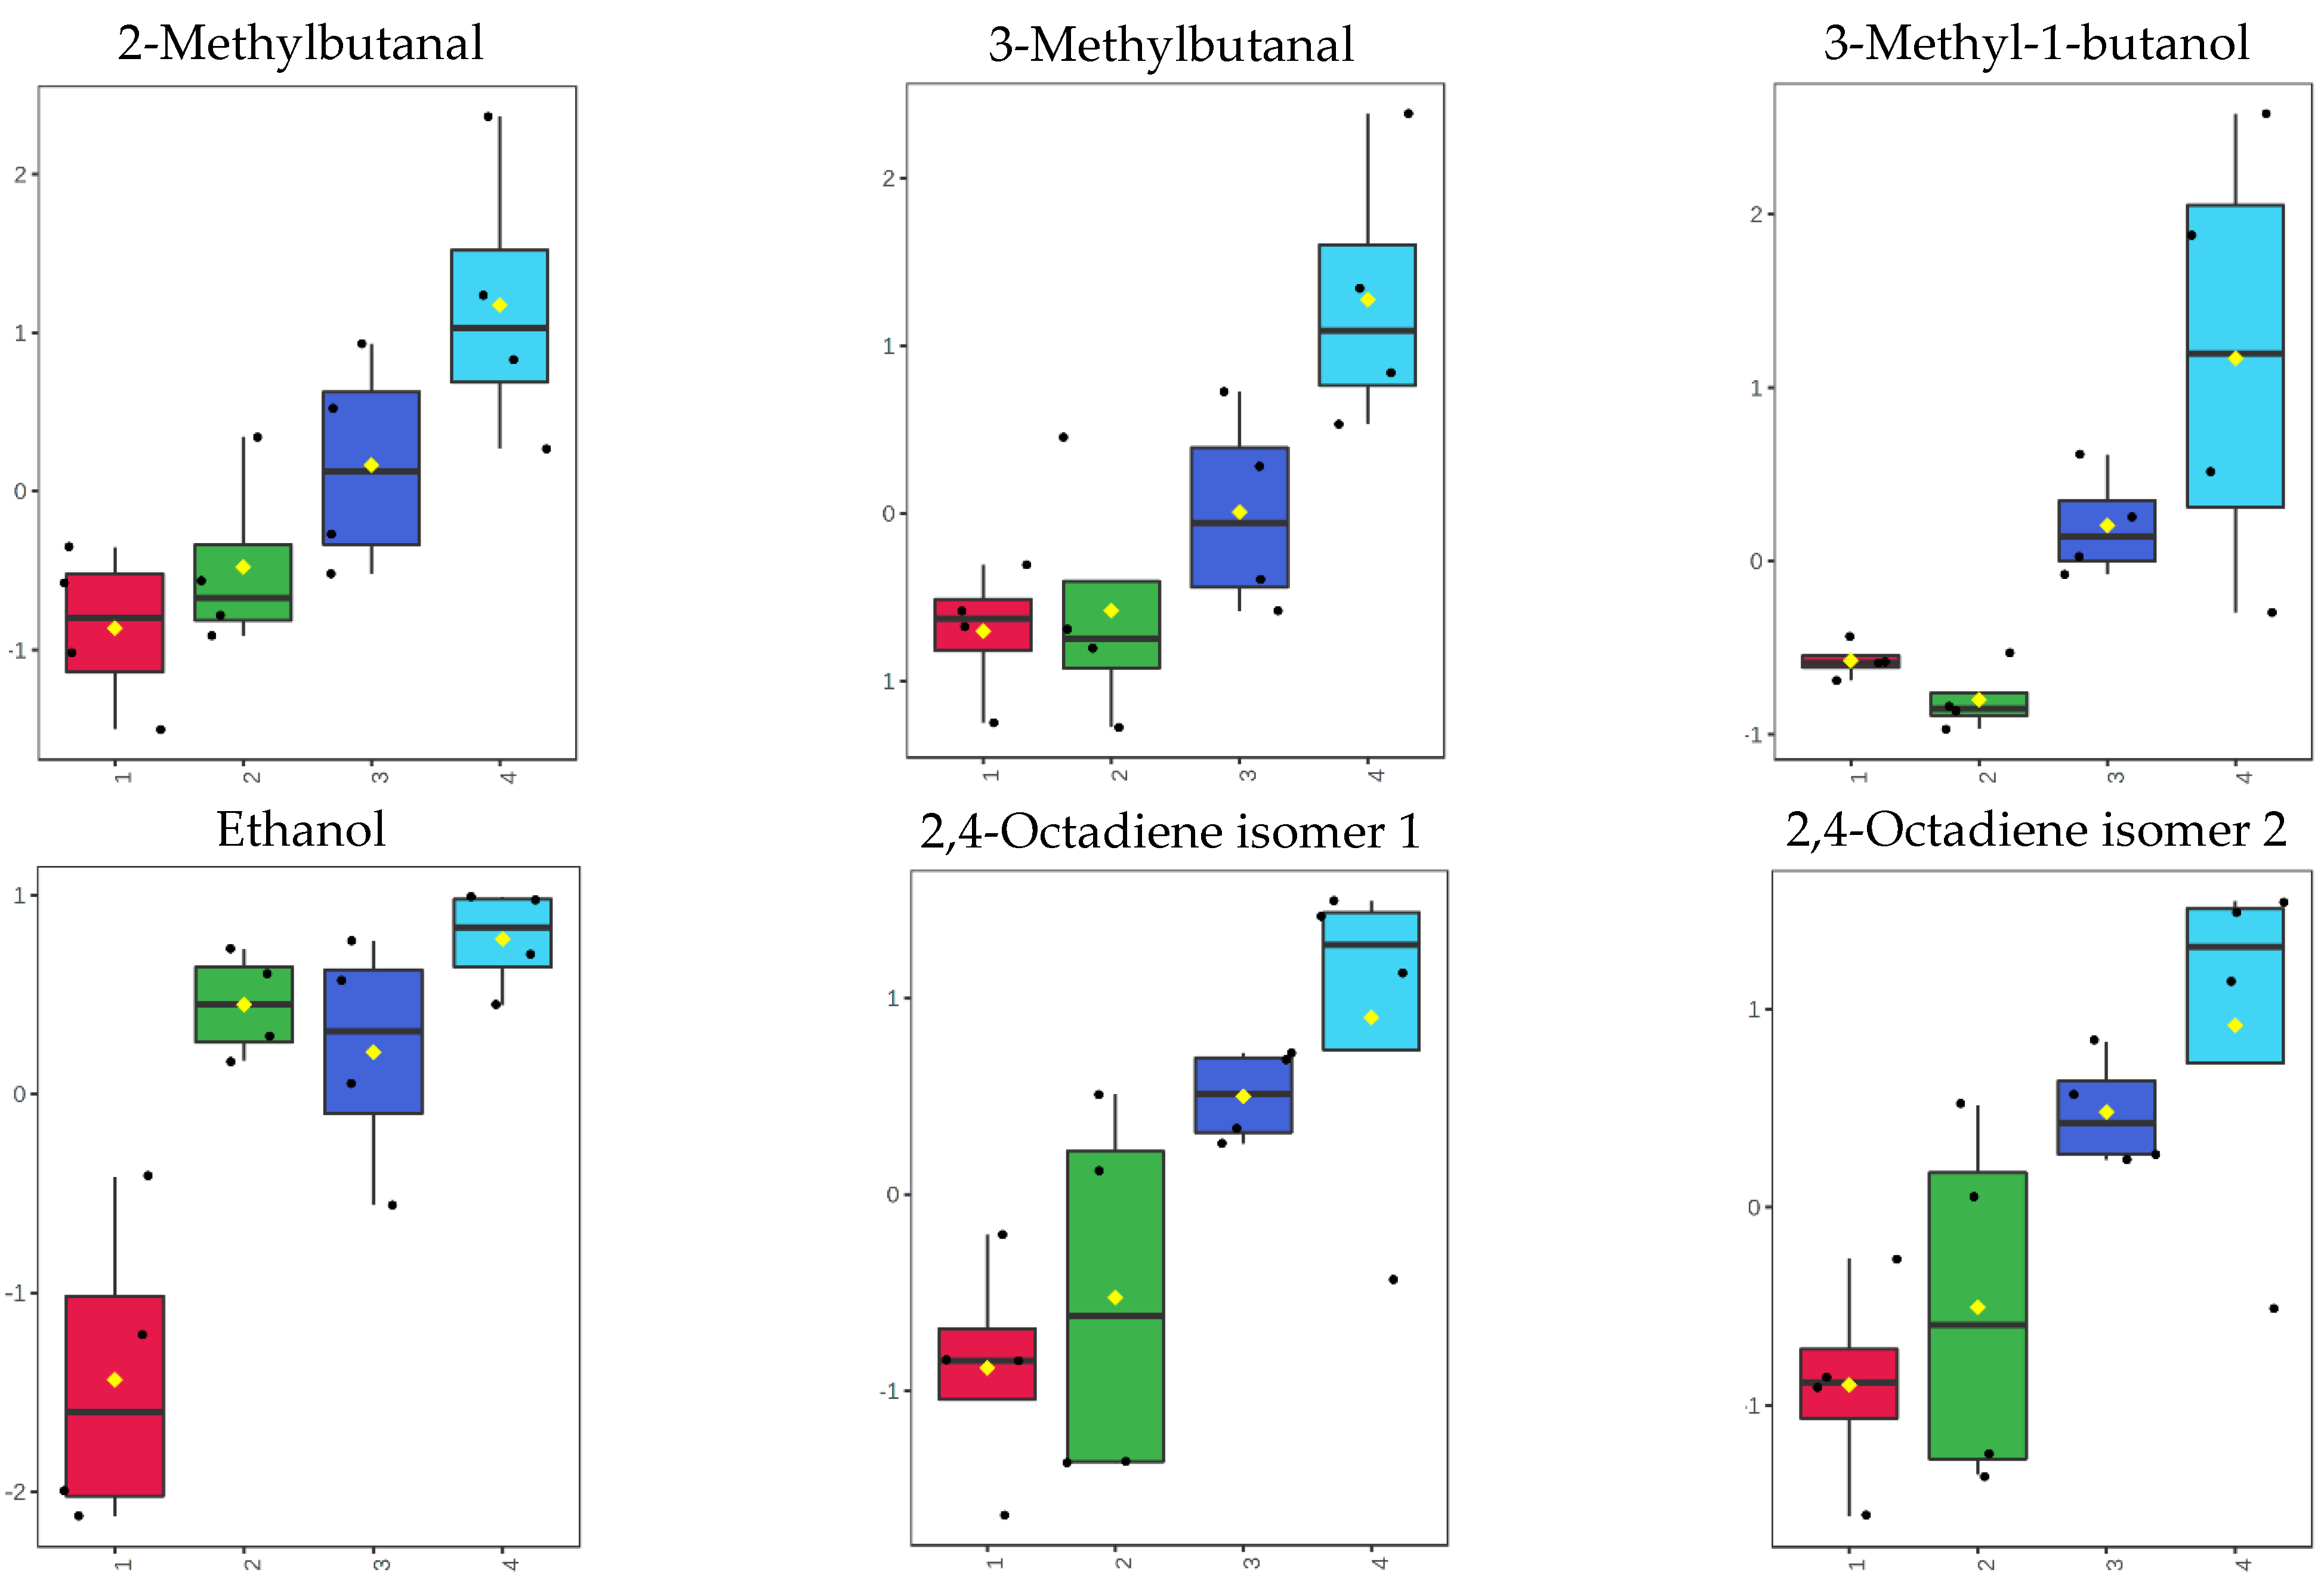
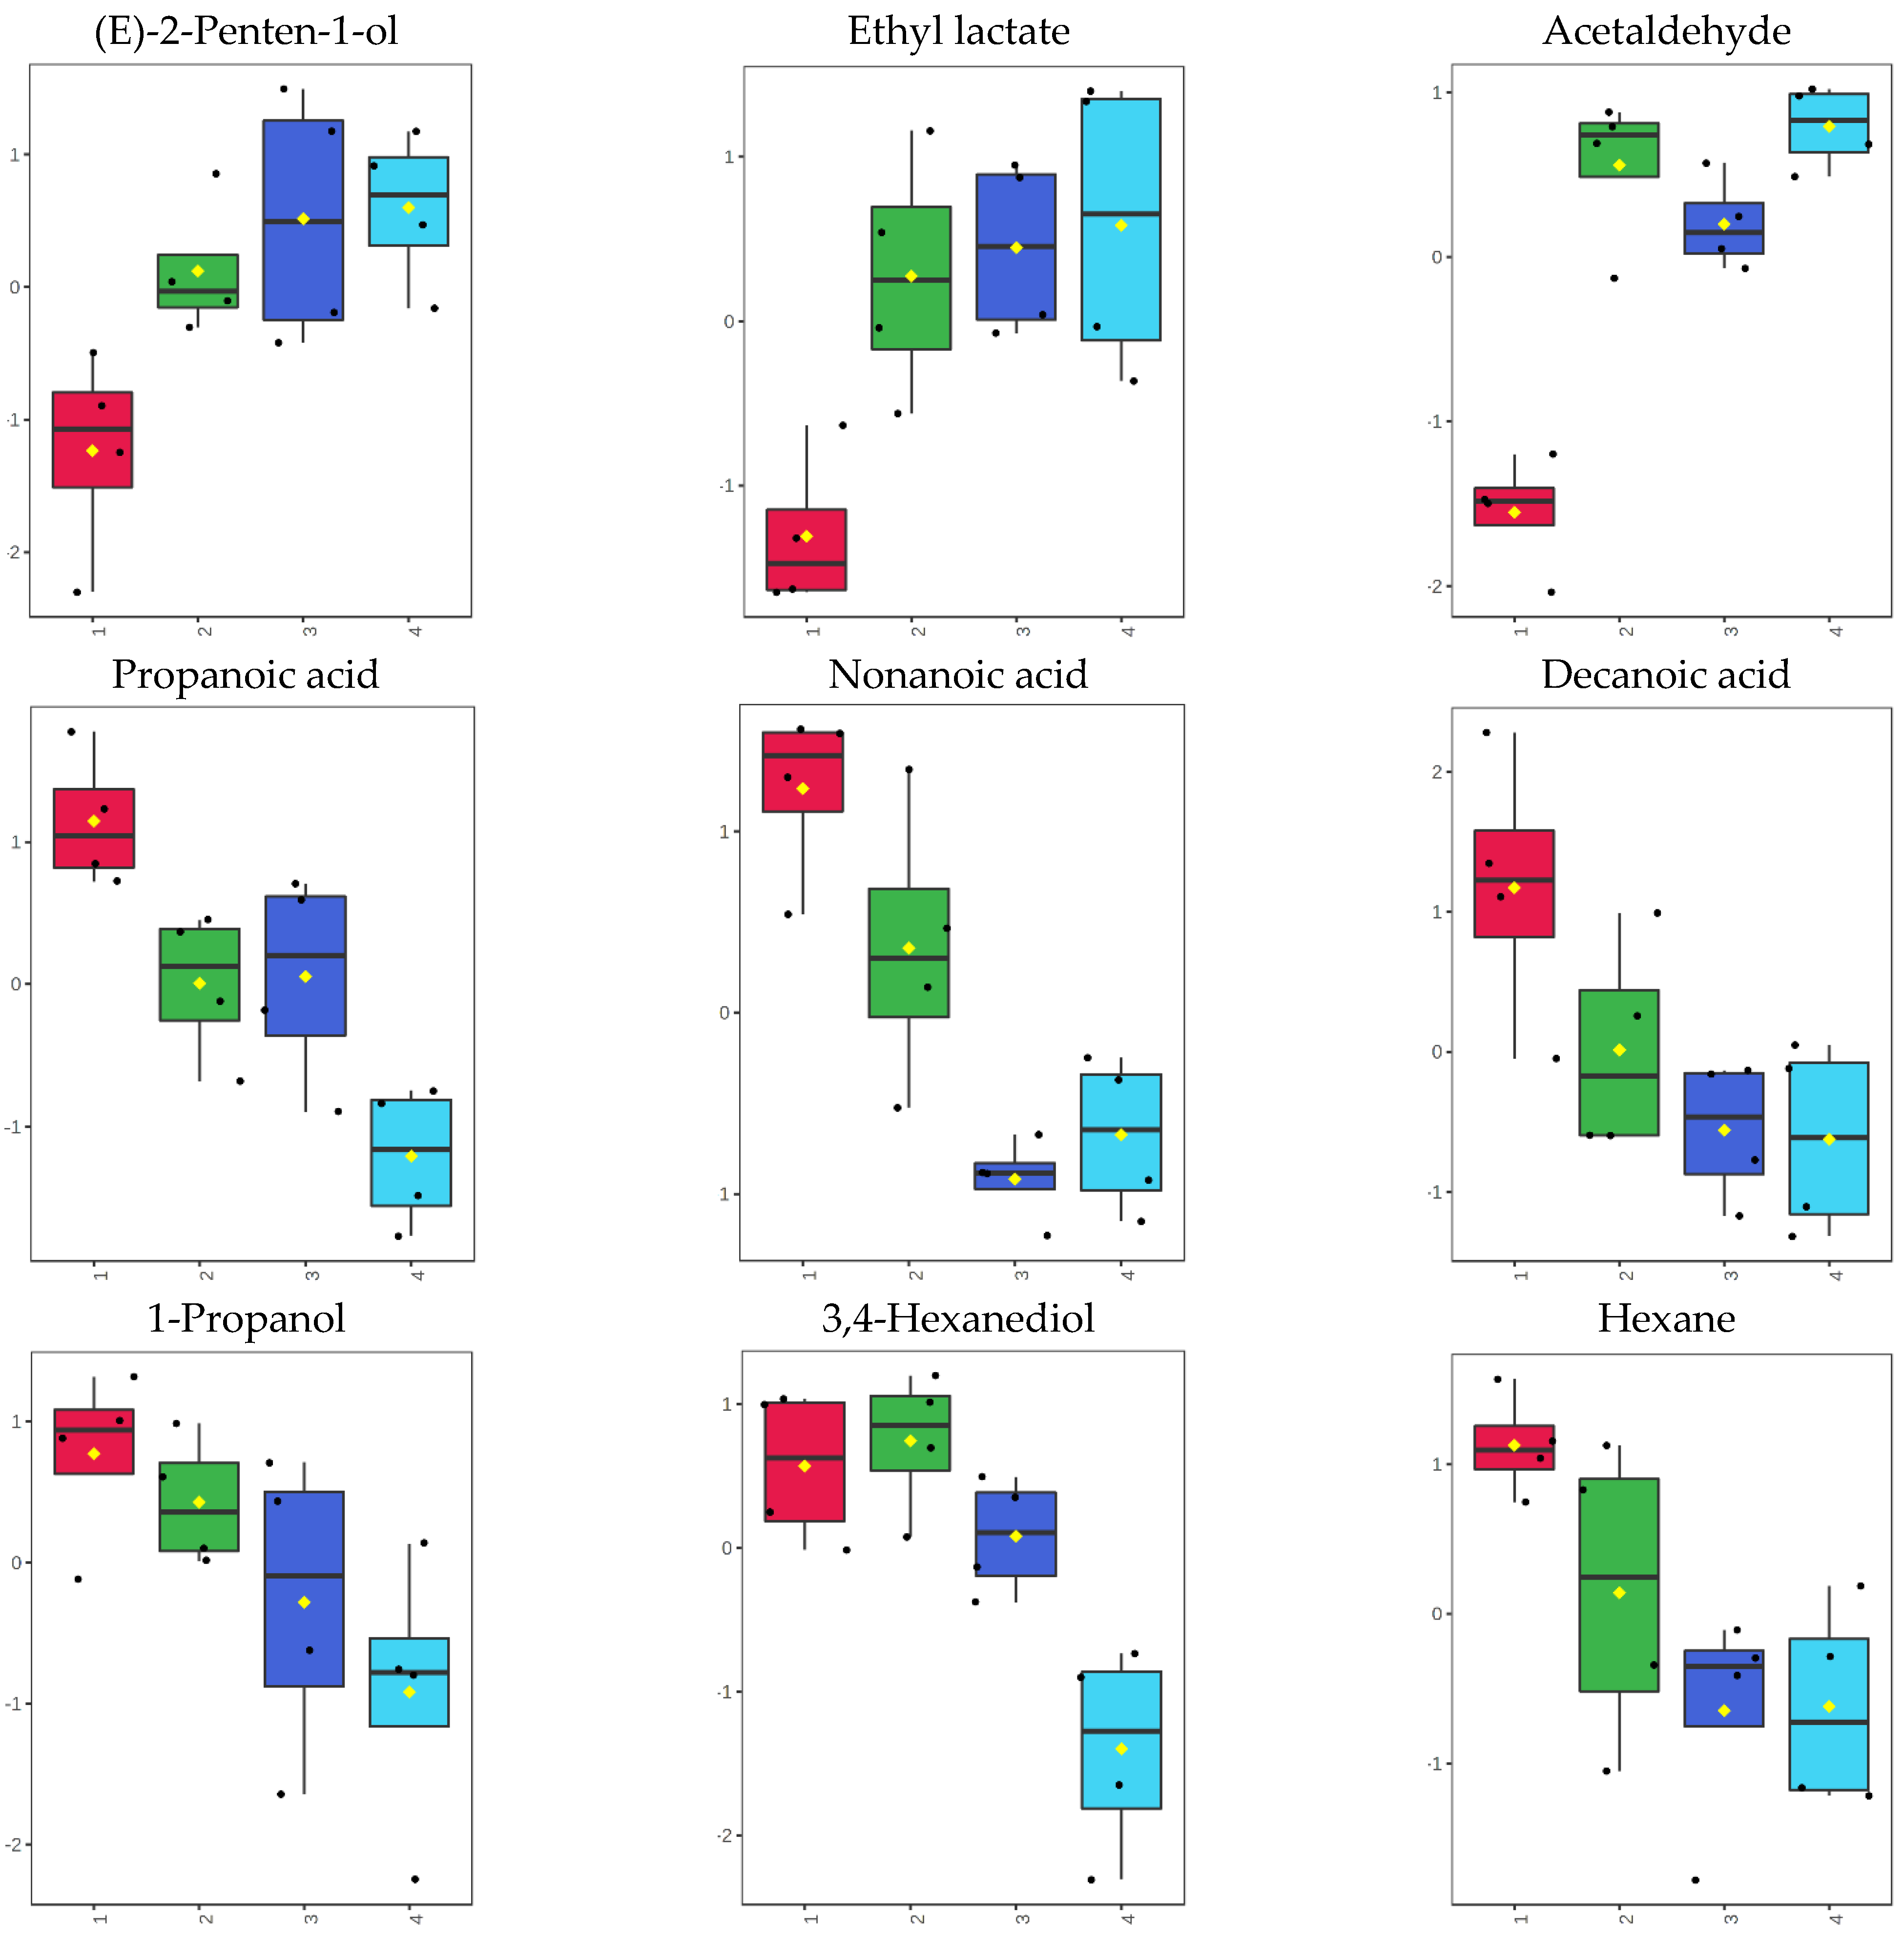
3.4. Volatilome during Fish Storage on Ice
4. Discussion
5. Conclusions
Supplementary Materials
Author Contributions
Funding
Informed Consent Statement
Data Availability Statement
Conflicts of Interest
References
- Eggleston, D. Sparidae. In FAO Species Identification Sheets for Fishery Purposes. Eastern Indian Ocean (Fishing Area 57) and Western Central Pacific (Fishing Area 71); Fischer, W., Whitehead, P.J., Eds.; FAO: Rome, Italy, 1974. [Google Scholar]
- Watanabe, W.O.; Alam, M.S.; Carroll, P.M.; Daniels, H.V.; Hinshaw, J.M. Marine Finfish Aquaculture. In Aquaculture: Farming Aquatic Animals and Plants; Lucas, J.S., Southgate, P.C., Tucker, C.S., Eds.; John Wiley & Sons Ltd.: Hoboken, NJ, USA, 2019; pp. 437–482. ISBN 978-1-119-23086-1. [Google Scholar]
- Pavlidis, M.; Mylonas, C. Sparidae: Biology and Aquaculture of Gilthead Sea Bream and Other Species; John Wiley & Sons Ltd.: Hoboken, NJ, USA, 2011; p. 1036. [Google Scholar]
- Makino, M. Fisheries and Aquaculture Division; FAO: Rome, Italy, 2021. [Google Scholar]
- Hong, W.; Zhang, Q. Review of captive bred species and fry production of marine fish in China. Aquaculture 2003, 227, 305–318. [Google Scholar] [CrossRef]
- Stephen, N.; Yoshinari, E. Krill Fisheries of the World; FAO Fisheries Technical Paper 367; FAO: Rome, Italy, 1997; 100p. [Google Scholar]
- FGM (Federation of Greek Maricultures). Aquaculture in Greece 2019; Annual Report; FGM: Athens, Greece, 2019; 60p. (In Greek) [Google Scholar]
- Anagnostopoulos, D.A.; Parlapani, F.F.; Boziaris, I.S. The evolution of knowledge on seafood spoilage microbiota from the 20th to the 21st century: Have we finished or just begun? Trends Food Sci. Technol. 2022, 120, 236–247. [Google Scholar] [CrossRef]
- Gram, L.; Huss, H.H. Microbiological spoilage of fish and fish products. Int. J. Food Microbiol. 1996, 33, 121–137. [Google Scholar] [CrossRef]
- Boziaris, I.S.; Parlapani, F.F. Specific Spoilage Organisms (SSOs) in Fish. In The Microbiological Quality of Food; Woodhead Publishing: Cambridge, UK, 2017; pp. 61–98. [Google Scholar] [CrossRef]
- Parlapani, F.F.; Michailidou, S.; Anagnostopoulos, D.A.; Sakellariou, A.K.; Pasentsis, K.; Psomopoulos, F.; Argiriou, A.; Haroutounian, S.A.; Boziaris, I.S. Microbial spoilage investigation of thawed common cuttlefish (Sepia officinalis) stored at 2 °C using next generation sequencing and volatilome analysis. Food Microbiol. 2018, 76, 518–525. [Google Scholar] [CrossRef] [PubMed]
- Parlapani, F.F.; Michailidou, S.; Pasentsis, K.; Argiriou, A.; Krey, G.; Boziaris, I.S. A meta-barcoding approach to assess and compare the storage temperature-dependent bacterial diversity of gilt-head sea bream (Sparus aurata) originating from fish farms from two geographically distinct areas of Greece. Int. J. Food Microbiol. 2018, 278, 36–43. [Google Scholar] [CrossRef]
- Parlapani, F.F.; Ferrocino, I.; Michailidou, S.; Argiriou, A.; Haroutounian, S.A.; Kokokiris, L.; Rantsiou, K.; Boziaris, I.S. Microbiota and volatilome profile of fresh and chill-stored deepwater rose shrimp (Parapenaeus longirostris). Food Res. Int. 2020, 132, 109057. [Google Scholar] [CrossRef]
- Maillet, A.; Bouju-Albert, A.; Roblin, S.; Vaissié, P.; Leuillet, S.; Dousset, X.; Jaffrès, E.; Combrisson, J.; Prévost, H. Impact of DNA extraction and sampling methods on bacterial communities monitored by 16S rDNA metabarcoding in cold-smoked salmon and processing plant surfaces. Food Microbiol. 2021, 95, 103705. [Google Scholar] [CrossRef]
- Castro, P.; Padrón, J.C.P.; Cansino, M.J.C.; Velázquez, E.S.; Larriva, R.M. De Total volatile base nitrogen and its use to assess freshness in European sea bass stored in ice. Food Control 2006, 17, 245–248. [Google Scholar] [CrossRef]
- Parlapani, F.F.; Haroutounian, S.A.; Nychas, G.J.E.; Boziaris, I.S. Microbiological spoilage and volatiles production of gutted European sea bass stored under air and commercial modified atmosphere package at 2 °C. Food Microbiol. 2015, 50, 44–53. [Google Scholar] [CrossRef]
- Howgate, P.; Johnston, A.; Whittle, K.J. Multilingual Guide to EC Freshness Grades for Fishery Products. 1992. Available online: http://www.fao.org/3/x5995e/x5995e00.htm (accessed on 25 December 2021).
- Syropoulou, F.; Parlapani, F.F.; Anagnostopoulos, D.A.; Stamatiou, A.; Mallouchos, A.; Boziaris, I.S. Spoilage Investigation of Chill Stored Meagre (Argyrosomus regius) Using Modern Microbiological and Analytical Techniques. Foods 2021, 10, 3109. [Google Scholar] [CrossRef]
- Pang, Z.; Chong, J.; Zhou, G.; De Lima Morais, D.A.; Chang, L.; Barrette, M.; Gauthier, C.; Jacques, P.É.; Li, S.; Xia, J. MetaboAnalyst 5.0: Narrowing the gap between raw spectra and functional insights. Nucleic Acids Res. 2021, 49, W388–W396. [Google Scholar] [CrossRef] [PubMed]
- Xia, J.; Psychogios, N.; Young, N.; Wishart, D.S. MetaboAnalyst: A web server for metabolomic data analysis and interpretation. Nucleic Acids Res. 2009, 37, W652–W660. [Google Scholar] [CrossRef] [PubMed] [Green Version]
- Thévenot, E.A.; Roux, A.; Xu, Y.; Ezan, E.; Junot, C. Analysis of the Human Adult Urinary Metabolome Variations with Age, Body Mass Index, and Gender by Implementing a Comprehensive Workflow for Univariate and OPLS Statistical Analyses. J. Proteome Res. 2015, 14, 3322–3335. [Google Scholar] [CrossRef] [PubMed]
- Dieterle, F.; Ross, A.; Schlotterbeck, G.; Senn, H. Probabilistic Quotient Normalization as Robust Method to Account for Dilution of Complex Biological Mixtures. Application in 1H NMR Metabonomics. Anal. Chem. 2006, 78, 4281–4290. [Google Scholar] [CrossRef]
- Parlapani, F.F.; Boziaris, I.S. Monitoring of spoilage and determination of microbial communities based on 16S rRNA gene sequence analysis of whole sea bream stored at various temperatures. LWT Food Sci. Technol. 2016, 66, 553–559. [Google Scholar] [CrossRef]
- Parlapani, F.F.; Mallouchos, A.; Haroutounian, S.A.; Boziaris, I.S. Microbiological spoilage and investigation of volatile profile during storage of sea bream fillets under various conditions. Int. J. Food Microbiol. 2014, 189, 153–163. [Google Scholar] [CrossRef]
- Syropoulou, F.; Parlapani, F.F.; Bosmali, I.; Madesis, P.; Boziaris, I.S. HRM and 16S rRNA gene sequencing reveal the cultivable microbiota of the European sea bass during ice storage. Int. J. Food Microbiol. 2020, 327, 108658. [Google Scholar] [CrossRef]
- Syropoulou, F.; Parlapani, F.F.; Kakasis, S.; Nychas, G.J.E.; Boziaris, I.S. Primary Processing and Storage Affect the Dominant Microbiota of Fresh and Chill-Stored Sea Bass Products. Foods 2021, 10, 671. [Google Scholar] [CrossRef] [PubMed]
- Chen, H.; Wang, M.; Yang, C.; Wan, X.; Ding, H.H.; Shi, Y.; Zhao, C. Bacterial spoilage profiles in the gills of Pacific oysters (Crassostrea gigas) and Eastern oysters (C. virginica) during refrigerated storage. Food Microbiol. 2019, 82, 209–217. [Google Scholar] [CrossRef]
- Parlapani, F.F.; Michailidou, S.; Anagnostopoulos, D.A.; Koromilas, S.; Kios, K.; Pasentsis, K.; Psomopoulos, F.; Argiriou, A.; Haroutounian, S.A.; Boziaris, I.S. Bacterial communities and potential spoilage markers of whole blue crab (Callinectes sapidus) stored under commercial simulated conditions. Food Microbiol. 2019, 82, 325–333. [Google Scholar] [CrossRef]
- Ramachandran, P.; Reed, E.; Ottesen, A. Exploring the microbiome of Callinectes sapidus (Maryland blue crab). Genome Announc. 2018, 6, e00466-18. [Google Scholar] [CrossRef] [PubMed] [Green Version]
- Wu, Z.; Zhang, Q.; Lin, Y.; Hao, J.; Wang, S.; Zhang, J.; Li, A.; Wu, Z.; Zhang, Q.; Lin, Y.; et al. Taxonomic and Functional Characteristics of the Gill and Gastrointestinal Microbiota and Its Correlation with Intestinal Metabolites in NEW GIFT Strain of Farmed Adult Nile Tilapia (Oreochromis niloticus). Microorganisms 2021, 9, 617. [Google Scholar] [CrossRef] [PubMed]
- Zotta, T.; Parente, E.; Ianniello, R.G.; De Filippis, F.; Ricciardi, A. Dynamics of bacterial communities and interaction networks in thawed fish fillets during chilled storage in air. Int. J. Food Microbiol. 2019, 293, 102–113. [Google Scholar] [CrossRef] [PubMed]
- Fang, Q.; Feng, Y.; Feng, P.; Wang, X.; Zong, Z. Nosocomial bloodstream infection and the emerging carbapenem-resistant pathogen Ralstonia insidiosa. BMC Infect. Dis. 2019, 19, 334. [Google Scholar] [CrossRef] [Green Version]
- Nasir, N.; Sayeed, M.A.; Jamil, B. Ralstonia pickettii Bacteremia: An Emerging Infection in a Tertiary Care Hospital Setting. Cureus 2019, 11, e5084. [Google Scholar] [CrossRef] [Green Version]
- Wamala, S.P.; Mugimba, K.K.; Mutoloki, S.; Evensen, O.; Mdegela, R.; Byarugaba, D.K.; Sørum, H. Occurrence and antibiotic susceptibility of fish bacteria isolated from Oreochromis niloticus (Nile tilapia) and Clarias gariepinus (African catfish) in Uganda. Fish. Aquat. Sci. 2018, 21, 6. [Google Scholar] [CrossRef]
- Mollerup, S.; Friis-Nielsen, J.; Vinner, L.; Hansen, T.A.; Richter, S.R.; Fridholm, H.; Herrera, J.A.R.; Lund, O.; Brunak, S.; Izarzugaz, J.M.G.; et al. Propionibacterium acnes: Disease-causing agent or common contaminant? Detection in diverse patient samples by next-generation sequencing. J. Clin. Microbiol. 2016, 54, 980–987. [Google Scholar] [CrossRef] [Green Version]
- Dalgaard, P. Spoilage of seafood. In Encyclopedia of Food Science and Nutrition; Caballero, B., Trugo, L., Finglas, P., Eds.; Academic Press: London, UK, 2003; pp. 2462–2472. [Google Scholar]
- Parlapani, F.F. Microbial diversity of seafood. Curr. Opin. Food Sci. 2021, 37, 45–51. [Google Scholar] [CrossRef]
- Gram, L.; Ravn, L.; Rasch, M.; Bruhn, J.B.; Christensen, A.B.; Givskov, M. Food spoilage—Interactions between food spoilage bacteria. Int. J. Food Microbiol. 2002, 78, 79–97. [Google Scholar] [CrossRef]
- Parlapani, F.F.; Kormas, K.A.; Boziaris, I.S. Microbiological changes, shelf life and identification of initial and spoilage microbiota of sea bream fillets stored under various conditions using 16S rRNA gene analysis. J. Sci. Food Agric. 2015, 95, 2386–2394. [Google Scholar] [CrossRef]
- Maillet, A.; Denojean, P.; Bouju-Albert, A.; Scaon, E.; Leuillet, S.; Dousset, X.; Jaffrès, E.; Combrisson, J.; Prévost, H. Characterization of Bacterial Communities of Cold-Smoked Salmon during Storage. Foods 2021, 10, 362. [Google Scholar] [CrossRef]
- Bekaert, K.; Devriese, L.; Maes, S.; Robbens, J. Characterization of the dominant bacterial communities during storage of Norway lobster and Norway lobster tails (Nephrops norvegicus) based on 16S rDNA analysis by PCR-DGGE. Food Microbiol. 2015, 46, 132–138. [Google Scholar] [CrossRef] [PubMed]
- Broekaert, K.; Heyndrickx, M.; Herman, L.; Devlieghere, F.; Vlaemynck, G. Molecular identification of the microbiota of peeled and unpeeled brown shrimp (Crangon crangon) during storage on ice and at 7.5 °C. Food Microbiol. 2013, 36, 123–134. [Google Scholar] [CrossRef] [PubMed]
- Kuuliala, L.; Al Hage, Y.; Ioannidis, A.G.; Sader, M.; Kerckhof, F.M.; Vanderroost, M.; Boon, N.; De Baets, B.; De Meulenaer, B.; Ragaert, P.; et al. Microbiological, chemical and sensory spoilage analysis of raw Atlantic cod (Gadus morhua) stored under modified atmospheres. Food Microbiol. 2018, 70, 232–244. [Google Scholar] [CrossRef] [PubMed]
- Gram, L.; Dalgaard, P. Fish spoilage bacteria—Problems and solutions. Curr. Opin. Biotechnol. 2002, 13, 262–266. [Google Scholar] [CrossRef]
- Tryfinopoulou, P.; Tsakalidou, E.; Nychas, G.J.E. Characterization of Pseudomonas spp. associated with spoilage of gilt-head sea bream stored under various conditions. Appl. Environ. Microbiol. 2002, 68, 65–72. [Google Scholar] [CrossRef] [Green Version]
- Broekaert, K.; Noseda, B.; Heyndrickx, M.; Vlaemynck, G.; Devlieghere, F. Volatile compounds associated with Psychrobacter spp. and Pseudoalteromonas spp., the dominant microbiota of brown shrimp (Crangon crangon) during aerobic storage. Int. J. Food Microbiol. 2013, 166, 487–493. [Google Scholar] [CrossRef]
- Parlapani, F.F.; Mallouchos, A.; Haroutounian, S.A.; Boziaris, I.S. Volatile organic compounds of microbial and non-microbial origin produced on model fish substrate un-inoculated and inoculated with gilt-head sea bream spoilage bacteria. LWT 2017, 78, 54–62. [Google Scholar] [CrossRef]


Publisher’s Note: MDPI stays neutral with regard to jurisdictional claims in published maps and institutional affiliations. |
© 2022 by the authors. Licensee MDPI, Basel, Switzerland. This article is an open access article distributed under the terms and conditions of the Creative Commons Attribution (CC BY) license (https://creativecommons.org/licenses/by/4.0/).
Share and Cite
Anagnostopoulos, D.A.; Parlapani, F.F.; Mallouchos, A.; Angelidou, A.; Syropoulou, F.; Minos, G.; Boziaris, I.S. Volatile Organic Compounds and 16S Metabarcoding in Ice-Stored Red Seabream Pagrus major. Foods 2022, 11, 666. https://doi.org/10.3390/foods11050666
Anagnostopoulos DA, Parlapani FF, Mallouchos A, Angelidou A, Syropoulou F, Minos G, Boziaris IS. Volatile Organic Compounds and 16S Metabarcoding in Ice-Stored Red Seabream Pagrus major. Foods. 2022; 11(5):666. https://doi.org/10.3390/foods11050666
Chicago/Turabian StyleAnagnostopoulos, Dimitrios A., Foteini F. Parlapani, Athanasios Mallouchos, Aikaterini Angelidou, Faidra Syropoulou, George Minos, and Ioannis S. Boziaris. 2022. "Volatile Organic Compounds and 16S Metabarcoding in Ice-Stored Red Seabream Pagrus major" Foods 11, no. 5: 666. https://doi.org/10.3390/foods11050666