Physiological and Gene Expression Analysis of Herbaceous Peony Resistance to Alternaria tenuissima Infection

College of Forestry, Shandong Agricultural University, Tai’an 271018, China
*
Author to whom correspondence should be addressed.
†
These authors contributed equally to this work.
Horticulturae 2023, 9(8), 862; https://doi.org/10.3390/horticulturae9080862
Submission received: 26 June 2023
/
Revised: 24 July 2023
/
Accepted: 26 July 2023
/
Published: 28 July 2023
(This article belongs to the Section Plant Pathology and Disease Management (PPDM))
Abstract
:Leaf spot disease caused by Alternaria pathogens seriously threatens peony production. The physiological mechanism of peony resistance to the pathogen is little reported. This study aimed to reveal the defensive mechanism of peonies in response to the pathogen Alternaria tenuissima. The disease-resistant (R) variety ‘Zi Fengyu’ and susceptible (S) variety ‘Heihai Botao’ were employed, and some parameters in the leaves were analyzed after inoculation with A. tenuissima, mainly including the hypersensitive response (HR), activity of defensive enzymes, and expression of disease-resistance genes. The results showed that compared with the responses in the S genotype, HR occurred more rapidly in the R genotype. Meanwhile, the activity of antioxidant enzymes (superoxide dismutase, peroxidase, catalase, and ascorbate peroxidase) and other two defense enzymes (polyphenol oxidase and phenylalanine ammonia-lyase) increased more significantly, and the expression of pathogenesis-related (PR) genes (PlPR1, PlPR2, PlPR4B, PlPR5, and PlPR10) and two WRKY genes (PlWRKY13 and PlWRKY65) was more strongly induced. These responses collectively contributed to the disease resistance of the R genotype. These findings provided a theoretical basis for understanding the intrinsic mechanism of peony resistance to Alternaria leaf spot disease and breeding the disease-resistant peony varieties using a molecular approach.
1. Introduction
Herbaceous peony (Paeonia lactiflora Pall.), a traditional famous flower in China, holds significance in medicinal cultivation, landscaping, and cut floral crop production [1]. In recent years, peony production has increased rapidly in China, and the planting area of peonies has increasingly expanded. Some epidemic diseases have simultaneously become prominent, accompanied by the expansion of planting areas. Leaf spot disease caused by Alternaria is one of the common epidemic diseases seriously threatening the efficiency of peony production [2,3]. It can lead to leaf scorching, which seriously affects photosynthesis and the translocation of photosynthetic products to roots. Consequently, the formation and differentiation of underground buds are hindered, and the growth and flowering of peony plants in subsequent years are greatly influenced [2,3]. Understanding the physiological and gene expression differences between resistant and susceptible varieties in response to the pathogen may help explain the internal mechanism of peony–pathogen interaction and breed resistant peony varieties.
When plants are attacked by pathogens, a variety of physiological responses are triggered. Hypersensitive response (HR) is considered one of the frequently observed responses, and the localized induced cell death in the host plant at the infected sites can limit pathogen growth [4,5]. It is also largely documented that when plants are subjected to stresses such as pathogen infection, malondialdehyde (MDA) often accumulates as resultant lipid peroxidation products in the plants due to the burst of reactive oxygen species (ROS) and is therefore widely used as a reliable indicator of the degree of oxidative stress [6,7]. The antioxidant enzyme system quickly removes excess ROS to defend against pathogen infection. Superoxide dismutase (SOD), peroxidase (POD), catalase (CAT), and ascorbate peroxidase (APX) are the main antioxidant enzymes involved [7,8,9]. For example, SOD dismutates superoxide ion (O2·−) to H2O2 and O2, CAT dismutates H2O2 to O2 and H2O, and APX reduces H2O2 to H2O using ascorbate as a specific electron donor [7]. In addition, polyphenol oxidase (PPO) and phenylalanine ammonia-lyase (PAL) also play an essential role in the defense against pathogens by participating in the metabolism of phenolic substances and phenylalanine to form disease-related substances such as quinones and antitoxins [5,10]. At the molecular level, many studies have determined that transcripts of a range of pathogenesis-related (PR) genes would rapidly accumulate in response to pathogens attack and PR proteins play a vital role in the early defensive events against pathogenic organisms [11,12,13,14]. So far, about 19 families of PR proteins have been reported [14]. Through a variety of ways such as participating in signaling pathways, producing resistant compounds, and destroying the tissue structure of pathogens, these PR proteins directly or indirectly alleviate the damage caused by pathogens, thereby contributing to the plant’s ability to withstand and combat the infection [13,14]. Similarly, a large number of studies have demonstrated that many WRKY transcription factors play an essential role in the early responses of plant disease resistance. This is achieved through their involvement in the mitogen-activated protein kinase cascade pathway, or by activating or inhibiting disease-defensive genes such as PRs [15,16]. For example, rice OsWRKY53 is often co-expressed with PR genes to enhance the disease resistance of rice [17].
So far, limited reports exist on the physiological and molecular responses of peonies to the pathogen Alternaria. Only recently, two WRKYs (PlWRKY13 and PlWRKY65) and five PRs (PlPR1, PlPR2, PlPR4B, PlPR5, and PlPR10) were found to be involved in peony disease resistance [18,19]. Therefore, the physiological parameters and the expression of these seven genes were compared between the disease-resistant (R) and susceptible (S) varieties against the pathogen A. tenuissima. This study aimed to reveal the differential responses of R/S peonies, shedding light on the internal mechanisms underlying peony’s resistance to A. tenuissima and establishing a theoretical basis for breeding disease-resistant peony varieties.
2. Materials and Methods
2.1. Plant Materials and Treatment
The resistant (R) peony variety ‘Zi Fengyu’ and susceptible (S) variety ‘Heihai Botao’ were used. The plants were 4 years old and planted in the experimental station of Shandong Agricultural University. Strain W23 of Alternaria tenuissima preserved in our laboratory was used for pathogen infection. The strain was cultivated on a solid potato dextrose agar (PDA) medium prior to inoculation. The method previously described by us was employed to collect the fungal colony edge, which was subsequently transferred to the terminal three leaflets [18].
The leaf samples from R and S genotypes were collected 0, 2, 4, 6, and 8 days after infection to determine physiological parameters. The leaf samples were collected 0, 3, 6, 12, 24, 48, 72, or 96 h after infection for observing HR and determining gene expression, considering earlier responses. The specific sampling method for determination was as follows: for leaves that produced no disease spot after inoculation, samples were taken from the inoculation site, whereas for leaves that produced spots, samples were taken from the periphery of the spots.
2.2. Observation of Hypersensitive Response
Hypersensitive response (HR) was detected using lactophenol–trypan blue staining [20]. Trypan blue can penetrate through the disrupted cell membrane and bind to the disintegrated DNA. As a result, the dead cells are stained in blue color.
2.3. Determination of Malondialdehyde Content and Defensive Enzyme Activity
The malondialdehyde (MDA) content was determined using the thiobarbituric acid reaction [21]. The activities of Superoxide dismutase (SOD), peroxidase (POD), catalase (CAT), and ascorbate peroxidase (APX) were determined as described previously [8]. The activities of polyphenol oxidase (PPO) and phenylalanine ammonia lyase (PAL) were determined using catechol as the substrate and by the trans-cinnamic acid method [22,23].
2.4. Analysis of Gene Expression
In a previous study, two WRKYs (PlWRKY13 and PlWRKY65) and five PRs (PlPR1, PlPR2, PlPR4B, PlPR5, and PlPR10) were found to be associated with peony response to A. tenuissima [18]. In the present study, the expression of these seven genes was therefore compared using real-time quantitative polymerase chain reaction (PCR) with gene-specific primers as described previously [18]. Actin was used as the reference gene.
Total RNA was extracted from leaf tissues using EASYspin RNA extraction kits (Aidlab Biotech, Beijing, China) following the manufacturer’s instructions. Then, RNA was reverse-transcribed into cDNA using a cDNA synthesis kit (CoWin Biotech, Taizhou, China). The total volume of the PCR system was 20 μL, comprising 10 μL of SYBR PremixExTaq (Mei5 Biotech, Beijing, China), 1 μL of cDNA, 0.5 μL of primers (10 μM), and 8.0 μL of distilled deionized water. The cDNA was amplified under the following conditions: 95 °C for 30 s, followed by 40 cycles of 95 °C for 5 s and 60 °C for 30 s; and 95 °C for 10 s, 60 °C for 5 s, and 95 °C for 5 s. The relative mRNA amounts were calculated using the 2−ΔΔCT method [24].
2.5. Data Analysis
All experiments were conducted in triplicate, and the data were expressed as the means of three replicates. The means were compared using the Student paired-sample t-test to compare the differences in the physiological and gene expression data. A p-value ≤ 0.05 indicated a significant difference. Graphs were drawn using GraphPad Prism 8.0 (GraphPad 8.0.2, San Diego, CA, USA).
3. Results
3.1. Hypersensitive Response
The differential hypersensitive response (HR) in the resistant (R) and susceptible (S) peony genotypes after being inoculated with the pathogen A. tenuissima was detected using the trypan blue staining method. Figure 1 presents the results.
No pathogen or lesion was visible in either the R or S genotype at 0 h after inoculation (hai) (Figure 1A,a). At 6 hai, HR was seen in the R genotype for the infected tissue stained blue, whereas no HR was observed in the S genotype (Figure 1B,b). At 12 hai, the blue-stained area in the R genotype enlarged, indicating enhanced HR, whereas weak HR occurred in the S genotype at this time point (Figure 1C,c). At 24 hai, the blue-stained area in the R genotype continued to increase, whereas leaf spots began to appear in the S genotype. This observation indicated that its weak HR hardly restricted the continuous invasion of the pathogen (Figure 1D,d). At 48 hai, the blue-stained area in the R genotype ceased to expand and HR declined by 72 hai (Figure 1E,F). However, the leaf spot in the S genotype continued to enlarge during this period (Figure 1e,f).
3.2. MDA Content and Activity of Related Enzymes
3.2.1. MDA Content
After inoculation with the pathogen A. tenuissima, the MDA content in both genotypes showed the same trend of first increasing and then decreasing. The MDA content peaked 4 days after inoculation (dai) in both genotypes. However, the MDA content in the R genotype was always significantly less than that in the S genotype except at 0 dai (Figure 2).
3.2.2. Activities of SOD, POD, CAT, and APX
As shown in Figure 3, the activities of the four enzymes—SOD, POD, CAT, and APX—in both genotypes exhibited a similar tendency of first increasing and then decreasing after inoculation with A. tenuissima. However, remarkable or significant differences between these two genotypes were observed in the peak time and/or variation range. The activities of SOD and POD peaked at 4 dai in the R genotype, which was 2 dai ahead of that in the S genotype. At 2 and 4 dai, SOD activity was significantly higher in the R genotype than that in the S genotype. The activities of CAT or APX peaked on the same day in both genotypes: 6 dai for CAT and 4 dai for APX. However, their peak-time activities were significantly higher in the R genotype than in the S genotype.
3.2.3. Activities of PPO and PAL
After inoculation with the pathogen, the activities of PPO and PAL in the R genotype indicated a trend of initially sharp increase followed by a rapid decrease; they reached their maximum levels at 4 dai (Figure 4). In contrast, the activities of PPO and PAL in the S genotype showed relatively minor changes, with PPO activity fluctuating and PAL activity displaying a slow increase and then a decrease. Additionally, PPO activity in the R genotype was found to be significantly higher before the peak time (except for 0 dai), and PAL activity in the R genotype was significantly higher starting from the peak time.
3.3. Expression of the Pathogen-Related Genes
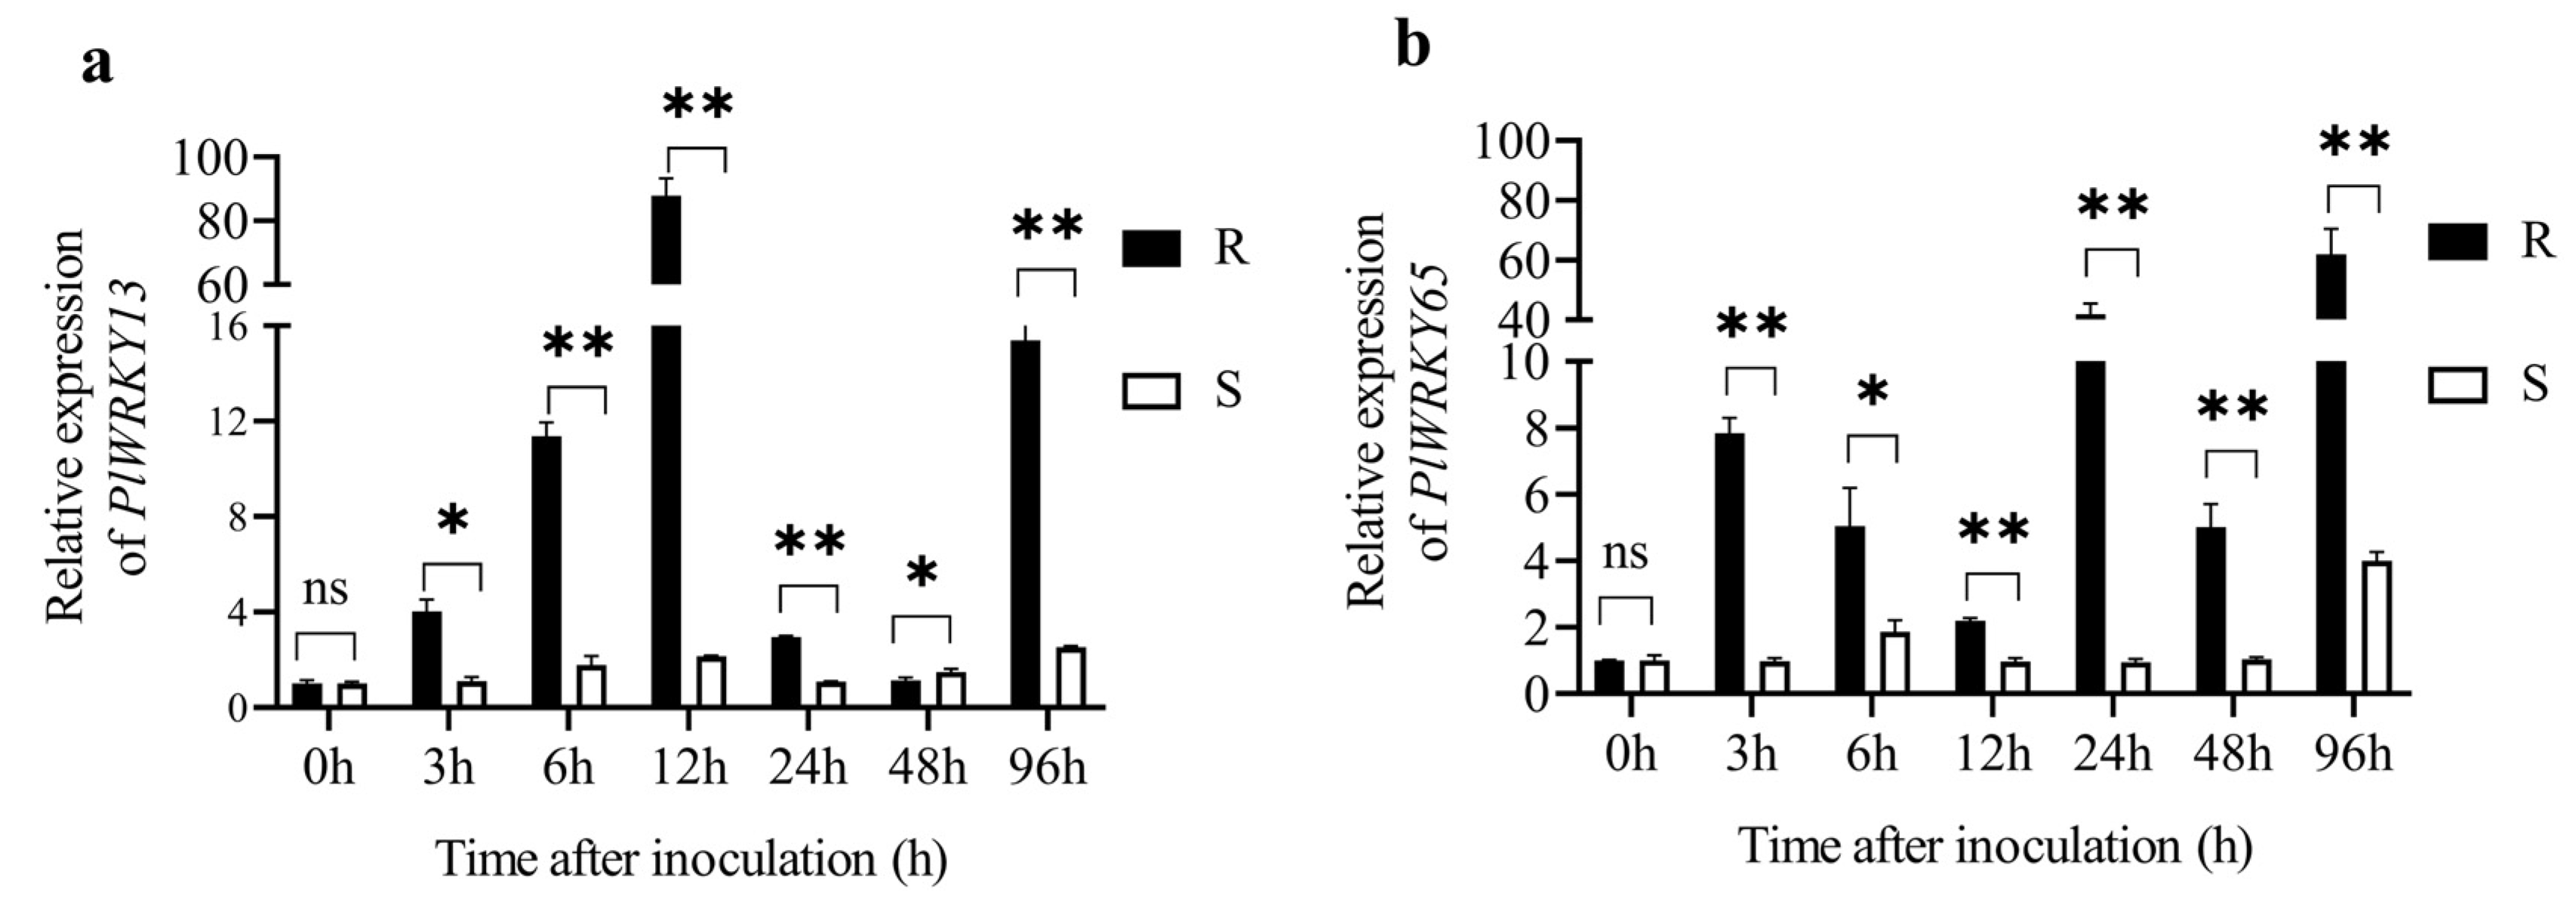
3.3.1. Expression of PlWRKY13 and PlWRKY65
In the R genotype, the expression of PlWRKY13 exhibited an up–down–up trend after infection with the pathogen A. tenuissima. It quickly increased within the first 12 h after inoculation (hai), reached its peak at 12 hai, when its expression was 87.80-fold higher than that at 0 hai, and then rapidly decreased. At 96 hai, it went up again. In contrast, the expression of PlWRKY13 in the S genotype exhibited a similar up–down–up trend, but the variation range was much smaller (Figure 5a).
In comparison to PlWRKY13, the expression pattern of PlWRKY65 in the S genotype exhibited greater complexity. It displayed an overall ascending trend with three waves. The first, second, and third peaks occurred at 3 hai, 24 hai, and 96 hai, respectively, with expression levels 7.84-, 41.93-, and 61.93-fold higher than that at 0 hai, respectively. Conversely, the expression of PlWRKY65 in the S genotype followed an up–down–up trend, but the variation range in the R genotype was extremely small. The highest expression level occurred at 96 hai, which was only fourfold higher than that at 0 hai. Besides, the expression of PlWRKY13 and PlWRKY65 in the R genotype exhibited alternating periods of high expression, except at 0 and 96 hai, indicating that they might work together to contribute to the peony’s resistance to A. tenuissima (Figure 5b).
3.3.2. Expression of PlPRs
As shown in Figure 6, the expression of the five PlPRs genes in both genotypes was upregulated after pathogen inoculation and demonstrated an overall rising–falling trend. However, the timing of the expression peak varied not only among different PlPRs, but also among different genotypes. Striking or significant variation ranges were noted between these two genotypes. In the R genotype, PR4B expression reached its peak at 6 hai, which was 98.45-fold higher than that at 0 hai. The expression of PR1, PR2, and PR10 peaked at 12 hai, which was 94.96-, 10.93-, and 42.92-fold higher than that at 0 hai, respectively. Additionally, the expression of PR5 peaked at 24 hai, which was 20.14-fold higher than that at 0 hai. In the S genotype, the expression of PR4B, PR1, PR10, PR5, and PR2 reached its peak at 3, 6, 12, 24, and 48 hai, respectively, which was 7.81-, 14.80-, 24.72-, 13.91-, and 4.39-fold higher than that at 0 hai. Generally, the upregulation of PR genes was much stronger in the R genotype. This was especially evident for PlPR1 and PlPR4B, with expression levels nearly 100-fold higher at peak time than at 0 hai.
4. Discussion
Resistance to a pathogen is often associated with HR, which manifests as localized induced cell death at the infected site in the host plant [4,5]. The present study indicated that HR occurred in both R and S genotypes after inoculation of the pathogen A. tenuissima. However, HR occurred faster and was stronger in the R genotype than in the S genotype. This result corresponded to a previous finding that the R genotype of Solanum plants displayed quicker (22 h) and stronger HR than the S genotype when infected by the pathogen Phytophthora infestans [5]. It was deduced that faster and stronger HR in the R genotype helped inhibit peony leaf spot disease caused by A. tenuissima.
When peony leaves were infected by A. tenuissima, the MDA content and the activity of antioxidant enzymes, including POD, SOD, CAT, and APX, increased to varying degrees in both R and S genotypes. This was possibly related to the establishment of pathogen infection, which caused ROS accumulation and membrane lipid peroxidation, while inducing the antioxidant system to respond [7]. The present study also found that the MDA content increased at a lower rate and the antioxidant enzyme activity increased at a higher rate in the R genotype than in the S genotype. This indicated that the damage to the membrane system in the R genotype was less serious and, concurrently, the responses of antioxidant enzymes were more positive. Such responses helped alleviate oxidative damage caused by free radicals and inhibit pathogen infection [25,26].
PPO and PAL also play an essential role in the defense of plants against pathogens. PPO activity was related to the conversion into quinones to prevent further pathogenic infestation [27]. PAL, as the first key enzyme in phenylalanine metabolism, was closely related to the synthesis of plant antitoxins [10]. The present study showed that the enzymatic activities of both PPO and PAL were more sensitive to A. tenuissima infection in the R genotype than in the S genotype, indicating that PPO and PAL activities were positively associated with peony resistance. The rapidly increasing tendency of PPO and PAL activities in the R genotype possibly promoted the synthesis of toxic-to-pathogen substances such as quinones and increased the thickness of the cell wall [28], thus inhibiting the pathogen infection. Taken together, it was speculated that the remarkable or significant increase in defense enzyme activity might act synergistically in the defense signaling pathway of peonies with the R genotype.
WRKY transcription factors are vital in the early responses to plant disease resistance because they can regulate the expression of genes associated with plant defense responses by acting as transcriptional activators or inhibitors [29,30]. In the model plant Arabidopsis, WRKYs, such as AtWRKY18, AtWRKY33, and AtWRKY70, increased disease resistance by regulating the expression levels of related genes [30]. In rice, various OsWRKY genes were found whose multiple copies led to increased resistance against the invading pathogens [17]. The present study showed that the expression of PlWRKY13 and PlWRKY65 was much higher in the R genotype than in the S genotype after A. tenuissima infection. Additionally, the expression level peaked earlier, indicating that the aforementioned two WRKY transcription factors played positive regulatory roles when peony plants were subjected to A. tenuissima infection. The positive regulatory function of their homologs in plant disease resistance has also been frequently reported. For example, Oryza sativa OsWRKY13 expression was significantly upregulated after infection with the pathogens of rice sheath blight and sheath rot disease; the expression level was higher in R varieties than in S varieties [31]. Further, the overexpression of CsWRKY65 enhanced citrus resistance to the pathogen Penicillium digitatum [32]. Therefore, it was deduced that both PlWRKY13 and PlWRKY65 participated in peony resistance to the pathogen A. tenuissima in a positive manner.
The accumulation of PR proteins is considered a typical defense response elicited in plants [13,33,34,35]. However, PR responses varied with plant host species or pathogens. For example, in rice leaves, the expression of six PRs, including PR1, PR2, and PR4b, was upregulated following inoculation with Xanthomonas. However, the expression of the other four detected PRs, such as PR5, did not exhibit any change in response to the infection [36]. In apple leaves, PR1 expression was not affected at 48 hai with Colletotrichum fructicola, whereas PR10 was upregulated in both resistant and sensitive varieties [33]. The present study showed that the expression of PlPR1, PlPR2, PlPR4B, PlPR5, and PlPR10 in both genotypes displayed the overall trend of first increasing and then decreasing after inoculation with A. tenuissima, but the expression level of each PlPR in the R genotype was relatively high, indicating that the resistance of peony to A. tenuissima was associated with upregulated expression of the aforementioned five PlPRs. This assumption was based on the antimicrobial function of the PRs-encoding proteins. PR1 proteins are members of cysteine-rich secretory protein, antigen 5, and the pathogenesis-related-1 (CAP) protein superfamily. The CAP region harbors an embedded defense signaling peptide (C-terminal peptide, CAPE) involved in sequestering sterols from microbes and responsible for antimicrobial activity [37]. PR5 proteins (thaumatin-like proteins) are another family of proteins that acts on the membrane of a pathogen. They were thought to exhibit antifungal activity via creating transmembrane pores on the membrane of the pathogen [38]. Therefore, we speculated the accumulation of PlPR1 and PlPR5 may contribute to enhanced resistance against the pathogen A. tenuisssima through their synergistic action on the membrane of the pathogen. PR2 and PR4 were identified as β-1,3-glucanases and chitinase, respectively, which can collaboratively catalyze the cell wall degradation of the pathogen through the hydrolysis of β-1,3-glucan and chitin [14,39]. In this study, higher expression levels of PlPR2 and PlPR4B detected in the R genotype at an early stage of the pathogen infection indicated that the enzymes accumulated rapidly, resulting in increasing hydrolytic activity and breakdown of the fungal cell wall. PR10 were identified as ribonuclease (RNase)-like proteins and PR10 activity against pathogens has not been well explained [14]. However, phosphorylation-dependent ribonucleolytic activity against total RNA has been reported for some members of the PR10 family [40]. In this study, the expression of PlPR10 in both genotypes displayed an overall rising trend, and at their peak time (12 hai), the expression in the R genotype was significantly higher than that in the S genotype. We speculated the upregulation of PlPR10 accompanied by A. tenuissima infection would increase the RNase activity, which might cause the pathogen’s RNA cleavage. Taken together, these five functionally diverse PR proteins that accumulated in response to A. tenuissima invasion collaboratively contributed to disease resistance of the R genotype ‘Zi Fengyu’. Previous studies also showed that WRKY transcription factors exerted their disease regulatory function by binding to the W-box in PR promoters [32,41,42]. In this study, PlWRKY13, PlWRKY65, PlPR1, PlPR2, PlPR4B, PlPR5, and PlPR10 were relatively highly expressed in the R genotype, indicating that they collectively participated in peony resistance to A. tenuissima. Whether these two PlWRKYs also physically interacted with these PlPRs needs further exploration.
Finally, it was worth noting that for determination of the activities of defense enzymes, we designed relatively longer sampling time intervals according to some previous reports [8,43,44], meanwhile considering delayed changes in enzyme activity might happen as previous study reported possibly due to gene translation and modification process [45]. However, as Figure 3 and Figure 4 showed, the activities of these defense enzymes (except for CAT) in the R genotype rapidly increased and peaked at 4 dai, meaning these defense enzymes exert their function mainly within 96 h after inoculation. So, a smaller-interval sampling strategy at earlier stages was recommended for further study.
5. Conclusions
The present study suggested that when peony leaves were infected with the pathogen A. tenuissima, the following positive responses collectively contributed to peony leaf spot disease resistance: rapid HR, enhanced antioxidant capacity (less MDA content and increased activity of SOD, POD, CAT, and APX), enhanced activity of PPO and PAL, and rapid and/or sharp upregulation of expression levels of PlWRKY13, PlWRKY65, PlPR1, PlPR2, PlPR4B, PlPR5, and PlPR10. In contrast, the slower HR, weaker antioxidant capacity, and sluggish upregulation with a smaller range of expression of these genes might have a significant impact on the resistance of peony to A. tenuissima, making it more susceptible to infection.
Author Contributions
Conceptualization, X.G. and Y.W.; methodology and investigation, Y.W.; data curation and formal analysis, Y.W., Z.L. and X.G.; writing—original draft and writing—review and editing: Y.W., Z.L., Y.Z. and X.G.; supervision: X.G.; funding acquisition: X.G. All authors have read and agreed to the published version of the manuscript.
Funding
This work was supported by Shandong Provincial Natural Science Foundation (No. ZR2021MC007).
Data Availability Statement
The datasets used and analyzed during the current study are available from authors on reasonable request.
Acknowledgments
The authors would like to thank Fanzhi Meng for his assistance in field management of peony plants.
Conflicts of Interest
The authors declare no conflict of interest.
References
- Cheng, F.Y.; Zhong, Y.; Long, F.; Yu, X.N.; Kamenetsky-Goldstein, R. Chinese herbaceous peonies: Cultivar selection for forcing culture and effects of chilling and gibberellin (GA3) on plant development. Isr. J. Plant Sci. 2009, 57, 357–367. [Google Scholar] [CrossRef]
- Sun, X.M.; Huang, J.G. First report of Alternaria tenuissima causing red leaf spot disease on Paeonia lactiflora in China. Plant Dis. 2017, 101, 1322. [Google Scholar] [CrossRef]
- Li, L.; Song, S.X.; Liu, H.X.; Guo, X.F. Identification of red spot pathogens on peony in Shandong province (in Chinese, abstract in English). Yuan Yi Xue Bao 2016, 43, 365–372. [Google Scholar] [CrossRef]
- Staskawicz, B.J.; Ausubel, F.M.; Baker, J.B.; Ellis, J.G.; Jones, J.D.G. Molecular genetics of plant disease resistance. Science 1995, 268, 661–667. [Google Scholar] [CrossRef] [Green Version]
- Vleeshouwers, V.G.A.A.; van Dooijeweert, W.; Govers, F.; Kamoun, S.; Colon, L.T. The hypersensitive response is associated with host and nonhost resistance to Phytophthora infestans. Planta 2000, 210, 853–864. [Google Scholar] [CrossRef]
- Esterbauer, H.; Schaur, R.J.; Zollner, H. Chemistry and biochemistry of 4-hydroxynonenal, malonaldehyde and related aldehydes. Free Radic. Biol. Med. 1991, 11, 81–128. [Google Scholar] [CrossRef]
- Radwan, D.E.M.; Fayez, K.A.; Mahmoud, S.Y.; Lu, G. Modifications of antioxidant activity and protein composition of bean leaf due to Bean yellow mosaic virus infection and salicylic acid treatments. Acta Physiol. Plant. 2010, 32, 891–904. [Google Scholar] [CrossRef]
- Zhang, Y.; Shi, X.; Li, B.; Zhang, Q.; Liang, W.; Wang, C. Salicylic acid confers enhanced resistance to Glomerella leaf spot in apple. Plant Physiol. Biochem. 2016, 106, 64–72. [Google Scholar] [CrossRef]
- Mittler, R. ROS are good. Trends Plant Sci. 2017, 22, 11–19. [Google Scholar] [CrossRef] [Green Version]
- Jun, S.Y.; Sattler, S.A.; Cortez, G.S.; Vermerris, W.; Sattler, S.E.; Kang, C. Biochemical and structural analysis of substrate specificity of a phenylalanine ammonia-lyase. Plant Physiol. 2018, 176, 1452–1468. [Google Scholar] [CrossRef] [Green Version]
- Jia, Y.; Martin, G.B. Rapid transcript accumulation of pathogenesis-related genes during an incompatible interaction in bacterial speck disease-resistant tomato plants. Plant Mol. Biol. 1999, 40, 455–465. [Google Scholar] [CrossRef]
- Anisimova, O.K.; Shchennikova, A.V.; Kochieva, E.Z.; Filyushin, M.A. Pathogenesis-related genes of PR1, PR2, PR4, and PR5 families are involved in the response to Fusarium infection in garlic (Allium sativum L.). Int. J. Mol. Sci. 2021, 22, 6688. [Google Scholar] [CrossRef]
- Jain, D.; Khurana, J.P. Role of pathogenesis-related (PR) proteins in plant defense mechanism. In Molecular Aspects of Plant-Pathogen Interaction; Singh, A., Singh, I.K., Eds.; Springer: Singapore, 2018; pp. 265–281. [Google Scholar] [CrossRef]
- dos Santos, C.; Franco, O.L. Pathogenesis-related proteins (PRs) with enzyme activity activating plant defense responses. Nat. Plants 2023, 12, 2226. [Google Scholar] [CrossRef]
- Jiang, J.J.; Ma, S.H.; Ye, N.H.; Cao, J.S.; Zhang, J.H.; Jiang, M. WRKY transcription factors in plant responses to stresses. J. Integr. Plant Biol. 2017, 59, 86–101. [Google Scholar] [CrossRef] [Green Version]
- Eulgem, T.; Rushtun, P.J.; Schmelzer, E.; Hahlbrock, K.; Somssich, I.E. Early nuclear events in plant defence signalling: Rapid gene activation by WRKY transcription factors. EMBO J. 1999, 18, 4689–4699. [Google Scholar] [CrossRef] [Green Version]
- Jimmy, J.L.; Babu, S. Role of OsWRKY transcription factors in rice disease resistance. Trop. Plant Pathol. 2015, 40, 355–361. [Google Scholar] [CrossRef]
- Wang, X.; Li, J.J.; Guo, J.; Qiao, Q.; Guo, X.F.; Ma, Y. The WRKY transcription factor PlWRKY65 enhances the resistance of Paeonia lactiflora (herbaceous peony) to Alternaria tenuissima. Hortic. Res. 2020, 7, 57. [Google Scholar] [CrossRef]
- Wang, X.; Li, J.J.; Guo, X.F.; Ma, Y.; Qiao, Q.; Guo, J. PlWRKY13: A transcription factor involved in abiotic and biotic stress responses in Paeonia lactiflora. Int. J. Mol. Sci. 2019, 20, 5953. [Google Scholar] [CrossRef] [Green Version]
- Xiao, S.; Brown, S.; Patrick, E.; Brearley, C.; Turner, J.G. Enhanced transcription of the Arabidopsis disease resistance genes RPW8.1 and RPW8.2 via a salicylic acid-dependent amplification circuit is required for hypersensitive cell death. Plant Cell 2003, 15, 33–45. [Google Scholar] [CrossRef] [Green Version]
- Heath, R.L.; Packer, L. Photoperoxidation in isolated chloroplasts I kinetics and stoichiometry of fatty acid peroxidation. Arch. Biochem. Biophys. 1968, 125, 189–198. [Google Scholar] [CrossRef]
- Lee, C.Y.; Kagan, V.; Jaworski, A.W.; Brown, S.K. Enzymatic browning in relation to phenolic compounds and polyphenoloxidase activity among various peach cultivars. J. Agric. Food Chem. 1990, 38, 99–101. [Google Scholar] [CrossRef]
- Dickerson, D.P.; Pascholati, S.F.; Hagerman, A.E.; Butler, L.G.; Nicholson, R.L. Phenylalanine ammonia-lyase and hydroxycinnamate: CoA ligase in maize mesocotyls inoculated with Helminthosporium maydis or Helminthosporium carbonum. Plant Pathol. 1984, 25, 111–123. [Google Scholar] [CrossRef]
- Livak, K.J.; Schmittgen, T.D. Analysis of relative gene expression data using real-time quantitative PCR and the 2−ΔΔCT method. Methods 2001, 25, 402–408. [Google Scholar] [CrossRef]
- Hu, M.; Zhu, Y.; Liu, G.; Gao, Z.; Li, M.; Su, Z.; Zhang, Z. Inhibition on anthracnose and induction of defense response by nitric oxide in pitaya fruit. Sci. Hortic. 2019, 245, 224–230. [Google Scholar] [CrossRef]
- Chan, Z.; Tian, S. Induction of H2O2-metabolizing enzymes and total protein synthesis by antagonistic yeast and salicylic acid in harvested sweet cherry fruit. Postharvest Biol. Technol. 2006, 39, 314–320. [Google Scholar] [CrossRef]
- Li, L.; Steffens, J.C. Overexpression of polyphenol oxidase in transgenic tomato plants results in enhanced bacterial disease resistance. Planta 2002, 215, 239–247. [Google Scholar] [CrossRef]
- Tian, S.; Wan, Y.; Qin, G.; Xu, Y. Induction of defense responses against Alternaria rot by different elicitors in harvested pear fruit. Appl. Microbiol. Biotechnol. 2006, 70, 729–734. [Google Scholar] [CrossRef]
- Rushton, P.J.; Somssich, I.E.; Ringler, P.; Shen, Q.J. WRKY transcription factors. Trends Plant Sci. 2010, 15, 247–258. [Google Scholar] [CrossRef]
- Eulgem, T.; Somssich, I.E. Networks of WRKY transcription factors in defense signaling. Curr. Opin. Plant Biol. 2007, 10, 366–371. [Google Scholar] [CrossRef] [Green Version]
- Jimmy, J.L.; Babu, S. Gene network mediated by WRKY13 to regulate resistance against sheath infecting fungi in rice (Oryza sativa L.). Plant Sci. 2019, 280, 269–282. [Google Scholar] [CrossRef]
- Wang, W.; Li, T.; Chen, Q.; Deng, B.; Deng, L.; Zeng, K. Transcription factor CsWRKY65 participates in the establishment of disease resistance of citrus fruits to Penicillium digitatum. J. Agric. Food Chem. 2021, 69, 5671–5682. [Google Scholar] [CrossRef]
- Rockenbach, M.F.; Velho, A.C.; Alaniz, S.M.; Stadnik, M.J. Resistance of apple leaves to infection by Colletotrichum fructicola acts independently of hypersensitive reaction and PR-1 and PR-10 gene expression. Trop. Plant Pathol. 2018, 43, 360–370. [Google Scholar] [CrossRef]
- Park, C.J.; Kim, K.J.; Shin, R.; Park, J.M.; Shin, Y.C.; Paek, K.H. Pathogenesis-related protein 10 isolated from hot pepper functions as a ribonuclease in an antiviral pathway. Plant J. 2004, 37, 186–198. [Google Scholar] [CrossRef]
- Xie, Y.R.; Chen, Z.Y.; Brown, R.L.; Bhatnagar, D. Expression and functional characterization of two pathogenesis-related protein 10 genes from Zea mays. J. Plant Physiol. 2010, 167, 121–130. [Google Scholar] [CrossRef]
- Hou, M.; Xu, W.; Bai, H.; Liu, Y.; Li, L.; Liu, L.; Liu, B.; Liu, G. Characteristic expression of rice pathogenesis-related proteins in rice leaves during interactions with Xanthomonas oryzae pv. oryzae. Plant Cell Rep. 2012, 31, 895–904. [Google Scholar] [CrossRef]
- Breen, S.; Williams, S.J.; Outram, M.; Kobe, B.; Solomon, P.S. Emerging insights into the functions of pathogenesis-related protein 1. Trends Plant Sci. 2017, 22, 871–879. [Google Scholar] [CrossRef]
- Odjakova, M.; Hadjiivanova, C. The complexity of pathogen defense in plants. Bulg. J. Plant Physiol. 2001, 27, 101–109. [Google Scholar]
- Boccardo, N.A.; Segretin, M.E.; Hernandez, I.; Mirkin, F.G.; Chacón, O.; Lopez, Y.; Borrás-Hidalgo, O.; Bravo-Almonacid, F.F. Expression of pathogenesis-related proteins in transplastomic tobacco plants confers resistance to filamentous pathogens under field trials. Sci. Rep. 2019, 9, 2791. [Google Scholar] [CrossRef] [Green Version]
- Besbes, F.; Franz-Oberdorf, K.; Schwab, W. Phosphorylation-dependent ribonuclease activity of Fra a 1 proteins. J. Plant Physiol. 2019, 233, 1–11. [Google Scholar] [CrossRef]
- van Verk, M.C.; Pappaioannou, D.; Neeleman, L.; Bol, J.F.; Linthorst, H.J.M. A novel WRKY transcription factor is required for induction of PR-1a gene expression by salicylic acid and bacterial elicitors. Plant Physiol. 2008, 146, 1983–1995. [Google Scholar] [CrossRef] [Green Version]
- Choi, C.; Hwang, S.H.; Fang, I.R.; Kwon, S.I.; Park, S.R.; Ahn, I.; Kim, J.B.; Hwang, D.J. Molecular characterization of Oryza sativa WRKY6, which binds to W-box-like element 1 of the Oryza sativa pathogenesis-related (PR) 10a promoter and confers reduced susceptibility to pathogens. New Phytol. 2015, 208, 846–859. [Google Scholar] [CrossRef]
- Yin, L.; Zou, Y.; Ke, X.; Liang, D.; Du, X.; Zhao, Y.; Zhang, Q.; Ma, F. Phenolic responses of resistant and susceptible Malus plants induced by Diplocarpon mali. Sci. Hortic. 2013, 164, 17–23. [Google Scholar] [CrossRef]
- Silva, L.C.; Debona, D.; Aucique-Pérez, C.E.; Oliveira, J.R.; Júnior, J.I.R.; Brás, V.V.; Rodrigues, F.A. Physiological and antioxidant insights into common bean resistance to common bacterial blight. Physiol. Mol. Plant Pathol. 2020, 111, 101505. [Google Scholar] [CrossRef]
- Sun, J.; Gu, J.; Zeng, J.; Han, S.; Song, A.; Chen, F.; Fang, W.; Jiang, J.; Chen, S. Changes in leaf morphology, antioxidant activity and photosynthesis capacity in two different drought-tolerant cultivars of chrysanthemum during and after water stress. Sci. Hortic. 2013, 161, 249–258. [Google Scholar] [CrossRef]
Figure 1.
Hypersensitive response (HR) of the two genotypes to the pathogen infection after trypan blue staining. R refers to the disease-resistant genotype, whereas S refers to the susceptible genotype. Capital letters A~F indicate that HR occurred in the R genotype, whereas lowercase letters a~f indicate that HR occurred in the S genotype. (A): No HR occurred at 0 h after inoculation (hai). (B): HR occurred at 6 hai. (C,D): HR was enhanced at 12 hai and 24 hai. (E): HR was no longer enhanced at 48 hai. (F): HR became weak at 72 hai. (a,b): No HR occurred at 0 hai or 6 hai. (c): HR occurred slightly at 12 hai. (d): HR occurred slightly at 24 hai, and meanwhile a leaf spot appeared. (e,f): Leaf spot enlarged at 48 hai and 72 hai.

Figure 2.
The malondialdehyde (MDA) content in the R/S peony genotypes after A. tenuissima inoculation. R refers to the disease-resistant genotype, whereas S refers to the susceptible genotype. Values are means of three replicates. Vertical lines represent standard deviation. “ns” means no significant difference between R/S genotypes, whereas * and **, respectively, indicate significant differences when p ≤ 0.05 and p ≤ 0.01 (Student t-test).

Figure 3.
Activity of (a) superoxide dismutase (SOD), (b) peroxidase (POD), (c) catalase (CAT), and (d) ascorbate peroxidase (APX) in the R/S peony genotypes after A. tenuissima inoculation. R refers to the disease-resistant genotype, whereas S refers to the susceptible genotype. Values are means of three replicates. Vertical lines represent standard deviation. “ns” means no significant difference between R/S genotypes, whereas * and **, respectively, indicate significant differences when p ≤ 0.05 and p ≤ 0.01 (Student t-test).

Figure 4.
Change in the activities of (a) polyphenol oxidase (PPO) and (b) phenylalanine ammonia lyase (PAL) in the R/S peony genotypes after A. tenuissima inoculation. R refers to the disease-resistant genotype, whereas S refers to the susceptible genotype. Values are means of three replicates. Vertical lines represent standard deviation. “ns” means no significant difference between R/S genotypes, whereas ** indicates significant difference when p ≤ 0.01 (Student t-test).

Figure 5.
Expression characteristics of (a) PlWRKY13 and (b) PlWRKY65 in the R/S peony genotypes after A. tenuissima inoculation. R refers to the disease-resistant genotype, whereas S refers to the susceptible genotype. Each column represents the mean of three replicates. Vertical lines represent standard deviation. “ns” means no significant difference between R/S genotypes, whereas * and **, respectively, indicate significant differences when p ≤ 0.05 and p ≤ 0.01 (Student t-test).

Figure 6.
Expression characteristics of pathogenesis-related (PR) (a) PlPR1, (b) PlPR2, (c) PlPR4B, (d) PlPR5, and (e) PlPR10 in the R/S peony genotypes after A. tenuissima inoculation. R refers to the disease-resistant genotype, whereas S refers to the susceptible genotype. Each column represents the mean of three replicates. Vertical lines represent standard deviation. “ns” means no significant difference between R/S genotypes, whereas * and **, respectively, indicate significant differences when p ≤ 0.05 and p ≤ 0.01 (Student t-test).

Disclaimer/Publisher’s Note: The statements, opinions and data contained in all publications are solely those of the individual author(s) and contributor(s) and not of MDPI and/or the editor(s). MDPI and/or the editor(s) disclaim responsibility for any injury to people or property resulting from any ideas, methods, instructions or products referred to in the content. |
© 2023 by the authors. Licensee MDPI, Basel, Switzerland. This article is an open access article distributed under the terms and conditions of the Creative Commons Attribution (CC BY) license (https://creativecommons.org/licenses/by/4.0/).
Share and Cite
MDPI and ACS Style
Wu, Y.; Lu, Z.; Zhu, Y.; Guo, X. Physiological and Gene Expression Analysis of Herbaceous Peony Resistance to Alternaria tenuissima Infection. Horticulturae 2023, 9, 862. https://doi.org/10.3390/horticulturae9080862
AMA Style
Wu Y, Lu Z, Zhu Y, Guo X. Physiological and Gene Expression Analysis of Herbaceous Peony Resistance to Alternaria tenuissima Infection. Horticulturae. 2023; 9(8):862. https://doi.org/10.3390/horticulturae9080862
Chicago/Turabian StyleWu, Yang, Zhonghua Lu, Yongfang Zhu, and Xianfeng Guo. 2023. "Physiological and Gene Expression Analysis of Herbaceous Peony Resistance to Alternaria tenuissima Infection" Horticulturae 9, no. 8: 862. https://doi.org/10.3390/horticulturae9080862
Note that from the first issue of 2016, this journal uses article numbers instead of page numbers. See further details here.