
Abstract
Nibea coibor belongs to Sciaenidae and is distributed in the South China Sea, East China Sea, India and the Philippines. In this study, we sequenced the DNA of a male Nibea coibor using PacBio long-read sequencing and generated chromatin interaction data. The genome size of Nibea coibor was estimated to be 611.85~633.88 Mb based on k-mer counts generated with Jellyfish. PacBio sequencing produced 29.26 Gb of HiFi reads, and Hifiasm was used to assemble a 627.60 Mb genome with a contig N50 of 10.66 Mb. We further found the canonical telomeric repeats “TTAGGG” to be present at the telomeres of all 24 chromosomes. The completeness of the assembly was estimated to be 98.9% and 97.8% using BUSCO and Merqury, respectively. Using the combination of ab initio prediction, protein homology and RNAseq annotation, we identified a total of 21,433 protein-coding genes. Phylogenetic analyses showed that Nibea coibor and Nibea albiflora are closely related. The results provide an important basis for research on the genetic breeding and genome evolution of Nibea coibor.
Measurement(s) | Whole-Genome Shotgun Sequencing • transcription profiling assay |
Technology Type(s) | single molecular realtime sequencing • RNA sequencing |
Sample Characteristic - Organism | Nibea coibor |
Sample Characteristic - Location | China |
Background & Summary
Nibea coibor belongs to the family Sciaenidae and is mainly distributed in the South China Sea, East China Sea, India and the Philippines1 (Fig. 1). As a fast-growing fish, it is widely cultured along the coast of China and has high nutritional and economic value. Early research on this fish mainly focused on breeding methods and biological characterization. In recent years, studies have focused on feed nutrition2,3,4,5,6, growth7,8,9 and development10,11,12. There are reports on the mitochondrial genome in Nibea coibor1,13; however, the lack of a genome assembly has hindered genetic and evolutionary research on this species.

Picture of Nibea coibor.
Recently, single-molecule sequencing14 has developed rapidly due to its advantages of long read length, fast speed and high accuracy and has become the mainstream sequencing method for genome assembly. This technology has been successfully adopted in assembling the genomes of fish, such as Oreochromis mossambicus15, Acanthopagrus latus16, Scatophagus argus17 and Hypophthalmichthys molitrix18. The newly updated high-fidelity (HiFi) sequence reads produced under the circular consensus sequencing (CCS) mode from PacBio achieve a balance between read length and base quality19. Some assembly software for processing HiFi reads, including HiCanu20, Falcon21, and Hifiasm22, is available. Among them, Hifiasm22 is the latest haplotype-resolved genome assembly algorithm for long HiFi reads. Hifiasm first performs all-versus-all read overlap alignment and then performs three rounds of error correction for sequencing errors by default. The corrected reads were then used to generate overlap alignment again and build a string graph. Hifiasm arbitrarily selects one haplotigs if heterozygous alleles present, and outputs a primary assembly and an alternate assembly. It resolves repetitive sequence information, such as centromeric and telomeric information. Compared with other existing algorithms, Hifiasm22 has the advantages of fast assembly speed, high accuracy and continuity. The long high-fidelity sequence reads of the Hifiasm22 assembly algorithm, combined with Hi-C23 technology, enable assembly of chromosome-level genomes with high quality. However, Hifiasm cannot resolve highly repetitive regions properly24.
In this study, we extracted DNA from a male Nibea coibor and generated HiFi reads using the PacBio platform. A high-quality contig assembly was produced using Hifiasm. Along with Hi-C data, Juicer and 3D-DNA were used to assemble and generate chromosome-level genomes. Three strategies were then used to annotate the genome. In addition, phylogenetic analyses based on single-copy genes were performed to understand the relationship between Nibea coibor and other species. This is the first genome assembly of Nibea coibor, which will be helpful to understand the gene structure, function and arrangement of this species, providing a basis for subsequent studies on genetic breeding, evolutionary analysis and germplasm resource conservation.
Methods
Library construction and sequencing
Genomic DNA was isolated from the liver and fin of a male Nibea coibor using the phenol/chloroform method for long-read and short-read sequencing, respectively. HiFi SMRTbell libraries were prepared using SMRTbell Express Template Prep Kit 2.0 (PacBio, CA, USA). The gDNA was sheared to 15~18 kb with a g-TUBE (Covaris, MA, USA), and DNA damage and fragment ends were repaired using reagents included in Template Prep Kit. SMRTbell hairpin adapters were ligated to the repaired ends, and AMPure PB beads (PacBio, CA, USA) were then used for library concentration and purification. To obtain large-insert SMRTbell libraries for sequencing, SMRTbell templates larger than 15 kb were size-selected with the BluePippin system (SageScience, MA, USA). Sequencing was carried out by Novogene (Beijing, China) using the PacBio Sequel II platform. Subsequently, CCS software (https://github.com/PacificBiosciences/ccs) was used to produce high-precision HiFi reads with quality above Q20, with standard settings of Min passes = 3 and min RQ = 0.99 (Table 1). SMRTbell adapter contamination in the HiFi reads was checked using cutadapt (v2.10)25, requiring at least 15 bp of overlap (error rate = 0.1) with adapter sequences. We found that only 284 of 1,919,461 reads contained adapters, and the adapter-contaminated reads were filtered out. Finally, we retained 29.26 Gb of HiFi data, with the longest length, average length and N50 of read length being 39.74, 15.24 and 15.34 kb (Table 2), respectively. The DNA extracted from the fin was sequenced using the Illumina NovaSeq 6000 platform by Novogene (Beijing, China), generating 19.79 Gb raw paired-end reads with 150-bp read length.
Total RNA was extracted from the liver, muscle, testis and ovary tissues from a male and a female using TRIzol Reagent (Invitrogen, MA, USA) according to the manufacturer’s instructions and then pooled with equal molar concentrations for RNA sequencing. Total RNA was selected with oligo (dT) beads and disrupted into short fragments by adding fragmentation buffer. These short fragments were used to synthesize first-strand cDNA using random hexamer primers, followed by synthesis of second-strand cDNA. AMPure XP beads were employed to purify double-stranded cDNA, and EB buffer was used for end-repair and A-tailing. The constructed RNA library was quantified and diluted, and an Agilent 2100 Bioanalyzer system (Agilent Technologies, CA, USA) was employed to assess insert sizes. qPCR was used to accurately quantify the effective concentration of the library. Sequencing of the RNA library was performed using the Illumina NovaSeq 6000 platform (Novogene, Beijing, China) and yielded a total of 17.04 Gb paired-end raw reads, with a Q30 of 93.67% (Table 1).
Hi-C data were generated using liver tissue samples from a male Nibea coibor. The Hi-C library was constructed using liver tissue following the protocol described by Belton et al.26, with some modifications. In brief, tissue was ground and then cross-linked with 4% formaldehyde solution. After quenching the crosslinking reaction and lysis, nuclei were resuspended in NEB buffer and solubilized with dilute SDS, and the 4-cutter restriction enzyme MboI (400 units) was used for digestion. DNA was purified by phenol‒chloroform extraction. The constructed library was paired-end sequenced using the Illumina NovaSeq 6000 platform. The sequenced raw data were filtered to obtain a total of 88.96 Gb of clean data (Table 1), with Q20 = 96.74% and Q30 = 91.82%, which was used to assist chromosome assembly.
Assembling and genome quality assessment
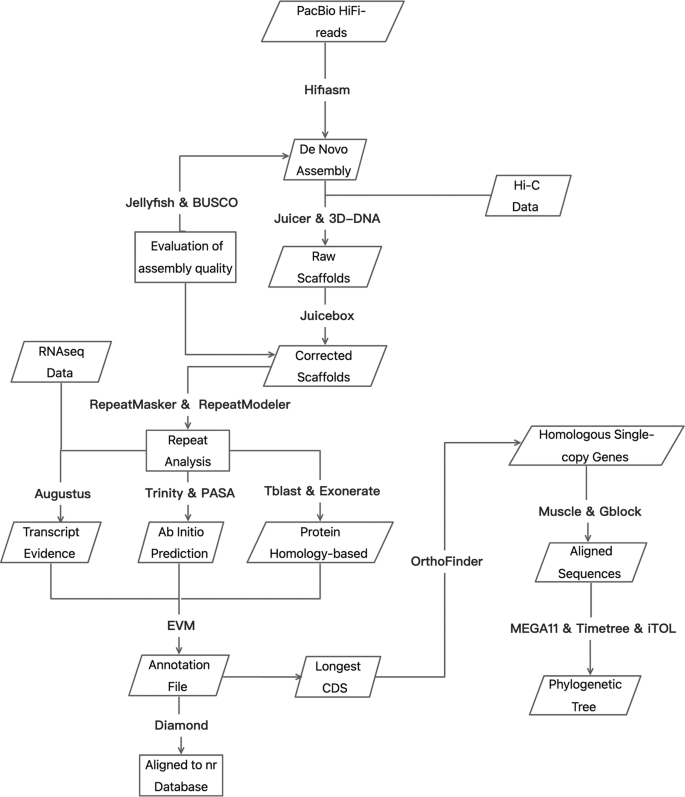
The genome was assembled using the default parameters of Hifiasm (v0.13.0-R307)22. We used HiFi reads without additional data, such as parental data, to generate a primary assembly graph. We precomputed overlaps and reperformed overlapping from the corrected reads and purged haplotig duplications with Hifiasm and carried out three rounds of error correction. The assembled graph yielded 314 contigs with a size of 627.60 Mb. The maximum contig size and N50 were 23.26 and 10.66 Mb (Table 2), respectively.
Juicer27 (v1.6) combined with 3D-DNA28 (v180419) was used for scaffolding. First, HiCUP29 (v0.8.1) was used to process the Hi-C data. BWA30 (v0.7.17-r1188) was used to index the contig-level genome, and Juicer was then used to create restriction enzyme cutting sites. The processed Hi-C data were further analysed and processed using Juicer (v1.6). In brief, we set the restriction type (S), reference genome file (Z), restriction enzyme cutting site file (Y), and chromosome size file (P). The run-ASM-pipeline.sh script of 3D-DNA was utilized to scaffold a draft reference genome, and an assembly heatmap was generated using 3D-DNA (Fig. 2). Juicerbox31 (v1.11.08) was used to manually correct assembly errors (mostly translocations errors), and we ultimately resolved 24 chromosomes (Fig. 3). The run-ASM-pipeline-post-review.sh script of 3D-DNA28 was used again to revise the results of the modified file output by Juicerbox, and the “FINAL” assembly was obtained with a total of 230 scaffolds. The maximum scaffold size and N50 size were 31.60 and 26.22 Mb (Table 2), respectively.
The workflow of genome assembly, annotation and phylogenetics.

Genome-wide Hi-C heatmap of Nibea coibor. The blue squares represent chromosomes and the small green squares inside the blue squares represent contigs that make up the chromosome. The blue squares contained in grey area are shrapnels.
In addition, the distribution of telomere repeat sequences in the assembled genome was detected based on vertebrate telomere sequence information32 provided by Telomerase Database (http://telomerase.asu.edu/sequences_telomere.html). The results showed that all 24 chromosomes contained telomere repeat sequences, namely, the repeat sequence ‘TTAGGG’ and its reverse complement ‘CCCTAA’, and 14 of them contained a large number of repeat sequences ranging from 14 to 1,365 (Supplementary Fig. 1).
Genome size and completeness estimation
Jellyfish33 (v2.3.0) was used to count the k-mers by setting the k-mer parameters to 19, 23, 27, and 31 (Table 3 and Supplementary Fig. 2), and to obtain the corresponding frequency distributions using the high-coverage short reads. The estimated genome size of Nibea coibor ranges from 611.85 Mb (19-mer) to 633.88 Mb (23-mer) (Table 3, Supplementary Fig. 2).
Benchmarking Universal Single-Copy Orthologues (BUSCO)34 (v5.1.2) was also used to assess genome completeness with the actinopteryGIi_ODb10 database (https://busco-data.ezlab.org). A total of 3,640 BUSCO genes were identified, with 3,600 complete genes, 3,552 single-copy genes, 48 multi-copy genes and 29 missing genes accounting for 98.9%, 97.6%, 1.3% and 0.3% of the whole genome, respectively (Table 4). In addition, Merqury35 was used to evaluate the QV value and completeness of the genome with both HiFi and Illumina reads. As a result, the completeness of the genome reached 97.8% using both HiFi and Illumina short reads. The QVs were 61.9 and 46.6 estimated with HiFi and Illumina k-mers, respectively. The k-mer spectrum plots generated with Merqury showed no abnormal false duplications in our genome assembly, and the k-mers that appeared only in the assembly, and not in the sequencing reads (implying base errors in the assembly), were trivial (Supplementary Fig. 3).
Repeat‐content identification and annotation
The RepbaseTE library was used to detect repeated sequences in the chromosome-scale genome assembly with the RepeatMasker program36 (v4.0.6), and RepeatModeler37 (v1.0.9) was used to construct a de novo repeat library. Based on the results, repetitive sequences comprise 11.49 Mb, accounting for 18.31% of the assembled genome. Among the repeat elements, short interspersed nuclear elements (SINEs) account for 0.58% of genome size and long interspersed nuclear elements (LINEs) for 1.79%. Long terminal repeats (LTRs) and DNA elements account for 1.37% and 3.11%, respectively. The small RNA content is 0.46%, and satellites and simple repeats account for 0.15% and 2.72%, respectively.
A combined strategy of ab initio, transcript evidence and protein homology-based gene prediction methods was performed for gene annotation. The pooled RNAseq clean data were assembled in two ways, i.e., transcript assembly relied on the reference genome and de novo assembly using Trinity software38 (v2.4.0), and open reading frames (ORFs) were identified using PASA39 (v2.1.0). Augustus40 (v3.2.3) was employed to perform ab initio gene prediction using known genes of zebrafish and the transcripts assembled from RNAseq. The optimal parameters were obtained after two rounds of model training. Tblastn41 was used to align the protein sequences of Nibea coibor and 9 other species, including Cynoglossus semilaevis, Danio rerio (zebrafish), Takifugu rubripe (pufferfish), Dicentrarchus labrax (European seabass), Gasterosteus aculeatus (three‐spined stickleback), Larimichthys crocea (large yellow croaker), Lates calcarifer, Oreochromis niloticus and Oryzias latipes (medaka), for homology-based gene prediction. Exonerate42 (v2.2.0) was used to accurately locate splice sites and exons of aligned sequences. Genes with coding regions less than 150 bp were then discarded, and the results of the three gene prediction models were weighted and evaluated by Evidence Modeller (EVM)43 (v1.1.1) to produce a comprehensive and reliable gene structure containing coding regions and alternative splice sites. All predicted genes were aligned to the NCBI nonredundant protein (nr) database and functionally annotated using blastp44. Ultimately, 21,433 genes were predicted, including 14,633 non-alternatively spliced genes and 6,800 alternatively spliced genes. Of these genes, 19,859 genes were annotated in the NCBI nr database.
Phylogenetic analysis
Coding sequences (CDSs) of 13 species, including Homo sapiens, Podarcis_muralis, Gallus, Lepisosteus oculatus, Danio rerio, Larimichthys crocea, Xiphophorus maculatus, Tetraodon nigroviridis, Oreochromis niloticus, Oryzias latipes, Gasterosteus aculeatus, Nibea albiflora45 and Collichthys lucidus46, were retrieved from Ensmbl or NCBI databases. The longest CDS of each gene for each species was extracted, and homology analysis was performed using OrthoFinder47 (v2.5.4) with default settings. A total of 333,401 genes were identified in the 14 species, including 1,876 homologous single-copy genes. These homologous single-copy genes were compared using the “-align” parameter of Muscle48 (v5.1). Gblock49,50 (v0.19b) was employed to extract conserved sequences in comparison results with the parameter “-b4 = 5 -b5 = h -t = d -e = 0.2”, and Seqkit51 (v2.2.0) was used to merge the results. The phylogenetic tree was constructed via MEGA1152, with H. sapiens as the outgroup, and Timetree53 was used to estimate the divergence time of other vertebrates based on the divergence time of chickens and lizards (280 MYA). The evolutionary tree was visualized using iTOL54 (https://itol.embl.de/). According to our phylogenetic tree (Fig. 4), we observed that Nibea coibor is evolutionarily closer to Nibea albiflora, which also belongs to Nibea, with a divergence time of 16.9 MYA. In addition, the two species have a common ancestor with Larimichthys crocea and Collichthys lucidus, which belong to the same family Sciaenidae, and the divergence time of the two clades is 26.4 MYA.

The phylogenetic analysis of Nibea coibor and other 13 species. The numbers in green on the branches indicate average number of nucleotide substitutions per site (the length of the branches not accurately represent the substitution rate), the numbers in black near the nodes indicate the divergence time (million years ago, MYA), and the blue numbers inside the brackets are bootstrap values.
The complete sequence of the mitochondrion (GenBank ID: CM041792.1) of Nibea coibor is included in our assembly. The mitochondrion contains 13 protein-coding genes, 22 tRNA and 2 rRNA genes annotated with MITOS Web Server55 (http://mitos.bioinf.uni-leipzig.de/index.py). The longest mitochondrial CDSs of the above 13 species and Nibea coibor were compared using Clustal Omega (v1.2.4)56. The phylogenetic tree based on mitochondrial sequences was constructed with IQ-TREE (v1.6.12)57,58 and suggests that Nibea coibor is closer to Nibea albiflora, Larimichthys crocea and Collichthys lucidus (Supplementary Fig. 4).
Data Records
The genomic Illumina sequencing data were deposited in the SRA at NCBI SRR1908806559.
The genomic PacBio sequencing data were deposited in the SRA at NCBI SRR1908806460.
The transcriptomic sequencing data were deposited in the SRA at NCBI SRR1908806361.
The Hi-C sequencing data were deposited in the SRA at NCBI SRR1908806262.
The final chromosome assembly was deposited in GenBank at NCBI JALLKU00000000063.
The genome annotation file is available in figshare64.
Technical Validation
The DNA extracted for paired-end sequencing was checked using agarose gel electrophoresis, and the concentration of the DNA was determined using a Qubit Fluorometer (Thermo Fisher Scientific, USA).
The DNA extracted for PacBio sequencing was also checked by agarose gel electrophoresis, showing a main band above 30 kb. The concentration of DNA was determined using a Qubit Fluorometer (Thermo Fisher Scientific, USA), and absorbance was 1.802 at 260/280 using a NanoDrop ND-1000 spectrophotometer (LabTech, USA).
For RNA-seq, total RNA was extracted using TRIzol reagent (Invitrogen, MA, USA) following the manufacturer’s protocol. RNA integrity was evaluated using an Agilent 2100 Bioanalyzer (Agilent Technologies, CA, USA). The sample used in our study had an RNA integrity number (RIN) larger than 8.5.
We generated 89.62 Gb of Hi-C raw reads, and the effective rate was 99.26%. The Q20 and Q30 base qualities of the Hi-C reads were 96.74% and 91.82%, respectively.
Code availability
No specific code was used in this study. The data analyses used standard bioinformatic tools specified in the methods.
References
Yang, H. et al. Characterization of the complete mitochondrial genome sequences of three croakers (Perciformes, Sciaenidae) and novel insights into the phylogenetics. Int. J. Mol. Sci. 19, 1741 (2018).
Zou, W. et al. Effect of dietary vitamin C on growth performance, body composition and biochemical parameters of juvenile Chu’s croaker (Nibea coibor). Aquac. Nutr. 26, 60–73 (2020).
Huang, Y. S., Wen, X. B., Li, S. K., Xuan, X. Z. & Zhu, D. S. Effects of protein levels on growth, feed utilization, body composition, amino acid composition and physiology indices of juvenile chu’s croaker, Nibea coibor. Aquac. Nutr. 23, 594–602 (2017).
Li, Z. et al. Effects of prebiotic mixtures on growth performance, intestinal microbiota and immune response in juvenile chu’s croaker, Nibea coibor. Fish Shellfish Immunol. 89, 564–573 (2019).
Huang, Y., Wen, X., Li, S., Li, W. & Zhu, D. Effects of dietary lipid levels on growth, feed utilization, body composition, fatty acid profiles and antioxidant parameters of juvenile chu’s croaker Nibea coibor. Aquac. Int. 24, 1229–1245 (2016).
Rong, H. et al. Effect of hydroxyproline supplementation on growth performance, body composition, amino acid profiles, blood‐biochemistry and collagen synthesis of juvenile chu’s croaker (Nibea coibor). Aquac. Res. 51, 1264–1275 (2020).
Huang, Y.-S. et al. Effects of conjugated linoleic acid on growth, body composition, antioxidant status, lipid metabolism and immunity parameters of juvenile Chu’s croaker, Nibea coibor. Aquac. Res. 49, 546–556 (2018).
Huang, Y., Wen, X., Li, S., Li, W. & Zhu, D. Effects of dietary fish oil replacement with palm oil on the growth, feed utilization, biochemical composition, and antioxidant status of juvenile Chu’s croaker, Nibea coibor. J. World Aquac. Soc. 47, 786–797 (2016).
Lin, F. et al. Effects of dietary selenium on growth performance, antioxidative status and tissue selenium deposition of juvenile Chu’s croaker (Nibea coibor). Aquaculture 536, 736439 (2021).
Huang, Y. et al. Cloning, tissue distribution, functional characterization and nutritional regulation of Δ6 fatty acyl desaturase in chu’s croaker Nibea coibor. Aquaculture 479, 208–216 (2017).
Lin, Z. et al. Cloning, tissue distribution, functional characterization and nutritional regulation of a fatty acyl Elovl5 elongase in chu’s croaker Nibea coibor. Gene 659, 11–21 (2018).
Zhang, D., Shao, Y., Jiang, S., Li, J. & Xu, X. Nibea coibor growth hormone gene: Its phylogenetic significance, microsatellite variation and expression analysis. Gen. Comp. Endocrinol. 163, 233–241 (2009).
Shan, B., Zhao, L., Gao, T., Lu, H. & Yan, Y. The complete mitochondrial genome of Nibea coibor (Perciformes: Sciaenidae). Mitochondrial DNA Part A 27, 1681–1682 (2016).
Korlach, J. & Turner, S. W. Single-Molecule Sequencing. in Encyclopedia of Biophysics (ed. Roberts, G. C. K.) 2344–2347 (Springer, 2013).
Tao, W. et al. High‐quality chromosome‐level genomes of two tilapia species reveal their evolution of repeat sequences and sex chromosomes. Mol. Ecol. Resour. 21, 543–560 (2021).
Zhu, K. et al. A chromosome-level genome assembly of the yellowfin seabream (Acanthopagrus latus; Hottuyn, 1782) provides insights into its osmoregulation and sex reversal. Genomics 113, 1617–1627 (2021).
Huang, Y. et al. A Chromosome-level genome assembly of the spotted scat (Scatophagus argus). Genome Biol. Evol. 13, evab092 (2021).
Zhou, Y., Qin, W., Zhong, H., Zhang, H. & Zhou, L. Chromosome-level assembly of the Hypophthalmichthys molitrix (Cypriniformes: Cyprinidae) genome provides insights into its ecological adaptation. Genomics 113, 2944–2952 (2021).
Wenger, A. M. et al. Accurate circular consensus long-read sequencing improves variant detection and assembly of a human genome. Nat. Biotechnol. 37, 1155–1162 (2019).
Nurk, S. et al. HiCanu: Accurate assembly of segmental duplications, satellites, and allelic variants from high-fidelity long reads. Genome Res. 30, gr.263566.120 (2020).
Chin, C.-S. et al. Phased diploid genome assembly with single-molecule real-time sequencing. Nat. Methods 13, 1050–1054 (2016).
Cheng, H., Concepcion, G. T., Feng, X., Zhang, H. & Li, H. Haplotype-resolved de novo assembly using phased assembly graphs with hifiasm. Nat. Methods 18, 170–175 (2021).
Pueschel, R., Coraggio, F. & Meister, P. From single genes to entire genomes: the search for a function of nuclear organization. Development 143, 910 (2016).
Rabanal, F. A. et al. Pushing the limits of HiFi assemblies reveals centromere diversity between two Arabidopsis thaliana genomes. Preprint at https://doi.org/10.1101/2022.02.15.480579 (2022).
Martin, M. Cutadapt removes adapter sequences from high-throughput sequencing reads. EMBnet.journal 17, 10 (2011).
Belton, J. M. et al. Hi-C: A comprehensive technique to capture the conformation of genomes. Methods 58, 268–276 (2012).
Durand, N. C. et al. Juicer provides a one-click system for analyzing loop-resolution Hi-C experiments. Cell Syst. 3, 95–98 (2016).
Dudchenko, O. et al. De novo assembly of the Aedes aegypti genome using Hi-C yields chromosome-length scaffolds. Science 356, 92–95 (2017).
Steven, W. et al. HiCUP: pipeline for mapping and processing Hi-C data. F1000res 4, 1310 (2015).
Durbin, L. R. Fast and accurate short read alignment with Burrows–Wheeler transform. Bioinformatics 25, 1754–1760 (2009).
Durand, N. C. et al. Juicebox provides a visualization system for Hi-C contact maps with unlimited zoom. Cell Syst. 3, 99–101 (2016).
Meyne, J., Ratliff, R. L. & Moyzis, R. K. Conservation of the human telomere sequence (TTAGGG)n among vertebrates. Proc. Natl. Acad. Sci. USA 86, 7049–7053 (1989).
Marçais, G. & Kingsford, C. A fast, lock-free approach for efficient parallel counting of occurrences of k-mers. Bioinforma. Oxf. Engl. 27, 764–770 (2011).
Manni, M., Berkeley, M. R., Mathieu, S., Simo, F. A. & Zdobnov, E. M. BUSCO update: novel and streamlined workflows along with broader and deeper phylogenetic coverage for scoring of eukaryotic, prokaryotic, and viral Genomes. Mol. Biol. Evol. 38, 4647–4654 (2021).
Rhie, A., Walenz, B. P., Koren, S. & Phillippy, A. M. Merqury: reference-free quality, completeness, and phasing assessment for genome assemblies. Genome Biol. 21, 245 (2020).
Ou, S. et al. Benchmarking transposable element annotation methods for creation of a streamlined, comprehensive pipeline. Genome Biol. 20 (2019).
Flynn, J. M., Hubley, R., Goubert, C., Rosen, J. & Smit, A. RepeatModeler2 for automated genomic discovery of transposable element families. Proc. Natl. Acad. Sci. USA 117, 9451–9457 (2020).
Grabherr, M. G. et al. Trinity: reconstructing a full-length transcriptome without a genome from RNA-Seq data. Nat. Biotechnol. 29, 644–652 (2011).
Haas, B. J. et al. Improving the Arabidopsis genome annotation using maximal transcript alignment assemblies. Nucleic Acids Res. 31, 5654–5666 (2003).
Hoff, K. J., Lange, S., Lomsadze, A., Borodovsky, M. & Stanke, M. BRAKER1: unsupervised RNA-seq-based genome annotation with GeneMark-ET and AUGUSTUS. Bioinforma. Oxf. Engl. 32, 767–769 (2016).
Mount, D. W. Using the Basic Local Alignment Search Tool (BLAST). Cold Spring Harb. Protoc. 2007, pdb.top17 (2007).
Slater, G. & Birney, E. Automated generation of heuristics for biological sequence comparison. BMC Bioinformatics 6 (2005).
Haas, B. J. et al. Automated eukaryotic gene structure annotation using EVidenceModeler and the Program to Assemble Spliced Alignments. Genome Biol. 9, R7 (2008).
Camacho, C. et al. BLAST+: architecture and applications. BMC Bioinformatics 10, 421 (2009).
Han, Z. et al. Near‐complete genome assembly and annotation of the yellow drum (Nibea albiflora) provide insights into population and evolutionary characteristics of this species. Ecol. Evol. 9, 568–575 (2019).
Cai, M. et al. Chromosome assembly of Collichthys lucidus, a fish of Sciaenidae with a multiple sex chromosome system. Sci. Data 6, 132 (2019).
Emms, D. M. & Kelly, S. OrthoFinder: phylogenetic orthology inference for comparative genomics. Genome Biol. 20 (2019).
Robert, C. & Edgar MUSCLE: multiple sequence alignment with high accuracy and high throughput. Nucleic Acids Res. 32, 1792–1797 (2004).
Castresana, J. Selection of conserved blocks from multiple alignments for their use in phylogenetic analysis. Mol. Biol. Evol. 17, 540–552 (2000).
Gerard, T. & Jose, C. Improvement of Phylogenies after Removing Divergent and Ambiguously Aligned Blocks from Protein Sequence Alignments. Syst. Biol. 56, 564–577 (2007).
Shen, W., Le, S., Li, Y. & Hu, F. SeqKit: a cross-platform and ultrafast toolkit for FASTA/Q file manipulation. PloS One 11, e0163962 (2016).
Koichiro, T., Glen, S. & Sudhir, K. MEGA11: molecular evolutionary genetics analysis version 11. Mol. Biol. Evol. 38, 3022–3027 (2021).
Sudhir, K., Glen, S., Michael, S. & Blair, H. S. TimeTree: a resource for timelines, timetrees, and divergence times. Mol. Biol. Evol. 34, 1812–1819 (2017).
Letunic, I. & Bork, P. Interactive Tree Of Life (iTOL) v5: an online tool for phylogenetic tree display and annotation. Nucleic Acids Res. 49, 293–296 (2021).
Bernt, M. et al. MITOS: Improved de novo metazoan mitochondrial genome annotation. Mol. Phylogenet. Evol. 69, 313–319 (2013).
Sievers, F. et al. Fast, scalable generation of high-quality protein multiple sequence alignments using Clustal Omega. Mol. Syst. Biol. 7, 539 (2011).
Nguyen, L. T., Schmidt, H. A., von Haeseler, A. & Minh, B. Q. IQ-TREE: a fast and effective stochastic algorithm for estimating maximum-likelihood phylogenies. Mol. Biol. Evol. 32, 268–274 (2015).
Hoang, D. T., Chernomor, O., von Haeseler, A., Minh, B. Q. & Vinh, L. S. UFBoot2: improving the ultrafast bootstrap approximation. Mol. Biol. Evol. 35, 518–522 (2018).
NCBI Sequence Read Archive https://identifiers.org/insdc.sra:SRR19088065 (2022).
NCBI Sequence Read Archive https://identifiers.org/insdc.sra:SRR19088064 (2022).
NCBI Sequence Read Archive https://identifiers.org/insdc.sra:SRR19088063 (2022).
NCBI Sequence Read Archive https://identifiers.org/insdc.sra:SRR19088062 (2022).
Yekefenhazi, D. & Li, W. Genbank https://identifiers.org/insdc.gca:GCA_023373845.1 (2022).
Li, W. & Yekefenhazi, D. Nc_GeneModels.gff3. figshare https://doi.org/10.6084/m9.figshare.19609608.v2 (2022).
Acknowledgements
This work was supported by the National Natural Science Foundation of China (grant numbers 31872562); Natural Science Foundation of Fujian Province (No. 2021J01829); and the National Key Research and Development Program of China (grant number 2018YFD0900202).
Author information
Authors and Affiliations
Contributions
W.L. conceived of the project. D.Y., Q.H., W.H. collected the samples and extracted the genomic DNA and RNA. D.Y. and W.L. performed the data analysis and wrote the manuscript. C.S. contributed to the data analyses. X.W. revised the manuscript. All authors read and approved the final version of the manuscript.
Corresponding author
Ethics declarations
Competing interests
The authors declare no competing interests.
Additional information
Publisher’s note Springer Nature remains neutral with regard to jurisdictional claims in published maps and institutional affiliations.
Supplementary information
Rights and permissions
Open Access This article is licensed under a Creative Commons Attribution 4.0 International License, which permits use, sharing, adaptation, distribution and reproduction in any medium or format, as long as you give appropriate credit to the original author(s) and the source, provide a link to the Creative Commons license, and indicate if changes were made. The images or other third party material in this article are included in the article’s Creative Commons license, unless indicated otherwise in a credit line to the material. If material is not included in the article’s Creative Commons license and your intended use is not permitted by statutory regulation or exceeds the permitted use, you will need to obtain permission directly from the copyright holder. To view a copy of this license, visit http://creativecommons.org/licenses/by/4.0/.
About this article

Cite this article
Yekefenhazi, D., He, Q., Wang, X. et al. Chromosome-level genome assembly of Nibea coibor using PacBio HiFi reads and Hi-C technologies. Sci Data 9, 670 (2022). https://doi.org/10.1038/s41597-022-01804-6
Received:
Accepted:
Published:
DOI: https://doi.org/10.1038/s41597-022-01804-6
