Download
1 / 47
480 likes | 988 Views
COMPUTER GRAPHICS. CONTENTS :. Introduction to Image and Objects. Image Representation. Basic Graphics Pipeline. Bitmap and Vector- Based Graphics Applications of Computer Graphics

E N D
CONTENTS: • Introduction to Image and Objects. • Image Representation. • Basic Graphics Pipeline. • Bitmap and Vector- Based Graphics • Applications of Computer Graphics • Display devices: Cathode Ray Tube, Raster-Scan Display, Random-Scan Display, Flat Panel Display,Touch screen • Coordinate System Overview • Scan-Conversion of a Lines(Digital Differential AnalyzerAlgorithm) • Scan-Conversion of a Lines (Bresenham’s Line-Drawing Algorithm)) • Scan-Conversion of a Lines (Bresenham’s Method of Circle Drawing, Midpoint Circle Algorithm) • Drawing Ellipses
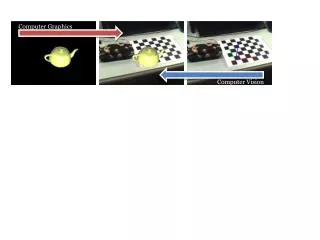
Computer graphics • Field of science concerned with digitally synthesizing and manipulating the visual content. • creating, • Storing • Displaying • manipulating images • Focus on mathematical & computational foundations of image generations . • Manipulation of visual & geometric information using computational techniques.
IMAGES AND OBJECT • Image is a representation of an object on a computer • Symbolic representation other than the text • 2D array of data with values at each element of the array related to a color • Objects are real entities defined in 3D world co-ordinates.
Image representation: Pictures are represented as a collection of discrete picture element called PIXELS. It is the smallest addressable screen element The process of determining the appropriate pixels for representing pictures or objects is called RASTERIZATION. Rasterization is the task of taking an image described in a vector graphics format (shapes) and converting it into a raster image (pixels or dots) for output on a video display or printer, or for storage in a bitmap file format
Scan conversion: The process of representing continuous pictures as graphical object(as a collection of discrete pixel) is called scan conversion. • Digital image is a 2D discrete signal
It is represented as follows: F(x,y)= f(0,0) f(0,1)---------f(0,n-1) . . . f(M-1,0) f(M-1,1)-------f(M-1,N-1)
Basic graphic pipeline • Object in a real world are expressed with respect to a world co ordinate system • The world is then projected into a view plan from a view point • Z axis determines the view direction • Window specifies the area of interest • View volume is the infinite volumeswept by the rays • Near and far clipping plane
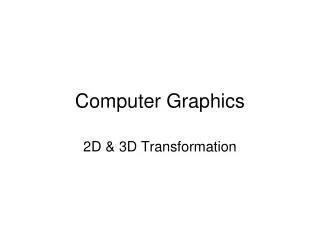
BITMAP (raster) VECTOR BASED • Composed of pixels • Created and edited in photo or paint program • Images are mapped to a grid or an array of pixels • Not easily scalable • Used in photorealistic images involves complex variation • The larger we display a bitmap,the jagged it appears • Composed of paths • Created and edited in software like CoralDraw and Adobe Illustrator • Images have smooth edges and create curves or shapes • Good for precise illustrator but not as good as bitmap • Easily scalable due to the use of mathematical formula • A vector image remains smooth in any size Bitmap and vector based graphics
Raster image Vector images
Application of computer graphics: • Special effects-illusions used in film, television industries to simulate the imagined events in a story. • Visual effects-involves integration of live-action footage with computer generated elements in order to create scenarios which look realistic. • Digital art-an art created on a computer in a digital form • Video games: gaming and animation industry • Computer aided design-used by civil,mechanical & electronic engineers to build the models of buildings,bridges or circuit boards • Medical imaging-used in molecular biology to study the model of the genes
Display device • Display device is a device for presentation of information such as images or a text for visual display. • Eg:CRT(Cathode ray tube) • It is a specialized vacuum tube in which images are produced when an electron beam strikes a phosphorescent surface. • Heat is supplied to the cathode by passing current through a heater element. The cathode is a cylindrical metallic structure
CRT: • Cathode ray tube:
Cathode is rich in electrons. On heating, electrons are released from cathode surface. • Control grid: The control grid is the next element that follows the cathode. • It covers the cathode leaving a small opening for the electron to come out. Intensity of electron is controlled by setting the voltage level on the screen • Brightness could be controlled by varying the voltage • Positively charged anode accelerates the electron
Focusing and deflecting coil are together needed to force the electron beam to converge into a small spot • Or else the electron would repel as it approaches the screen • Deflecting coils produce an extremely low frequency electromagnetic field that allows for the constant adjustment of the direction of the electron beam. • When the electrons in the beam collide with phosphor coating, they are stopped and their kinetic energy is absorbed by the phosphor, resulting in the screen display.
Raster scan display • Most common method of drawing images on CRT tube • Electron beam is swept across the screen one row at a time from top to bottom. • The beam is on,while it moves from left to right and it is off when moves back right to left. • This phenomenon is called horizontal retrace. • When the beam reaches the bottom of the screen it is turned off and is rapidly retraced back to the top to startagain. This is called vertical retrace.
Repeated scanning of the same image is known as refreshing of screen.
Typically, Graphics display consists of three component: 1.Frame buffer: • Stores an image as a matrix of intensity value • It is located on the graphic card that manages the video subsystem of computer. • Stored intensity value are then retrieved from the refresh buffer and displayed on the screen one row at a time. • Each intensity value is represented by zero or one in the frame buffer.
2.Display controller: • Has direct access to memory location in the frame buffer • Responsible for retrieving the data from frame buffer and passing it to the display device. • It reads the data from the frame buffer in the form of 1’s and 0’s in one line and converts them into a corresponding video signal. • And this line is called as Scan Line. 3.TV screen or Monitor: • Final display unit where the image is displayed..
Random scan display • A CRT, as a random scan display unit has an electron beam directed only to the parts of the screen where a picture is to be drawn. • Draws a picture one line at a time. • Also referred to as vector display. • The components of picture can be drawn and refreshed by random scan display. • Example pen plotter
Picture definition is stored as a set of line drawing command in an area of memory called refresh display file. • To display a specified pictures the system cycles through the set of commands in the display file, drawing each component line one by one.
Raster scan display Random scan display • Draws the image by scanning one row at a time • Resolution is limited to the pixel size. • Lines are jiggered and curves are less smooth. • Geometric areas drawing application • Eg: monitor and TV • Draws the image by directing the electron beam directly to the part of the screen • Higher resolution • Line plots are straight, and curves are smooth • More suited for line drawing application • Eg: CRO and pen plotter Differences
Flat panel display: • Flat panel display :video display that are much lighter and thinner then traditional television. • Examples: cellular phones, digital cameras,LCD(Liquid Crystal display)TV and computer displays etc. • Two categories-volatile display & statics display • Volatile display-It requires constant power output to refresh the image on screen. • Volatile display is one of the type of flat panel display. • Eg: plasma display , liquid crystal display.
Plasma display panel • It is composed of two parallel glass plates separated by a precise spacing of some tenth of a mm in size and sealed around the edges. • The space between the plates is filled with a mixture of rare gases(neon & xenon) at a pressure less than one atmosphere. • Parallel stripes of conducting material are deposited on each plate with the stripes on one plate perpendicular to those on the other. • These stripes are electrodes to which voltage is applied
The intersection of the rows of electrodes on one side & columns of electrodes on opposite glass plate define the individual cell. • The central element in a fluroscent light is plasma (a gas made up of free flowing ions,electrically charged atoms) & elcetrons(-vely charged particles.) • In plasma with an electrical current running through it, -vely charged particles are rushing towards the +vely charged area of the plasma,& vice versa. • Rush particles are constantly bumping into each other. • The gas in the cell is electrically turned into plasma,which then excites phosphors to emit light. • Plasma display is to illuminate tiny coloredfluroscent lights to form an image. • The red green and blue phosphors are deposited inside these structures.
Touch screen • A touch screen is an input device that allows users to operate a PC or similar device by simply touching the display screen. • Touch screen takes input by a finger or other object such as stylus • A basic touch screen has three main components • Touch sensor • Controller • Software driver
Touch sensor: • A touch sensor is a clear glass panel with a touch responsive surface • The touch sensor is placed over a display screen so that responsive area of the panel covers the viewable area of the video screen. • The sensor generally has an electric current running through it and touching the screen causes a voltage change • This voltage is used to determine the location of the touch on the screen
Controller: • A controller is a small PC card that connects between the touch sensor and the PC • It takes information from sensor and translates it into information that a PC can understand. • The controller is usually installed inside the monitor • Controllers can be connected to a serial port or USB.
Software Drivers: • A driver is a s/w update for a PC system that allows the touch screen and computer to work together. • It tells the OS how to interpret the touch event information that is send from the controller. • This makes touching the screen same as clicking your mouse at the same location on the screen. • This allows the touch screen to work with existing s/w without the need for touch screen specific programming
Coordinate System Overview: • It is a framework that defines the position of points in a space either in two or three dimensions. • It is used to determine the each point uniquely in a plane through two numbers usually called x and y coordinate of the point.
SCAN CONVERSION ALGORITHM: SCAN C
INTRODUCTION: • Scan conversion is a general form for drawing methods, which create raster images according to picture primitives. • The term is mainly used for drawing methods for 2D picture elements or primitives such as lines, polygons and text. • The process to determine which pixel provides the best approximation to shape the object is called as rasterization, and when such procedure is combined with picture generation using scan line is called as Scan Conversion. • Scan conversion of any object requires scan conversion of lines and curves.
1.Digital differential analyzer(DDA) Algorithm- • It is an incremental scan-conversion method to determine points on a line. • Algorithm: 1: Input the coordinates of the two end points A(x1,y1) & B(x2,y2) for the line AB respectively. 2: Calculate dx=x2-x1 & dy=y2-y1 3: Calculate the length L if abs(x2-x1) >= abs(y2-y1) then L=abs(x2-x1) else L=abs(y2-y1) 4: Calculate the incremental factor X = (x2-x1)/L And Y = (y2-y1) /L
5: Initialize the initial point on the line & plot xnew = x1 + 0.5 & ynew = y1 + 0.5 plot(Integer xnew , Integer ynew) The values are rounded using the factor of 0.5 rather than truncating so that the central pixel addressing is handled correctly. 6: [Obtain the new pixel on the line & plot the same] Initialize i =1
While(i<=L) { xnew=xnew + ∆x ynew = ynew+ ∆ y plot(Integer xnew , Integer ynew) i=i+1 } 7: Finish
Advantages : • Simple & fast • Does not require special skills for implementing it in any programming language. • Disadvantage: • Though this method is fast ,accumulation of rounding off errors may drift the pixel away from the actual pixels.
2.The Bresenham’s Line Drawing Algorithm • The Bresenham’s algorithm uses only integer addition, subtraction and multiplication by 2 • And we know that computer can perform integer addition and subtraction very rapidly. • Thecomputer is also time efficient when performing integer multiplication by 2. • The basic principle of Bresenham’s algorithm is to select the optimum raster locations to represent a straight line.
To accomplish this the algorithm always increments either x or y by one unit depending upon the slope of the line. • The increment in other variable is determined by examining the distance between the actual line location and the nearest pixel. • This distance is called decision variable or error. • The error term is initially set as e=2*∆y-∆x. • Let us study the algorithm now:
Algorithm: • Read the coordinates of the two end points (x1,y1) & (x2,y2) such that they are not equal.(if equal then plot that point and exit) • ∆x=│x2-x1│ and ∆y=│y2-y1│. • Initialize the starting point i.e x=x1 and y=y1. • Calculate e= 2∆y-∆x • Initialize i=1. • Plot(x,y)
7. While(e≥0) { y=y+1 e=e-2*∆x } x=x+1 e=e+2*∆y 8. i=i+1 9. if(i≤∆x) then go to step 6. 10. Stop.
Bresenham’s Circle drawing Algorithm: • The Bresenham’s circle drawing algorithm considers the eight way of the symmetry of the circle to generate it. • It plots 1/8th part of the circle i.e. from 90ᵒ to 45ᵒ. • As circle is drawn from 90ᵒ to 45ᵒ,the x moves in x direction and y moves in the negative direction.
Algorithm to plot 1/8 of the circle: • Read the radius (r) of the circle. • Initialize the decision variable. d=3-2r • Initialize the starting point x=0 and y=r. • Do { plot(x,y) if(d<0)then {d=d+4x+6} else {d=d+4(x-y)+10 y=y-1 } x=x+1 }while(x<y) 5. Stop.
Midpoint circle drawing algorithm: • It also uses the eight way symmetry of the circle to generate it. • It plots 1/8th part of the circle i.e. from 90ᵒ to 45ᵒ. • As circle is drawn from 90ᵒ to 45ᵒ,the x moves in x direction and y moves in the negative direction. • To draw a 1/8 part of the circle we take unit steps in the positive x direction and make use of decision parameter to determine which of the two possible y positions is closer to the circle path at each step
Algorithm: • Read the radius (r) of the circle. • Initialize the starting point x=0 and y=r. • Calculate the initial value of the decision parameter as p=1.25-r • Do { plot(x, y) if(d<0)then { p=p+2x+3; else p=p+2(x-y)+5; y=y-1; }
End if X=x+1; }while(x<y) 5. Finish