Technology
Apple’s Colossal Market Cap as it Hits $3 Trillion
Article/Editing:
Apple’s Colossal Market Cap in Context
In January of 2019, Apple’s market capitalization stood at $700 billion.
While this was perceived as a colossal figure at the time, when we fast forward to today, that valuation seems a lot more modest. Since then, Apple has surged to touch a $3 trillion valuation on January 3rd, 2022.
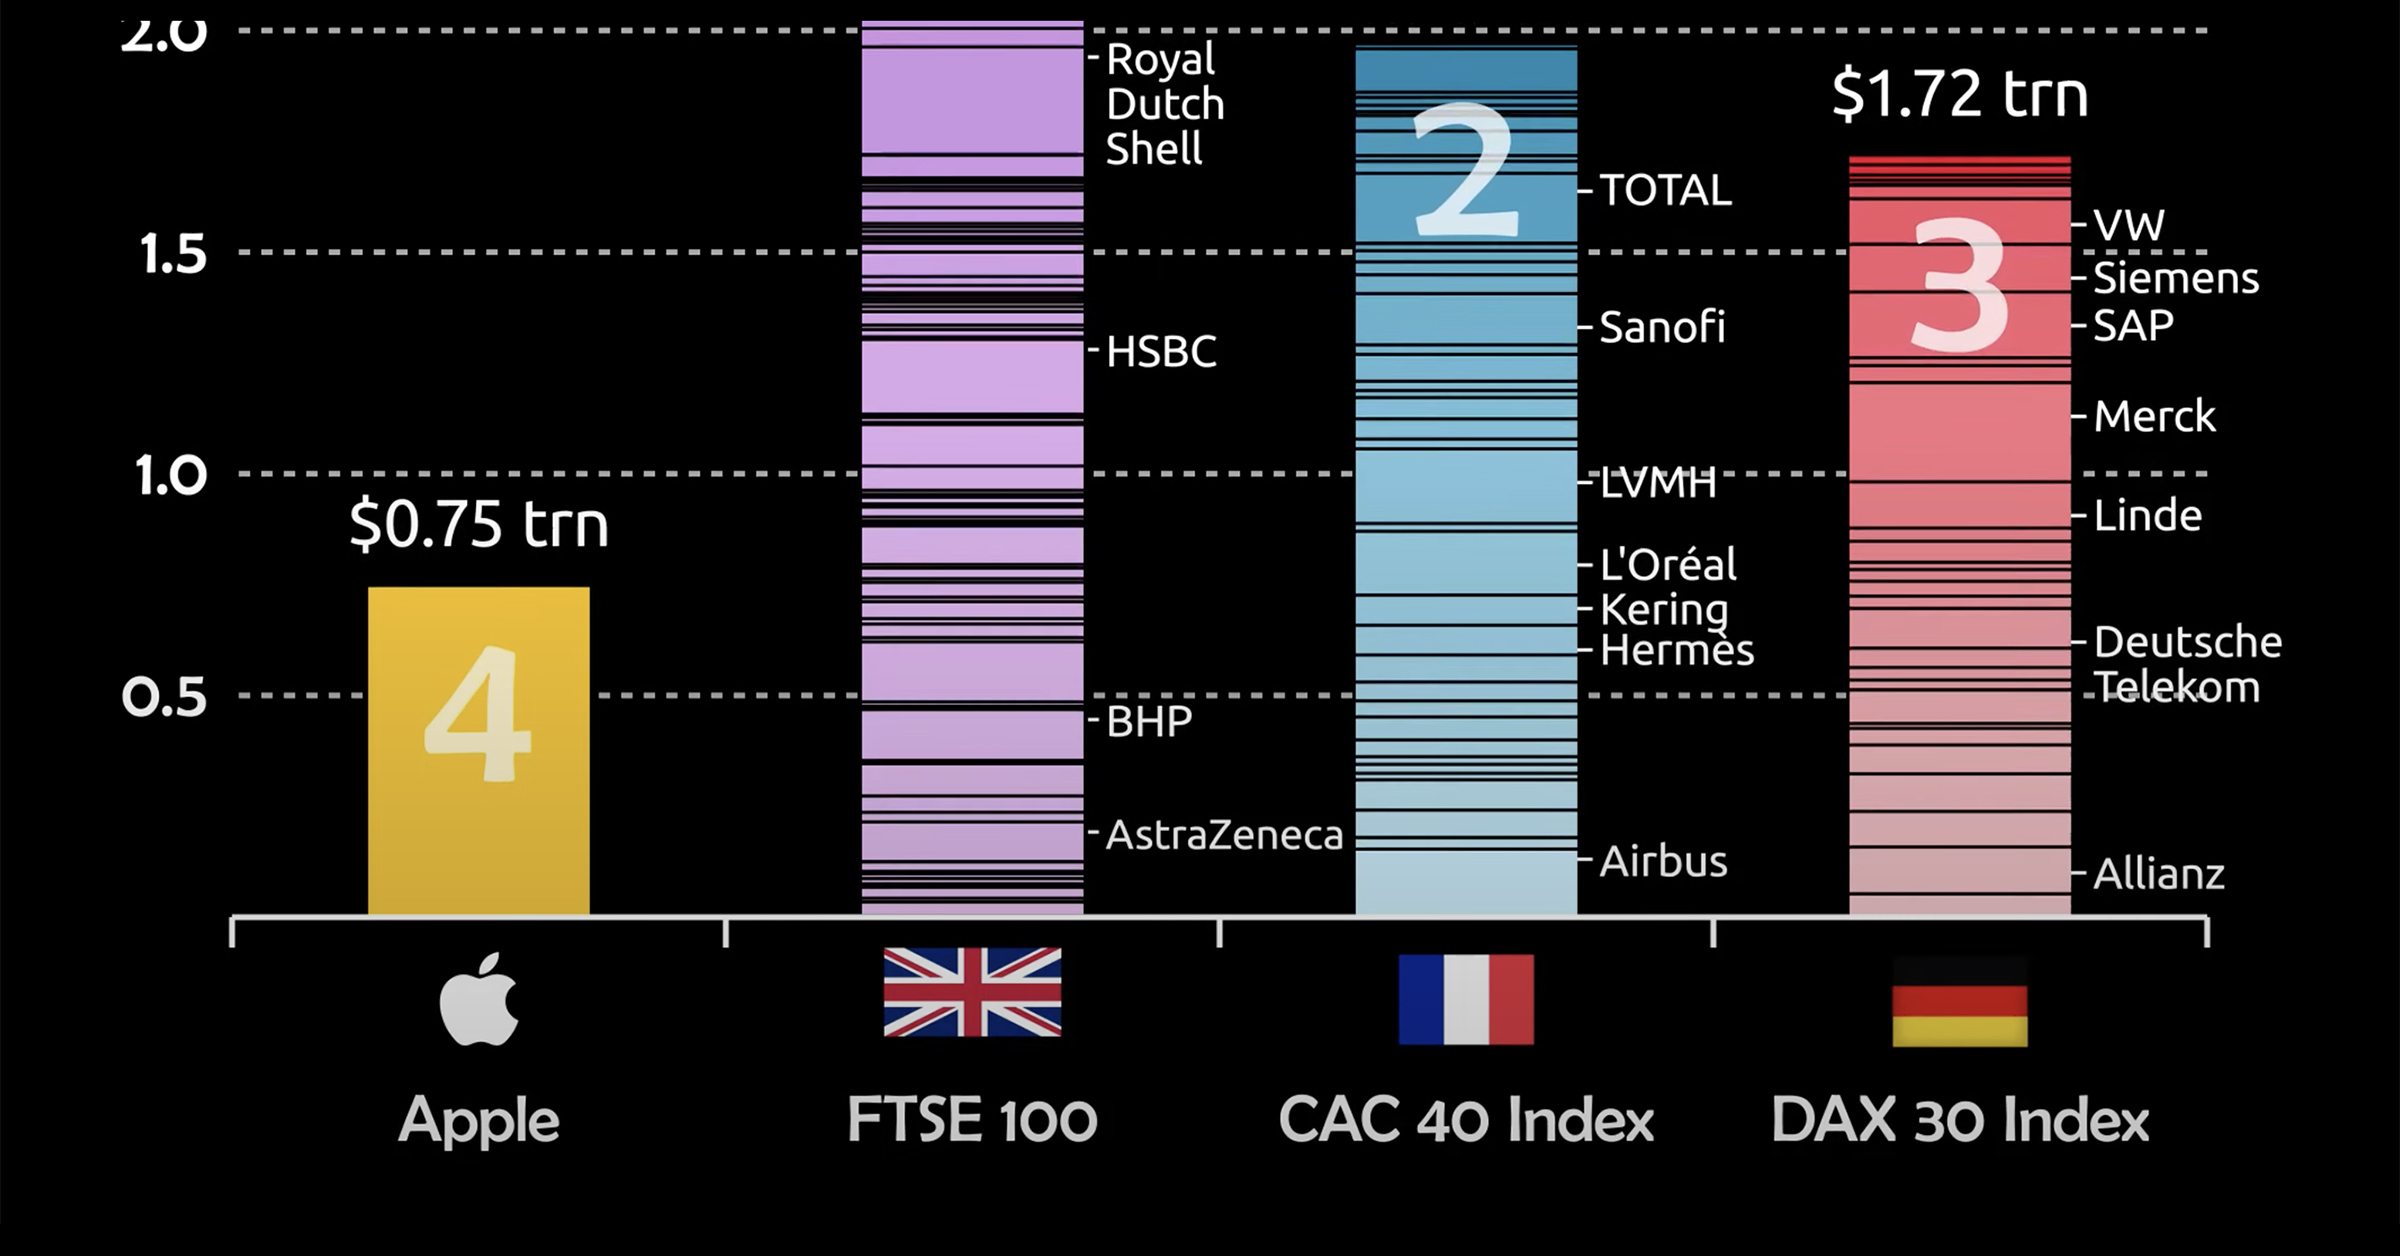
To gauge just how monstrous of a figure this is, consider that Apple is no longer comparable to just companies, but to countries and even entire stock indexes. This animation from James Eagle ranks the growth in Apple’s market cap alongside top indexes from the UK, France, and Germany.
Let’s take a closer look.
Apple Takes On Europe
The three indexes Apple is compared to are heavyweights in their own right.
The FTSE 100 consists of giants like HSBC and vaccine producer AstraZeneca, while the CAC 40 Index is home to LVMH, which made Bernard Arnault the richest man in the world for a period of time last year.
Nonetheless, Apple’s market cap exceeds that of the 100 companies in the FTSE, as well as the 40 in each of the CAC and DAX indexes.
| Stock/Index | Market Cap ($T) | Country of Origin |
|---|---|---|
| Apple | $3.00T | 🇺🇸 |
| FTSE 100 | $2.90T | 🇬🇧 |
| CAC 40 Index | $2.76T | 🇫🇷 |
| DAX 40 (Dax 30) Index* | $2.50T | 🇩🇪 |
*Germany’s flagship DAX Index expanded from 30 to 40 constituents in September 2021.
It’s important to note, that while Apple’s growth is stellar, European companies have simultaneously seen a decline in their share of the overall global stock market, which helps make these comparisons even more eye-catching.
For example, before 2005, publicly-traded European companies represented almost 30% of global stock market capitalization, but those figures have been cut in half to just 15% today.
Here are some other approaches to measure Apple’s dominance.
Apple’s Revenue Per Minute vs Other Tech Giants
Stepping away from market capitalization, another unique way to measure Apple’s success is in how much sales they generate on a per minute basis. In doing so, we see that they generate a massive $848,090 per minute.
Here’s how Apple revenue per minute compares to other Big Tech giants:
| Company | Revenue Per Minute |
|---|---|
| Amazon | $955,517 |
| Apple | $848,090 |
| Alphabet (Google) | $433,014 |
| Microsoft | $327,823 |
| $213,628 | |
| Tesla | $81,766 |
| Netflix | $50,566 |
Furthermore, Apple’s profits aren’t too shabby either: their $20.5 billion in net income last quarter equates to $156,000 in profits per minute.
How Apple Compares To Countries
Lastly, we can compare Apple’s market cap to the GDP of countries.
| Country (excluding Apple) | Total Value ($T) |
|---|---|
| Apple | $3.0T |
| Italy | $2.0T |
| Brazil | $1.8T |
| Canada | $1.7T |
| Russia | $1.7T |
| South Korea | $1.6T |
| Australia | $1.4T |
| Spain | $1.4T |
| Mexico | $1.3T |
| Indonesia | $1.1T |
What might be most impressive here is that Apple’s market cap eclipses the GDP of major developed economies, such as Canada and Australia. That means the company is more valuable than the entire economic production of these countries in a calendar year.
That’s some serious scale.

This article was published as a part of Visual Capitalist's Creator Program, which features data-driven visuals from some of our favorite Creators around the world.


Technology
All of the Grants Given by the U.S. CHIPS Act
Intel, TSMC, and more have received billions in subsidies from the U.S. CHIPS Act in 2024.


All of the Grants Given by the U.S. CHIPS Act
This was originally posted on our Voronoi app. Download the app for free on iOS or Android and discover incredible data-driven charts from a variety of trusted sources.
This visualization shows which companies are receiving grants from the U.S. CHIPS Act, as of April 25, 2024. The CHIPS Act is a federal statute signed into law by President Joe Biden that authorizes $280 billion in new funding to boost domestic research and manufacturing of semiconductors.
The grant amounts visualized in this graphic are intended to accelerate the production of semiconductor fabrication plants (fabs) across the United States.
Data and Company Highlights
The figures we used to create this graphic were collected from a variety of public news sources. The Semiconductor Industry Association (SIA) also maintains a tracker for CHIPS Act recipients, though at the time of writing it does not have the latest details for Micron.
| Company | Federal Grant Amount | Anticipated Investment From Company |
|---|---|---|
| 🇺🇸 Intel | $8,500,000,000 | $100,000,000,000 |
| 🇹🇼 TSMC | $6,600,000,000 | $65,000,000,000 |
| 🇰🇷 Samsung | $6,400,000,000 | $45,000,000,000 |
| 🇺🇸 Micron | $6,100,000,000 | $50,000,000,000 |
| 🇺🇸 GlobalFoundries | $1,500,000,000 | $12,000,000,000 |
| 🇺🇸 Microchip | $162,000,000 | N/A |
| 🇬🇧 BAE Systems | $35,000,000 | N/A |
BAE Systems was not included in the graphic due to size limitations
Intel’s Massive Plans
Intel is receiving the largest share of the pie, with $8.5 billion in grants (plus an additional $11 billion in government loans). This grant accounts for 22% of the CHIPS Act’s total subsidies for chip production.
From Intel’s side, the company is expected to invest $100 billion to construct new fabs in Arizona and Ohio, while modernizing and/or expanding existing fabs in Oregon and New Mexico. Intel could also claim another $25 billion in credits through the U.S. Treasury Department’s Investment Tax Credit.
TSMC Expands its U.S. Presence
TSMC, the world’s largest semiconductor foundry company, is receiving a hefty $6.6 billion to construct a new chip plant with three fabs in Arizona. The Taiwanese chipmaker is expected to invest $65 billion into the project.
The plant’s first fab will be up and running in the first half of 2025, leveraging 4 nm (nanometer) technology. According to TrendForce, the other fabs will produce chips on more advanced 3 nm and 2 nm processes.
The Latest Grant Goes to Micron
Micron, the only U.S.-based manufacturer of memory chips, is set to receive $6.1 billion in grants to support its plans of investing $50 billion through 2030. This investment will be used to construct new fabs in Idaho and New York.

-

 Sports1 week ago
The Highest Earning Athletes in Seven Professional Sports
-

 Countries2 weeks ago
Population Projections: The World’s 6 Largest Countries in 2075
-

 Markets2 weeks ago
The Top 10 States by Real GDP Growth in 2023
-

 Demographics2 weeks ago
The Smallest Gender Wage Gaps in OECD Countries
-

 United States2 weeks ago
Where U.S. Inflation Hit the Hardest in March 2024
-

 Green2 weeks ago
Top Countries By Forest Growth Since 2001
-

 United States2 weeks ago
Ranked: The Largest U.S. Corporations by Number of Employees
-

 Maps2 weeks ago
The Largest Earthquakes in the New York Area (1970-2024)