
You also want an ePaper? Increase the reach of your titles
YUMPU automatically turns print PDFs into web optimized ePapers that Google loves.
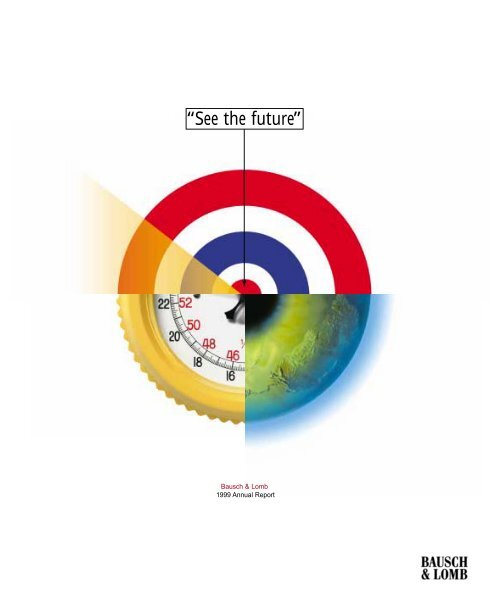
“See the future”<br />
<strong>Bausch</strong> & <strong>Lomb</strong><br />
<strong>1999</strong> <strong>Annual</strong> <strong>Report</strong>
Revenue<br />
($ in millions)<br />
Earnings<br />
($ in millions)<br />
Comparable basis*<br />
Vision Care<br />
1,029.5<br />
971.2<br />
918.1<br />
97 98 99 98 99<br />
97 98 99<br />
Vision Care<br />
210.9 208.4<br />
200.5<br />
Contents<br />
Surgical<br />
384.7<br />
432.7<br />
Surgical<br />
43.0<br />
64.1<br />
Pharmaceuticals<br />
190.6<br />
Financial Highlights . . . . . . . . . . . . . . . . . . . . . . . .IFC<br />
Letter to Shareholders . . . . . . . . . . . . . . . . . . . . . . . . .1<br />
Financial Review . . . . . . . . . . . . . . . . . . . . . . . . . . . . .9<br />
Financial Statements and Notes . . . . . . . . . . . . . . . . .19<br />
<strong>Report</strong>s of Management, Audit Committee<br />
and Independent Accountants . . . . . . . . . . . . . . .44<br />
Directors and Officers . . . . . . . . . . . . . . . . . . . . . . . .46<br />
36.6<br />
241.6<br />
293.9<br />
Pharmaceuticals<br />
97 98 99 98 99<br />
97 98 99<br />
* Comparable basis excludes restructuring charges, asset write-offs and other significant charges.<br />
49.2<br />
66.1
At a Glance<br />
Key Products<br />
Vision Care<br />
Surgical<br />
Pharmaceuticals<br />
Prescription<br />
OTC<br />
ReNu: The ReNu line is the global market leader in the growing chemical disinfectant<br />
segment for soft contact lens care. ReNu MultiPlus solution was the first one-bottle<br />
multi-purpose solution for soft lenses to eliminate the need for a separate enzymatic<br />
cleaner. Other products include a companion rewetting drop for ReNu MultiPlus and<br />
preservative-free rewetting/lubricating drops designed for use with soft contact lenses.<br />
SofLens: A number of contact lens products are offered under the SofLens name.<br />
SofLens one day lenses are daily disposable lenses manufactured using a low-cost<br />
production process. SofLens66 toric lenses are high performance cast-molded lenses<br />
for people with astigmatism that compete in the planned replacement category.<br />
PureVision: <strong>Bausch</strong> & <strong>Lomb</strong>’s newest contact lens, which offers a high degree<br />
of oxygen permeability and is approved for seven- to 30-day extended wear,<br />
depending on approvals in specific markets.<br />
Boston: The Boston line of contact lenses and lens care products has a commanding<br />
lead in the global rigid gas permeable (RGP) category. Recent introductions include<br />
Boston EO, an RGP lens with high oxygen permeability and excellent lathing<br />
properties, and Boston Enhanced Original Formula Conditioning Solution, a<br />
solution with improved RGP lens wetting performance.<br />
Technolas 217: Narrow-beam advanced scanning excimer laser, capable of offering<br />
integrated microkeratome and excimer laser procedures. The Technolas 217 laser has<br />
recently received FDA approval in the U.S. and is the leading laser outside the U.S.<br />
Hansatome: Advanced, pivotal action microkeratome for superior positioned hinge.<br />
The Hansatome is the best-selling microkeratome on the market today.<br />
Orbscan II: Corneal and anterior segment topography system that simultaneously<br />
measures the curvature and elevation of both surfaces of the cornea, as well<br />
as the anterior lens and iris.<br />
Millennium: Advanced microsurgical system with both anterior segment<br />
and posterior segment functionality. The Millennium system's modular<br />
design allows surgeons to keep pace with innovations in ophthalmic surgery.<br />
Intraocular Lenses (IOLs) and Delivery Systems: One- and three-piece minimally<br />
invasive, small incision IOLs, including the Soflex line, as well as the Passport and<br />
MPORT delivery devices for cataract surgery.<br />
AMVISC/AMVISC Plus: Viscoelastic products indicated for both anterior and<br />
posterior segment procedures, including extraction of cataracts, insertion of IOLs,<br />
corneal transplantation surgery, glaucoma filtering surgery and surgical procedures<br />
to reattach the retina.<br />
Vitrasert: Posterior chamber implant which offers sustained therapeutic drug delivery<br />
for several months. The product contains the drug ganciclovir and is used to treat<br />
CMV retinitis.<br />
Lotemax: An ophthalmic steroid designed for effective treatment of inflammation<br />
with an excellent safety profile. Active ingredient is loteprednol etabonate 0.5%.<br />
Alrex: Ophthalmic suspension containing a lower concentration of loteprednol<br />
etabonate (0.2%), designed specifically to relieve signs and symptoms of seasonal<br />
allergic conjunctivitis.<br />
Ocuvite: Number one recommended vitamin/mineral supplement brand by eye care<br />
professionals. Contains certain antioxidants that may assist in maintaining the health<br />
of the eye. Product offerings include Ocuvite and Ocuvite Extra tablets and Ocuvite<br />
Lutein capsules, which contain the carotenoid lutein, a highly protective antioxidant<br />
found in the crystalline lens and retinal pigment of the eye.<br />
New Product Pipeline*<br />
*Note: New Product Pipeline products have not yet received regulatory approvals for marketing in the U.S. and/or are currently under development.<br />
Prescription<br />
OTC<br />
New Planned Replacement Lens: New contact lens manufactured using<br />
the same low-cost process as our one-day lenses. The lens is expected to<br />
compete in the two-week planned replacement market in the U.S. and the<br />
monthly market overseas.<br />
Rapid Disinfecting Solution: Multi-purpose regimen designed to reduce<br />
disinfecting time for soft contact lenses.<br />
Next Generation One Bottle RGP Care Regimen: New RGP lens care solution<br />
designed to provide improved cleaning.<br />
Continuous Wear Program: Various next generation continuous wear contact<br />
lenses and lens care products.<br />
New Lens Care Solution: Multi-purpose regimen designed to reduce soft<br />
contact lens handling and improve convenience.<br />
Aberrometer Wavefront Technology: Diagnostic technology that provides<br />
a wavefront analysis of the entire optical system in addition to providing a<br />
complete and accurate refraction of the eye.<br />
Customized Ablation: Software technology designed to provide customized<br />
refractive surgery based upon integrated diagnostics.<br />
Surodex: Controlled drug delivery system designed to treat inflammation<br />
following cataract surgery.<br />
Catarex: Minimally invasive new surgical technology for removal of cataracts.<br />
MPORT SI Inserter: Next generation microincision insertion device for<br />
foldable IOLs.<br />
Hydrophilic Acrylic IOL: Advanced minimally invasive acrylic IOL and inserter.<br />
Phakic IOL (next generation): Comprehensive platform technology designed<br />
to allow for additive as well as subtractive refractive correction.<br />
Perfluorocarbon II: Intraocular gas used to flatten the retina while healing<br />
occurs following surgical correction of detached retina.<br />
Loteprednol Etabonate Combination: Loteprednol etabonate/anti-infective<br />
combination, designed to treat inflammatory and infectious conditions of<br />
the eye.<br />
Next Generation Anti-Infective: Iodine-based anti-infective, designed as<br />
a “universal anti-infective” to treat all causes of ocular infections (bacterial,<br />
viral and fungal).<br />
Vitreous Implant Technology: System designed to deliver pharmaceutical<br />
products directly to the back of the eye. The potential exists to treat numerous<br />
retinal diseases.<br />
Long-Lasting Dry Eye Drop: Designed to relieve dry eye symptoms longer<br />
than existing monograph products.<br />
Next Generation Allergy Drop: Designed to offer superior symptom relief<br />
for allergic conjunctivitis and to relieve dryness.
Contact<br />
Lenses 62%<br />
Global Vision Care Market<br />
Growth Rates<br />
Total 5 – 8%<br />
Contact Lenses 9 – 12%<br />
Lens Care (1) – 1%<br />
Global Market $4.7 Billion<br />
Lens Care 38%<br />
Global Ophthalmic Pharmaceuticals Market<br />
Anti-Infective<br />
21%<br />
Global Ophthalmic Surgery Market<br />
Vitreoretinal 12%<br />
Refractive 25%<br />
Other 8%<br />
Anti-Inflammatory 9%<br />
Source: Company Estimates<br />
Growth Rates<br />
Total 11 – 14%<br />
Cataract 3 – 5%<br />
Refractive 35 – 40%<br />
Vitreoretinal 5%<br />
Global Market $1.8 Billion<br />
Back of the Eye 1%<br />
Allergy 17%<br />
Growth Rates<br />
Total 5 – 8%<br />
Glaucoma 5 – 7%<br />
Allergy 3 – 5%<br />
Anti-Infective (2) – 0%<br />
Anti-Inflammatory 0 – 2%<br />
Back of the Eye 100+%<br />
Global Market $3.9 Billion<br />
Cataract 63%<br />
Glaucoma 44%<br />
Financial Highlights<br />
For The Years Ended December 27, 1997,<br />
December 26, 1998 and December 25, <strong>1999</strong><br />
Dollar Amounts In Millions – Except Per Share Data<br />
1997 1998 <strong>1999</strong><br />
Business Results<br />
Net sales $1,108.7 $1,597.5 $1,756.1 10%<br />
Segment earnings 247.5 300.6 330.7 10%<br />
Operating earnings – reported 162.9 169.5 214.2 26%<br />
Operating earnings – comparable basis † 202.0 248.0 267.7 8%<br />
Income from continuing operations 62.0 55.6 102.7 85%<br />
Net income 49.4 25.2 444.8 *<br />
Per share:<br />
Continuing operations – diluted 1.12 0.99 1.75 77%<br />
Net income – diluted 0.89 0.45 7.59 *<br />
Dividends declared 1.04 1.04 1.04 –<br />
Shareholders’ equity at year end 14.82 14.93 21.48 44%<br />
Capital expenditures 126.1 201.5 155.9<br />
Working capital 202.9 774.4 1,190.7<br />
Diluted Common shares outstanding (000s) 55,654 56,367 58,639<br />
Return on average shareholders’ equity 5.9% 3.1% 43.3%<br />
Return on invested capital 5.0% 3.8% 21.7%<br />
High/low stock price $47 7 ⁄8 – $32 1 ⁄2 $59 3 ⁄8 – $37 3 ⁄4 $83 3 ⁄8 – $52 5 ⁄8<br />
† Represents company’s results excluding amounts related to restructuring charges and asset write-offs and other significant charges.<br />
* Represents an increase in excess of 100%.<br />
The Future… something that<br />
everyone reaches at the rate of sixty<br />
minutes an hour… sixty seconds<br />
a minute… it’s here, it’s now.<br />
At <strong>Bausch</strong> & <strong>Lomb</strong>, we make<br />
every second count.<br />
Percentage Change<br />
from 1998
Dear Fellow Shareholders:<br />
We entered the year 2000 as a very different company than the one that<br />
began <strong>1999</strong>. During the past year we successfully completed our strategic<br />
realignment and firmly established our future as a technology-based<br />
health care company for the eye.<br />
We did this by divesting our non-strategic businesses and by augmenting<br />
our core business portfolio through acquisitions – principally in the surgical<br />
segment. We evolved organizationally and streamlined our administrative<br />
functions to move from a diversified holding company to a more<br />
integrated operating company that can leverage our unique skills and<br />
combined capabilities. As a result, millions of dollars in savings are being<br />
reinvested in new products and providing improvements in profitability.<br />
The future is now.<br />
“We’re creating it.”<br />
William M. Carpenter<br />
Chairman and Chief<br />
Executive Officer<br />
“We’re focused on it.”<br />
Carl E. Sassano<br />
President and Chief<br />
Operating Officer
Advanced Products<br />
for Contact Lens Wear<br />
Over the last three years,<br />
<strong>Bausch</strong> & <strong>Lomb</strong>’s full<br />
line of products for the<br />
contact lens wearer has<br />
been transformed with the<br />
introduction of innovative<br />
new products. Perhaps<br />
the most revolutionary is<br />
PureVision, a breakthrough<br />
contact lens designed to<br />
be worn continuously from<br />
seven days up to a month<br />
at a time, depending on<br />
regulatory approvals. Its<br />
patented material offers an<br />
optimal balance of attributes<br />
for healthy and comfortable<br />
extended wear. New products<br />
such as PureVision<br />
lenses have reestablished<br />
<strong>Bausch</strong> & <strong>Lomb</strong> as the technology<br />
leader in vision care.<br />
During <strong>1999</strong>, we dramatically ramped up our investment in research<br />
and development (R&D), with spending increasing 27% to 5.6% of net<br />
sales. Our focus on technology generated accelerated revenue growth, with<br />
our ongoing businesses posting a healthy 10% gain over 1998. Products<br />
introduced over the past 24 months drove this expansion, accounting for<br />
more than 20% of total revenues.<br />
Our emphasis on improving the top line through higher margin eye<br />
care products, combined with aggressive product and administrative cost<br />
reduction programs, has led to a renewed focus on profitable growth. For<br />
the year, net earnings and earnings per share from continuing operations<br />
before one-time events increased 31% and 27%, respectively.<br />
The divestiture of<br />
non-strategic businesses<br />
also significantly strengthened<br />
the financial<br />
health of the company. The roughly $1 billion in proceeds<br />
we received reduced our debt to capital ratio to 45.3% (from<br />
63.5% in 1998) and significantly enhanced our ability to<br />
fund future acquisition opportunities to accelerate further<br />
growth and add shareholder value. We are using a portion of<br />
the proceeds to buy back up to five million shares of stock<br />
because we believe it's a great investment that will improve<br />
the return to our shareholders, a goal of any EVA company.<br />
As our financial strength and performance have improved,<br />
so too has our stock price. Over the past two years, the value<br />
of <strong>Bausch</strong> & <strong>Lomb</strong> shares has increased at a compound rate<br />
“Our goals are in focus”<br />
See the future 2<br />
<strong>Bausch</strong> & <strong>Lomb</strong>
Increased R&D<br />
Driving Revenue<br />
Growth<br />
Percent of consolidated sales<br />
New & innovative products will continue to drive growth.<br />
Research &<br />
Development<br />
Expense<br />
4.5 4.8 5.6<br />
97 98 99<br />
See the future 3 <strong>Bausch</strong> & <strong>Lomb</strong><br />
Sales from<br />
Products Introduced<br />
Since 1997<br />
2.7<br />
11.4<br />
20.6<br />
97 98 99<br />
Timing:<br />
Delivering<br />
new technologies<br />
We’re in a race against time.<br />
Time to bring new and better<br />
products to market. To win<br />
that race we’ve stepped up<br />
our efforts in research and<br />
development, investing<br />
more, and investing smarter.<br />
Our efforts are paying off<br />
in innovative new products<br />
that are propelling our<br />
growth. In our vision care<br />
business alone, almost 20%<br />
of <strong>1999</strong> revenues came from<br />
products introduced in just<br />
the past two years. We are<br />
committed to investing<br />
more each year to develop<br />
new technologies, because<br />
time doesn’t stand still.
of 31%, outstripping the gains in both the S&P 500 and the S&P<br />
Health Care Composite indices.<br />
So, what does the future hold? Only time will tell, but certainly our<br />
vision of being Number One in the Eyes of the World will drive and<br />
provide focus to all that we do.<br />
We are the global leader in products for the contact lens wearer –<br />
and intend to stay that way! We'll do this by continuing to introduce<br />
technologically differentiated products and by further expanding our<br />
geographic reach. Over the past few years, we have transformed our<br />
vision care offerings through the introduction of four new products:<br />
SofLens one day contact lenses for daily wear; SofLens66 toric, our technologically<br />
advanced twoweek<br />
disposable contact<br />
lens for people with<br />
astigmatism; PureVision, our<br />
breakthrough contact lens designed for continuous wear and<br />
approved for seven-day wear in the U.S. and 30-day wear in<br />
Europe; and ReNu MultiPlus, the first truly all-in-one lens<br />
care product. We will introduce a new two-week conventional<br />
spherical contact lens in the first half of 2000,<br />
produced using the same low-cost manufacturing<br />
process as our one-day lens. Based on the<br />
successful expansion of these products, we have moved to<br />
reduce cost further and to consolidate our contact lens<br />
manufacturing into “centers of excellence.” Together, we<br />
expect these factors to allow us to accelerate revenue growth,<br />
increase market share and improve the profitability of our<br />
vision care business in 2000 and beyond.<br />
“Our view is precise”<br />
Leading the Way in<br />
Refractive Surgery Products<br />
Among <strong>Bausch</strong> & <strong>Lomb</strong>’s<br />
comprehensive offerings<br />
for refractive surgery is<br />
the Technolas 217, pictured<br />
above, an advanced small<br />
beam, spot-scanning laser.<br />
Already the technology<br />
leader outside the U.S., it<br />
recently received regulatory<br />
clearance for the U.S. market.<br />
At center is a sample<br />
corneal map generated<br />
by the Orbscan II corneal<br />
topographer, the only<br />
diagnostic tool of its<br />
kind that maps both the<br />
front and back surfaces<br />
of the cornea, providing<br />
invaluable information<br />
to the refractive surgeon.<br />
See the future 4 <strong>Bausch</strong> & <strong>Lomb</strong>
20/10 vision can be realized sooner than you think.<br />
Estimated Time Table for Customized Ablation System<br />
2000<br />
Clinical Studies<br />
Outside the U.S.<br />
Investigational Device<br />
Exemption Filing with FDA<br />
and U.S. Clinical Trials<br />
See the future 5 <strong>Bausch</strong> & <strong>Lomb</strong><br />
2001<br />
System Marketed Outside the U.S.<br />
Pre-Market Approval<br />
Filing with FDA<br />
System Marketed<br />
in the U.S.<br />
Target:<br />
20/10 vision<br />
Personalized visual<br />
perfection. Beyond 20/20<br />
to optimal visual acuity. To<br />
get there, <strong>Bausch</strong> & <strong>Lomb</strong><br />
researchers are harnessing<br />
the power of our advanced<br />
diagnostic technology to<br />
yield a customized laser<br />
prescription that compensates<br />
for the individual<br />
imperfections of each<br />
person’s eye. The result:<br />
custom-tailored vision that<br />
will set a new standard in<br />
refractive surgery. Never<br />
satisfied, <strong>Bausch</strong> & <strong>Lomb</strong><br />
researchers will continue<br />
to reinvent what is possible<br />
through vision correction.
Global Leadership<br />
People around the world<br />
entrust to <strong>Bausch</strong> & <strong>Lomb</strong><br />
their most precious sense –<br />
the sense of sight. To be<br />
worthy of that trust, we<br />
constantly strive to find<br />
a better way in all that we<br />
do. By offering the most<br />
comprehensive and innovative<br />
line of eye care products,<br />
and through our partnerships<br />
with eye care professionals,<br />
our goal is to enhance the<br />
visual performance of people<br />
of all ages. Said another<br />
way, our vision is to be<br />
Number One in the Eyes<br />
of the World.<br />
In the surgical business, we continue to be excited by the rapid growth<br />
of refractive surgery. We are already the global leader in this area, offering<br />
the most advanced technology covering all aspects of LASIK, the most<br />
common refractive procedure. We are currently conducting clinical trials<br />
in Europe to integrate our unique diagnostic and refractive technologies.<br />
This will enable surgeons to determine an individualized customized<br />
ablative pattern for treating each patient, and thus allow patients to<br />
attain vision better than 20/20 – in essence, perfect vision. In turn,<br />
it has the potential to provide <strong>Bausch</strong> & <strong>Lomb</strong> with an annuity stream of<br />
revenues to augment our equipment sales and capitalize on the projected<br />
growth in global refractive surgery procedures. We will also maintain a<br />
strong presence in cataract surgery, the most common ophthalmic<br />
surgical procedure today, where<br />
“Number one in<br />
we expect to introduce technology<br />
that will allow for less invasive surgery and new<br />
intraocular lens offerings over the next few years.<br />
In our pharmaceuticals business, our expanded R&D<br />
efforts are yielding the breakthrough technology that we<br />
believe can provide future breakout potential for <strong>Bausch</strong> &<br />
<strong>Lomb</strong>. In 2000, we will be in Phase III clinical trials for an<br />
extension to the Lotemax line with a product designed to<br />
treat eye inflammation and infection, with an expected<br />
launch in 2001. However, our most exciting opportunity is<br />
with a drug delivery technology to treat sight-threatening<br />
See the future 6<br />
<strong>Bausch</strong> & <strong>Lomb</strong><br />
the eyes of the world”
The tiny Vitrasert implant pictured here uses an innovative<br />
drug delivery technology to treat CMV retinitis,<br />
a complication of AIDS. Clinical trials are planned<br />
to begin this year to apply this proven technology to<br />
delivering drugs to treat other forms of retinal disease.<br />
See the future 7<br />
<strong>Bausch</strong> & <strong>Lomb</strong><br />
Vision:<br />
Treating<br />
global eye disease<br />
Some of the most common<br />
causes of blindness are also<br />
the most difficult to treat.<br />
Chronic diseases of the<br />
back of the eye, such as<br />
age-related macular degeneration,<br />
diabetic macular<br />
edema and posterior uveitis,<br />
affect millions of people<br />
worldwide and present few<br />
treatment options, in large<br />
part because of the difficulty<br />
in getting drug therapies<br />
to that part of the eye.<br />
<strong>Bausch</strong> & <strong>Lomb</strong> is working<br />
with a partner on a tiny<br />
implanted drug delivery<br />
We are working to battle the causes of sight-threatening diseases.<br />
system that delivers medication<br />
in slow doses for<br />
months or years. We expect<br />
to begin clinical trials this<br />
year on products combining<br />
this innovative technology<br />
with well-understood drugs<br />
to treat sight-threatening<br />
conditions. Our success will<br />
mean more than a potential<br />
blockbuster product. It will<br />
mean we can preserve the<br />
joy of sight for millions of<br />
people around the world.
diseases like age-related macular degeneration, diabetic macular edema<br />
and posterior uveitis that attack the retina and optic nerve or “back of<br />
the eye.” The results from our clinical trials so far are very promising, and<br />
we expect to move into Phase III clinicals during 2000 and be on the<br />
market potentially as early as 2003.<br />
While we continue to develop the technology, operational capabilities<br />
and financial strength necessary to achieve our ambitions, it is the tenacity<br />
and dedication of our people that will ultimately power our success. We<br />
are confident that the future of this company is bright because of the<br />
dedication of our past and present employees. We are grateful to these<br />
men and women for their efforts, which not only have made <strong>Bausch</strong> &<br />
<strong>Lomb</strong> the company it is today, but the company it<br />
will be in this new millennium.<br />
They have allowed us to build<br />
our strong technological leadership and global presence, driven our<br />
efforts in R&D and provided unique opportunities to integrate and<br />
leverage our broad product portfolio. We have the people, the products<br />
and the capabilities to continue to lead this category of healthcare and<br />
bring the joy of sight to millions of people in the years ahead.<br />
“We are meeting<br />
that challenge”<br />
See the future 8 <strong>Bausch</strong> & <strong>Lomb</strong><br />
William M. Carpenter<br />
Chairman and Chief Executive Officer
Financial Review<br />
Dollar Amounts In Millions – Except Per Share Data<br />
This financial review, which should be read in conjunction with<br />
the accompanying financial statements, contains management’s<br />
discussion and analysis of the company’s results of operations,<br />
liquidity and 2000 outlook. References within this financial<br />
review to earnings per share refer to diluted earnings per share.<br />
<strong>Bausch</strong> & <strong>Lomb</strong> Incorporated (the “company”) reported net<br />
income of $445 or $7.59 per share for the year ended December<br />
25, <strong>1999</strong>, compared to 1998 net income of $25 or $0.45 per<br />
share. During <strong>1999</strong>, the company sold its sunglass, hearing aid<br />
and biomedical businesses, which generated an aggregate aftertax<br />
gain of $308 or $5.26 per share. Income from continuing<br />
operations was $103 or $1.75 per share in <strong>1999</strong> compared to $56<br />
or $0.99 per share in 1998. Restructuring charges and asset<br />
write-offs recorded in the fourth quarter of <strong>1999</strong>, partially offset<br />
by reversals of restructuring charges recorded in prior periods,<br />
reduced <strong>1999</strong> income from continuing operations by $34 or<br />
$0.58 per share after taxes. Purchase accounting adjustments<br />
related to the surgical acquisitions, as well as restructuring charges<br />
and asset write-offs, reduced 1998 income from continuing operations<br />
by $49 or $0.87 per share after taxes.<br />
In 1997, net income and income from continuing operations<br />
were $49 or $0.89 per share and $62 or $1.12 per share,<br />
respectively. Results were negatively impacted by restructuring<br />
charges and asset write-offs of $25 or $0.45 per share after taxes<br />
and a litigation charge of $13 or $0.24 per share after taxes.<br />
See the future 9 <strong>Bausch</strong> & <strong>Lomb</strong><br />
Revenues And Earnings<br />
By Business Segment<br />
The company split the pharmaceuticals/surgical segment into<br />
two separate segments in <strong>1999</strong> to reflect changes in the manner<br />
in which financial information is viewed by management for<br />
decision-making purposes. The company now reports its operating<br />
results in three segments: vision care, pharmaceuticals and<br />
surgical. The vision care segment includes contact lenses, lens care<br />
products and vision accessories. The pharmaceuticals segment<br />
includes prescription ophthalmic drugs and over-the-counter<br />
(OTC) medications. The surgical segment is comprised of<br />
cataract, refractive and other ophthalmic surgery products. Prior<br />
year results have been reclassified to reflect these new segment<br />
classifications.<br />
The following table summarizes continuing sales and earnings<br />
by segment and presents total company operating earnings.<br />
Throughout the remainder of this financial review, the term<br />
“other significant charges” will be used to refer to purchased<br />
in-process research and development and other required<br />
purchase accounting adjustments recorded in 1998 associated<br />
with the surgical acquisitions.<br />
<strong>1999</strong> 1998 1997<br />
As % of Total As % of Total As % of Total<br />
<strong>Report</strong>ed Net Sales <strong>Report</strong>ed Net Sales <strong>Report</strong>ed Net Sales<br />
Net Sales<br />
Vision Care $ 1,029.5 58% $ 971.2 61% $ 918.1 83%<br />
Pharmaceuticals 293.9 17% 241.6 15% 190.6 17%<br />
Surgical 432.7 25% 384.7 24% .– –<br />
$ 1,756.1 $ 1,597.5 $ 1,108.7<br />
% of Segment % of Segment % of Segment<br />
Earnings Earnings Earnings<br />
Operating Earnings<br />
Vision Care $ 200.5 61% $ 208.4 70% $ 210.9 85%<br />
Pharmaceuticals 66.1 20% 49.2 16% 36.6 15%<br />
Surgical 64.1 19% 43.0 14% .– –<br />
$ 330.7 $ 300.6 $ 247.5<br />
Corporate administration<br />
Restructuring charges and<br />
(63.0) (52.6) (45.5)<br />
asset write-offs (53.5) (5.4) (39.1)<br />
Other significant charges .– (73.1) .–<br />
$ 214.2 $ 169.5 $ 162.9
Net Sales Net sales in <strong>1999</strong> increased $159 or 10% from 1998<br />
with virtually no impact from foreign currency exchange rate<br />
changes. All segments experienced favorable year-over-year<br />
growth with double-digit gains in both the pharmaceuticals and<br />
surgical businesses. In 1998, net sales increased $489 or 44%<br />
versus 1997 and improved 47% on a constant dollar basis (that<br />
is, excluding the effect of foreign currency exchange rate changes)<br />
reflecting the impact of acquisitions. Excluding these incremental<br />
revenues, total company revenues increased $70 or 6% (8% in<br />
constant dollars).<br />
Operating Earnings Operating earnings are comprised of<br />
segment earnings less corporate administration expenses, restructuring<br />
and asset write-offs and other significant charges. In <strong>1999</strong>,<br />
segment earnings increased $30 or 10% versus the prior year<br />
reflecting double-digit increases in the pharmaceuticals and<br />
surgical businesses offset by a decrease in vision care. Segment<br />
earnings in 1998 increased $53 or 21% versus 1997. Incremental<br />
results from acquired pharmaceuticals and surgical businesses<br />
drove the increase that otherwise would have been flat year-overyear.<br />
Corporate administration expense in <strong>1999</strong> of $63 or 3.6%<br />
of net sales increased over the $53 or 3.3% of net sales in 1998,<br />
driven primarily by costs associated with year 2000 and financial<br />
systems upgrades. Corporate administration expense in 1998<br />
improved as a percentage of sales versus the 4.1% in 1997. This<br />
improvement reflected effects of expense reduction resulting<br />
from restructuring programs and a higher sales base due to the<br />
surgical acquisitions. The other significant charges in 1998<br />
amounted to $41 for purchased in-process research and development<br />
and $32 for other required purchase accounting<br />
adjustments. Restructuring charges and asset write-offs are<br />
discussed below.<br />
Unless otherwise noted, discussion in the remainder of this<br />
financial review concerning segment results, operating costs and<br />
expenses and geographic region results exclude the restructuring<br />
charges and asset write-offs, corporate administration expense<br />
and other significant charges.<br />
Restructuring Charges and<br />
Asset Write-offs<br />
In <strong>1999</strong> and 1997, the company’s board of directors approved<br />
plans to restructure certain of the company’s business segments and<br />
corporate administrative functions. These plans are described more<br />
fully in Note 5 – Restructuring Charges and Asset Write-offs, and represent<br />
the company’s programs to enhance its competitive position.<br />
<strong>1999</strong> Program<br />
In December <strong>1999</strong>, management announced that in order to<br />
increase its competitiveness and performance, the company<br />
would exit certain manufacturing platforms in the contact lens<br />
See the future 10 <strong>Bausch</strong> & <strong>Lomb</strong><br />
business and consolidate others into focused facilities, as well as<br />
reduce certain global administrative costs. As a result, a pre-tax<br />
amount of $57 was recorded during the fourth quarter for<br />
restructuring and asset write-offs. The after-tax impact of this<br />
charge was $36 or $0.62 per share. Major actions in this restructuring<br />
plan include:<br />
Project<br />
Vision Care<br />
Exit certain European<br />
Start Date<br />
Anticipated<br />
Completion Date<br />
manufacturing platforms<br />
Exit certain U.S.<br />
Q4/99 Q2/00<br />
manufacturing platforms<br />
Eliminate internal<br />
Q4/99 Q4/00<br />
infrastructure costs<br />
Other/Administrative<br />
Eliminate internal<br />
Q4/99 Q2/00<br />
infrastructure costs Q4/99 Q4/00<br />
The above actions are expected to result in cash outflows of<br />
approximately $31. The majority of the outflows are expected to<br />
occur in the second half of 2000. The company anticipates that<br />
its current cash position as well as the cash provided through<br />
operations will provide adequate funding for these actions.<br />
This program is expected to yield pre-tax cost savings of<br />
approximately $16 in 2000 and $30 annually beginning in 2001.<br />
These savings will be realized primarily through reduced cost of<br />
products sold and selling, administrative and general expenses.<br />
A portion of these savings will be reinvested into research and<br />
development (R&D).<br />
The company is considering additional actions to rationalize<br />
its contact lens product line and manufacturing processes. These<br />
actions, which may include the discontinuance of certain product<br />
lines, could result in additional pre-tax charges of up to $15<br />
during 2000.<br />
1997 Program<br />
During 1998 and 1997, the company recorded cumulative pretax<br />
restructuring charges and asset write-offs of $46 pertaining to<br />
continuing businesses. The after-tax impact of these charges was<br />
$4 and $26 or $0.07 and $0.47 per share for the fiscal years 1998<br />
and 1997, respectively.<br />
During <strong>1999</strong>, all actions under this program were completed<br />
and the unused reserve of $3 was reversed and included in the<br />
restructuring charges and asset write-offs line of the company’s<br />
statement of income.<br />
The goal of the 1997 restructuring program was to enhance<br />
the company’s competitive position and to reduce the annual<br />
impact of general and administrative, logistics and distribution
costs by streamlining functions and closing certain facilities.<br />
Actual cost savings were approximately $41, a portion of which<br />
has been reinvested in marketing and advertising to support new<br />
product launches.<br />
Vision Care Segment Results<br />
<strong>1999</strong> Versus 1998 The vision care segment includes the contact<br />
lens, lens care and vision accessories businesses. Revenues in this<br />
segment were $1,029 in <strong>1999</strong>, an increase of 6% over 1998, with<br />
a negligible impact from currency rate changes. Lenses comprised<br />
46% of sales and lens care and vision accessories together<br />
comprised the remaining 54%.<br />
Contact lens revenue grew 8%, driven by double-digit<br />
growth in planned replacement and disposable lenses (collectively,<br />
PRD), including SofLens one day, SofLens66 toric and<br />
PureVision. Outside the U.S., contact lens sales grew by 14%,<br />
driven by strong gains in sales of SofLens one day in Europe, as<br />
well as increased sales of Medalist in Japan. Contact lens sales<br />
were flat in the U.S., with modest growth in the company’s PRD<br />
lenses offset by an expected decline in sales of traditional lenses.<br />
Lens care and vision accessories revenues grew by 4% in <strong>1999</strong> with<br />
gains driven primarily by strong sales of the ReNu line, especially<br />
in Japan where ReNu multi-purpose solution was introduced.<br />
Earnings in this segment declined $8 or 4%. This decline<br />
was due primarily to increased selling, administrative and general<br />
expenses and unfavorable manufacturing variances caused by<br />
reduced production of older lines of PRD lenses.<br />
1998 Versus 1997 Revenues increased $53 or 6% driven by a<br />
9% improvement in contact lens sales combined with a 3%<br />
improvement in lens care and vision accessories revenues. On a<br />
constant dollar basis, segment revenues increased 8%.<br />
Contact lens revenue gains were driven by strong growth in<br />
PRD lenses including SofLens one day in Europe, where sales<br />
more than doubled from 1997, and Medalist in Japan. PRD<br />
sales in the U.S. grew modestly but were offset by declining sales<br />
of rigid gas permeable and traditional lenses. Revenues from<br />
lens care and vision accessories products were up 5% in constant<br />
dollars, driven primarily by strong results in Europe. Segment<br />
earnings declined $2 or 1%, and operating margins declined<br />
to 21% in 1998 from 23% in 1997, primarily the result of<br />
currency changes.<br />
Pharmaceuticals Segment Results<br />
<strong>1999</strong> Versus 1998 The pharmaceuticals segment includes<br />
prescription ophthalmic drugs and OTC medications. Segment<br />
revenues increased $52 or 22% with a negligible impact from<br />
currency.<br />
See the future 11 <strong>Bausch</strong> & <strong>Lomb</strong><br />
In the U.S., pharmaceuticals revenues increased 37%.<br />
Contributing to these results was a significant increase in sales<br />
of generic otic products, which benefited from a competitor’s<br />
exit from the market in late 1998; increased revenues from the<br />
company’s line of proprietary ophthalmic anti-inflammatory<br />
products, Lotemax and Alrex, which continued to gain market<br />
share throughout <strong>1999</strong>; strong results for generic desmopressin,<br />
the first generic prescription nasal spray to be approved by the<br />
FDA; and an increase in revenues in the OTC business due in<br />
part to higher sales of Opcon-A. The U.S. growth was somewhat<br />
mitigated by flat results in Europe, reflecting lower OTC sales<br />
and negative currency impacts which affected the company’s<br />
Dr. Mann Pharma subsidiary in Germany.<br />
Segment earnings increased 35% from 1998, due in part to<br />
favorable pricing opportunities in the otics line. A substantial<br />
portion of the incremental margin realized from increased otic<br />
sales was reinvested in R&D, which increased by $14 or 65%<br />
and represented 12% of <strong>1999</strong> sales versus 9% in 1998.<br />
1998 Versus 1997 Segment revenues increased $51 or 27%<br />
reflecting the additions of the Chiron Vision and Storz pharmaceuticals<br />
product lines as well as the pharmaceuticals product<br />
lines of Dr. Winzer Pharma in Germany (the acquired product<br />
lines). Excluding the impact of the acquired product lines,<br />
pharmaceuticals revenues increased 9%. Currency rate changes<br />
had a negligible impact on segment revenues.<br />
In the U.S., pharmaceuticals revenues increased 29% due to<br />
the acquired product lines, the introductions of Lotemax and<br />
Alrex, increased revenues from trimethoprim, the generic<br />
equivalent to Polytrim, and increased generic otic sales. Also<br />
contributing to this increase was the OTC business, which benefited<br />
from strong sales of Opcon-A. Competitive pressures,<br />
including price declines on certain generic products, partially<br />
offset this sales growth. Pharmaceuticals revenues outside the<br />
U.S. improved 24% over the prior year, reflecting the acquired<br />
product lines, new product introductions and more stable market<br />
conditions in Germany than had been experienced in 1997.<br />
Segment earnings increased 34% over 1997, primarily<br />
reflecting the impact of the acquired product lines. Price and<br />
volume increases for many U.S. generic products were offset<br />
by unfavorable manufacturing variances and higher allowances<br />
associated with the competitive nature of the generic industry,<br />
as well as increased spending for marketing, advertising and<br />
R&D. R&D increased to 9% of sales from 7% of sales in 1997,<br />
reflecting additional spending to support development of<br />
proprietary products.
Surgical Segment Results<br />
<strong>1999</strong> Versus 1998 The surgical segment includes products used<br />
for cataract, refractive and retinal surgery. Segment revenues were<br />
$433 which represented an increase of $48 or 12% over 1998,<br />
and an increase of 14% in constant dollars.<br />
The increase in revenues in all regions was driven primarily<br />
by sales of products for refractive surgery, including Hansatome<br />
microkeratomes and disposable blades, diagnostic technologies<br />
and lasers. This success was aided by the acquisition of Hansa<br />
Research and Development, Inc. in the first quarter of <strong>1999</strong>,<br />
which improved the company’s ability to deliver microkeratomes<br />
and blades to the market. Also contributing to the segment’s<br />
success in the refractive market has been the positive response<br />
received regarding the company’s Orbscan diagnostic technology<br />
which was obtained through the <strong>1999</strong> acquisition of Orbtek, Inc.<br />
Segment earnings increased $21 or 49% due to a reduction<br />
in selling, administrative and general expenses as a percentage of<br />
sales as a result of the successful integration of the two surgical<br />
businesses the company acquired at the beginning of 1998.<br />
1998 Versus 1997 In the U.S., surgical revenues were $231 and<br />
represented 60% of total segment sales. Operations outside the<br />
U.S. accounted for $154 or 40% of total segment sales. Total 1998<br />
segment earnings were $43. All sales and earnings of this segment<br />
related to the 1998 acquisitions and were incremental to 1997.<br />
Operating Costs And Expenses<br />
The ratio of cost of products sold to sales for continuing businesses<br />
was 40.2% in <strong>1999</strong>, versus 39.4% and 36.1% for the years ended<br />
Revenues And Earnings By Geographic Region<br />
A summary of sales and earnings from continuing businesses by geographic region follows.<br />
See the future 12 <strong>Bausch</strong> & <strong>Lomb</strong><br />
1998 and 1997, respectively. Results in <strong>1999</strong> reflected a decrease<br />
in vision care margins due to unfavorable manufacturing<br />
variances resulting from lower production of certain contact<br />
lenses and higher costs in the European distribution center.<br />
Offsetting these declines were gains in the pharmaceuticals<br />
segment. The unfavorable trend in 1998 was primarily the result<br />
of the addition of the surgical businesses, which generated lower<br />
margins than other continuing segments. Also contributing to<br />
this result were lower vision care margins due to product mix and<br />
lower pharmaceutical margins, which reflected lower selling<br />
prices for generic products.<br />
Selling, administrative and general expenses, including<br />
corporate administration, were 39.0% of sales in <strong>1999</strong> compared<br />
to 40.2% in 1998 and 41.2% in 1997. The year-over-year<br />
favorable ratio was driven by lower marketing expenditures in the<br />
pharmaceuticals business, particularly for OTC products, and<br />
benefits from the integration of the surgical business. The 1998<br />
favorable ratio reflected improvements resulting from<br />
company-wide system upgrades, lower marketing and advertising<br />
costs and cost savings from restructuring programs offset by<br />
incremental expenses associated with the integration of Chiron<br />
Vision and Storz.<br />
R&D expenses totaled $98 in <strong>1999</strong>, an increase of $21 or<br />
27% over 1998. In 1997, these costs were $50. This represented<br />
5.6% of sales in <strong>1999</strong> versus 4.8% and 4.5% in 1998 and 1997,<br />
respectively. Overall, the three-year trend demonstrates the<br />
company’s continued commitment to accelerate the R&D<br />
spending needed to support its goal of consistently bringing new<br />
products to market.<br />
<strong>1999</strong> 1998 1997<br />
As % of Total As % of Total As % of Total<br />
<strong>Report</strong>ed Net Sales <strong>Report</strong>ed Net Sales <strong>Report</strong>ed Net Sales<br />
Net Sales<br />
U.S. $ 929.5 53% $ 841.9 53% $ 564.0 51%<br />
Non-U.S. 826.6 47% 755.6 47% 544.7 49%<br />
$ 1,756.1 $ 1,597.5 $ 1,108.7<br />
% of Operating % of Operating % of Operating<br />
Earnings Earnings Earnings<br />
Operating Earnings<br />
U.S. $ 139.7 52% $ 122.7 49% $ 111.1 55%<br />
Non-U.S. 128.0 48% 125.3 51% 90.9 45%<br />
$ 267.7 $ 248.0 $ 202.0
<strong>1999</strong> Versus 1998 Sales in markets outside the U.S. increased<br />
9% over the prior year and represented 47% of total revenues in<br />
<strong>1999</strong> and 1998 and 49% in 1997. Increased revenues for vision<br />
care products, driven by exceptional results for PRD lenses, and<br />
favorable surgical results, more than offset flat sales in pharmaceuticals.<br />
Currency exchange rates had a minimal impact on<br />
consolidated non-U.S. sales. European revenues advanced 3%,<br />
and 8% in constant dollars, due mainly to strong results of PRD<br />
lenses. Sales in the Asia-Pacific region increased 18% over the<br />
prior year, and advanced 8% in constant dollars, due in large part<br />
to the growth of PRD lenses and lens care products throughout<br />
most of the region. Revenues in the Canada and Latin America<br />
region increased 20% with improved surgical sales in Canada<br />
partially offset by currency impacts in Latin America.<br />
U.S. sales, which represented 53% of total consolidated<br />
revenues, increased 10% from 1998. U.S. sales benefited from<br />
strong double-digit growth in pharmaceutical products, led<br />
by the incremental impact from generic otic products and the<br />
proprietary products Lotemax and Alrex, as well as exceptional<br />
growth in sales of products for refractive surgery.<br />
In <strong>1999</strong>, operating earnings in markets outside the U.S.<br />
increased 2% from 1998, and represented 48% of total operating<br />
earnings, versus 51% and 45% in 1998 and 1997, respectively.<br />
Earnings were led by the Asia-Pacific region where Medalist<br />
contact lenses and ReNu multi-purpose solution performed well,<br />
aided by favorability in foreign currency. Earnings in the<br />
European region declined overall versus 1998 due to the impact<br />
of currency. In the U.S., <strong>1999</strong> operating earnings increased 14%<br />
versus the prior year. Margin improvements in the pharmaceuticals<br />
and surgical segments combined to offset higher R&D<br />
and administrative expenditures.<br />
1998 Versus 1997 Sales outside the U.S. increased 39% in 1998<br />
over 1997. Incremental sales from the acquired surgical businesses<br />
and increased revenues for vision care products, primarily<br />
contact lenses, drove the improvement. European revenues<br />
advanced significantly from the prior year led by incremental<br />
pharmaceuticals and surgical sales and growth in vision care sales.<br />
Sales in the Asia-Pacific region increased 15%. On a constant<br />
dollar basis, sales in the region advanced 21% due in large part to<br />
incremental surgical sales and to strong growth of PRD lenses<br />
throughout most of the region. In the Canada and Latin America<br />
region, sales increased 24% driven by incremental surgical sales<br />
and higher sales of vision care products.<br />
U.S. revenues in 1998 increased 49% from the prior year due<br />
primarily to incremental surgical sales. Vision care sales saw yearover-year<br />
improvement led by growth in PRD lenses, rigid gaspermeable<br />
(RGP) solutions and the launch of ReNu MultiPlus.<br />
Operating earnings in markets outside the U.S. increased<br />
38% from 1997. Incremental surgical results and the Dr. Winzer<br />
acquisition in Germany drove the increase.<br />
See the future 13 <strong>Bausch</strong> & <strong>Lomb</strong><br />
In the U.S., 1998 operating earnings increased 10%. These<br />
results reflected improvements in the vision care segment offset<br />
by higher R&D and administrative expenses as well as incremental<br />
amortization expense associated with recent acquisitions.<br />
Administrative expenses increased primarily due to initial costs<br />
associated with year 2000 and financial systems projects.<br />
Non-Operating Income And Expense<br />
Other Income And Expense Interest and investment income<br />
was $46 in <strong>1999</strong>, $43 in 1998 and $39 in 1997. The increase in<br />
<strong>1999</strong> over 1998 was due mainly to higher cash balances because<br />
of the divestitures, and higher interest rates. The increase in 1998<br />
over 1997 was primarily attributable to a gain on the sale of a<br />
long-term note associated with a 1996 divestiture.<br />
Interest expense was $88 in <strong>1999</strong>, $99 in 1998 and $55 in<br />
1997. The decrease in <strong>1999</strong> from 1998 was mostly due to <strong>1999</strong><br />
divestitures, which yielded in excess of $1 billion in cash, some of<br />
which was used to significantly reduce short-term debt. In 1998,<br />
debt increased significantly due to the surgical acquisitions, thus<br />
increasing interest expense compared to 1997.<br />
The company’s net gain from foreign currency transactions<br />
has not varied materially during the three-year period ending in<br />
<strong>1999</strong> due in part to the company’s risk management strategy.<br />
The company does not speculate in foreign currency.<br />
It may, however, selectively execute foreign currency transactions<br />
to protect the translated earnings and cash flows of certain foreign<br />
units. Such foreign currency transactions may not be accorded<br />
hedge accounting treatment under U.S. accounting rules. In<br />
addition, the company hedges identified transaction exposures<br />
on an after-tax basis to minimize the impact of exchange rate<br />
movements on operating results and selectively hedges exposures<br />
arising in countries with hyperinflationary economies.<br />
Other income of $7 in <strong>1999</strong> resulted from the liquidation of<br />
an investment in preferred securities associated with a 1995<br />
divestiture. In 1997, a pre-tax charge of $21 resulted from a<br />
legal settlement.<br />
Income Taxes The company’s effective tax rate for continuing<br />
operations was 36.0% in <strong>1999</strong> as compared to 35.2% in 1998<br />
and 38.1% in 1997. The impact of charges for litigation,<br />
acquired in-process R&D, restructuring and asset write-offs are<br />
reflected in the appropriate years. Excluding these items, the<br />
ongoing tax rates were 36.0%, 36.2% and 37.5% for <strong>1999</strong>,<br />
1998 and 1997 respectively.<br />
When calculating income tax expense, the company recognizes<br />
valuation allowances for tax loss and credit carryforwards,<br />
which may not be realized by utilizing a “more likely than not”<br />
approach. This is more fully described in Note 9 – Provision for<br />
Income Taxes.
Minority Interest Minority interest was $16, $22 and $20<br />
for <strong>1999</strong>, 1998 and 1997, respectively. The reduction in <strong>1999</strong><br />
from the prior two years primarily reflects the impact from the<br />
restructuring of a limited partnership as described in Note 13 –<br />
Minority Interest.<br />
Discontinued Operations Income from discontinued operations,<br />
net of income taxes, in <strong>1999</strong> was $34 compared to losses<br />
of $63 and $13, respectively, for the years ended 1998 and 1997.<br />
The loss in 1998 occurred primarily because of an $85 impairment<br />
charge associated with the former hearing aid business while the<br />
loss in 1997 was due mostly to restructuring charges and asset<br />
write-offs in the eyewear business.<br />
Liquidity And Financial Resources<br />
The company evaluates its liquidity from several perspectives,<br />
including its ability to generate earnings, positive cash flows and<br />
free cash flow, its financial position, its access to financial markets<br />
and the adequacy of working capital levels. The company has a<br />
stated goal to maximize free cash flow, which is defined as cash<br />
generated before the payment of dividends, the borrowing or<br />
repayment of debt, stock repurchases and the acquisition or<br />
divestiture of businesses.<br />
Cash Flows From Operating Activities Cash provided by<br />
operating activities totaled $223 in <strong>1999</strong>, an increase of $77<br />
from 1998. The increase was driven primarily by increased<br />
earnings from continuing businesses and lower net financing<br />
expenses due to the repayment of debt that occurred as a result of<br />
divestitures, partially offset by increases in accounts receivable. In<br />
1998, operating activities generated $146 in cash flow, a decrease<br />
of $69 from 1997. Increases in accounts receivable, interest on<br />
incremental debt associated with the surgical acquisitions and the<br />
settlement of litigation commenced in a prior year contributed to<br />
this result.<br />
Free cash flow for <strong>1999</strong> was $79, an increase of $153 from<br />
1998. The increase was primarily attributable to the operating<br />
factors cited above, as well as to a decrease in capital expenditures.<br />
Cash Flows From Investing Activities Cash provided by investing<br />
activities was $1,163 in <strong>1999</strong>. Cash inflows from divestitures<br />
were $1,048 while an additional $300 was realized from the<br />
liquidation of an investment. Capital expenditures of $156<br />
primarily supported expanded contact lens manufacturing<br />
capacity and year 2000 and financial system improvements, while<br />
the acquisition of two companies within the surgical segment<br />
resulted in a cash outflow of $43.<br />
In 1998, cash used in investing activities was $797 as outflows<br />
of $719 and $202 for acquisitions and capital expenditures,<br />
respectively, were partially offset by divestiture proceeds of $135.<br />
See the future 14 <strong>Bausch</strong> & <strong>Lomb</strong><br />
Cash Flows From Financing Activities Cash used in financing<br />
activities during <strong>1999</strong> was $687 as the company reduced debt by<br />
nearly $450, and had a net outflow of $200 resulting from the<br />
restructuring of a limited partnership, as explained in Note 13 –<br />
Minority Interest. The board of directors authorized the repurchase<br />
of up to 250,000 Common shares in July 1998 and up<br />
to 5,000,000 additional Common shares in November <strong>1999</strong>.<br />
The company has repurchased 630,548 shares through<br />
December 25, <strong>1999</strong> and expects the remaining 4,619,452 shares<br />
to be repurchased during 2000 using the cash generated from the<br />
<strong>1999</strong> divestitures.<br />
In 1998, $593 was provided by financing activities. Net<br />
new borrowings totaling $605 were used primarily to support the<br />
surgical acquisitions.<br />
Financial Position The company’s total debt, consisting of shortand<br />
long-term borrowings, was $1,024 and $1,473 at the end of<br />
<strong>1999</strong> and 1998, respectively. The repayment of debt was accomplished<br />
through use of a portion of divestiture proceeds. The ratio<br />
of total debt to capital stood at 45.3% and 63.5% at year-end<br />
<strong>1999</strong> and 1998, respectively. Cash and cash equivalents totaled<br />
$827 in <strong>1999</strong> and $129 in 1998.<br />
Certain tranches of the company’s long-term debt contain<br />
options that allow holders to put the debt back to the company,<br />
or allow remarketing agents to call the debt from the holders and<br />
remarket the debt at a higher interest rate than the then current<br />
market rate. Based on current interest rate levels, the company<br />
expects the remarketing agreements to expire, thus allowing the<br />
company to retire each tranch at the earlier maturity date. The<br />
company does not believe that the potential exercising of these<br />
rights would materially impact its financial position.<br />
Access To Financial Markets During the second quarter of<br />
<strong>1999</strong>, the company restructured its revolving credit agreements<br />
and now maintains 364-day bilateral revolving credit agreements<br />
totaling $500. The interest rate under these agreements is based<br />
on LIBOR, or at the company’s option, such other rate as may be<br />
agreed upon by the company and the bank. No debt was outstanding<br />
under these agreements at December 25, <strong>1999</strong>. In<br />
addition, the company maintains other lines of credit on which<br />
it may draw to meet its financing requirements.<br />
The company’s commercial paper is rated A-2 and P-2 by<br />
Standard & Poor’s and Moody’s Investors Service, respectively. Its<br />
long-term debt is rated BBB by Standard & Poor’s and Baa2 by<br />
Moody’s Investors Service.<br />
The company believes its strong cash position, existing<br />
credit facilities and access to financial markets provide adequate<br />
liquidity to meet obligations, fund capital expenditures and<br />
invest in potential growth opportunities.
Working Capital Working capital and the current ratio were<br />
$1,191 and 2.9, respectively, at year end <strong>1999</strong> and $774 and 2.0,<br />
respectively, at year end 1998.<br />
Dividends The dividend on Common stock, declared and paid<br />
quarterly, totaled $1.04 per share for each of the years ended<br />
<strong>1999</strong>, 1998 and 1997.<br />
Return On Equity And Capital Return on average shareholders’<br />
equity was 43.3% in <strong>1999</strong>, compared with 3.1% in 1998 and<br />
5.9% in 1997. The increase in <strong>1999</strong> was mainly due to the gains<br />
realized on the divestitures. The decrease in 1998 was primarily<br />
the result of an impairment charge in a now divested business and<br />
the purchased in-process R&D charge described below.<br />
Return on invested capital was 21.7% in <strong>1999</strong>, 3.8% in<br />
1998 and 5.0% in 1997. The increase in <strong>1999</strong> was due primarily<br />
to the gain on divestitures and the debt repayments associated<br />
with the use of proceeds from the divestitures. The decrease in<br />
1998 was due primarily to the matters discussed above, as well as<br />
to the debt increase associated with the surgical acquisitions.<br />
Market Risk<br />
The company, as a result of its global operating and financing<br />
activities, is exposed to changes in interest rates and foreign<br />
currency exchange rates that may adversely affect its results of<br />
operations and financial position. In seeking to minimize the<br />
risks and/or costs associated with such activities, the company<br />
manages exposures to changes in interest rates and foreign<br />
currency exchange rates primarily through its use of derivatives.<br />
The company does not use financial instruments for trading or<br />
other speculative purposes, nor does it use leveraged financial<br />
instruments.<br />
The company primarily uses foreign currency forward<br />
contracts to hedge foreign currency transactions and equity<br />
investments in non-U.S. subsidiaries. For contracts outstanding<br />
at the end of <strong>1999</strong>, foreign currencies purchased were primarily<br />
Singapore dollars, Hong Kong dollars and British pounds. The<br />
currencies sold were primarily the euro, the Japanese yen and the<br />
British pound. With respect to 1998, the outstanding contracts<br />
at year end required the purchase of primarily Irish pounds,<br />
Singapore dollars and Hong Kong dollars and the sale of German<br />
marks, Netherlands guilders and Singapore dollars. The magnitude<br />
and nature of such hedging activities are explained further<br />
in Note 14 – Financial Instruments. A sensitivity analysis to measure<br />
the potential impact that a change in foreign currency exchange<br />
rates would have, net of hedging activity, on the company’s net<br />
income indicates that, based on its year-end <strong>1999</strong> positions, if the<br />
U.S. dollar strengthened against all foreign currencies by 10%,<br />
the company’s earnings would have been reduced by approximately<br />
$2 after taxes. If the U.S. dollar weakened against all<br />
See the future 15 <strong>Bausch</strong> & <strong>Lomb</strong><br />
foreign currencies by 10% based on 1998 net exposures, the<br />
company’s earnings would have been reduced by approximately<br />
$1 after taxes.<br />
The company may enter into interest rate swap and cap<br />
agreements to effectively limit exposure to interest rate movements<br />
within the parameters of its interest rate hedging policy. This policy<br />
requires that interest rate exposure from floating-rate assets be<br />
offset by a substantially similar amount of floating-rate liabilities.<br />
Interest rate derivatives are used to readjust this natural hedge<br />
position when it becomes unbalanced beyond policy limits. Due<br />
mainly to the proceeds received from the <strong>1999</strong> divestitures, the<br />
company exceeded policy limits at December 25, <strong>1999</strong>. For<br />
foreign currency-denominated borrowing and investing<br />
transactions, cross-currency interest rate swap contracts are used,<br />
which, in addition to exchanging cash flows derived from interest<br />
rates also exchange currencies at both inception and termination<br />
of the contract. A sensitivity analysis to measure the potential<br />
impact that a change in interest rates would have, net of hedging<br />
activity, on the company’s net income indicates that a one percentage<br />
point decrease in interest rates, which represents a greater<br />
than 10% change, would increase the company’s net financial<br />
expense by approximately $8, based on <strong>1999</strong> year-end positions.<br />
With respect to 1998 year-end positions, the sensitivity analysis<br />
indicates that an increase in interest rates of one percentage point<br />
would increase net interest expense by approximately $1.<br />
Counterparties to the financial instruments discussed above<br />
expose the company to credit risks to the extent of non-performance.<br />
The credit ratings of the counterparties, which consist of<br />
a diversified group of major financial institutions, are regularly<br />
monitored and thus credit loss arising from counterparty<br />
non-performance is not anticipated.<br />
Outlook<br />
In 2000, the company expects revenues to grow in the upper single<br />
digits, supported by its newer product offerings within its vision<br />
care segment and the expected continued strong growth in sales<br />
for products for refractive surgery. Operating earnings are<br />
expected to improve by approximately 20% or more, driven by<br />
savings from the restructuring programs announced in<br />
December <strong>1999</strong>, as well as a sales mix shift to newer, higher<br />
margin products. These projections presume that foreign currency<br />
exchange rates remain fairly consistent with year end levels.<br />
Since the company operates globally, the business is subject to<br />
fluctuations in currencies which can have a material effect on<br />
sales and the results of operations outside the U.S.<br />
In the vision care segment, revenue growth is expected to be<br />
in the upper single digits with lens care growing slightly and<br />
contact lenses growing in the low double digits. The contact lens<br />
business should benefit from higher sales from new and innovative<br />
products including SofLens one day disposable lenses; SofLens66
toric, a two-week disposable lens to correct astigmatism;<br />
PureVision, an extended wear lens; and a new two-week conventional<br />
disposable lens which the company plans to introduce<br />
during the first half of 2000. The new two-week disposable lens<br />
will be manufactured using the same low-cost process that is<br />
used for its one-day disposable product and is expected to allow<br />
the company to compete more effectively in the price/value<br />
driven segment of the contact lens market. The combination of<br />
increased sales of higher margin new products and cost reduction<br />
initiatives are expected to yield improved operating margins in<br />
this business.<br />
In the surgical segment, revenues are expected to grow in the<br />
low double digits, driven primarily by continued strong growth<br />
in demand for products used in refractive surgery. Operating<br />
margins in this segment are expected to expand to nearly 20%<br />
over the next two years, driven by the continued integration of<br />
the two surgical businesses acquired in 1998, and a sales mix shift<br />
toward higher margin products.<br />
In the pharmaceuticals segment, revenues are expected to<br />
grow in the mid-single digits in 2000. As the company anticipated,<br />
new competition in the generic otic market is resulting<br />
in prices for these products trending down to their pre-<strong>1999</strong><br />
levels. Consequently, 2000 sales comparisons will be off a largerthan-normal<br />
base. Operating margins are expected to be in the<br />
high teens in 2000 reflecting higher R&D spending and sales<br />
mix shifts.<br />
Capital spending in 2000 is expected to be approximately<br />
$130. The majority of this spending will be to support expanded<br />
manufacturing capacity within the vision care and pharmaceuticals<br />
segments, as well as to upgrade global financial and human<br />
resource systems. The company plans to expand its R&D spending<br />
specifically in its pharmaceuticals and surgical segments<br />
to support new technology. In addition, the company will<br />
continue to repurchase shares of its common stock during 2000<br />
under a five million share repurchase authorization, announced<br />
in <strong>1999</strong>. The company expects to generate free cash flow in<br />
excess of $100 in 2000.<br />
Other Matters<br />
Environment The company believes it is in compliance in<br />
all material respects with applicable environmental laws and<br />
regulations. The company is presently involved in remediation<br />
efforts at certain locations, some of which are company owned.<br />
At all such locations, the company believes such efforts will not<br />
have a materially adverse effect on its results of operations or<br />
financial position.<br />
See the future 16 <strong>Bausch</strong> & <strong>Lomb</strong><br />
Risks Associated With Year 2000 Date Issues As stated in<br />
previous reports, the company established a formal program to<br />
assess and renovate internal information technology (“IT”) and<br />
non-information technology (“non-IT”) operations that were<br />
identified as being at risk with regard to the year 2000 date<br />
issues, and further to evaluate the readiness of key third party<br />
suppliers of products, services, materials or data. The<br />
company experienced only limited minor incidents due to the<br />
date changeover, none of which affected its operations, products<br />
or services in a material way. Year 2000 costs, comprised of both<br />
period expenses and capital expenditures, of identifying and<br />
remediating year 2000 issues is expected to be approximately<br />
$53, of which approximately $51 has been spent to date. The<br />
remaining amount is expected to be spent during the first<br />
two quarters of 2000 as final year 2000 related programs are<br />
completed. Of the total anticipated costs, approximately 80% is<br />
expected to be capitalized as a part of system upgrades and<br />
replacements. The company will continue to monitor both its IT<br />
and non-IT systems for year 2000 issues as the year progresses.<br />
Contingency plans deemed necessary for critical systems and for<br />
addressing a potential failure of a key customer or supplier have<br />
been completed. The estimated costs of remediation and other<br />
information described above are based on information available<br />
at this time and may be updated as additional information<br />
becomes available. Readers are referred to the section of this<br />
filing labeled “Information Concerning Forward-Looking<br />
Statements” which address forward-looking statements made by<br />
the company.<br />
The Euro On January 1, <strong>1999</strong>, eleven of the fifteen member<br />
countries of the European Union began operating with a new<br />
currency, the euro, which was established by irrevocably fixing<br />
the value of legacy currencies against this new common currency.<br />
The euro may be used in business transactions along with<br />
legacy currencies until 2002, at which time it will become the<br />
sole currency of the participating countries.<br />
The company has processes in place to address the issues<br />
raised by this currency conversion, including the impact on information<br />
technology and other systems, currency risk, financial<br />
instruments, taxation and competitive implications. The company<br />
expects no material impact to its financial position or its results<br />
of operations arising from the euro conversion.<br />
Employee Benefits Effective January 1, 2000, the company’s<br />
contributory defined benefit pension plan was converted to a<br />
noncontributory cash balance plan. This plan covers essentially<br />
all U.S. employees. The company’s defined contribution plan<br />
was also amended to increase the company match. The changes<br />
to these plans are not expected to materially affect the<br />
company’s results.
Information Concerning Forward-Looking Statements When<br />
used in this discussion, the words “anticipate,” “should,”<br />
“expect,” “estimate,” “project” and similar expressions are<br />
intended to identify forward-looking statements. The forwardlooking<br />
statements contained in this report are made pursuant to<br />
the safe harbor provisions of the Private Securities Litigation<br />
Reform Act of 1995. These statements involve predictions of<br />
future company performance, and are thus dependent on a<br />
number of factors affecting the company’s performance. Where<br />
possible, specific factors that may impact performance materially<br />
have been identified in connection with specific forward-looking<br />
statements. Additional risks and uncertainties include, without<br />
limitation, the impact of competition and general economic<br />
conditions in the global vision care and ophthalmic surgical and<br />
pharmaceuticals markets, where the company’s businesses<br />
compete, changes in global and localized economic and political<br />
conditions (for example, the company does business in Asia and<br />
Brazil, where recently, economies and associated currency risks<br />
have been volatile), changing trends in practitioner and consumer<br />
preferences and tastes, changes in technology, medical<br />
developments relating to the use of the company’s products, legal<br />
proceedings initiated by or against the company, changes in<br />
government regulation of the company’s products and operations,<br />
changes in private and regulatory schemes providing for<br />
the reimbursement of patient medical expenses, difficulties or<br />
delays in the development, production, testing, regulatory<br />
approval, marketing of products, the effect of changes within the<br />
company’s organization, and such other factors as are described<br />
in greater detail in the company’s filings with the Securities and<br />
Exchange Commission, including its <strong>1999</strong> <strong>Annual</strong> <strong>Report</strong> on<br />
Form 10-K.<br />
Purchased In-Process Research<br />
And Development<br />
In connection with the 1998 acquisitions of Chiron Vision and<br />
Storz, the company immediately expensed $41 ($28 for Storz<br />
and $13 for Chiron Vision) of the combined purchase price of<br />
these businesses, representing amounts for in-process research<br />
and development (IPR&D). The expensed IPR&D represented<br />
the value of projects that had not yet reached technological feasibility<br />
and for which the assets to be used in such projects had no<br />
alternative future uses (See Note 2 – Acquisitions). The company<br />
expects that products developed arising from the acquired<br />
IPR&D will begin to generate sales and positive cash flows in the<br />
time frames discussed in the following paragraphs. However,<br />
development of these technologies remains a significant risk due<br />
to the remaining effort to achieve technical viability, rapidly<br />
changing customer markets, uncertain standards for new products<br />
and significant competitive threats from numerous companies.<br />
See the future 17 <strong>Bausch</strong> & <strong>Lomb</strong><br />
Failure to bring the products associated with these projects to<br />
market in a timely manner could result in a loss of market share<br />
or a lost opportunity that could have a material adverse impact on<br />
the company’s businesses and operating results.<br />
The company estimated the fair value of the purchased<br />
IPR&D for each of these acquisitions using an income approach.<br />
Such methodology involved estimating the fair value of the purchased<br />
IPR&D using the present value of the estimated after-tax<br />
cash flows expected to be generated as a result of these projects<br />
and using risk-adjusted discount rates and revenue forecasts as<br />
appropriate. The selection of the discount rate was based on<br />
consideration of the company’s weighted average cost of capital,<br />
as well as other factors, including the useful life of each project,<br />
anticipated profitability levels of each project and the uncertainty<br />
surrounding successful development of each project<br />
known at the time. The amount expensed was also impacted by<br />
the percentage of completion for each project. The company<br />
expects to fund all R&D efforts, including acquired IPR&D,<br />
from cash flow from operations.<br />
Set forth below are descriptions of certain acquired IPR&D<br />
projects, including their status at the end of <strong>1999</strong>:<br />
Storz At the beginning of 1998, the company acquired Storz,<br />
a leading manufacturer of high-quality ophthalmic surgical<br />
instruments, surgical and diagnostic equipment, intraocular lens<br />
(IOL) implants and ophthalmic pharmaceuticals. The allocation<br />
of $28 of the $370 purchase price to IPR&D represented its<br />
estimated fair value using the methodology described above. The<br />
$28 was allocated to the following projects: Cidofovir, $12;<br />
Ocuvite, $10 and other technologies, $6.<br />
Cidofovir – The company estimated that revenues attributed<br />
to Cidofovir, a broad spectrum anti-viral agent for the<br />
treatment of ocular infections, were expected to average in excess<br />
of $50 per year for the six years beginning in 2001. The discount<br />
rate and stage of completion used to derive the IPR&D amount<br />
were 18% and 32%, respectively. During 1998 and <strong>1999</strong> the<br />
company spent approximately $3 on R&D efforts for this<br />
product. Product development, however, has been discontinued<br />
due to a failure to meet expected performance attributes.<br />
Consequently, the company will not realize its forecasted<br />
revenues from this project.<br />
Ocuvite – Revenues attributed to alternative formulations<br />
of a currently marketed product, Ocuvite, a high-potency<br />
vitamin/mineral supplement, were expected to total approximately<br />
$37 for the three years ending in 2004, and then average<br />
approximately $40 annually through 2011. The discount rate<br />
and stage of completion used to derive the IPR&D amount<br />
were 22% and 54%, respectively. The company believes<br />
development costs and revenue projections made at the time of<br />
acquisition are still valid.
Other technologies – Of the remaining three projects, as<br />
originally anticipated, one began to generate revenues in <strong>1999</strong><br />
and two are expected to generate revenues in 2001. The expected<br />
rate of revenue growth varies depending on the project and does<br />
not vary materially from original projections. At the acquisition<br />
date, the expected aggregate cost to complete the projects was<br />
expected to be $5 and the actual amounts are not expected to<br />
vary materially from these estimates. The discount rate used to<br />
derive the IPR&D amounts was 15% for all projects with the<br />
stage of completion ranging from 17% to 44%. Approximately<br />
$2 in development costs remained at the end of <strong>1999</strong>, all of<br />
which is expected to be spent by the end of 2002.<br />
Chiron Vision At the beginning of 1998, the company acquired<br />
Chiron Vision for $298 cash. Chiron Vision researches, develops<br />
and manufactures innovative products that improve results of<br />
cataract and refractive surgeries and enhance the treatment of<br />
progressive eye diseases. The allocation of $13 to IPR&D represented<br />
its estimated fair value using the methodology described<br />
above. The $13 was allocated to the following projects: IOL<br />
technologies, $7; disposable keratome, $4, and other refractive<br />
technology, $2. Each of these projects was assigned a discount<br />
rate of 18% to calculate IPR&D.<br />
See the future 18 <strong>Bausch</strong> & <strong>Lomb</strong><br />
IOL technologies – Revenues attributed to various IOL line<br />
extension technologies were expected to be approximately $50<br />
over the three years ending in 2002. At the acquisition date,<br />
costs to complete these projects were expected to be $1. These<br />
projects were estimated to be over 80% complete at the time of<br />
acquisition. Development was completed in <strong>1999</strong>. The actual<br />
results to date for these projects in the aggregate are consistent in<br />
all material respects with the assumptions at the time of acquisition.<br />
Disposable keratome – Revenues attributed to a project to<br />
develop a single-use keratome were expected to be $37 over the<br />
five years beginning in <strong>1999</strong>. At the acquisition date, costs to complete<br />
the project were expected to be less than $1. This technology<br />
did not meet management’s performance expectations. The loss of<br />
these anticipated revenues are expected to be offset by the additional<br />
revenues generated from the <strong>1999</strong> acquisition of Hansa<br />
Research and Development, Inc., the maker of the Hansatome<br />
microkeratome.<br />
Other refractive technology – Revenues attributed to a new<br />
type of refractive IOL are expected to begin in 2003 and generate<br />
approximate annual revenues of $27 by around 2006. At the<br />
acquisition date, costs to complete the R&D efforts were expected<br />
to be approximately $6. Approximate expenditures over the next<br />
five years are expected to average $1. The company believes<br />
development costs and revenue projections made at the time of<br />
the acquisition are still valid.
Statements Of Income<br />
For The Years Ended December 25, <strong>1999</strong>, December 26, 1998 and December 27, 1997<br />
Dollar Amounts In Millions – Except Share and Per Share Data<br />
See the future<br />
19<br />
<strong>1999</strong> 1998 1997<br />
Net Sales $1,756.1 $1,597.5 $1,108.7<br />
Costs And Expenses<br />
Cost of products sold 706.3 662.2 400.6<br />
Selling, administrative and general 684.5 642.7 456.3<br />
Research and development 97.6 76.7 49.8<br />
Purchased in-process research and development .– 41.0 .–<br />
Restructuring charges and asset write-offs 53.5 5.4 39.1<br />
1,541.9 1,428.0 945.8<br />
Operating Income 214.2 169.5 162.9<br />
Other Expense (Income)<br />
Interest and investment income (45.5) (43.0) (39.1)<br />
Interest expense 88.4 99.4 54.9<br />
Gain from foreign currency, net (7.0) (6.6) (6.9)<br />
Other income (6.7) .– .–<br />
Litigation provision .– .– 21.0<br />
29.2 49.8 29.9<br />
Income From Continuing Operations<br />
Before Income Taxes And Minority Interest 185.0 119.7 133.0<br />
Provision for income taxes<br />
Income From Continuing Operations<br />
66.6 42.2 50.6<br />
Before Minority Interest 118.4 77.5 82.4<br />
Minority interest 15.7 21.9 20.4<br />
Income From Continuing Operations<br />
Discontinued Operations<br />
102.7 55.6 62.0<br />
Income (loss) from discontinued operations, net 34.0 (63.4) (12.6)<br />
Gain on disposals of discontinued operations, net 308.1 33.0 .–<br />
<strong>Bausch</strong> & <strong>Lomb</strong><br />
342.1 (30.4) (12.6)<br />
Net Income $ 444.8 $ 25.2 $ 49.4<br />
Basic Earnings (Loss) Per Share:<br />
Continuing Operations $ 1.79 $ 1.00 $ 1.12<br />
Discontinued Operations 5.97 (0.55) (0.23)<br />
$ 7.76 $ 0.45 $ 0.89<br />
Average Shares Outstanding – Basic (000s) 57,287 55,824 55,383<br />
Diluted Earnings (Loss) Per Share:<br />
Continuing Operations $ 1.75 $ 0.99 $ 1.12<br />
Discontinued Operations 5.84 (0.54) (0.23)<br />
$ 7.59 $ 0.45 $ 0.89<br />
Average Shares Outstanding – Diluted (000s) 58,639 56,367 55,654<br />
See Notes To Financial Statements
Balance Sheets<br />
December 25, <strong>1999</strong> and December 26, 1998<br />
Dollar Amounts In Millions – Except Share and Per Share Data<br />
PERCEIVE<br />
20<br />
<strong>Bausch</strong> & <strong>Lomb</strong><br />
<strong>1999</strong> 1998<br />
Assets<br />
Cash and cash equivalents $ 827.1 $ 129.2<br />
Other investments, short-term 125.0 300.0<br />
Trade receivables, less allowances of $19.6 and $26.8, respectively 438.0 526.3<br />
Inventories, net 239.6 440.7<br />
Deferred taxes, net .– 68.4<br />
Other current assets 156.0 122.2<br />
Net assets held for disposal, short-term 24.6 .–<br />
Total Current Assets 1,810.3 1,586.8<br />
Property, Plant And Equipment, net 524.8 725.0<br />
Goodwill And Other Intangibles, less accumulated amortization<br />
of $129.3 and $137.3, respectively 606.8 758.9<br />
Other Investments, long-term 173.8 249.2<br />
Other Assets 153.1 171.8<br />
Net Assets Held For Disposal, long-term 4.7 .–<br />
Total Assets $3,273.5 $3,491.7<br />
Liabilities And Shareholders’ Equity<br />
Notes payable $ 45.9 $ 160.4<br />
Current portion of long-term debt 1.0 31.1<br />
Accounts payable 94.8 92.6<br />
Accrued compensation 74.6 110.3<br />
Accrued liabilities 356.0 366.2<br />
Federal, state and foreign income taxes payable 47.3 51.8<br />
Total Current Liabilities 619.6 812.4<br />
Long-Term Debt, less current portion 977.0 1,281.3<br />
Deferred Income Taxes 117.7 .–<br />
Other Long-Term Liabilities 99.6 106.6<br />
Minority Interest 225.6 446.4<br />
Total Liabilities 2,039.5 2,646.7<br />
Common Stock, par value $0.40 per share, 200 million shares authorized,<br />
60,198,322 shares issued in both <strong>1999</strong> and 1998<br />
Class B Stock, par value $0.08 per share, 15 million shares authorized, 613,324<br />
24.1 24.1<br />
shares issued (955,791 shares in 1998) .– 0.1<br />
Capital In Excess Of Par Value<br />
Common And Class B Stock in Treasury, at cost, 3,435,738 shares<br />
89.6 84.2<br />
(4,625,026 shares in 1998) (150.1) (178.9)<br />
Retained Earnings 1,268.4 883.5<br />
Accumulated Other Comprehensive Income 9.0 41.0<br />
Other Shareholders’ Equity (7.0) (9.0)<br />
Total Shareholders’ Equity 1,234.0 845.0<br />
Total Liabilities And Shareholders’ Equity $3,273.5 $3,491.7<br />
See Notes To Financial Statements<br />
See the future
Statements Of Cash Flows<br />
For The Years Ended December 25, <strong>1999</strong>, December 26, 1998 and December 27, 1997<br />
Dollar Amounts In Millions<br />
See the future 21 <strong>Bausch</strong> & <strong>Lomb</strong><br />
<strong>1999</strong> 1998 1997<br />
Cash Flows From Operating Activities<br />
Net Income<br />
Adjustments to reconcile net income to net cash<br />
provided by operating activities:<br />
$ 444.8 $ 25.2 $ 49.4<br />
Depreciation 112.8 117.3 90.8<br />
Amortization 43.4 46.5 21.2<br />
Gain on divestitures (475.0) (56.0) .–<br />
Deferred income taxes 195.9 (2.5) (14.4)<br />
Restructuring charges and asset write-offs 53.5 11.3 71.7<br />
Stock compensation expense 8.0 10.6 3.3<br />
Loss on retirement of fixed assets 31.4 14.6 8.3<br />
Goodwill impairment charge .– 85.0 .–<br />
Purchased in-process research and development .– 41.0 .–<br />
Provision for litigation expense<br />
Changes In Assets And Liabilities:<br />
.– .– 21.0<br />
Trade receivables (93.0) (64.0) (32.9)<br />
Inventories (11.6) (19.7) (1.0)<br />
Other current assets (47.1) 17.0 (31.3)<br />
Accounts payable and accrued liabilities (45.5) (98.3) (11.7)<br />
Income taxes 3.9 21.5 51.0<br />
Other long-term liabilities 1.9 (3.3) (9.9)<br />
Net Cash Provided By Operating Activities 223.4 146.2 215.5<br />
Cash Flows From Investing Activities<br />
Capital expenditures (155.9) (201.5) (126.1)<br />
Net cash paid for acquisition of businesses (43.1) (718.9) (48.6)<br />
Net cash received from divestitures 1,048.4 135.0 9.3<br />
Proceeds from liquidation of other investment 300.0 .– .–<br />
Other 13.9 (12.0) (9.2)<br />
Net Cash Provided By (Used In) Investing Activities 1,163.3 (797.4) (174.6)<br />
Cash Flows From Financing Activities<br />
Proceeds from sale of partnership interest 200.5 .– .–<br />
Redemption of investor’s interest in partnership (400.0) .– .–<br />
Repurchases of Common and Class B shares (43.9) (1.8) (21.8)<br />
Exercise of stock options 62.3 47.7 14.8<br />
Net repayments of notes payable (414.7) (183.5) (72.7)<br />
Proceeds from issuance of long-term debt .– 801.4 213.5<br />
Repayment of long-term debt (31.6) (12.7) (89.3)<br />
Payment of dividends (59.5) (58.1) (57.1)<br />
Net Cash (Used In) Provided By Financing Activities (686.9) 593.0 (12.6)<br />
Effect Of Exchange Rate Changes On Cash And Cash Equivalents (1.9) 3.7 (12.4)<br />
Net Change In Cash And Cash Equivalents 697.8 (54.5) 15.9<br />
Cash And Cash Equivalents, Beginning Of Year 129.2 183.7 167.8<br />
Cash And Cash Equivalents, End Of Year $ 827.1 $ 129.2 $ 183.7<br />
Supplemental Cash Flow Disclosures<br />
Cash paid for interest $ 89.8 $ 85.6 $ 56.2<br />
Net cash payments for (refunds of) income taxes 52.4 55.8 (6.4)<br />
See Notes To Financial Statements
Statements Of Changes In Shareholders’ Equity<br />
For The Years Ended December 25, <strong>1999</strong>, December 26, 1998 and December 27, 1997<br />
Dollar Amounts In Millions – Except Share and Per Share Data<br />
Accumulated<br />
Common Capital In Other Other<br />
and Class B Excess of Treasury Retained Comprehensive Shareholders’<br />
Total Stock 1,2 Par Stock Earnings Income Equity<br />
Balance At December 28, 1996 $ 881.9 $24.2 $ 96.1 $(230.5) $ 924.7 $ 78.2 $(10.8)<br />
Components of Comprehensive Income:<br />
Net income 49.4 .– .– .– 49.4 .– .–<br />
Currency translation adjustments (60.9) .– .– .– .– (60.9) .–<br />
Unrealized holding gain 11.8 .– .– .– .– 11.8 .–<br />
Total comprehensive income<br />
Net shares (canceled) issued under<br />
0.3<br />
employee plans (293,504 shares)<br />
Treasury shares issued under employee<br />
(16.2) .– (19.3) .– .– .– 3.1<br />
plans (620,621 shares) 29.2 .– .– 29.2 .– .– .–<br />
Treasury shares repurchased (521,925 shares) (21.8) .– .– (21.8) .– .– .–<br />
Amortization of unearned compensation 2.6 .– .– .– .– .– 2.6<br />
Dividends 3 (57.6) .– .– .– (57.6) .– .–<br />
Balance At December 27, 1997 818.4 24.2 76.8 (223.1) 916.5 29.1 (5.1)<br />
Components of Comprehensive Income:<br />
Net income 25.2 .– .– .– 25.2 .– .–<br />
Currency translation adjustments 11.9 .– .– .– .– 11.9 .–<br />
Total comprehensive income<br />
Net shares (canceled) issued under<br />
37.1<br />
employee plans (98,886 shares)<br />
Treasury shares issued under employee<br />
(0.6) .– 7.4 .– .– .– (8.0)<br />
plans (1,255,044 shares) 46.0 .– .– 46.0 .– .– .–<br />
Treasury shares repurchased (33,784 shares) (1.8) .– .– (1.8) .– .– .–<br />
Amortization of unearned compensation 4.1 .– .– .– .– .– 4.1<br />
Dividends 3 (58.2) .– .– .– (58.2) .– .–<br />
Balance At December 26, 1998 845.0 24.2 84.2 (178.9) 883.5 41.0 (9.0)<br />
Components of Comprehensive Income:<br />
Net income 444.8 .– .– .– 444.8 .– .–<br />
Currency translation adjustments (32.0) .– .– .– .– (32.0) .–<br />
Total comprehensive income<br />
Net shares (canceled) issued under<br />
412.8<br />
employee plans (342,467 shares)<br />
Treasury shares issued under employee<br />
0.4 (0.1) 5.4 .– .– .– (4.9)<br />
plans (1,854,740 shares) 72.2 .– .– 72.2 .– .– .–<br />
Treasury shares repurchased (665,452 shares) (43.4) .– .– (43.4) .– .– .–<br />
Amortization of unearned compensation 6.9 .– .– .– .– .– 6.9<br />
Dividends 3 (59.9) .– .– .– (59.9) .– .–<br />
Balance At December 25, <strong>1999</strong> $1,234.0 $24.1 $ 89.6 $(150.1) $1,268.4 $ 9.0 $ (7.0)<br />
1 There are also 10 thousand shares of $100 par value 4% cumulative preferred stock authorized, none of which has been issued.<br />
2 There are also 25 million shares of $1 par value Class A preferred stock authorized, none of which has been issued.<br />
3 Cash dividends of $1.04 per share were declared on Common and Class B stock in each of the years 1997, 1998 and <strong>1999</strong>.<br />
See Notes To Financial Statements<br />
See the future 22 <strong>Bausch</strong> & <strong>Lomb</strong>
Notes To Financial Statements<br />
Dollar Amounts In Millions – Except Per Share Data<br />
1. Accounting Policies<br />
Principles Of Consolidation The financial statements include all<br />
majority-owned U.S. and non-U.S. subsidiaries. Intercompany<br />
accounts, transactions and profits are eliminated. The fiscal year<br />
is the 52- or 53-week period ending the last Saturday in<br />
December.<br />
Segment <strong>Report</strong>ing In accordance with Statement of Financial<br />
Accounting Standards (SFAS) No. 131, Disclosures about Segments<br />
of an Enterprise and Related Information, the company split the<br />
pharmaceuticals/surgical segment into two separate segments in<br />
<strong>1999</strong> to reflect changes in the manner in which financial information<br />
is viewed by management for decision-making purposes.<br />
The company now reports its operating results in three segments:<br />
vision care, pharmaceuticals and surgical. Prior year amounts<br />
have been restated to conform with the <strong>1999</strong> presentation.<br />
Use Of Estimates The financial statements have been prepared<br />
in conformity with generally accepted accounting principles and,<br />
as such, include amounts based on informed estimates and judgments<br />
of management with consideration given to materiality.<br />
For example, estimates are used in determining valuation<br />
allowances for uncollectible trade receivables, obsolete inventory<br />
and deferred income taxes. Actual results could differ from those<br />
estimates.<br />
Cash Equivalents Cash equivalents include time deposits and<br />
highly liquid investments with original maturities of three months<br />
or less.<br />
Inventories Inventories are valued at the lower of cost or market<br />
using the first-in, first-out (FIFO) method.<br />
Property, Plant And Equipment Property, plant and equipment,<br />
including improvements that significantly add to productive<br />
capacity or extend useful life, are recorded at cost, while maintenance<br />
and repairs are expensed as incurred. Depreciation is<br />
calculated for financial reporting purposes using the straight-line<br />
method based on the estimated useful lives of the assets as follows:<br />
buildings, 30 to 40 years; machinery and equipment, two to ten<br />
years; and leasehold improvements, the shorter of the estimated<br />
useful life or the lease periods. In accordance with SFAS<br />
No. 121, Accounting for the Impairment of Long-Lived Assets and<br />
for Long-Lived Assets to Be Disposed of, the company assesses all<br />
long-lived assets, including property, plant and equipment, for<br />
impairment whenever events or changes in circumstances indicate<br />
that the carrying amount of an asset may not be recoverable.<br />
See the future 23 <strong>Bausch</strong> & <strong>Lomb</strong><br />
Goodwill And Other Intangibles Goodwill and other intangibles<br />
are amortized on a straight-line basis over periods of up to 40 years.<br />
In accordance with SFAS 121, the company assesses intangible<br />
assets for impairment whenever events or changes in circumstances<br />
indicate that the carrying amount may not be recoverable.<br />
In completing this evaluation, the company compares its best<br />
estimate of undiscounted future cash flows, excluding interest<br />
costs, with the carrying value of the assets. If undiscounted cash<br />
flows do not exceed the recorded value, an impairment is recognized<br />
to reduce the carrying value based on the expected<br />
discounted cash flows of the business unit. Expected cash flows<br />
are discounted at a rate commensurate with the risk involved.<br />
Revenue Recognition Revenues are generally recognized when<br />
products are shipped to the customer. The company has established<br />
programs which, under specified conditions, enable<br />
customers to return product. The company establishes liabilities<br />
for estimated returns and allowances at the time of shipment. In<br />
addition, accruals for customer discounts and rebates are recorded<br />
when revenues are recognized.<br />
Advertising Expense External costs incurred in producing media<br />
advertising are expensed the first time the advertising takes place.<br />
Promotional or advertising costs associated with customer support<br />
programs are accrued when the related revenues are<br />
recognized. At December 25, <strong>1999</strong> and December 26, 1998,<br />
$3.3 and $4.0 of deferred advertising costs representing primarily<br />
production and design costs for advertising to be run in the subsequent<br />
fiscal year, were reported as other current assets.<br />
Advertising expenses for continuing operations of $181.2, $180.5<br />
and $148.8 were included in selling, administrative and general<br />
expenses for <strong>1999</strong>, 1998 and 1997, respectively.<br />
Comprehensive Income As it relates to the company, comprehensive<br />
income is defined as net earnings plus the sum of currency<br />
translation adjustments and unrealized holding gains/losses on<br />
securities (collectively “other comprehensive income”), and is presented<br />
in the Statements of Changes in Shareholders’ Equity. A<br />
change in unrealized holding gains was reported net of an income<br />
tax benefit of $11.8 in 1997.<br />
Investments In Debt And Equity Securities In 1997, certain of<br />
the company’s other investments were classified as availablefor-sale<br />
under the terms of SFAS No. 115, Accounting for Certain<br />
Investments in Debt and Equity Securities, and accordingly, unrealized<br />
holding gains and losses, net of taxes, were excluded from
income and recognized as a component of accumulated other<br />
comprehensive income. Fair value of the investments was determined<br />
based on market prices or by reference to discounted cash<br />
flows, and investment risk.<br />
Foreign Currency For most subsidiaries outside the U.S., the<br />
local currency is the functional currency and translation adjustments<br />
are accumulated as a component of accumulated other<br />
comprehensive income. The accumulated balances of currency<br />
translation adjustments, net of taxes, were $9.0, $41.0 and $29.1<br />
at the end of <strong>1999</strong>, 1998 and 1997, respectively.<br />
For subsidiaries that operate in U.S. dollars or whose economic<br />
environment is highly inflationary, the U.S. dollar is the<br />
functional currency and gains and losses that result from remeasurement<br />
are included in earnings. The company currently has<br />
one subsidiary that operates in a hyperinflationary economy. The<br />
risk exposure related to this subsidiary is not considered material<br />
to the company’s consolidated financial statements. The effects<br />
from foreign currency translation were losses of $3.8 in <strong>1999</strong>,<br />
$2.2 in 1998 and $1.5 in 1997.<br />
The company hedges certain foreign currency transactions<br />
and firm commitments by entering into forward exchange<br />
contracts. Gains and losses associated with currency rate changes<br />
on forward contracts hedging foreign currency transactions are<br />
recorded in earnings. The effects of foreign currency transactions,<br />
including related hedging activities, were gains of $10.8, $8.8 and<br />
$8.4 in <strong>1999</strong>, 1998 and 1997, respectively.<br />
Derivative Financial Instruments The company enters into foreign<br />
currency and interest rate derivative contracts for the purpose<br />
of minimizing risk and protecting earnings.<br />
The company uses principally foreign currency forward<br />
contracts to hedge foreign exchange exposures. The portfolio<br />
of contracts is adjusted at least monthly to reflect changes in<br />
exposure positions as they become known. When possible and<br />
practical, the company matches the maturity of the hedging<br />
instrument to that of the underlying exposure. Net settlements are<br />
generally made at contract maturity based on rates agreed to at<br />
contract inception. Gains and losses on hedges of transaction<br />
exposures are included in income in the period in which exchange<br />
rates change. Gains and losses related to hedges of foreign currency<br />
firm commitments are deferred and recognized in the basis of the<br />
transaction when completed, while those on forward contracts<br />
hedging non-U.S. equity investments are offset against the currency<br />
component in accumulated other comprehensive income.<br />
The receivable or payable with the counterparty to the derivative<br />
contract is reported as either other current assets or accrued<br />
liabilities. Deferred gains and losses totaled less than $0.5 at<br />
December 25, <strong>1999</strong> and December 26, 1998 and are expected to<br />
be recognized within one year.<br />
See the future 24<br />
<strong>Bausch</strong> & <strong>Lomb</strong><br />
When appropriate, the company will generally enter into<br />
interest rate swap and cap agreements to effectively limit its exposure<br />
to interest rate movements within the parameters of its<br />
interest rate hedging policy. This policy indicates that interest rate<br />
exposures from floating-rate assets may be offset by a substantially<br />
similar amount of floating-rate liabilities. Interest rate derivatives<br />
may be used to readjust this natural hedge position whenever it<br />
becomes unbalanced beyond policy limits. Net payments or<br />
receipts on these agreements are accrued as other current assets<br />
and accrued liabilities and recorded as adjustments to interest<br />
expense or interest income. Interest rate instruments are entered<br />
into for periods no longer than the life of the underlying transactions<br />
or, in the case of floating-rate to fixed-rate swaps, for periods<br />
no longer than the underlying floating-rate exposure is expected<br />
to remain outstanding. Interest rate derivatives are normally held<br />
to maturity but may be terminated early, particularly if the underlying<br />
exposure is similarly extinguished. Gains and losses on<br />
prematurely terminated interest rate derivatives are recognized<br />
over the remaining life, if any, of the underlying exposure as an<br />
adjustment to interest income or interest expense. Due mainly to<br />
the proceeds received from the <strong>1999</strong> divestitures, the company<br />
exceeded policy limits at December 25, <strong>1999</strong>.<br />
The company amortizes premium income or expense<br />
incurred from entering into derivative instruments over the life of<br />
each agreement as non-operating income and expense.<br />
New Accounting Guidance In June 1998, the Financial<br />
Accounting Standards Board (FASB) issued SFAS No. 133,<br />
Accounting for Derivative Instruments and Hedging Activities<br />
which was subsequently amended by SFAS 137, which requires<br />
the company to adopt SFAS 133 no later than the first quarter of<br />
2001. SFAS 133 will require the company to record all derivatives<br />
on the balance sheet at fair value. Changes in derivative fair values<br />
will either be recognized in earnings as offsets to the changes in<br />
fair value of related hedged assets, liabilities and firm commitments,<br />
or for forecasted transactions, deferred and recorded as a<br />
component of accumulated other comprehensive income until<br />
the hedged transactions occur and are recognized in earnings. The<br />
ineffective portion of a hedging derivative’s change in fair value is<br />
immediately recognized in earnings. The impact of SFAS 133 on<br />
the company’s financial statements will depend on a variety of<br />
factors, including the future level of forecasted and actual<br />
foreign currency transactions, the extent of the company’s hedging<br />
activities, the types of hedging instruments used and the effectiveness<br />
of such instruments. The company is currently evaluating<br />
the financial statement impact of adopting SFAS 133.<br />
In December <strong>1999</strong>, the Securities and Exchange<br />
Commission (SEC) issued Staff Accounting Bulletin (SAB)<br />
No. 101, “Revenue Recognition in Financial Statements”, which<br />
summarizes certain of the SEC’s views in applying generally
accepted accounting principles to revenue recognition in financial<br />
statements. Management believes the company’s revenue recognition<br />
policies, as more fully described above, comply with the<br />
guidance contained in SAB 101 and, therefore, the company’s<br />
results of operations will not be materially affected.<br />
2. Acquisitions<br />
The following table presents information about acquisitions by<br />
the company during the two year period ended December 25,<br />
<strong>1999</strong>, as well as the goodwill and other intangible asset balances<br />
at December 26, 1998 and December 25, <strong>1999</strong>. The <strong>1999</strong> and<br />
1998 acquisitions were accounted for under the purchase method<br />
with a portion of the purchase price allocated to goodwill and<br />
other intangible assets and, in some cases, purchased in-process<br />
research and development (IPR&D).<br />
Goodwill Other Intangibles<br />
(gross) (gross) Total<br />
Balances at December 26, 1998<br />
Storz1 $ 107.7 $172.1 $ 279.8<br />
Chiron Vision2 104.0 96.3 200.3<br />
Dr. Winzer Pharma3 31.4 .– 31.4<br />
All other – continuing4 153.5 37.2 190.7<br />
All other – discontinued5 182.4 11.6 194.0<br />
Activity during <strong>1999</strong><br />
579.0 317.2 896.2<br />
Hansa6 17.7 .– 17.7<br />
Orbtek6 12.1 12.4 24.5<br />
All other – discontinued5 (182.4) (11.6) (194.0)<br />
Other <strong>1999</strong> activity .– (8.3) (8.3)<br />
Balance at December 25, <strong>1999</strong> $ 426.4 $309.7 $ 736.1<br />
Accumulated Amortization7 Goodwill and Other Intangibles, net<br />
(129.3)<br />
at December 25, <strong>1999</strong> $ 606.8<br />
1 Storz Instrument Company, Storz Ophthalmics, Inc. and Cyanamid Chirurgie S.A.S. (collectively, Storz) was a leading manufacturer of ophthalmic surgical instruments, surgical<br />
and diagnostic equipment, intraocular lens implants and ophthalmic pharmaceuticals. It was acquired at the beginning of 1998 for $369.7 in cash. Goodwill is being amortized<br />
over an original life of 40 years. Other intangible assets are being amortized over original lives as follows: tradename of $37.3 and workforce of $12.9, 17 years; customer relationships<br />
of $80.8, 40 years; and technology/patents of $28.0, 10 years.<br />
2 Chiron Vision Corporation, acquired for cash of $298.1 in the beginning of 1998, researched, developed and manufactured innovative products that improved results in cataract<br />
and refractive surgeries and that enhanced the treatment of progressive eye diseases. Goodwill is being amortized over an original life of 20 years. Other intangible assets are<br />
being amortized over original lives as follows: tradename of $26.4 and customer relationships of $41.4, 20 years; workforce of $10.7, 14 years; and technology/patents of $18.1,<br />
8 years.<br />
3 Dr. Winzer Pharma, a pharmaceutical company in Germany, was acquired in May 1998. Goodwill has an original life of 15 years.<br />
4 Goodwill includes the following amounts: Dr. Mann Pharma, acquired in 1986, $82.5 with an original life of 30 years; Award, plc, acquired in 1996, $36.3 with an original life of<br />
15 years; remainder has average original life of 26 years with an average remaining life of 19 years.<br />
5 Amounts represent goodwill and other intangibles for businesses sold during <strong>1999</strong> as described in Note 3—Discontinued Operations.<br />
6 Hansa Research and Development, Inc, acquired in January <strong>1999</strong> for $18.4, manufactured the Hansatome microkeratome used in refractive surgery procedures. Goodwill is<br />
being amortized over an original life of 15 years. Orbtek, Inc, acquired in March <strong>1999</strong> for $24.7, developed a unique diagnostic system to give surgeons critical information about<br />
the eye. Goodwill is being amortized over an original life of 20 years. Other intangible assets are being amortized over original lives as follows: workforce of $0.2, 14 years;<br />
regulatory approvals of $8.5, 20 years; and technology/patents of $3.7, 10 years.<br />
7 Accumulated amortization at December 26, 1998 was $137.3.<br />
See the future 25 <strong>Bausch</strong> & <strong>Lomb</strong>
The purchase price for the acquisitions was allocated to<br />
tangible assets and intangible assets, including goodwill and<br />
identifiable intangible assets, less liabilities assumed, and in the<br />
case of Storz and Chiron Vision, to IPR&D. As required under<br />
generally accepted accounting principles, IPR&D was immediately<br />
expensed, resulting in a non-cash charge to earnings, since<br />
the underlying R&D projects had not reached technological<br />
feasibility and the assets to be used in such projects had no alternative<br />
future use.<br />
The useful lives of goodwill was determined based upon an<br />
evaluation of pertinent factors, including:<br />
• Individual aspects of each acquisition and the associated<br />
useful lives<br />
• Consideration to legal, regulatory and contractual provisions<br />
which could limit the maximum useful life<br />
• Management’s professional judgement and in some instances,<br />
the expert opinions of independent appraisers<br />
After considering these factors as they related to the Chiron<br />
Vision and Storz acquisitions, it was determined that the associated<br />
goodwill related explicitly to the perceived earnings potential<br />
of these businesses, and furthermore, that the future periods to<br />
benefit from these potential earnings were integrally associated<br />
with the acquired customer bases. Therefore, the asset lives<br />
assigned to goodwill were the same as the lives assigned to the<br />
customer base component of other intangible assets, which was<br />
40 and 20 years, respectively, for Chiron Vision and Storz.<br />
The asset lives of the other intangible assets acquired in the<br />
Chiron Vision and Storz acquisitions were determined by independent<br />
appraisers, and agreed to by management, using generally<br />
accepted actuarial methodologies needed to estimate useful lives<br />
from observed historical data. In estimating the useful life of the<br />
Storz customer relationships referred to in the above table, the<br />
appraisers evaluated relationships that Storz had fostered since its<br />
formation (and the formation of companies it had acquired) and<br />
calculated the useful life by observing the pattern of historical<br />
customer attrition. Based on this attrition pattern, customers were<br />
sorted into “vintage groups” that identified the length of tenure<br />
with Storz, analyzed for survival rates and translated into loss rates<br />
for each vintage. The annual survivor rates were then extrapolated<br />
to determine the future rate of customer loss and from this data a<br />
useful life of 40 years was calculated. The same statistical technique<br />
was used to determine the life of customer relationships for Chiron<br />
Vision, which was estimated to be 20 years.<br />
For the other categories of other intangible assets – tradenames,<br />
workforce and technology/patents – specific facts and<br />
circumstances were analyzed by the appraisers to determine<br />
appropriate asset lives.<br />
See the future 26<br />
<strong>Bausch</strong> & <strong>Lomb</strong><br />
There were a combined 11 product development projects for<br />
Chiron Vision and Storz included in the $41.0 pre-tax charge to<br />
IPR&D. The projects were unique from other pre-existing core<br />
technology and pertained primarily to the development of new<br />
ophthalmic pharmaceutical drugs, new or redesigned intraocular<br />
lenses and products that support eye surgery procedures. The<br />
value allocated to IPR&D was determined using an income<br />
approach. Such methodology involved estimating the fair value of<br />
the purchased IPR&D using the present value of the estimated<br />
after-tax cash flows expected to be generated as a result of these<br />
projects and using risk-adjusted discount rates and revenue forecasts<br />
as appropriate. These estimates were consistent with<br />
historical pricing, margins and expense levels for similar products.<br />
Revenues were estimated based on relevant market size and<br />
growth factors, expected industry trends, individual product sales<br />
cycles and other factors. Estimated operating expenses, income<br />
taxes, and charges for use of contributory assets were deducted<br />
from estimated revenues to determine estimated after-tax cash<br />
flows for each project. Estimated operating expenses included<br />
cost of goods sold and selling, administrative and general<br />
expenses. The discount rates used to value the IPR&D projects<br />
ranged from 15% to 22%. These rates were based on the company’s<br />
weighted average cost of capital, as well as other factors, including<br />
the useful life of each project, the anticipated profitability of each<br />
project and the uncertainty regarding the successful completion of<br />
each project. The value of IPR&D was also impacted by the stage<br />
of completion of each project, which ranged from 17% to 95%.<br />
Management is primarily responsible for estimating the fair<br />
value of assets and liabilities obtained through acquisitions and<br />
has conducted due diligence in determining fair values.<br />
Management made estimates and assumptions at the time of<br />
each acquisition that affect the reported amounts of assets, liabilities<br />
and expenses, including IPR&D, resulting from such<br />
acquisitions. Actual results could differ from those amounts.<br />
During <strong>1999</strong>, two of the product development projects representing<br />
40% of the $41.0 pre-tax charge were discontinued. Costs<br />
and expected revenues related to the remaining projects have not<br />
varied materially from original projections.<br />
Accrual for Exit Activities As part of the integration of Chiron<br />
Vision and Storz, management developed a formal plan that<br />
included the shutdown of duplicate facilities in the U.S., Europe<br />
and Asia, the elimination of duplicate product lines and the consolidation<br />
of certain administrative functions. The exit activities<br />
were committed to by management and formally communicated<br />
to employees shortly after the acquisitions were consummated.<br />
The major components of the accrual were as follows:
The costs of employee terminations related to 596 employees<br />
in production, R&D, selling and administration. During <strong>1999</strong><br />
and 1998, 384 and 100 of these employees were terminated,<br />
respectively, leaving 112 to be terminated in 2000. Employees to<br />
be terminated in 2000 include those in a foreign jurisdiction that<br />
involved a lengthy statutory process of notice and approval prior<br />
to termination. Management does not believe such process will<br />
result in severance payments or other costs materially different<br />
from those accrued. The facilities closure costs primarily represented<br />
leasehold termination payments and fixed asset<br />
writedowns relating to duplicate facilities. The closures and<br />
consolidations in the U.S. were substantially completed in<br />
<strong>1999</strong>. The closures and consolidations outside the U.S. were<br />
commenced in <strong>1999</strong> and are expected to be substantially<br />
complete in 2000. Involuntary termination benefits of $18.1<br />
were accrued in 1998. Amounts paid and charged against the<br />
liability were $8.4 in <strong>1999</strong> and $5.4 in 1998.<br />
3. Discontinued Operations<br />
On June 26, <strong>1999</strong>, the company completed the sale of its sunglass<br />
business to Luxottica Group S.p.A. for $636.0 in cash. The company<br />
recorded an after-tax gain of $126.3 or $2.16 per diluted<br />
share, which included the costs associated with exiting the business,<br />
such as severance pay and additional pension costs. The results of<br />
the sunglass business have been reported as discontinued operations<br />
in the accompanying Statements of Income. Revenues of this<br />
business were $252.7, $445.6 and $482.9 for <strong>1999</strong>, 1998<br />
and 1997, respectively. At the time of the sale, certain non-U.S.<br />
sunglass businesses were subject to deferred closings due to local<br />
regulatory and legal considerations, all of which should be<br />
resolved to enable closings to occur within a 12-month period<br />
from the original date of sale, with the exception of the company’s<br />
interest in the sunglass business of <strong>Bausch</strong> & <strong>Lomb</strong> India<br />
Costs of Exit Activities<br />
Employee<br />
Severance Facilities Contract<br />
and Relocation Closure Costs Terminations Total<br />
Accrued at acquisition date<br />
Less 1998 Activity<br />
$ 21.7 $ 5.5 $ 0.9 $ 28.1<br />
Cash payments (6.3) (0.7) (0.9) (7.9)<br />
Non-cash items .– (0.3) .– (0.3)<br />
Balances at December 26, 1998<br />
Less <strong>1999</strong> Activity<br />
15.4 4.5 .– 19.9<br />
Cash payments (10.7) (0.4) .– (11.1)<br />
Non-cash items .– (2.6) .– (2.6)<br />
Balances at December 25, <strong>1999</strong> $ 4.7 $ 1.5 $ .– $ 6.2<br />
See the future 27 <strong>Bausch</strong> & <strong>Lomb</strong><br />
Limited, which is expected to occur within 24 months from the<br />
original date of sale. Most of the deferred closings were completed<br />
prior to December 25, <strong>1999</strong>. Net assets from the remaining units<br />
were classified as net assets held for disposal in the company’s<br />
December 25, <strong>1999</strong> balance sheet. Net assets of the sunglass<br />
business subject to deferred closing totaled $29.3 at December<br />
25, <strong>1999</strong>, and consisted primarily of inventory, receivables,<br />
property, plant and equipment, accrued liabilities and payables.<br />
On August 30, <strong>1999</strong> the company completed the sale of its<br />
hearing aid business to Amplifon S.p.A., a privately-held<br />
company in Italy. The company recorded an after-tax gain of<br />
$11.1 or $0.19 per diluted share, including costs associated with<br />
exiting the business. Also during the third quarter, the company<br />
completed the sale of Charles River Laboratories, a biomedical<br />
business, to DLJ Merchant Banking Partners II, L.P., an affiliate<br />
of the investment banking firm of Donaldson, Lufkin and<br />
Jenrette, for approximately $400 in cash and $43 in promissory<br />
notes. The company retained a 12.5% equity interest in the<br />
Charles River Laboratories business. The company recorded an<br />
after-tax gain of $170.7 or $2.91 per diluted share, including costs<br />
associated with exiting the business. The hearing aid, the biomedical<br />
and the skin care business (which was sold in 1998)<br />
collectively, comprised the company’s healthcare segment. The<br />
results of the healthcare segment have been reported as discontinued<br />
operations in the accompanying Statements of Income.<br />
Revenues for this segment were $241.0, $319.7 and $324.1<br />
for <strong>1999</strong>, 1998 and 1997, respectively.<br />
Income (loss) from discontinued operations as reported on the<br />
company’s Statements of Income were net of income taxes of $20.6,<br />
$14.2 and $(5.0) for the fiscal years ended <strong>1999</strong>, 1998 and 1997.<br />
The balance sheets at December 25, <strong>1999</strong> and December 26, 1998<br />
and the statements of cash flows for the years ended December<br />
25, <strong>1999</strong>, December 26, 1998 and December 27, 1997 have not<br />
been restated to reflect the divestitures of these businesses.
4. Earnings Per Share<br />
Basic earnings per share is computed based on the weighted average<br />
number of Common and Class B shares outstanding during a<br />
period. Diluted earnings per share reflect the assumed conversion<br />
of dilutive stock options. In computing the per share effect of<br />
assumed conversion, funds which would have been received from<br />
See the future 28 <strong>Bausch</strong> & <strong>Lomb</strong><br />
the exercise of options were considered to have been used to<br />
repurchase common shares at average market prices for the period,<br />
and the resulting net additional common shares are included in<br />
the calculation of average common shares outstanding.<br />
The table below summarizes the amounts used to calculate<br />
basic and diluted earnings per share:<br />
<strong>1999</strong> 1998 1997<br />
Income from continuing operations $102.7 $ 55.6 $ 62.0<br />
Income (loss) from discontinued operations, net 34.0 (63.4) (12.6)<br />
Gain on disposals of discontinued operations, net 308.1 33.0 .–<br />
Net Income $444.8 $ 25.2 $ 49.4<br />
Basic Net Income Per Common Share:<br />
Continuing operations $ 1.79 $ 1.00 $ 1.12<br />
Discontinued operations 0.59 (1.14) (0.23)<br />
Gain on disposal of discontinued operations 5.38 0.59 .–<br />
Net income per common share $ 7.76 $ 0.45 $ 0.89<br />
Diluted Net Income Per Common Share:<br />
Continuing operations $ 1.75 $ 0.99 $ 1.12<br />
Discontinued operations 0.58 (1.13) (0.23)<br />
Gain on disposal of discontinued operations 5.26 0.59 .–<br />
Net income per common share $ 7.59 $ 0.45 $ 0.89<br />
Basic average common shares outstanding (000s) 57,287 55,824 55,383<br />
Dilutive effect of stock options (000s) 1,352 543 271<br />
Diluted average common shares outstanding (000s) 58,639 56,367 55,654<br />
Antidilutive outstanding stock options were excluded from the calculation of average shares outstanding. Options excluded, in thousands,<br />
totaled 1,149 in <strong>1999</strong>, 1,709 in 1998 and 3,431 in 1997. Actual outstanding Common and Class B shares at the beginning of the period<br />
were 56,529 in <strong>1999</strong>, 55,209 in 1998 and 55,404 in 1997.
5. Restructuring Charges And Asset Write-offs<br />
<strong>1999</strong> Program<br />
In December <strong>1999</strong>, the company's board of directors announced that it was implementing a comprehensive program to exit certain contact<br />
lens manufacturing platforms and take additional steps to further reduce the administrative cost structure throughout the company. As a<br />
result, the company recorded a pre-tax charge of $56.7 for <strong>1999</strong>, the major components of which are summarized in the table below:<br />
See the future 29 <strong>Bausch</strong> & <strong>Lomb</strong><br />
Vision Care Other/Administrative Total<br />
Provisions<br />
Employee terminations $ 27.1 $ 3.7 $ 30.8<br />
Asset write-offs 25.8 0.1 25.9<br />
Less <strong>1999</strong> Activity<br />
52.9 3.8 56.7<br />
Cash payments (1.0) .– (1.0)<br />
Non-cash items (25.8) (0.1) (25.9)<br />
Remaining reserve at December 25, <strong>1999</strong> $ 26.1 $ 3.7 $ 29.8<br />
The restructuring program within the vision care segment will focus on the elimination of certain contact lens manufacturing platforms<br />
resulting from exiting less cost-effective technologies. The programs included under other/administrative will focus primarily on further<br />
reducing overhead costs throughout the company. The major actions in this restructuring plan include:<br />
Start Date Anticipated Completion Date<br />
Project<br />
Vision Care<br />
Exit certain European manufacturing platforms Q4/99 Q2/00<br />
Exit certain U.S. manufacturing platforms Q4/99 Q4/00<br />
Eliminate internal infrastructure costs<br />
Other/Administrative<br />
Q4/99 Q2/00<br />
Eliminate internal infrastructure costs Q4/99 Q4/00<br />
The above projects will result in the termination of approximately<br />
900 employees. Vision care includes terminations of 710<br />
employees in production and 116 administrative staff. The<br />
other/administrative actions include the termination of approximately<br />
80 staff in both administrative and sales roles. As of<br />
December 25, <strong>1999</strong>, approximately 240 employees have been<br />
involuntarily terminated under this restructuring plan with $1.0<br />
of related costs being charged against the liability.<br />
The employee terminations will result in future cash<br />
outflows to the company. These cash outflows, which began in<br />
December <strong>1999</strong>, are expected to take place throughout 2000,<br />
with the majority of the outflows occurring in the second half of<br />
the year. The company will use its current cash balance as well as<br />
cash provided by operations to fund these cash outflows.<br />
In addition to employee terminations, the above projects<br />
resulted in $25.9 of asset write-offs, primarily for the abandonment<br />
of manufacturing equipment. The disposition and/or decommissioning<br />
of these assets occurred in the fourth quarter of <strong>1999</strong><br />
and January 2000.
1997 Program<br />
In April 1997, the company’s board of directors approved plans to<br />
restructure portions of each of the company’s business segments,<br />
as well as certain corporate administration functions. As a result,<br />
cumulative pre-tax restructuring charges of $85.5 were recorded<br />
through the first half of 1998. Of these charges, $46.0 related to<br />
The goal of this restructuring program was to significantly<br />
reduce the company’s fixed cost structure and realign the organization<br />
to meet its strategic objectives through the closure,<br />
relocation and consolidation of manufacturing, distribution, sales<br />
and administrative operations and workforce reductions. During<br />
<strong>1999</strong>, the actions relating to these programs were completed and<br />
the remaining reserve of $3.2 was reversed.<br />
The 1997 program was expected to yield approximately<br />
$41.0 in annual cost savings. Actual cost savings related to this<br />
plan are in line with expectations. These cost savings are reflected<br />
primarily in reduced cost of sales and lower selling, administrative<br />
and general costs. The originally anticipated cost savings were<br />
largely reinvested in marketing and advertising to support new<br />
product launches.<br />
6. Business Segment And<br />
Geographic Information<br />
The company is organized by product line for management<br />
reporting with operating earnings being the primary measure of<br />
segment profitability. Certain distribution and general and<br />
Vision Care Pharmaceuticals Corporate Services Total<br />
Original Provision 1 $12.0 $ 5.0 $ 29.0 $ 46.0<br />
Less 1997 Activity<br />
Cash payments (8.5) (1.9) (5.9) (16.3)<br />
Non-cash items (3.3) .– (0.3) (3.6)<br />
Less 1998 Activity<br />
Cash payments (6.2) (1.7) (3.1) (11.0)<br />
Non-cash items .– .– .– .–<br />
Less <strong>1999</strong> Activity 1<br />
Cash payments 6.6 (1.2) (17.0) (11.6)<br />
Non-cash items 0.2 .– (0.5) (0.3)<br />
Less <strong>1999</strong> Reversal of Reserve (0.8) (0.2) (2.2) (3.2)<br />
Remaining Reserve 12/25/99 $ .– $ .– $ .– $ .–<br />
1 During the first quarter of <strong>1999</strong>, the company reclassified its restructuring provisions and historical charges to properly reflect responsibilities for restructuring activity<br />
consistent with current segment reporting. The 1997 restructuring provisions and <strong>1999</strong> related charges have been amended to properly reflect the reclassification.<br />
See the future 30 <strong>Bausch</strong> & <strong>Lomb</strong><br />
ongoing operations and $39.5 related to divested businesses and<br />
are reported as part of income from discontinued operations.<br />
The following table sets forth the activity in this reserve for<br />
continuing operations through December 25, <strong>1999</strong>:<br />
administrative expenses, including some centralized services<br />
provided by corporate functions, are allocated based on segment<br />
sales. No items below operating earnings are allocated to segments.<br />
Restructuring charges and charges related to certain significant<br />
events, although related to specific product lines, are also excluded<br />
from management basis results. The accounting policies used to<br />
generate segment results are the same as the company’s overall<br />
accounting policies.<br />
The company’s segments are vision care, pharmaceuticals<br />
and surgical. The vision care segment includes contact lenses,<br />
lens care products and vision accessories. The pharmaceuticals<br />
segment includes prescription ophthalmic drugs as well as overthe-counter<br />
medications. The surgical segment is comprised of<br />
cataract, refractive and retinal products.<br />
Segment assets represent operating assets of U.S. commercial<br />
entities, global manufacturing locations and inventories of non-<br />
U.S. commercial entities. Net assets from discontinued operations<br />
subject to deferred closings are classified as “net assets held for<br />
disposal” in the company’s <strong>1999</strong> balance sheet. Other operating<br />
assets of non-U.S. commercial entities are reported as “amounts<br />
not allocated” in the following table.
Business Segment The following table presents sales and other financial information by business segment for the years <strong>1999</strong>, 1998 and 1997.<br />
The company does not have material intersegment sales.<br />
Operating Depreciation Capital<br />
Net Sales Earnings and Amortization Expenditures Assets<br />
<strong>1999</strong><br />
Vision Care $1,029.5 $200.5 $ 65.3 $ 54.5 $ 524.3<br />
Pharmaceuticals 293.9 66.1 16.0 21.1 266.4<br />
Surgical 432.7 64.1 41.4 18.3 769.3<br />
1,756.1 330.7 122.7 93.9 1,560.0<br />
Corporate administration .– (63.0) 6.5 43.4 1,246.0<br />
Restructuring1 .– (53.5) .– .– .–<br />
Discontinued assets .– .– 27.0 18.6 .–<br />
Net assets held for disposal .– .– .– .– 29.3<br />
Amounts not allocated .– .– .– .– 438.2<br />
$1,756.1 $214.2 $156.2 $155.9 $3,273.5<br />
1998<br />
Vision Care $ 971.2 $208.4 $ 62.8 $112.8 $ 555.3<br />
Pharmaceuticals 241.6 49.2 15.6 17.2 262.2<br />
Surgical 384.7 43.0 36.6 14.5 696.3<br />
1,597.5 300.6 115.0 144.5 1,513.8<br />
Corporate administration .– (52.6) 2.7 18.7 448.8<br />
Restructuring2 .– (5.4) .– .– .–<br />
Other significant charges3 .– (73.1) .– .– .–<br />
Discontinued assets .– .– 46.1 38.3 657.9<br />
Amounts not allocated .– .– .– .– 871.2<br />
$1,597.5 $169.5 $163.8 $201.5 $3,491.7<br />
1997<br />
Vision Care $ 918.1 $210.9 $ 49.0 $ 73.6 $ 463.1<br />
Pharmaceuticals 190.6 36.6 10.9 10.0 192.5<br />
1,108.7 247.5 59.9 83.6 655.6<br />
Corporate administration .– (45.5) 2.2 1.6 456.0<br />
Restructuring4 .– (39.1) .– .– .–<br />
Discontinued assets .– .– 49.9 40.9 817.4<br />
Amounts not allocated .– .– .– .– 843.9<br />
$1,108.7 $162.9 $112.0 $126.1 $2,772.9<br />
1 Restructuring charges and asset write-offs were recorded as follows: vision care, $52.9; pharmaceuticals, $2.0; corporate administration, $1.8 and a reversal of $3.2 related to<br />
the 1997 reserve.<br />
2 Restructuring charges and asset write-offs were recorded as follows: vision care, $2.3 and corporate administration, $3.1.<br />
3 Other significant charges consisted of a charge of $41.0 for purchased in-process R&D and a purchase accounting inventory adjustment of $32.1. Both adjustments related to<br />
the Chiron Vision and Storz acquisitions.<br />
4 Restructuring charges and asset write-offs were recorded as follows: vision care, $19.4; pharmaceuticals, $5.0; and corporate administration, $14.7.<br />
See the future 31 <strong>Bausch</strong> & <strong>Lomb</strong>
Geographic Region The following table presents sales and long-lived assets by geography for the years <strong>1999</strong>, 1998 and 1997. Sales to<br />
unaffiliated customers represent net sales originating in entities physically located in the identified geographic area.<br />
Long-lived assets include property, plant and equipment, goodwill and intangibles, other investments and other assets.<br />
See the future 32 <strong>Bausch</strong> & <strong>Lomb</strong><br />
U.S. Non-U.S. Consolidated<br />
<strong>1999</strong><br />
Sales to unaffiliated customers $ 929.5 $826.6 $1,756.1<br />
Long-lived assets<br />
1998<br />
951.8 506.8 1,458.6<br />
Sales to unaffiliated customers $ 841.9 $755.6 $1,597.5<br />
Long-lived assets<br />
1997<br />
1,073.0 831.9 1,904.9<br />
Sales to unaffiliated customers $ 564.0 $544.7 $1,108.7<br />
Long-lived assets 743.8 938.9 1,682.7<br />
7. Supplemental Balance Sheet Information<br />
December 25, <strong>1999</strong> December 26, 1998<br />
Inventories<br />
Raw materials and supplies $ 54.0 $ 84.7<br />
Work in process 15.9 39.1<br />
Finished products 169.7 319.3<br />
Less allowance for valuation of certain U.S.<br />
239.6 443.1<br />
inventories at LIFO1 .– (2.4)<br />
$239.6 $440.7<br />
Inventories valued using LIFO $ .– $ 49.7<br />
1 LIFO valuation allowance related to certain inventories held by the company's divested sunglass business.<br />
December 25, <strong>1999</strong> December 26, 1998<br />
Property, Plant And Equipment<br />
Land $ 12.0 $ 25.4<br />
Buildings 212.8 416.0<br />
Machinery and equipment 772.1 930.2<br />
Leasehold improvements 35.2 41.1<br />
1,032.1 1,412.7<br />
Less accumulated depreciation (507.3) (687.7)<br />
$ 524.8 $ 725.0
8. Other Short- And Long-Term Investments<br />
Netherlands Guilder Investment The company has invested<br />
219 million Netherlands guilders (NLG), all classified as longterm<br />
and approximating $136.0 at the time of the investment,<br />
in securities issued by a subsidiary of a triple-A rated financial<br />
institution. The issuer’s investments are restricted to high quality,<br />
short-term investments (less than 90 days) and government<br />
obligations, and as such, the net asset value is not expected to be<br />
materially different than fair value. The issuer reinvests all of its<br />
income. At December 25, <strong>1999</strong>, the average U.S. dollar rate of<br />
return was 5.29%, including the effects of a cross-currency swap<br />
transaction that effectively hedges the currency risk and converts<br />
the NLG income to a U.S. dollar rate of return.<br />
The company, through two non-U.S. legal entities, owns<br />
approximately 22% of the subsidiary of the financial institution;<br />
the financial institution owns the remainder. The company has<br />
the right to put its equity position at net asset value to the financial<br />
institution at the end of each quarter until January 2003.<br />
Since the securities are not readily marketable, this represents the<br />
company’s ability to exit from the investment.<br />
The company also has the right to call the financial institution’s<br />
equity position at net asset value at the end of each quarter<br />
until October 2003. Should the company choose not to exercise<br />
either its put or call options, the financial institution may put its<br />
equity at net asset value to the company in March or June 2003.<br />
In either instance, the company would then own 100% of<br />
the subsidiary of the financial institution and account for it as a<br />
consolidated entity. The company would use the high quality,<br />
short-term investments of the issuer to offset the reduction in<br />
liquidity associated with full ownership of the subsidiary of the<br />
financial institution.<br />
Management believes this investment is fully recoverable at<br />
par value based on the high quality and stability of the financial<br />
institution. However, the investment is subject to equity risk.<br />
See the future 33 <strong>Bausch</strong> & <strong>Lomb</strong><br />
U.S. Dollar Investment The company invested $425.0 in equity<br />
securities issued by a subsidiary of a double-A rated financial<br />
institution. The securities rank senior to all other classes of the<br />
issuer’s equity and rank junior to the secured and unsecured<br />
liabilities of the issuer, including subordinated debt obligations,<br />
and are neither payable upon demand nor have a fixed maturity.<br />
The securities pay quarterly cumulative dividends at a variable<br />
LIBOR-based rate. At December 25, <strong>1999</strong>, this rate was 4.96%.<br />
The issuer and the company agreed to redeem these securities at<br />
par over a 12-month period commencing January 5, <strong>1999</strong>, and as<br />
a result, the company classified $300.0 of this investment as<br />
short-term at December 26, 1998. At December 25, <strong>1999</strong>, the<br />
remaining $125 unredeemed portion of the investment was<br />
classified as short-term and subsequently, on January 5, 2000, the<br />
remaining portion was redeemed. The company used the<br />
redemption proceeds to finance operational requirements outside<br />
the U.S. and invest in short-term money market instruments.<br />
Other Investments Upon the sale of the company’s biomedical<br />
business in September <strong>1999</strong>, the company received a subordinated<br />
discount note due September 2010, with an original issue<br />
price of $43.0. The interest on this note, which varies from a rate<br />
of 12.0% to 15.0%, accretes daily to a value at maturity of<br />
$175.3. This note may be redeemed at any time prior to maturity<br />
at the discretion of the issuer at the accreted value on the date<br />
redeemed. The note is subordinate to the senior indebtedness of<br />
the issuer. The company also maintains a 12.5% equity interest in<br />
the divested business, valued at $19.9 at the end of <strong>1999</strong>, and<br />
accounted for under the cost method.
9. Provision For Income Taxes<br />
An analysis of the components of earnings from continuing operations before income taxes and minority interest and the related provision<br />
for income taxes is presented below:<br />
Deferred taxes, detailed below, recognize the impact of temporary<br />
differences between the amounts of assets and liabilities<br />
recorded for financial statement purposes and such amounts<br />
measured in accordance with tax laws. Realization of the tax loss<br />
and credit carryforwards, some of which expire between 2000 and<br />
2006, and others which have no expiration, is contingent on<br />
future taxable earnings in the appropriate jurisdictions. Valuation<br />
allowances have been recorded for these and other asset items<br />
which may not be realized. Each carryforward item is reviewed for<br />
expected utilization, using a “more likely than not” approach,<br />
based on the character of the carryforward item (credit, loss, etc.),<br />
the associated taxing jurisdiction (U.S., state, non-U.S., etc.), the<br />
relevant history for the particular item, the applicable expiration<br />
dates, operating projects that would impact utilization, and identified<br />
actions under the control of the company in realizing the<br />
See the future 34 <strong>Bausch</strong> & <strong>Lomb</strong><br />
<strong>1999</strong> 1998 1997<br />
Earnings (loss) from continuing operations before income taxes<br />
and minority interest<br />
U.S. $ 39.7 $ (36.8) $ 27.3<br />
Non-U.S. 145.3 156.5 105.7<br />
$185.0 $119.7 $133.0<br />
Provision for income taxes<br />
Federal<br />
Current $ 13.4 $ 6.5 $ 36.2<br />
Deferred<br />
State<br />
6.6 (11.4) (18.5)<br />
Current 4.7 1.2 6.2<br />
Deferred<br />
Foreign<br />
4.9 (3.3) (0.8)<br />
Current 43.5 35.2 33.0<br />
Deferred (6.5) 14.0 (5.5)<br />
$ 66.6 $ 42.2 $ 50.6<br />
associated carryforward benefits. Additionally, the company’s<br />
utilization of U.S. foreign tax credit and state investment credit<br />
carryforwards is critically dependent on related statutory limitations<br />
that involve numerous factors beyond overall positive<br />
earnings, all of which must be taken into account by the company<br />
in its evaluation. The company assesses the available positive and<br />
negative evidence surrounding the recoverability of the deferred<br />
tax assets and applies its judgment in estimating the amount of<br />
valuation allowance necessary under the circumstances. The company<br />
continues to assess and evaluate strategies that will enable<br />
the carryforwards, or portion thereof, to be utilized, and will<br />
reduce the valuation allowance appropriately for each item at<br />
such time when it is determined that the “more likely than not”<br />
approach is satisfied.
Reconciliations of the statutory U.S. federal income tax rate to the effective tax rates for continuing operations were as follows:<br />
At December 25, <strong>1999</strong>, earnings considered to be permanently<br />
reinvested in non-U.S. subsidiaries totaled approximately<br />
$902.5. Deferred income taxes have not been provided on these<br />
earnings as the company does not plan to initiate any action that<br />
December 25, <strong>1999</strong> December 26, 1998<br />
Assets Liabilities Assets Liabilities<br />
Current:<br />
Sales and allowance accruals $ 23.4 $ .– $ 17.8 $ .–<br />
Employee benefits and compensation 17.2 .– 22.5 .–<br />
Inventories 20.0 5.3 25.1 .–<br />
Restructuring accruals 9.7 .– 4.5 .–<br />
Other accruals 1.3 7.1 11.4 1.0<br />
Unrealized foreign<br />
exchange transactions 1.9 8.0 1.8 2.5<br />
State and local income tax .– 8.1 .– 11.9<br />
$ 73.5 $ 28.5 $ 83.1 $15.4<br />
Non-current:<br />
Tax loss and credit carryforwards $110.8 $ .– $ 48.7 $ .–<br />
Employee benefits 26.4 0.3 30.0 0.3<br />
Other accruals<br />
Unrealized foreign exchange<br />
.– 11.6 .– 8.9<br />
transactions .– 14.0 .– 15.1<br />
Depreciation and amortization .– 25.1 7.6 21.7<br />
Valuation allowance (45.6) .– (39.6) .–<br />
Intercompany investments .– 203.3 .– .–<br />
91.6 254.3 46.7 46.0<br />
$165.1 $282.8 $129.8 $61.4<br />
See the future 35 <strong>Bausch</strong> & <strong>Lomb</strong><br />
<strong>1999</strong> 1998 1997<br />
Statutory U.S. tax rate 35.0% 35.0% 35.0%<br />
State income taxes, net of federal tax benefit 3.3 (1.2) 4.1<br />
Goodwill amortization 0.9 0.1 .–<br />
Foreign Sales Corporation tax benefit (0.9) (1.7) (1.2)<br />
Difference between non-U.S. and U.S. tax rates (2.8) 3.9 (1.4)<br />
Other 0.5 (0.9) 1.6<br />
Effective tax rate 36.0% 35.2% 38.1%<br />
would require the payment of income taxes. It is not practicable<br />
to estimate the amount of additional tax that might be payable on<br />
these undistributed foreign earnings.
10. Debt<br />
Short-term debt at December 25, <strong>1999</strong> and December 26, 1998<br />
consisted of $20.9 and $101.9 in U.S. borrowings and $25.0 and<br />
$58.5 in non-U.S. borrowings, respectively. To support its liquidity<br />
requirements, the company maintains U.S. revolving credit<br />
agreements. During the second quarter of <strong>1999</strong>, the company<br />
restructured its revolving credit agreements and now maintains<br />
364-day bilateral revolving credit agreements totaling $500.0.<br />
The interest rate under these agreements is based on LIBOR, or<br />
at the company’s option, such other rate as may be agreed upon<br />
by the company and the bank. No debt was outstanding under<br />
these agreements at December 25, <strong>1999</strong>. In addition, the company<br />
maintains other lines of credit on which it may draw to meet its<br />
financing requirements. The company believes its existing credit<br />
facilities provide adequate liquidity to meet obligations, fund<br />
capital expenditures and invest in potential growth opportunities.<br />
Commitment fees on the revolving credit agreements fluctuate<br />
according to the long-term debt ratings of the company and were<br />
See the future 36 <strong>Bausch</strong> & <strong>Lomb</strong><br />
0.1% as of December 25, <strong>1999</strong>. The company also maintains<br />
unused U.S. bank lines of credit amounting to approximately<br />
$27.0. Compensating balance arrangements for these lines are<br />
not material.<br />
During <strong>1999</strong>, the company terminated two seven-year<br />
interest rate swap agreements. Each swap agreement had a<br />
notional amount of $100.0 and was used to convert $200.0 of<br />
U.S. commercial paper into fixed-rate obligations with effective<br />
interest rates, prior to termination, of 6.48%.<br />
Average short-term interest rates, which include the effect of<br />
the interest rate swap agreements in 1998, were 5.4% and 5.7%<br />
for the years ended <strong>1999</strong> and 1998, respectively. The maximum<br />
amount of short-term debt at the end of any month was $261.4<br />
in <strong>1999</strong> and $893.3 in 1998. Average short-term, month-end<br />
borrowings were $171.9 in <strong>1999</strong> and $550.1 in 1998.<br />
The components of long-term debt were:<br />
Interest Rate Percentage December 25, <strong>1999</strong> December 26, 1998<br />
Fixed-rate notes payable<br />
Notes due in <strong>1999</strong> 2.21-2.28 $ .– $ 25.8<br />
Notes due in 2001 or 20111 6.15 100.0 100.0<br />
Notes due in 2001 or 20262 6.56 100.0 100.0<br />
Notes due in 20033 5.95 85.0 85.0<br />
Notes due in 2003 or 20131 6.38 100.0 100.0<br />
Notes due in 20044 6.75 200.0 200.0<br />
Notes due in 2005 or 20251 6.50 100.0 100.0<br />
Notes due in 20284 7.13 200.0 200.0<br />
All other fixed-rate notes<br />
Variable rate and other borrowings<br />
Various .– 7.0<br />
Promissory notes5 – .– 300.0<br />
Securitized trade receivables expiring in 2002 5.446 75.0 75.0<br />
Industrial Development Bonds due in 2015 5.156 8.5 8.5<br />
Other Various 9.5 11.1<br />
978.0 1,312.4<br />
Less current portion (1.0) (31.1)<br />
$977.0 $1,281.3<br />
1 Notes contain put/call options exercisable at 100% of par in 2001, 2003 and 2005 for the 6.15%, 6.38% and 6.50% notes, respectively. The company has also entered into remarketing<br />
agreements with respect to each of these issues, which allow the agent to call the debt from the holders on the option exercisable dates, and then remarket them. If this<br />
right is exercised the coupon rate paid by the company will reset to a rate higher than the then current market rate.<br />
2 Notes contain an option allowing the holder to put these notes back to the company in 2001; otherwise the notes mature in 2026.<br />
3 An interest rate swap agreement effectively converts this note to a floating-rate liability. At December 25, <strong>1999</strong>, the effective rate on these notes was 5.88%.<br />
4 The company, at its option, may call these notes at any time pursuant to a make-whole redemption provision, which would compensate holders for any changes in market value<br />
of the notes upon early extinguishment.<br />
5 At December 26, 1998, a long-term revolving credit agreement supported $300.0 short-term unsecured promissory notes which were classified as long-term debt.<br />
6 Represents rate at December 25, <strong>1999</strong>.
Interest rate swap agreements on long-term debt issues<br />
resulted in an increase in the long-term effective interest rate<br />
from 6.31% to 6.33% in <strong>1999</strong> and a reduction in 1998 longterm<br />
rates from 6.20% to 6.16%. Long-term borrowing<br />
maturities during the next five years are $1.0 in 2000; $9.0 in<br />
2001; $75.8 in 2002; $85.8 in 2003 and $199.8 in 2004. If all<br />
options on debt are exercised in future years, then $208.9 and<br />
$185.8 of long-term debt will be payable by the company in<br />
2001 and 2003, respectively.<br />
11. Operating Leases<br />
The company leases land, buildings, machinery and equipment<br />
under noncancelable operating leases. Total annual rental expense<br />
for <strong>1999</strong>, 1998 and 1997 amounted to $34.2, $34.5 and $26.2,<br />
respectively.<br />
Minimum future rental commitments having noncancelable<br />
lease terms in excess of one year aggregated $134.3 as of December<br />
See the future 37 <strong>Bausch</strong> & <strong>Lomb</strong><br />
25, <strong>1999</strong> and are payable as follows: 2000, $24.8; 2001, $21.8;<br />
2002, $67.7; 2003, $6.7; 2004, $4.1 and beyond, $9.1.<br />
The company leases an office facility under a seven-year<br />
operating lease, expiring in 2002, with an associated residual value<br />
guarantee in an amount not to exceed $54.6. During <strong>1999</strong>, net<br />
rental payments on the lease, included above, approximated $3.1.<br />
12. Employee Benefits<br />
The company’s benefit plans which in the aggregate cover<br />
substantially all U.S. employees and employees in certain other<br />
countries, consist of defined benefit pension plans, defined<br />
contribution plans and a participatory defined benefit postretirement<br />
plan.<br />
The information provided below pertains to the company’s<br />
defined benefit pension and postretirement plans. The following<br />
table provides reconciliations of the changes in benefit obligations,<br />
fair value of plan assets and funded status for the two-year<br />
period ending December 25, <strong>1999</strong>.<br />
Pension Benefit Plans Postretirement Benefit Plan<br />
<strong>1999</strong> 1998 <strong>1999</strong> 1998<br />
Reconciliation of benefit obligation<br />
Obligation at beginning of year $257.1 $214.0 $ 68.1 $ 75.5<br />
Service cost 9.8 9.2 1.2 1.3<br />
Interest cost 16.9 16.2 4.3 4.8<br />
Participant contributions (1.7) (1.6) .– .–<br />
Plan amendments .– 0.4 .– .–<br />
Divestitures/acquisitions (30.3) 0.8 .– .–<br />
Currency translation adjustments (2.8) 1.8 .– .–<br />
Curtailment gains (1.9) .– (1.4) .–<br />
Benefit payments (18.0) (14.6) (6.5) (6.3)<br />
Actuarial loss (gain) 5.2 30.9 (3.4) (7.2)<br />
Obligation at end of year $234.3 $257.1 $ 62.3 $ 68.1<br />
Reconciliation of fair value of plan assets<br />
Fair value of plan assets at beginning of year $236.5 $201.6 $ 39.3 $ 33.9<br />
Actual return on plan assets 46.5 38.4 10.4 11.7<br />
Divestitures/acquisitions (30.3) 0.1 .– .–<br />
Employer contributions 7.5 8.2 .– .–<br />
Participant contributions 1.7 1.6 .– .–<br />
Benefit payments (18.0) (14.6) (6.5) (6.3)<br />
Currency translation adjustments (2.9) 1.2 .– .–<br />
Fair value of plan assets at end of year $241.0 $236.5 $ 43.2 $ 39.3<br />
Reconciliation of funded status to net<br />
amount recognized on the balance sheet<br />
Funded status at end of year $ 6.7 $ (20.6) $(19.1) $(28.8)<br />
Unrecognized transition (asset) obligation (7.6) 3.5 .– .–<br />
Unrecognized prior-service cost 10.0 11.6 (1.2) (1.3)<br />
Unrecognized actuarial gain (10.9) (0.9) (46.5) (45.8)<br />
Net amount recognized $ (1.8) $ (6.4) $(66.8) $(75.9)
The plan assets shown above for the pension benefit plans include 52,800 shares of the company’s Common stock. In <strong>1999</strong>, three plans<br />
were sold as part of the biomedical divestiture, and in 1998, one plan was acquired with the purchase of the surgical businesses.<br />
The following table provides information related to underfunded pension plans:<br />
See the future 38 <strong>Bausch</strong> & <strong>Lomb</strong><br />
<strong>1999</strong> 1998<br />
Projected benefit obligation $13.9 $25.0<br />
Accumulated benefit obligation 11.4 20.9<br />
Fair value of plan assets 0.1 1.8<br />
The company’s postretirement benefit plan was underfunded for each of the past two years.<br />
The following table provides the amounts recognized in the balance sheet as of the end of each year:<br />
Pension Benefit Plans Postretirement Benefit Plan<br />
<strong>1999</strong> 1998 <strong>1999</strong> 1998<br />
Prepaid benefit cost $ 9.8 $ 13.6 $ .– $ .–<br />
Accrued benefit liability (11.6) (20.0) (66.8) (75.9)<br />
Net amount recognized $ (1.8) $ (6.4) $(66.8) $(75.9)<br />
The following table provides the components of net periodic benefit cost for the plans for fiscal years <strong>1999</strong>, 1998 and 1997:<br />
Pension Benefit Plans Postretirement Benefit Plan<br />
<strong>1999</strong> 1998 1997 <strong>1999</strong> 1998 1997<br />
Service cost $ 9.8 $ 9.2 $ 8.3 $ 1.2 $ 1.3 $ 1.2<br />
Interest cost 17.0 16.2 14.7 4.3 4.8 4.9<br />
Expected return on plan assets (21.1) (18.9) (16.8) (3.5) (3.0) (2.6)<br />
Amortization of transition obligation 0.7 0.7 0.7 .– .– .–<br />
Amortization of prior-service cost 1.7 1.8 1.8 (0.2) (0.1) (0.2)<br />
Amortization of net gain (0.4) (0.3) (0.2) (3.0) (2.7) (2.6)<br />
Net periodic benefit cost 7.7 8.7 8.5 (1.2) 0.3 0.7<br />
Curtailment loss (gain) 2.2 .– .– (1.4) .– (1.0)<br />
Net periodic benefit cost after curtailments $ 9.9 $ 8.7 $ 8.5 $(2.6) $ 0.3 $(0.3)<br />
The 1997 curtailment resulted from several plant closings that occurred as part of restructuring initiatives. In <strong>1999</strong>, the curtailment was<br />
related to the divestiture of the sunglass business.<br />
Key assumptions used to measure benefit obligations in the company’s benefit plans are shown in the following table:<br />
<strong>1999</strong> 1998<br />
Weighted Average Assumptions<br />
Discount rate 7.2% 6.8%<br />
Expected return on plan assets 7.8% 8.6%<br />
Rate of compensation increase 4.6% 4.3%
For amounts pertaining to postretirement benefits, a 6.75% annual rate of increase in the per capita cost of covered health care<br />
benefits was assumed for <strong>1999</strong>. This rate is assumed to decrease to 5.5% in the year 2000 and remain constant thereafter. To demonstrate<br />
the significance of this rate on the expense reported, a one percentage point change in the assumed health care cost trend rate would have<br />
the following effect:<br />
The costs associated with defined contribution plans totaled $11.9, $12.0 and $8.4 for <strong>1999</strong>, 1998 and 1997, respectively.<br />
13. Minority Interest<br />
In 1993, four wholly-owned subsidiaries of the company contributed<br />
operating and financial assets to a limited partnership for<br />
an aggregate 72% in general and limited partnership interests.<br />
The partnership is a separate legal entity from the company which<br />
owns and manages a portfolio of assets. Those assets included portions<br />
of the company’s former biomedical operations and certain<br />
assets used for the manufacture and sale of RGP contact lenses<br />
and RGP lens care products. During <strong>1999</strong>, the partnership was<br />
restructured and no longer includes assets of these businesses.<br />
Partnership assets continue to include cash and cash equivalents,<br />
a long-term note from a consolidated subsidiary of the company,<br />
and floating-rate demand notes from another consolidated subsidiary<br />
of the company. For the company’s consolidated financial<br />
statements, the long-term note and the floating-rate demand<br />
See the future 39 <strong>Bausch</strong> & <strong>Lomb</strong><br />
notes are eliminated while the outside investor’s interest in the<br />
partnership is recorded as minority interest.<br />
In <strong>1999</strong>, the original outside investor sold its interest in the<br />
partnership and was replaced by an investment banking firm.<br />
The outside investors’ limited partnership interest in the partnership<br />
has been recorded as minority interest totaling $200.0 at<br />
December 25, <strong>1999</strong> and $403.2 at December 26, 1998.<br />
14. Financial Instruments<br />
1% Increase 1% Decrease<br />
Effect on total service and interest cost components of net periodic<br />
postretirement health care benefit cost $0.6 $(0.6)<br />
Effect on the health care component of the accumulated postretirement<br />
benefit obligation $6.1 $(5.1)<br />
The carrying amount of cash, cash equivalents, current portion of<br />
long-term investments and notes payable approximated fair value<br />
because maturities are less than one year in duration. The company’s<br />
remaining financial instruments consisted of the following:<br />
December 25, <strong>1999</strong> December 26, 1998<br />
Carrying Fair Carrying Fair<br />
Value Value Value Value<br />
Nonderivatives<br />
Other investments $ 173.8 $ 173.8 $ 249.2 $ 249.2<br />
Long-term debt, including current portion (978.0) (922.6) (1,312.4) (1,319.2)<br />
Derivatives held for purposes<br />
other than trading<br />
Foreign exchange instruments<br />
Other current assets $ 14.2 $ 7.6<br />
Accrued liabilities (10.4) (15.7)<br />
Net foreign exchange instruments<br />
Interest rate instruments<br />
$ 3.8 $ (7.3) $ (8.1) $ (8.3)<br />
Other current assets $ 21.9 $ 22.1<br />
Accrued liabilities (10.2) (15.2)<br />
Net interest rate instruments $ 11.7 $ 40.7 $ 6.9 $ 14.9
Fair value of other investments was determined based on<br />
contract terms and an evaluation of expected cash flows and<br />
investment risk. Fair value for long-term debt was estimated using<br />
either quoted market prices for the same or similar issues or the<br />
current rates offered to the company for debt with similar maturities.<br />
The fair value for foreign exchange and interest rate<br />
instruments was determined using a model that estimates fair<br />
value at market rates, or was based upon quoted market prices for<br />
similar instruments with similar maturities.<br />
The company, as a result of its global operating and financing<br />
activities, is exposed to changes in interest rates and foreign<br />
currency exchange rates that may adversely affect its results of<br />
operations and financial position. In seeking to minimize the<br />
risks and/or costs associated with such activities, the company<br />
manages exposures to changes in interest rates and foreign<br />
currency exchange rates by entering into derivative contracts.<br />
The company does not generally use financial instruments for<br />
trading or other speculative purposes, nor does it use leveraged<br />
financial instruments.<br />
The company enters into foreign exchange forward<br />
contracts primarily to hedge foreign currency transactions and<br />
equity investments in non-U.S. subsidiaries. At December 25,<br />
<strong>1999</strong> and December 26, 1998, the company hedged aggregate<br />
exposures of $874.6 and $1,063.0, respectively, by entering into<br />
forward exchange contracts requiring the purchase and sale of<br />
U.S. and foreign currencies. The company selectively hedges firm<br />
commitments that represent both a right and an obligation,<br />
mainly for committed purchase orders for foreign-sourced inventory.<br />
In general, the forward exchange contracts have varying<br />
maturities up to, but not exceeding, two years with cash settlements<br />
made at maturity based upon rates agreed to at contract<br />
inception. At December 25, <strong>1999</strong> and December 26, 1998, the<br />
The total number of shares available for grant in each calendar<br />
year, excluding incentive stock options, shall be no greater than<br />
three percent of the total number of outstanding shares of<br />
Common stock as of the first day of each such year. No more than<br />
six million shares are available for granting purposes as incentive<br />
stock options under the company’s current plan. As of December<br />
25, <strong>1999</strong>, 2.5 million shares remain available for such grants.<br />
See the future 40 <strong>Bausch</strong> & <strong>Lomb</strong><br />
company deferred gains of less than $0.5 relating to hedged<br />
firm commitments.<br />
The company’s exposure to changes in interest rates results<br />
from investing and borrowing activities. The company may enter<br />
into interest rate swap and cap agreements to effectively limit<br />
exposure to interest rate movements within the parameters of its<br />
interest rate hedging policy. At December 25, <strong>1999</strong> and<br />
December 26, 1998, the company was party to swap contracts<br />
that had aggregate notional amounts of $295.4 and $869.5,<br />
respectively. At year end <strong>1999</strong> and 1998, the company had an<br />
outstanding interest rate cap with a notional amount of NLG<br />
15.5 million that protects the company from exposures to rising<br />
NLG interest rates.<br />
Counterparties to the financial instruments discussed above<br />
expose the company to credit risks to the extent of non-performance.<br />
The credit ratings of the counterparties, which consist of a<br />
diversified group of major financial institutions, are regularly<br />
monitored and thus credit loss arising from counterparty nonperformance<br />
is not anticipated.<br />
15. Stock Compensation Plans<br />
The company sponsors several stock-based compensation plans,<br />
all of which are accounted for under the provisions of APB<br />
Opinion No. 25, Accounting for Stock Issued to Employees.<br />
Accordingly, no compensation cost has been recognized for the<br />
company’s fixed stock option plans or its employee stock purchase<br />
plan. Had compensation expense for the company’s fixed options<br />
been determined consistent with SFAS 123, Accounting for Stock-<br />
Based Compensation, the company’s net earnings and earnings<br />
per share would have been reduced to the pro forma amounts<br />
indicated below:<br />
Net Earnings Basic Earnings Per Share Diluted Earnings Per Share<br />
As <strong>Report</strong>ed Pro Forma As <strong>Report</strong>ed Pro Forma As <strong>Report</strong>ed Pro Forma<br />
<strong>1999</strong> $444.8 $433.9 $7.76 $7.57 $7.59 $7.40<br />
1998 25.2 16.5 0.45 0.30 0.45 0.29<br />
1997 49.4 43.5 0.89 0.79 0.89 0.79<br />
Stock Options<br />
The company issues stock options which vest ratably over three<br />
years and expire ten years from the grant date. Vesting is contingent<br />
upon continued employment with the company.<br />
For purposes of this disclosure, the fair value of each fixed<br />
option grant was estimated on the date of grant using the Black-<br />
Scholes option-pricing model with the following weighted<br />
average assumptions used for grants outstanding in <strong>1999</strong>, 1998<br />
and 1997:
See the future 41 <strong>Bausch</strong> & <strong>Lomb</strong><br />
<strong>1999</strong> 1998 1997<br />
Risk-free interest rate 6.22% 4.69% 5.66%<br />
Dividend yield 1.96% 2.48% 2.54%<br />
Volatility factor 31.06% 25.67% 25.17%<br />
Weighted average expected life (years) 3 4 5<br />
The weighted average value of options granted was $18.11, $10.93 and $10.59 in <strong>1999</strong>, 1998 and 1997, respectively.<br />
A summary of the status of the company’s fixed stock option plans at year-end <strong>1999</strong>, 1998 and 1997 is presented below:<br />
<strong>1999</strong> 1998 1997<br />
Weighted Weighted Weighted<br />
Number Of Average Number Of Average Exercise Number Of Average Exercise<br />
Shares Exercise Price Shares Price Shares Price<br />
(000s) (Per Share) (000s) (Per Share) (000s) (Per Share)<br />
Outstanding at beginning<br />
of year 5,050 $43.98 5,186 $41.00 5,030 $39.90<br />
Granted 1,185 72.85 1,400 50.64 1,176 42.32<br />
Exercised (1,444) 42.97 (1,265) 39.45 (432) 30.34<br />
Forfeited (413) 48.66 (271) 41.48 (588) 41.99<br />
Outstanding at year end 4,378 $51.69 5,050 $43.98 5,186 $41.00<br />
Options exercisable at<br />
year end 2,451 2,735 3,065<br />
The following represents additional information about fixed stock options outstanding at December 25, <strong>1999</strong>:<br />
Options Outstanding Options Exercisable<br />
Weighted Average Weighted Weighted<br />
Range Of Number Remaining Average Exercise Number Average<br />
Exercise Prices Outstanding Contractual Life Price Exercisable Exercise Price<br />
Per Share (000s) (Years) (Per Share) (000s) (Per Share)<br />
$26.00 to 35.49 465 5.6 $35.13 462 $35.13<br />
35.50 to 45.49 1,398 6.3 41.12 1,155 40.83<br />
45.50 to 55.49 1,351 6.8 50.09 822 49.55<br />
55.50 to 65.49 14 9.9 63.12 – .–<br />
65.50 to 75.00 1,150 9.6 72.97 12 72.97<br />
4,378 7.3 $51.69 2,451 $42.84<br />
Stock Awards<br />
The company issues restricted stock awards to directors, officers<br />
and other key personnel. These awards have vesting periods up<br />
to three years with vesting criteria based upon the attainment of<br />
certain Economic Value Added (EVA) targets and continued<br />
employment until applicable vesting dates. EVA is defined by the<br />
company as net operating profit after tax less a capital charge<br />
calculated as average capital employed multiplied by the company’s<br />
cost of capital. EVA is not the same as, nor is it intended to be,<br />
a measure of operating performance in accordance with generally<br />
accepted accounting principles.<br />
Compensation expense is recorded based on applicable vesting<br />
criteria and, for those awards with performance goals, as such<br />
goals are met. In <strong>1999</strong>, 1998 and 1997, 90,050, 259,905 and<br />
61,600 of such awards were granted at weighted average market<br />
values of $63.41, $46.14 and $41.92 per share, respectively. The<br />
compensation expense relating to stock awards in <strong>1999</strong>, 1998 and<br />
1997 was $8.0, $10.6 and $3.3, respectively.
16. Litigation<br />
In its 1998 <strong>Annual</strong> <strong>Report</strong>, the company discussed a class action<br />
lawsuit pending before a New York State Supreme Court, alleging<br />
that the company misled consumers in its marketing and sale of<br />
Sensitive Eyes Rewetting Drops, Boston Rewetting Drops, ReNu<br />
Rewetting Drops and <strong>Bausch</strong> & <strong>Lomb</strong> Eyewash. The plaintiffs had<br />
appealed the dismissal of all of their claims by the trial court. On<br />
September 16, <strong>1999</strong>, the New York Appellate Division, First<br />
Department, reversed the trial court’s ruling, reinstating the plaintiffs’<br />
claims. The company has moved to decertify the matter as a<br />
class action.<br />
In several actions, the company is defending its long-standing<br />
policy of selling contact lenses only to licensed professionals<br />
against claims that it was adopted in conspiracy with others to<br />
eliminate alternative channels of trade from the disposable contact<br />
lens market. These matters include (i) a consolidated action in the<br />
United States District Court for the Middle District of Florida<br />
filed in June 1994 by the Florida Attorney General, and now<br />
includes claims by the attorneys general for 21 other states, and<br />
(ii) individual actions pending in California and Tennessee state<br />
courts. The company defends its policy as a lawfully adopted<br />
means of ensuring effective distribution of its products and safeguarding<br />
consumers’ health.<br />
Net Gross Net Earnings (Loss) Per Share<br />
Sales 8 Profit 8 Income (Loss) Basic Diluted<br />
<strong>1999</strong><br />
First $ 389.9 $ 227.4 $ 22.4 $ 0.39 $ 0.39<br />
Second 453.3 275.9 173.4 1 3.03 2.94 1<br />
Third 446.3 270.0 231.8 2 4.03 3.94 2<br />
Fourth 466.6 276.5 17.2 3 0.30 0.29 3<br />
$1,756.1 $1,049.8 $444.8 $ 7.76 $ 7.59<br />
1998<br />
First $ 357.6 $ 191.1 $ (23.2) 4,5 $(0.42) $(0.42) 4,5<br />
Second 408.3 229.9 55.3 4,6 0.99 0.98 4,6<br />
Third 403.1 246.0 36.2 0.65 0.64<br />
Fourth 428.5 268.3 (43.1) 7 (0.77) (0.77) 7<br />
$1,597.5 $ 935.3 $ 25.2 $ 0.45 $ 0.45<br />
1 Includes the after-tax gain on sale of the sunglass business of $126.3 ($2.14 per share).<br />
2 Includes the after-tax gain on sale of the biomedical and the hearing aid businesses totaling $181.8 ($3.09 per share).<br />
3 Includes the after-tax effect of restructuring charges that reduced net income by $34.2 ($0.59 per share).<br />
4 Includes the after-tax effect of restructuring charges of $2.4 ($0.04 per share) and $5.1 ($0.09 per share) for the first and second quarters of 1998, respectively.<br />
5 Includes the after-tax write-off of purchased IPR&D of $24.6 ($0.44 per share).<br />
6 Includes the after-tax gain on sale of the skin care business of $33.0 ($0.58 per share).<br />
7 Includes an impairment charge of $85.0 ($1.51 per share) recorded by the company's divested hearing aid business.<br />
8 Previously reported amounts for the first quarter of <strong>1999</strong> and for each quarter of 1998 included sales from the divested sunglass and healthcare businesses. Previously reported<br />
amounts were as follows: first quarter 1998 (net sales, $553.1; gross profit, $277.0); second quarter 1998 (net sales, $635.1; gross profit, $336.8); third quarter 1998 (net sales,<br />
$575.6; gross profit, $317.4); fourth quarter 1998 (net sales, $599.0; gross profit, $338.5) and first quarter <strong>1999</strong> (net sales, $574.4; gross profit, $307.5).<br />
See the future 42 <strong>Bausch</strong> & <strong>Lomb</strong><br />
17. Subsequent Event<br />
On January 27, 2000, the company announced that it had settled<br />
a lawsuit with Alcon Laboratories, Inc. (Alcon). The settlement<br />
relates to a patent infringement case that the company filed<br />
against Alcon in October 1994 for a patent related to enzymatic<br />
cleaning of contact lenses.<br />
Under the terms of the settlement agreement, Alcon made<br />
an up-front payment to the company of $25 to resolve all issues<br />
relative to the company’s claims filed against them, which amount<br />
will be recorded as income in the first quarter of 2000.<br />
Additionally, Alcon will pay to the company a royalty stream<br />
over the next eight years, the present value of which approximates<br />
$49. This royalty stream compensates the company for Alcon’s<br />
future use of a worldwide license under the company’s patent for<br />
the simultaneous use of chemical disinfecting solutions with an<br />
enzyme cleaning product for contact lens care.<br />
18. Quarterly Results, Stock Prices And<br />
Selected Financial Data<br />
Quarterly Results (unaudited)<br />
The following table presents reported net sales, gross profit (net<br />
sales less cost of products sold), net income (loss) and earnings<br />
(loss) per share for each quarter during the past two years. Net<br />
sales and gross profit are from continuing operations and are<br />
reported on the same basis as amounts in the accompanying<br />
Statements of Income on page 19.
Quarterly Stock Prices (unaudited)<br />
The company’s Common stock is listed on the New York Stock Exchange and is traded under the symbol BOL. There were approximately<br />
7,000 and 7,200 Common shareholders of record at year-end <strong>1999</strong> and 1998, respectively. The following table shows the price range of the<br />
Common stock for each quarter for the past two years:<br />
<strong>1999</strong> 1998<br />
Price Per Share Price Per Share<br />
High Low High Low<br />
First $66 7 ⁄8 $56 5 ⁄16 $46 1 ⁄4 $37 3 ⁄4<br />
Second 83 3 ⁄8 61 52 11 ⁄16 45 1 ⁄4<br />
Third 78 5 ⁄8 61 1 ⁄2 52 3 ⁄4 38 11 ⁄16<br />
Fourth 69 1 ⁄16 52 5 ⁄8 59 3 ⁄8 38 1 ⁄16<br />
Selected Financial Data (unaudited)<br />
<strong>1999</strong> 1998 1997 1996 1995 1994<br />
Results For The Year<br />
Net sales 1 $1,756.1 $1,597.5 $1,108.7 $1,066.6 $1,003.2 $ 899.0<br />
Income from continuing operations 1 102.7 55.6 62.0 63.5 45.9 59.6<br />
Net income 444.8 25.2 49.4 83.1 112.0 31.1<br />
Continuing operations –<br />
basic earnings per share 1 1.79 1.00 1.12 1.13 0.80 1.01<br />
Net income – basic earnings per share 7.76 0.45 0.89 1.48 1.94 0.53<br />
Continuing operations –<br />
diluted earnings per share 1 1.75 0.99 1.12 1.12 0.79 1.00<br />
Net income – diluted earnings per share 7.59 0.45 0.89 1.47 1.93 0.52<br />
Dividends per share 1.04 1.04 1.04 1.04 1.01 0.96<br />
Year End Position<br />
Working capital $1,190.7 $ 774.4 $ 202.9 $ 18.5 $ 70.9 $ 277.4<br />
Total assets 3,273.5 3,491.7 2,772.9 2,603.4 2,550.1 2,457.7<br />
Short-term debt 46.9 191.5 343.8 482.1 383.5 300.6<br />
Long-term debt 977.0 1,281.3 510.8 236.3 191.0 289.5<br />
Shareholders’ equity 1,234.0 845.0 818.4 881.9 929.3 914.4<br />
Other Ratios And Statistics<br />
Return on sales for continuing operations 5.8% 3.5% 5.6% 6.0% 4.6% 6.6%<br />
Return on average shareholders’ equity 43.3% 3.1% 5.9% 9.2% 11.9% 3.2%<br />
Return on invested capital 21.7% 3.8% 5.0% 7.2% 9.3% 3.8%<br />
Return on average total assets 13.1% 0.7% 1.8% 3.1% 4.5% 1.2%<br />
Effective income tax rate for<br />
continuing operations 36.0% 35.2% 38.1% 38.7% 36.5% 31.9%<br />
Current ratio 2.9 2.0 1.2 1.0 1.1 1.4<br />
Total debt to shareholders’ equity 83.0% 174.3% 104.4% 81.5% 61.8% 64.5%<br />
Total debt to capital 45.3% 63.5% 51.1% 44.9% 38.2% 39.2%<br />
Capital expenditures $ 155.9 $ 201.5 $ 126.1 $ 130.3 $ 95.5 $ 84.8<br />
1 Amounts have been modified or added, as necessary, to reflect the divestitures described in Note 3 – Discontinued Operations and Note 2 – Acquisitions.<br />
See the future 43 <strong>Bausch</strong> & <strong>Lomb</strong>
<strong>Report</strong> Of Management<br />
The preceding financial statements of <strong>Bausch</strong> & <strong>Lomb</strong> Incorporated were prepared by the company’s management, which is responsible for<br />
their reliability and objectivity. The statements have been prepared in conformity with generally accepted accounting principles and, as such,<br />
include amounts based on informed estimates and judgments of management with consideration given to materiality. Financial information<br />
elsewhere in this annual report is consistent with that in the financial statements.<br />
Management is further responsible for maintaining a system of internal controls to provide reasonable assurance that <strong>Bausch</strong> & <strong>Lomb</strong>’s<br />
books and records reflect the transactions of the company; that assets are safeguarded; and that management’s established policies and<br />
procedures are followed. Management systematically reviews and modifies the system of internal controls to improve its effectiveness.<br />
The internal control system is augmented by the communication of accounting and business policies throughout the company; the careful<br />
selection, training and development of qualified personnel; the delegation of authority and establishment of responsibilities; and a comprehensive<br />
program of internal audit.<br />
Independent accountants are engaged to audit the financial statements of the company and issue a report thereon. They have informed<br />
management and the audit committee of the board of directors that their audits were conducted in accordance with generally accepted<br />
auditing standards, which require a review and evaluation of internal controls to determine the nature, timing and extent of audit testing.<br />
The recommendations of the internal auditors and independent accountants are reviewed by management. Control procedures have<br />
been implemented or revised as appropriate to respond to these recommendations. In management’s opinion, as of December 25, <strong>1999</strong>, the<br />
internal control system was functioning effectively and accomplished the objectives discussed herein.<br />
William M. Carpenter Stephen C. McCluski<br />
Chairman and Chief Executive Officer Senior Vice President and Chief Financial Officer<br />
<strong>Report</strong> Of The Audit Committee<br />
The audit committee of the board of directors, which held three meetings during <strong>1999</strong>, is composed of five outside directors. The chair of<br />
the committee is Alvin W. Trivelpiece, Ph.D. The other members are Franklin E. Agnew, Domenico De Sole, Ruth R. McMullin and Linda<br />
Johnson Rice.<br />
The audit committee meets with the independent accountants, management and the internal auditors to provide reasonable assurance<br />
that management fulfills its responsibilities in the preparation of the financial statements and in the maintenance of an effective system of<br />
internal controls. The audit committee reviews the performance and fees of the independent accountants, recommends their appointment<br />
and meets with them and the internal auditors, with and without management present, to discuss the scope and results of their audit work.<br />
Both the independent accountants and the internal auditors have full access to the audit committee.<br />
Alvin W. Trivelpiece, Ph.D.<br />
Chair, Audit Committee<br />
See the future 44 <strong>Bausch</strong> & <strong>Lomb</strong>
<strong>Report</strong> Of Independent Accountants<br />
To the Shareholders and Board of Directors of <strong>Bausch</strong> & <strong>Lomb</strong> Incorporated:<br />
In our opinion, the accompanying consolidated balance sheets and the related consolidated statements of income, cash flows and changes<br />
in shareholders’ equity present fairly, in all material respects, the financial position of <strong>Bausch</strong> & <strong>Lomb</strong> Incorporated and its subsidiaries at<br />
December 25, <strong>1999</strong> and December 26, 1998, and the results of their operations and their cash flows for each of the three years in the period<br />
ended December 25, <strong>1999</strong> in conformity with accounting principles generally accepted in the United States. These financial statements are<br />
the responsibility of the company’s management; our responsibility is to express an opinion on these financial statements based on our audits.<br />
We conducted our audits of these statements in accordance with auditing standards generally accepted in the United States, which require<br />
that we plan and perform the audit to obtain reasonable assurance about whether the financial statements are free of material misstatement.<br />
An audit includes examining, on a test basis, evidence supporting the amounts and disclosures in the financial statements, assessing the<br />
accounting principles used and significant estimates made by management, and evaluating the overall financial statement presentation.<br />
We believe that our audits provide a reasonable basis for the opinion expressed above.<br />
Rochester, New York<br />
January 25, 2000<br />
See the future 45 <strong>Bausch</strong> & <strong>Lomb</strong>
Directors<br />
William M. Carpenter (1)<br />
Chairman and Chief Executive Officer<br />
<strong>Bausch</strong> & <strong>Lomb</strong><br />
Director since 1996<br />
Franklin E. Agnew (1)(2)(3)<br />
Business Consultant<br />
Pittsburgh, Pennsylvania<br />
Director since 1982<br />
Domenico De Sole (2)<br />
President and Chief Executive Officer<br />
Gucci Group N.V.<br />
London, United Kingdom<br />
Director since 1996<br />
Jonathan S. Linen (3)(4)<br />
Vice Chairman<br />
American Express Company<br />
New York, New York<br />
Director since 1996<br />
Officers<br />
William M. Carpenter<br />
Chairman and Chief Executive Officer<br />
5 years of service with the company<br />
Named to current position: 1/99<br />
Carl E. Sassano<br />
President and Chief Operating Officer<br />
27 years of service with the company<br />
Named to current position: 1/99<br />
Senior Vice Presidents<br />
Daryl M. Dickson<br />
Human Resources<br />
4 years of service with the company<br />
Named to current position: 11/96<br />
Hakan S. Edstrom<br />
Global Surgical<br />
2 years of service with the company<br />
Named to current position: 10/99<br />
Dwain L. Hahs<br />
Global Vision Care<br />
23 years of service with the company<br />
Named to current position: 10/99<br />
Stephen C. McCluski<br />
Chief Financial Officer<br />
12 years of service with the company<br />
Named to current position: 1/95<br />
Ruth R. McMullin (2)<br />
Chairperson<br />
Eagle-Picher Personal Injury<br />
Settlement Trust<br />
Savannah, Georgia<br />
Director since 1987<br />
John R. Purcell (1)(4)<br />
Chairman and Chief Executive Officer<br />
Grenadier Associates Ltd.<br />
Juno Beach, Florida<br />
Director since 1976<br />
Linda Johnson Rice (2)<br />
President and Chief Operating Officer<br />
Johnson Publishing Company Inc.<br />
Chicago, Illinois<br />
Director since 1990<br />
Thomas M. Riedhammer, Ph.D.<br />
Global Pharmaceuticals and<br />
Chief Technical Officer<br />
18 years of service with the company<br />
Named to current position: 10/99<br />
Robert B. Stiles<br />
General Counsel<br />
19 years of service with the company<br />
Named to current position: 6/97<br />
Vice Presidents<br />
Gary M. Aron<br />
Scientific Affairs –Vision Care/Surgical<br />
5 years of service with the company<br />
Named to current position: 12/99<br />
Alan P. Dozier<br />
North American Vision Care<br />
15 years of service with the company<br />
Named to current position: 2/97<br />
Alan H. Farnsworth<br />
Business Development<br />
12 years of service with the company<br />
Named to current position: 7/97<br />
Geoffrey F. Ide<br />
Japan<br />
12 years of service with the company<br />
Named to current position: 6/99<br />
See the future 46 <strong>Bausch</strong> & <strong>Lomb</strong><br />
Alvin W. Trivelpiece, Ph.D. (2)(4)<br />
Director<br />
Oak Ridge National Laboratory and<br />
President<br />
Lockheed Martin Energy<br />
Research Corporation<br />
Oak Ridge, Tennessee<br />
Director since 1989<br />
William H. Waltrip (1)<br />
Chairman of the Board<br />
Technology Solutions Company<br />
Chicago, Illinois<br />
Director since 1985<br />
Kenneth L. Wolfe (1)(3)<br />
Chairman of the Board and<br />
Chief Executive Officer<br />
Hershey Foods Corporation<br />
Hershey, Pennsylvania<br />
Director since 1989<br />
David F. Jarosz<br />
North American Pharmaceuticals<br />
14 years of service with the company<br />
Named to current position: 7/99<br />
Barbara M. Kelley<br />
Corporate Communications<br />
17 years of service with the company<br />
Named to current position: 4/93<br />
Jurij Z. Kushner<br />
Controller<br />
19 years of service with the company<br />
Named to current position: 1/95<br />
Thomas W. Lance<br />
Global Operations –Vision Care<br />
3 years of service with the company<br />
Named to current position: 7/97<br />
Paul A. Lopez<br />
North American Surgical<br />
2 years of service with the company<br />
Named to current position: 7/99<br />
John M. Loughlin<br />
Asia<br />
19 years of service with the company<br />
Named to current position: 7/97<br />
Committee Memberships:<br />
1 Executive Committee<br />
2 Audit Committee<br />
3 Committee on Management<br />
4 Committee on Directors<br />
James F. Milton<br />
Latin America<br />
29 years of service with the company<br />
Named to current position: 6/99<br />
Angela J. Panzarella<br />
Investor Relations<br />
11 years of service with the company<br />
Named to current position: 7/97<br />
Alan H. Resnick<br />
Treasurer<br />
27 years of service with the company<br />
Named to current position: 5/86<br />
Mark M. Sieczkarek<br />
Europe, Middle East and Africa<br />
5 years of service with the company<br />
Named to current position: 10/99<br />
David A. Souerwine<br />
General Eye Care<br />
17 years of service with the company<br />
Named to current position: 1/00<br />
Secretary<br />
Jean F. Geisel<br />
24 years of service with the company<br />
Named to current position: 7/97
Corporate Information<br />
Internet Address:<br />
Corporate, product, financial and shareholder information,<br />
including news releases, financial filings and stock quotes are<br />
available at <strong>Bausch</strong> & <strong>Lomb</strong>’s web site:<br />
www.bausch.com<br />
Corporate Headquarters:<br />
One <strong>Bausch</strong> & <strong>Lomb</strong> Place<br />
Rochester, New York 14604<br />
(716) 338-6000<br />
(800) 344-8815<br />
News on Demand:<br />
<strong>Bausch</strong> & <strong>Lomb</strong>’s news releases are available toll-free by calling:<br />
(888) 329-1096<br />
Financial Literature:<br />
Copies of <strong>Bausch</strong> & <strong>Lomb</strong>’s annual reports and financial reports filed<br />
with the Securities and Exchange Commission, including its Form<br />
10-K, are available on our website, by mail (attn: Investor Relations)<br />
or by calling:<br />
(888) 884-8702<br />
(716) 338-5757<br />
Investor Relations:<br />
Security analysts and shareholders seeking information concerning<br />
company operations, shareholder programs or dividend policy<br />
may contact:<br />
Angela J. Panzarella<br />
Vice President, Investor Relations<br />
(716) 338-6025<br />
Angela_J_Panzarella@bausch.com<br />
Media Inquiries:<br />
News media representatives and others seeking general information<br />
may contact:<br />
Holly Houston<br />
Director, Media Relations<br />
(716) 338-8064<br />
Holly_Houston@bausch.com<br />
Transfer Agent:<br />
Shareholders seeking information regarding their individual accounts<br />
or dividend payments may contact our stock transfer agent:<br />
ChaseMellon Shareholder Services<br />
P.O. Box 3315<br />
South Hackensack, New Jersey 07606<br />
(800) 288-9541<br />
www.chasemellon.com<br />
Total recycled fiber content of not less than 50%<br />
Dividend Reinvestment Plan:<br />
The plan is available to all shareholders of <strong>Bausch</strong> & <strong>Lomb</strong> stock.<br />
Under the plan, shareholders may elect to have their cash dividends<br />
automatically invested in additional shares of the company’s common<br />
stock. Shareholders may also elect to make cash contributions of up<br />
to $60,000 per year to purchase additional shares. For additional<br />
information contact:<br />
Mellon Bank, N.A.<br />
Investment Services<br />
P.O. Box 3339<br />
South Hackensack, New Jersey 07606<br />
(800) 288-9541<br />
www.chasemellon.com<br />
Stock Listing:<br />
The common stock of the corporation is traded under the symbol<br />
BOL on the New York Stock Exchange. Options on the company’s<br />
common stock are traded on the American Stock Exchange.<br />
Trademarks:<br />
The trademarks of <strong>Bausch</strong> & <strong>Lomb</strong> Incorporated and its subsidiary<br />
companies referred to in this report are:<br />
Aberrometer<br />
Alrex<br />
AMVISC<br />
AMVISC Plus<br />
<strong>Bausch</strong> & <strong>Lomb</strong><br />
Boston<br />
Boston EO<br />
Catarex<br />
Hansatome<br />
Design: Richard Uccello, Andrew Wessels<br />
Ted Bertz Graphic Design<br />
Middletown, Connecticut<br />
Printing: Finlay Brothers Printing<br />
Bloomfield, Connecticut<br />
Executive Portrait: Ted Kawalerski<br />
New York, New York<br />
©2000 <strong>Bausch</strong> & <strong>Lomb</strong> Incorporated<br />
All Rights Reserved Worldwide<br />
Medalist<br />
Millennium<br />
MPORT<br />
MPORT SI<br />
Ocuvite<br />
Ocuvite Extra<br />
Opcon-A<br />
Orbscan<br />
Orbscan II<br />
Passport<br />
PureVision<br />
ReNu<br />
ReNu MultiPlus<br />
SofLens<br />
SofLens66<br />
Soflex<br />
Technolas 217<br />
Vitrasert<br />
EVA is a trademark of Stern Stewart & Co.<br />
Lotemax is a trademark of Pharmos Corporation<br />
Polytrim is a trademark of Allergan, Inc.<br />
Surodex is a trademark of Oculex Pharmaceuticals, Inc.