Appendix K - BC Hydro - Transmission
Appendix K - BC Hydro - Transmission
Appendix K - BC Hydro - Transmission

Create successful ePaper yourself
Turn your PDF publications into a flip-book with our unique Google optimized e-Paper software.
Environmental Assessment Certificate Application – May 2006<br />
Vancouver Island <strong>Transmission</strong> Reinforcement Project<br />
<strong>Appendix</strong> K<br />
<br />
<br />
<br />
<br />
<br />
<br />
<br />
<br />
<br />
<br />
Atmospheric and Underwater Acoustics Assessment Report<br />
JASCO Research Ltd. 2006. Vancouver Island <strong>Transmission</strong> Reinforcement Project:<br />
Atmospheric and Underwater Acoustics Assessment Report.prepared for British<br />
Columbia <strong>Transmission</strong> Corporation 49 pp.
BRITISH COLUMBIA TRANSMISSION CORPORATION<br />
VANCOUVER ISLAND TRANSMISSION REINFORCEMENT PROJECT<br />
Atmospheric and Underwater Acoustics Assessment Report<br />
Prepared by:<br />
Melanie Austin<br />
Alex MacGillivray<br />
Roberto Racca<br />
David Hannay<br />
Holly Sneddon<br />
March 14, 2006
Prepared by:<br />
Suite #2101 – 4464 Markham Street<br />
Victoria, <strong>BC</strong> V8Z 7X8<br />
Phone: +1.250.483.3300<br />
Facsimile: +1.250.483.3301<br />
Email: info@jasco.com<br />
Web: www.jasco.com<br />
SUBMITTED TO:<br />
Attention: Ward Prystay<br />
Jacques Whitford Limited<br />
5 th Floor – 4370 Dominion Street<br />
Burnaby, <strong>BC</strong> V5G 4L7
JASCO Research Ltd <strong>BC</strong>TC VITR Project 2006-03-14<br />
Table of Contents<br />
Chapter 1 - Atmospheric Noise Assessment ............................................................................... 6<br />
1. Introduction............................................................................................................................... 6<br />
2. Existing Conditions................................................................................................................... 6<br />
2.1. Regulatory Background – Local Noise Bylaws ................................................................... 6<br />
2.1.1. Corporation of Delta ............................................................................................................. 6<br />
2.1.2. Capital Regional District - Salt Spring Island....................................................................... 6<br />
2.1.3. Capital Regional District – Galiano Island ........................................................................... 7<br />
2.1.4. Municipality of North Cowichan.......................................................................................... 7<br />
2.1.5. City of Duncan...................................................................................................................... 7<br />
2.1.6. Commercial Vessel Noise Policies ....................................................................................... 7<br />
2.2. Existing Noise Environment – Communities Near Overhead Lines and Inland<br />
Terminals....................................................................................................................................... 8<br />
2.2.1. Methodology......................................................................................................................... 8<br />
2.2.2. Details of Measurements at Locations.................................................................................. 8<br />
2.2.3. Noise Survey Results .......................................................................................................... 10<br />
2.3. Existing Noise Environment – Communities Near Cable Terminals and Submarine<br />
Cable Landfalls ........................................................................................................................... 10<br />
3. Potential Effects – Construction and Operation of Project Facilities................................ 11<br />
3.1. Methodology ......................................................................................................................... 11<br />
3.2. Construction Noise............................................................................................................... 11<br />
3.3. Operation Noise.................................................................................................................... 15<br />
4. Potential Effects - Corona ...................................................................................................... 18<br />
5. Potential Effects – Cable Terminal Hydraulic Pump Operation ....................................... 19<br />
5.1. Nile Creek Shore Terminal Facility ................................................................................... 19<br />
5.2. Oil-filled Cable System........................................................................................................ 20<br />
5.3. Hydraulic Pumps ................................................................................................................. 21<br />
5.4. Vacuum Pumps .................................................................................................................... 21<br />
5.5. Acoustic Measurements....................................................................................................... 22<br />
5.5.1. Indoor Measurements.......................................................................................................... 23<br />
5.5.2. Outdoor Measurements....................................................................................................... 24<br />
6. Potential Effects – Removal, Construction and Operation of Submarine Cables and<br />
Cable Terminals.......................................................................................................................... 28<br />
7. Potential Effects – Cable-laying and Cable-removal Vessels.............................................. 28<br />
8. Conclusion ............................................................................................................................... 30<br />
9. References Cited...................................................................................................................... 32<br />
3
JASCO Research Ltd <strong>BC</strong>TC VITR Project 2006-03-14<br />
Chapter 2: Underwater Noise Assessment ............................................................................... 33<br />
1. Introduction............................................................................................................................. 33<br />
2. Baseline measurements........................................................................................................... 33<br />
2.1. Methodology ......................................................................................................................... 33<br />
2.2. Trincomali Channel measurements ................................................................................... 35<br />
2.3. Strait of Georgia measurements ......................................................................................... 35<br />
3. Construction and operation noise.......................................................................................... 37<br />
3.1. Cable construction noise...................................................................................................... 37<br />
3.2. Cable operation noise .......................................................................................................... 38<br />
4. Noise Modelling....................................................................................................................... 39<br />
4.1. Methodology ......................................................................................................................... 39<br />
4.2. Construction Noise Modelling Results............................................................................... 42<br />
4.2.1. Cable ship............................................................................................................................ 42<br />
4.2.2. Small workboat ................................................................................................................... 42<br />
5. Conclusion ............................................................................................................................... 48<br />
6. References Cited...................................................................................................................... 49<br />
4
JASCO Research Ltd <strong>BC</strong>TC VITR Project 2006-03-14<br />
Preface<br />
This report contains JASCO Research Ltd’s assessment of the baseline atmospheric and<br />
underwater noise environments near the Vancouver Island <strong>Transmission</strong> Reinforcement (VITR)<br />
Project facilities and transmission line Right of Way (ROW) that are part of the proposed<br />
replacement and upgrade of <strong>BC</strong>TC’s existing 138 kV overhead line and submarine cable<br />
transmission interconnection system from the Arnott Substation in Delta, B.C., to the Vancouver<br />
Island Terminal in North Cowichan, B.C. The report outlines the changes in noise level that can<br />
be expected during the construction work and in the subsequent operation of the systems. Topics<br />
and areas of study directly correspond to those sections on noise found in the VITR Draft Terms<br />
of Reference (May 2005).<br />
This report is organized into two separate sections; the first section addresses the atmospheric<br />
noise assessment and the second section addresses underwater noise issues. The two sections<br />
include separate background information, methods, results and conclusions.<br />
The atmospheric section provides the following information specifically for communities and<br />
environments near the proposed VITR Project facilities and ROW: (i) relevant local noise<br />
bylaws, (ii) an assessment of existing noise conditions in communities near overhead lines,<br />
inland terminals, cable terminals and submarine cable landfalls, and (iii) a discussion of potential<br />
effects of construction and operation of project facilities, corona, hydraulic pump operation,<br />
removal, construction and operation of submarine cables and cable terminals, and cable laying<br />
and cable removal vessels on baseline noise levels.<br />
The underwater section presents results of field measurements performed in Trincomali Channel<br />
and the Strait of Georgia. The final part of this report provides a review of the existing noise<br />
conditions along the transmission line route, and discusses potential effects of cable construction<br />
and operation on the baseline noise levels.<br />
5
JASCO Research Ltd <strong>BC</strong>TC VITR Project - Atmospheric 2006-03-14<br />
Chapter 1 - Atmospheric Noise Assessment<br />
1. Introduction<br />
This chapter provides an assessment of the baseline atmospheric (in-air or audible) noise<br />
environment in communities near the VITR facilities and transmission line Right of Way (ROW)<br />
that are part of the proposed reinforcement, and of the changes in noise level that can be<br />
expected during the construction work and in the subsequent operation of the system. In the<br />
sections that follow, the results of acoustic measurements performed at a number of locations are<br />
presented in the context of local regulations for allowable levels of anthropogenic noise.<br />
Numerical modelling of sound propagation is then used to forecast the potential increase in noise<br />
due to activities including the construction and operation of additional facilities, removal and<br />
laying of submarine cables, excavation for underground cable or overhead line poles, and<br />
helicopter assisted installation of new tower components. The potential for increased audible<br />
noise from hydraulic pumps associated with the cable terminals and from the operation of<br />
transmission lines under atmospheric conditions including rain or fog, mostly due to corona<br />
discharge, is also discussed.<br />
2. Existing Conditions<br />
2.1. Regulatory Background – Local Noise Bylaws<br />
Atmospheric noise from construction and other anthropogenic activities in the urban areas within<br />
the vicinity of the ROW is regulated locally through the municipal bylaws discussed in this<br />
section.<br />
2.1.1. Corporation of Delta<br />
Noise Control Bylaw No. 1906 – This bylaw regulates noise and sound and states that the<br />
generation of noise from machinery or construction activities is restricted as follows: from<br />
Monday to Friday not before 7:00 am nor after 7:00 pm; on Saturday not before 9:00 am nor<br />
after 5:00 pm; Sunday not at all.<br />
2.1.2. Capital Regional District - Salt Spring Island<br />
Bylaw 2047 “Noise Suppression Bylaw (Salt Spring Island) No. 1, 1992, Amendment Bylaw<br />
NO. 1, 2004” – This bylaw provides for the abatement and control of disturbing noise in the<br />
electoral area of Salt Spring Island in the Capital Regional District. It states that within the<br />
electoral area “No person shall make, cause to be made, or continue to make any noise or sound<br />
in the Electoral Area which creates a noise that disturbs or tends to disturb the quiet, peace, rest,<br />
enjoyment, comfort or convenience of the neighbourhood or of persons at or near the source of<br />
such noise or sound.” Disturbing noise levels are not quantified.<br />
The bylaw forbids any person from loading/unloading any truck, wagon, or motor vehicle in or<br />
upon any public or private place or premises, and from constructing or using constructing<br />
equipment before 7:00 am and after sunset or 7:00 pm (whichever is latest) unless the hours of<br />
6
JASCO Research Ltd <strong>BC</strong>TC VITR Project - Atmospheric 2006-03-14<br />
operation must be determined by factors such as tides, ferry schedules, weather conditions, or<br />
fire hazards in forests.<br />
2.1.3. Capital Regional District – Galiano Island<br />
Noise bylaws for the Southern Gulf Islands fall under the jurisdiction of the Capital Region<br />
District. At this time there are no Noise Bylaws that are specific to Galiano Island. The Galiano<br />
Island Community Plan does not specifically detail noise regulations but it does state, “Noise<br />
abatement techniques are encouraged” in Light Industrial areas.<br />
2.1.4. Municipality of North Cowichan<br />
Bylaw No. 2857 “Noise Bylaw 1995” – A bylaw to provide for noise control to “regulate or<br />
prohibit the making or causing of noises or sounds in or on a highway or elsewhere in the<br />
municipality which disturb, or tend to disturb, the quiet, rest, enjoyment, comfort, or<br />
convenience of the neighbourhood, or of persons in the vicinity, or which Council believes are<br />
objectionable”.<br />
The bylaw forbids the “erecting, demolishing, altering, or repairing of any buildings or structure,<br />
or the excavation of any land, street, highway, or lane prior to 7:00 am or after 8:00 pm on<br />
Monday to Saturday, inclusive, or prior to 9:00 am or after 6:00 pm on Sundays in such a manner<br />
as to disturb the quiet, peace, rest, enjoyment, comfort, or convenience of any person or persons<br />
in the neighbourhood or vicinity”.<br />
2.1.5. City of Duncan<br />
Bylaw No. 1423 “Noise Control Bylaw, 1984” – A bylaw to regulate or prohibit the making or<br />
causing of noises or sounds in or on a highway or elsewhere in the municipality which disturb, or<br />
tend to disturb, the quiet, peace, rest, enjoyment, comfort, or convenience of the neighbourhood,<br />
or of persons in the vicinity, or which in the opinion of the Council are objectionable or liable to<br />
disturb the quiet, peace, rest, enjoyment, comfort, or convenience of individuals or the public,<br />
and may make different regulations or prohibitions for different areas of the municipality.<br />
Construction hours are defined between 07:00 hours and 22:00 hours. Outside of these hours,<br />
and on Sundays, it is prohibited to construct, erect, reconstruct, alter, repair or demolish any<br />
building, structure or thing or excavate or fill in land in any manner which disturbs the quiet,<br />
peace, rest, enjoyment, comfort or convenience of the neighbourhood or of persons in the<br />
vicinity, except by written permission of the City Administrator.<br />
2.1.6. Commercial Vessel Noise Policies<br />
Currently, there are no Canadian standards that restrict audible noise from marine vessels in<br />
regards to community impacts. The Canada Labour Code Part II and the Marine Occupational<br />
Safety and Health (MOSH) regulations address noise from the health and safety perspective of<br />
the vessel crews. Environmental noise from commercial vessels is addressed through municipal<br />
bylaws, the harbour authority “Operation Regulations” (different for each port under the Canada<br />
Marine Act – J. Baumann personal communication, 07-Oct-05), and other onshore bodies<br />
responsible for regulating noise (M. Chaumont personal communication, 19-Oct-05).<br />
7
JASCO Research Ltd <strong>BC</strong>TC VITR Project - Atmospheric 2006-03-14<br />
2.2. Existing Noise Environment – Communities Near Overhead Lines<br />
and Inland Terminals<br />
2.2.1. Methodology<br />
Baseline noise levels were measured at representative locations in each community within the<br />
project area. Noise levels were recorded using a sound level meter with a pre-amplifier and ½”<br />
Free Field condenser microphone (Larson Davis Models 824, PRM 902, and 2541 respectively).<br />
Measurement sites were located near residences that lie in close proximity to the transmission<br />
line Right of Way (ROW). Locations were chosen that characterized the average noise levels in<br />
each community, that were easily and safely accessible and that provided secure places to leave<br />
recording equipment for prolonged recording periods. The baseline measurement locations are<br />
outlined in Table 1.<br />
Table 1 Baseline noise measurement locations.<br />
Community Description<br />
Tsawwassen 543 Tralee Cres., residential neighbourhood along ROW<br />
Galiano Island 70 Montague Park Rd, Montague Harbour community<br />
Salt Spring Island Intersection of Long Harbour Rd and Upper Ganges Rd, rural residential area<br />
North Cowichan Intersection of Bayview Pl and Bayview Dr, rural residential area<br />
Duncan<br />
7056 Bell McKinnon Rd, residence adjacent to VIT property<br />
Measurements at the Tsawwassen, North Cowichan, and Duncan locations consisted of 24-hour<br />
recordings. Measurements at the Gulf Island locations (Salt Spring and Galiano Island) were<br />
limited to 18 hours since the measurement opportunities were restricted by ferry schedules.<br />
Hourly average energy equivalent levels (L eq ) were logged and are summarized further down.<br />
Typical factors contributing to the overall noise environment included street traffic, air traffic,<br />
household and yard noises (radios, lawnmowers, chainsaws etc), dogs barking, and natural noises<br />
such as rustling leaves, crickets, and birds chirping.<br />
2.2.2. Details of Measurements at Locations<br />
Tsawwassen<br />
The transmission line ROW passes through densely populated residential areas, parks, and<br />
school grounds within the community of Tsawwassen. Baseline measurements were recorded on<br />
a quiet residential street in front of a residence at 543 Tralee Cres. The centerline of the ROW<br />
passes through the backyards of the houses along the Northwest side of the street in this area at a<br />
range of approximately 50m from theses residences. The recording duration lasted 24 hours at<br />
this location.<br />
Montague Harbour, Galiano Island<br />
The overhead transmission line ROW passes between the Taylor Bay Terminal and Montague<br />
Harbour across Galiano Island. The ROW passes mainly through rural and forested areas. There<br />
are only a few residences within approximately 70 m of the ROW. Baseline measurements were<br />
recorded on the property of 70 Montague Park Rd, in the community near Montague Harbor.<br />
This location was chosen since it represents the section of the ROW across Galiano Island with<br />
the most sensitive receptors nearby, including the Montague Harbour Marine Park and<br />
8
JASCO Research Ltd <strong>BC</strong>TC VITR Project - Atmospheric 2006-03-14<br />
Campground, the Marina, several residences and Bed and Breakfast locations. The measurement<br />
site was located approximately 475m from the location on the ROW where the lines cross<br />
Montague Harbour over to Parker Island. The recording duration was 18 hours at this location,<br />
from 12:45pm until 6:45am the following morning.<br />
Salt Spring Island<br />
The overhead transmission line ROW crosses Salt Spring Island through rural/residential areas<br />
and through remote and forested locations. Residences and farms define the sensitive receptors<br />
along the section of the ROW where baseline measurements were taken. Measurements were<br />
made at a location, on the eastern side of Salt Spring Island that was directly adjacent to the<br />
transmission line, at the intersection of Long Harbour Rd and Upper Ganges Rd. The<br />
microphone was located approximately 25m from the nearest transmission line and<br />
approximately 35m from the nearest of the steel lattice structures which support the transmission<br />
lines. Measurements were recorded for 11 hours at this location. Residences, farms and<br />
businesses are located in this area.<br />
North Cowichan<br />
Baseline measurements for the North Cowichan district were recorded in the community of<br />
Maple Bay at the intersection of Bayview Place and Bayview Dr. This is a very quiet, rural,<br />
residential area. This location was approximately 575m from the ROW. This area is very hilly<br />
and rugged. Measurements were taken for a 24-hour period at this location.<br />
Duncan<br />
Baseline measurements along the section of the transmission line ROW near to the community of<br />
Duncan were recorded in front of the residence that is located adjacent to the <strong>BC</strong>TC Vancouver<br />
Island Terminal property. This is a rural residential area along a moderately busy street.<br />
Measurements were taken for a 24-hour period at this location. The nearest sensitive receptors<br />
along this portion of the ROW are residences.<br />
9
JASCO Research Ltd <strong>BC</strong>TC VITR Project - Atmospheric 2006-03-14<br />
2.2.3. Noise Survey Results<br />
Hourly interval summary data were averaged over the recording period and are presented in the<br />
following table. The hourly L eq statistics represent the equivalent level of a constant sound<br />
source that would emit the same acoustic energy over a one-hour period as the actual, timevarying<br />
sound. The table presents the average, maximum, and minimum hourly-L eq values that<br />
were recorded at each location. Also provided in the table are the maximum and minimum<br />
sound pressure levels (SPL) observed during the recording period and a selection of average L n<br />
percentiles, that is the L eq levels that were exceeded ‘n’ percent of the time in the one hour<br />
intervals. All levels are presented in dBA.<br />
Table 2: Baseline noise measurement results in A-weighted decibels (dBA). Averaged over<br />
duration of recording (Rec Len).<br />
Location Rec Len Avg Max Min Max Min Avg Avg Avg Avg<br />
(Hours) L eq L eq L eq SPL SPL L 5 L 15 L 50 L 90<br />
Tsawwassen 24 52 60 34 75 31 56 47 38 35<br />
Montague 18 32 44 20 23 53 35 32 28 25<br />
Salt Spring 14 55 63 33 78 28 60 53 42 32<br />
N Cowichan 24 45 57 37 63 34 47 43 39 36<br />
Duncan 24 58 64 46 81 42 62 54 47 43<br />
2.3. Existing Noise Environment – Communities Near Cable Terminals<br />
and Submarine Cable Landfalls<br />
The communities in the vicinity of the cable terminals and the nearshore areas of the submarine<br />
cables include the English Bluff area of Tsawwassen and the communities near Maracaibo on<br />
Salt Spring Island and near Taylor Bay on Galiano Island. The English Bluff community is a<br />
residential area with ambient noise sources comprising moderate street traffic, overhead planes<br />
and common environmental sounds from household animals and birds. The Maracaibo and<br />
Taylor Bay communities are rural areas with very little traffic and relatively quiet ambient noise<br />
levels, contributing noise sources being primarily non-anthropogenic.<br />
The baseline noise level in the community near the English Bluff terminal would be comparable<br />
to the background ambient noise levels measured at Tralee Cres. in Tsawwassen as described in<br />
section 2.2.2. The measurements provided in Section 2.2.3 that were taken near Montague<br />
Harbour on Galiano Island are representative of the baseline noise levels that could be expected<br />
in the communities near the Taylor Bay terminal and near the Maracaibo terminal. Based on<br />
those measurements and knowledge of the community environments (urban residential for<br />
English Bluff; rural for Maracaibo and Taylor Bay) the following reasonable estimates of the<br />
background noise environments in the communities near the terminal sites are provided:<br />
Location<br />
Estimated Average Hourly L eq Values (dBA)<br />
English Bluff 50-55<br />
Maracaibo 35-40<br />
Taylor Bay 30-35<br />
10
JASCO Research Ltd <strong>BC</strong>TC VITR Project - Atmospheric 2006-03-14<br />
3. Potential Effects – Construction and Operation of Project Facilities<br />
3.1. Methodology<br />
Sound propagation modelling of several representative construction scenarios was performed to<br />
evaluate the extent of the areas that could potentially be affected by these construction activities.<br />
An atmospheric noise propagation model developed at JASCO Research Ltd was used to<br />
determine the transmission loss characteristics in each of the representative communities. The<br />
model is based on the Parabolic Equation numerical solution method and provides very accurate<br />
computation of frequency dependent transmission loss accounting for diffraction, air turbulence<br />
and ground interaction. The model takes into account features such as topography and ground<br />
cover, and environmental factors such as wind speed, temperature and humidity. The frequency<br />
resolved transmission loss values generated by the model are applied to third-octave band<br />
acoustic source levels to provide received levels as a function of directional distance from the<br />
noise source. Where a source is composed of multiple discrete components whose noise levels<br />
are individually measured, as may be the case for a large transmission line substation, the<br />
received levels for each component are modelled independently and added. The results of the<br />
model are summed across frequency bands (with appropriate weighting) to give broadband noise<br />
level contours that map the geographic extent of the noise under consideration. By<br />
superimposing these contours in a GIS framework on chart layers showing dwellings or<br />
communities, the interaction between noise and population can be assessed. For the purpose of<br />
this study, to provide realistic average propagation conditions, the atmospheric conditions were<br />
assumed to be windless and with a vertical profile of temperature and humidity typical of a clear<br />
autumn day.<br />
3.2. Construction Noise<br />
Construction activities associated with the transmission line upgrade will be a source of<br />
increased audible noise in the project area communities; this noise, however, will be temporary<br />
and short term. The significance of the construction noise relative to the ambient background<br />
levels will be dependent upon the specific construction activities and the community baseline<br />
environments that are discussed in Section 2.2.2. The construction activities considered in this<br />
assessment include: removal of the existing support structures and lines, installation of new<br />
support structures and lines, and trenching / backfilling in the community of Tsawwassen to put<br />
the new line underground.<br />
Most construction noise associated with the project should be limited to daytime hours by<br />
Municipal Bylaws. Daytime construction may generate noise levels that exceed the ambient<br />
levels in the surrounding communities and has the potential to cause disturbance by, for example,<br />
hindering verbal communication at comfortable voice levels. An environmental assessment for<br />
the Deltaport Third Berth Project (Vancouver Port Authority, 2005) indicates that maximum<br />
daytime levels in residential areas of 65 dBA are acceptable to meet Health and Welfare Canada<br />
recommendations that noise levels in interior rooms be limited to 45 dBA, given that modern<br />
homes with doors and windows shut attenuate noise by approximately 20 dBA. 65 dBA is also<br />
supported by the guidelines of the World Health Organization for community noise (WHO,<br />
1999) as a maximum background level to allow vocal communication. Thus, 65 dBA was<br />
chosen as the criterion level for noise contour mapping of construction noise. While the noise<br />
11
JASCO Research Ltd <strong>BC</strong>TC VITR Project - Atmospheric 2006-03-14<br />
outside of this contour may exceed the ambient baseline levels in a given community, this<br />
contour is intended to indicate the extent of possible disturbance.<br />
Noise level contours are presented in 5 dB increments, to a minimum contour level of 65 dBA.<br />
The results are intended to represent reasonable worst-case levels and are based on conservative<br />
assumptions about the maximum noise that could arise from a particular construction activity. In<br />
actual practice these levels will only be generated during operation of the noisiest of the<br />
construction equipment, and are not expected to be continuous or long lasting.<br />
In the community of Tsawwassen the major sources of noise involved in the construction stage<br />
of the project will be the removal of the existing H-frame structures and the trenching required<br />
for placing the new cables underground. Modelling was performed to predict the spread of<br />
sound from these activities in a residential area of Tsawwassen; baseline measurements in this<br />
community indicated an average hourly L eq value of 52 dBA. The equipment involved in this<br />
process could include backhoes, cranes, dump trucks, excavators, front-end loaders etc. To<br />
predict a representative noise spread from these activities, a model was run using aggregate<br />
third-octave band source levels for an excavator and a moveable crane obtained from a database<br />
of predicted noise levels on construction sites (Hepworth Acoustics Ltd, 2004). The model<br />
results are presented in Figure 1 as A-weighted, broadband sound level contours. The source<br />
position is at the centre of the near-circular inner contours. Terrain relief features cause<br />
deviations of the contour shapes from concentric circles. The minimum level to which the noise<br />
contours are plotted is 65 dBA. In this scenario, the maximum distance from the source to which<br />
noise levels of 65 dBA propagate is 335 m.<br />
Figure 1: Atmospheric model results for construction noise at a representative location in Tsawwassen. Contours<br />
indicate A-weighted, broadband sound pressure levels in decibels relative to the standard acoustic reference pressure<br />
in air of 20 µPa. The source consists of the combined noise from a moveable crane and an excavator, modelled at a<br />
height of 2m. The solid black lines indicate the transmission line ROW.<br />
Construction activities on Salt Spring Island will involve the removal of the existing steel lattice<br />
support structures and lines, the placement of new support structures and stringing of the new<br />
line. There will be some areas in remote locations that will require the use of helicopters for pole<br />
maneuvering, but it is anticipated that the major source of audible noise nearest to residences<br />
along this segment of the transmission line will be from equipment such as cranes, augers,<br />
backhoes, front end loaders, jackhammers, and tampers. For modelling purposes, source levels<br />
12
JASCO Research Ltd <strong>BC</strong>TC VITR Project - Atmospheric 2006-03-14<br />
from measurements of moveable cranes and excavators (Hepworth Acoustics Ltd, 2004) were<br />
used to model the noise footprint in a representative residential area along the transmission line.<br />
Based on ambient noise measurements the average hourly L eq value in this area is 55 dBA. The<br />
model results are presented in Figure 2. The construction noise attenuates to a level of 65 dBA<br />
within approximately 185 m range from the source. Only a few residences are located within<br />
this range.<br />
Figure 2: Atmospheric model results for construction noise on Salt Spring Island. Contours indicate A-weighted,<br />
broadband sound pressure levels in decibels relative to the standard acoustic reference pressure in air of 20 µPa. The<br />
source consists of the combined noise from a crane and an excavator, modelled at a height of 2m. Solid black lines<br />
indicate the transmission line ROW and black squares indicate hydro towers, residences and other buildings.<br />
The major noise source associated with the construction phase of the project on Galiano Island<br />
will be the helicopter operations that are planned for the removal and replacement of the top<br />
sections of the existing steel lattice support structures along the transmission line. For modelling<br />
purposes it was assumed that a Sikorsky S-64 SkyCrane helicopter (or equivalent) would be used<br />
for this task at most locations on Galiano Island. Third-octave band source level data were<br />
obtained from the literature (True and Hickey, 1977) for the SkyCrane. The model was run at the<br />
location where the existing steel lattice structure will be extended to greater height to support the<br />
new high voltage line crossing over Montague Harbour. Based on ambient noise measurements<br />
the average hourly L eq level in this area is 32 dBA. The towers are approximately 41m tall at this<br />
location and thus the source height was modelled at a height of 45m above the ground.<br />
The model results, presented as sound level contours in 5 dBA increments, are presented in<br />
Figure 3. This noise footprint clearly shows the enhanced propagation of sound over water as<br />
compared to the propagation over land. Due to this effect the helicopter noise may reach<br />
residences along the Northeast shoreline of Salt Spring Island (9-10 km away) at levels between<br />
65 and 75 dBA. Inland on Galiano Island however, the helicopter noise drops to a level of<br />
65 dBA at a maximum range of 3 km.<br />
13
JASCO Research Ltd <strong>BC</strong>TC VITR Project - Atmospheric 2006-03-14<br />
Figure 3: Atmospheric model results for construction noise on Galiano Island. Contours indicate A-weighted,<br />
broadband sound pressure levels in decibels relative to the standard acoustic reference pressure in air of 20 µPa. The<br />
source is a Sikorsky S-64 SkyCrane helicopter, modelled at a height of 45m. Solid black lines indicate the<br />
transmission line ROW and black squares indicate residences and other buildings.<br />
In the North Cowichan district the transmission line ROW mainly crosses forested and<br />
agricultural land. The ROW passes in the vicinity of a few farms and residences, particularly in<br />
the area near Maple Bay. The measured ambient noise level in this community has an average<br />
hourly L eq value of 45 dBA. The terrain in the communities near Maple Bay is very rugged and<br />
hilly. It is anticipated that the line replacement activities in this area will involve the use of<br />
helicopters and that this will be the major source of audible noise during the construction phase<br />
of this project in this community. For modelling purposes the third-octave band source levels of<br />
a Sikorsky SkyCrane helicopter were modelled in this community with a source height of 25m -<br />
the existing steel lattice support structures have an average height of 22 m. The sound attenuates<br />
rapidly due to terrain relief as it propagates over land, but it can be seen to propagate to further<br />
distances where it crosses Maple Bay. Sound levels between 65 and 75 dBA may propagate to<br />
the Western side of Salt Spring Island; along this shoreline, however, there are very few<br />
residences.<br />
14
JASCO Research Ltd <strong>BC</strong>TC VITR Project - Atmospheric 2006-03-14<br />
15
JASCO Research Ltd <strong>BC</strong>TC VITR Project - Atmospheric 2006-03-14<br />
nearest residences. Furthermore, the sound levels at the perimeter of the substation property,<br />
after the addition of the new transformer, are also below the typical limits used in the power<br />
transmission industry of 55 dBA at the substation property line in a residential zone (IEEE Std<br />
1127-1998).<br />
Figure 5: Atmospheric model results for operation of transformers at the Vancouver Island Terminal site. Contours<br />
indicate A-weighted, broadband sound pressure levels in decibels relative to the standard acoustic reference pressure<br />
in air of 20 µPa. The blue contours indicate existing noise levels emanating from the site and red contours indicate<br />
noise levels after the addition of the phase shifting transformer. Solid black lines indicate the transmission line ROW<br />
and black squares indicate residences and other buildings.<br />
A 230kV, 75 MVA shunt reactor will be added at the Taylor Bay Terminal on Galiano Island.<br />
Again a ‘before and after’ modelling approach was taken to predict any possible increase in<br />
audible noise at this location. There is an existing transformer at the Taylor Bay site, which was<br />
modelled to show the existing noise levels in the surrounding area. The model was then run<br />
again with increased source level to account for the addition of the shunt reactor. It is anticipated<br />
that the shunt reactor will have a broadband source level of approximately 70 dBA. This level<br />
will be lower if a sound enclosure is installed; however, the ‘worst case’ scenario was modelled<br />
for this assessment. The spectral distribution of the noise was assumed to be similar to that from<br />
the reactors that were measured at the VIT location. The model results indicate that the sound<br />
field will not increase appreciably due to the addition of the shunt reactor and that the increase in<br />
sound level at the location of the nearest residence to the substation property will be negligible.<br />
The minimum sound contour level presented is 35 dBA. The ambient noise level in this<br />
community is 32 dBA (based on the average hourly L eq value measured in baseline acoustic<br />
study). Since human beings cannot perceive a decibel difference of 3 dB, it is assumed that the<br />
noise from the substation has reached ambient levels at the location of the nearest residence to<br />
the substation property.<br />
16
JASCO Research Ltd <strong>BC</strong>TC VITR Project - Atmospheric 2006-03-14<br />
Figure 6: Atmospheric model results for operation of transformers at the Taylor Bay Terminal site. Contours<br />
indicate A-weighted, broadband sound pressure levels in decibels relative to the standard acoustic reference pressure<br />
in air of 20 µPa. The blue contours indicate existing noise levels emanating from the site and red contours indicate<br />
noise levels after the addition of the shunt reactor. Solid black lines indicate the transmission line ROW and black<br />
squares indicate residences and other buildings.<br />
17
JASCO Research Ltd <strong>BC</strong>TC VITR Project - Atmospheric 2006-03-14<br />
4. Potential Effects - Corona<br />
Corona is the term used to describe the localized ionization of air particles in regions of high<br />
electric field strength at discrete points along a transmission line. Particles like dust and water<br />
droplets on the line can enhance this effect and corona noise is often associated with rainy and<br />
foggy weather conditions. Corona can generate broadband (1Hz – 20kHz) audible noise that is<br />
characterized by a crackling or hissing sound. Corona performance can be accurately modelled<br />
and audible noise levels can be predicted at the design stage of the transmission line, based on<br />
the conductor properties and the line voltage. Typically noise is not a major cause for concern<br />
for lines that are less than 345 kV. A study of a compact 230 kV line indicates L 50 audible noise<br />
levels of approximately 45 dBA at 15m in stable rain conditions (Chartier et al, 1994). A second<br />
study observed median L 50 levels of 44 dBA at the edge of the ROW of a 230 kV line (BPA,<br />
2003). Thus, corona noise is not expected to significantly affect the ambient levels in the<br />
communities along the transmission line.<br />
Digitally superimposed<br />
UVC picture of corona:<br />
Voltage: 150 kV<br />
Findings: Intense corona on<br />
porcelain insulator<br />
Source:<br />
http://www.daycor.com/trans<br />
mission.html<br />
18
JASCO Research Ltd <strong>BC</strong>TC VITR Project - Atmospheric 2006-03-14<br />
5. Potential Effects – Cable Terminal Hydraulic Pump Operation<br />
Hydraulic pumps will be added at the cable terminal stations where transitions from sub-sea to<br />
overhead cabling occurs, namely at the English Bluff terminal in Tsawwassen, at the Taylor Bay<br />
terminal on Galiano Island and at the Maracaibo terminal on Salt Spring Island. These pumps<br />
are required to maintain the pressure inside the sub-sea cables. The pumps operate intermittently<br />
and are generally housed inside structures to dampen the noise emanating from them.<br />
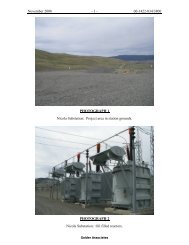
An acoustics field measurement program was made December 9, 2005 at <strong>BC</strong>TC’s Nile Creek<br />
Shore Terminal station on Vancouver Island. The purpose of the Nile Creek acoustics program<br />
was to measure acoustic source levels of the hydraulic pumps and vacuum pumps operated at the<br />
station.<br />
Sound levels were in fact measured inside and outside the pump building with the hydraulic and<br />
vacuum pumps running and with the hydraulic pumps stopped. The pump noise emission levels<br />
at the Nile Creek terminal are expected to be representative of pump noise produced at the<br />
Tsawwassen, Taylor Bay (Galiano Island), and Maracaibo (Salt Spring Island) shore terminal<br />
stations. The measurements obtained during this field study and presented in this report are ideal<br />
for noise level modelling at those locations.<br />
5.1. Nile Creek Shore Terminal Facility<br />
The Nile Creek Shore terminal serves as the point of transition from underwater/underground<br />
cable to overhead transmission lines for two 500 kV transmission circuits. Six underwater cables<br />
(three per circuit) arrive at shore buried in the seabed. The cables run underground for about<br />
200m between the shoreline and the station, where they emerge from the ground through<br />
concrete pedestals supporting vertical insulator stacks as shown in Figure 7. The feed conductors<br />
exit the top of the vertical insulator stacks and connect to bar and rail systems that lead<br />
horizontally under the overhead transmission lines and then connect with the overhead lines as<br />
shown in Figure 8.<br />
19
JASCO Research Ltd <strong>BC</strong>TC VITR Project - Atmospheric 2006-03-14<br />
Figure 7: Underground cables emerge<br />
through concrete base and stack of<br />
insulators.<br />
Figure 8: Bar and rail system connects conductors to the overhead<br />
transmission lines.<br />
5.2. Oil-filled Cable System<br />
The underwater cables have inner and outer conductors separated by an oil-impregnated<br />
laminate-paper insulator. The inner conductor carries the transmission line current, while the<br />
grounded outer conductor serves primarily as a protective jacket. Pressurized oil is supplied to<br />
the entire length of cable through a conduit on the cable axis. Figure 9 presents a photo of the<br />
cable’s cross section showing its inner and outer conductors, insulating layers and the axial oil<br />
conduit.<br />
Resistive heating from increased electrical load can cause the cable temperature to rise and this<br />
leads to expansion of the contained oil. When oil expansion occurs the excess oil must be stored<br />
so it can be reinserted when the temperature decreases. The excess oil is stored in two large tanks<br />
housed in a storage and pump building at the Nile Creek terminal (see Figure 10). The tanks also<br />
serve as a reservoir to replace any additional oil lost through leakage.<br />
20
JASCO Research Ltd <strong>BC</strong>TC VITR Project - Atmospheric 2006-03-14<br />
Figure 9: Cross section of the underwater cable. The<br />
hollow center is the conduit for insulating oil.<br />
Figure 10: One of two large oil tanks housed in the<br />
pump building at the Nile Creek shore terminal.<br />
5.3. Hydraulic Pumps<br />
Hydraulic pumps, located beside the storage tanks, maintain the oil pressure in the cables in the<br />
normal operating range 155-165 psi. A separate pump is used for each of the cables, so a total of<br />
six pumps plus two backup pumps are housed in the pump building at the Nile Creek terminal.<br />
The specifications for these pumps are given below:<br />
Hydraulic Pump specifications<br />
• Brand: H.K. Porter Company Inc.<br />
• Model: P215J frame<br />
• Horsepower: 3 HP at 1140 RPM<br />
• 3-phase 220V electric motor drive<br />
A photo of the hydraulic pumps beneath the storage tank is given in Figure 11. An automatic<br />
pressure monitoring system in the pump building starts the pumps when pressure falls below a<br />
preset threshold in any cable. The pumps at the Nile Creek terminal are turned on for a fixed<br />
duration of 90-minutes when pressure in the corresponding cable falls below 155 psi. A 2-minute<br />
equalizing period occurs immediately after the 90-minute cycle and pressure is rechecked after<br />
this. If the pressure is still low then the pump is turned on for another 90 minutes. The condition<br />
of consecutive 90-minute cycles is indicative of a leak, and this does not occur under normal<br />
circumstances. Typically only a single pump operates at any one time, but occasionally two and<br />
even three may be in simultaneous operation.<br />
5.4. Vacuum Pumps<br />
Each of the two oil storage tanks is supported by a vacuum pump that runs continuously to<br />
remove water vapour over the oil that could adversely affect its insulating properties. Each tank<br />
also has one identical backup pump. Figure 12 presents a photograph of one of the vacuum<br />
pumps.<br />
21
JASCO Research Ltd <strong>BC</strong>TC VITR Project - Atmospheric 2006-03-14<br />
Figure 11: Hydraulic Pumps<br />
Figure 12: Vacuum Pump<br />
The vacuum pump nameplate provided the following specifications:<br />
Vacuum Pump specifications<br />
• Brand: Kinney Pumps<br />
• Model: KC-8<br />
• 3-phase 220V, ½ HP GE electric motor<br />
5.5. Acoustic Measurements<br />
The field program was performed to measure the noise emission levels of the hydraulic and<br />
vacuum pumps. Because the pumps were housed inside the tank building, noise levels outside<br />
the building were lowered by the sound-insulating properties of the building’s walls and ceiling.<br />
We consequently made separate measurements inside and outside of the building, with and<br />
without the hydraulic pump in operation. During each measurement a Larson Davis System 824<br />
Type-1 Logging Sound Level Meter (SLM) monitored and logged Flat-weighted and A-weighted<br />
sound levels on the slow time integration (1-second) setting. Simultaneously digital recordings of<br />
broadband flat-weighted acoustic pressure were made on a Marantz PMD690 digital recorder at<br />
48kHz sample rate with 16-bit samples. Calibrations of both the SLM and digital recorder were<br />
performed in the field using a Larson Davis CAL200 calibrator. A photo of the SLM and digital<br />
recorder apparatus is given in Figure 13.<br />
22
JASCO Research Ltd <strong>BC</strong>TC VITR Project - Atmospheric 2006-03-14<br />
Figure 13: Sound level meter and digital recorder deployment for<br />
outdoor measurements of hydraulic and vacuum pump noise.<br />
5.5.1. Indoor Measurements<br />
Measurements of unshielded pump source levels were made by placing the microphone of the<br />
SLM accurately at 100 cm from the vacuum pump and 130 cm from the hydraulic pump during<br />
their respective measurements. The foam wind ball of the SLM was removed for these<br />
measurements. The data from the indoor recordings are presented in spectrogram format (sound<br />
intensity versus frequency and time) in Figure 14 for the hydraulic pump and Figure 15 for the<br />
vacuum pump on the same intensity scale.<br />
Figure 14: Spectrogram of 4 minutes recording of the<br />
hydraulic pump made at 130 cm distance.<br />
Figure 15: Spectrogram of 1 minute recording of the<br />
vacuum pump made at 100 cm distance.<br />
The near-field measurements of both the hydraulic and vacuum pumps showed that acoustic<br />
energy was generated at many discrete frequencies under 2 kHz. This is typical of rotational<br />
pump equipment. The hydraulic pump contained strong tonal energy up to 1700 Hz, while the<br />
quieter vacuum pump produced most energy below 800 Hz.<br />
23
JASCO Research Ltd <strong>BC</strong>TC VITR Project - Atmospheric 2006-03-14<br />
One-third octave band source levels for the unshielded pumps were computed from the close<br />
distance recordings and these are presented in Table 3. The band levels are also plotted in Figure<br />
16 for the hydraulic pump and Figure 17 for the vacuum pump.<br />
Unweighted (flat) band levels for the Hydraulic Pump were observed to peak at 85.4 dB(F) re<br />
20µPa at 1m in the 1250 Hz band. In contrast the vacuum pump source levels peaked lower in<br />
frequency and level, in the 315 Hz band at 75.3 dB(F).<br />
Figure 16: 1/3-octave source levels of Hydraulic pump<br />
inside building (unshielded).<br />
Figure 17: 1/3-octave source levels of Vacuum<br />
pump inside building (unshielded).<br />
Broadband levels between 10 Hz and 20 kHz for the Hydraulic Pump were 90.7 dB(F) and 90.3<br />
dB(A) re 1m. The corresponding source levels for the Vacuum pump were 80.9 dB(F) and 76.6<br />
dB(A) re 1m. The small difference between flat and A-weighted levels for the hydraulic pumps<br />
occurs because the majority of the pump’s energy is between 500 Hz and 2 kHz where A-<br />
network weights are relatively small.<br />
5.5.2. Outdoor Measurements<br />
The placement of the pumps inside the building provided acoustic shielding that reduced the<br />
sound levels emitted outdoors. Separate measurements were therefore carried out outside the<br />
building at 17m from the building wall, which was 25m from the hydraulic pump locations<br />
inside.<br />
The outdoor measurements were influenced by constant low frequency (less than 200 Hz) hum,<br />
likely from inductive forces on the transmission line equipment, and by high frequency (above 2<br />
kHz) electrical ionization noise near insulators. Furthermore the station was located<br />
approximately 140m from Highway 19 and intermittent vehicle traffic produced broadband noise<br />
that dominated noise originating from the terminal facility. The field acoustician could not<br />
audibly detect noise from the vacuum pump alone above the interfering external noise sources.<br />
However the hydraulic pump was generally quite audible.<br />
We were able to extract sections of the noise recordings during periods with no vehicles passing<br />
and these were used to quantify pump noise emissions outside the pump building. Figure 18 and<br />
24
JASCO Research Ltd <strong>BC</strong>TC VITR Project - Atmospheric 2006-03-14<br />
Figure 19 show spectrograms for sections of the outdoor measurements with no vehicle traffic<br />
for the cases of the hydraulic pump stopped and running.<br />
Figure 18: Spectrogram of 1 minute recording 17m from<br />
the pump building with only the vacuum pump<br />
operating.<br />
Figure 19: Spectrogram of 1 minute recording 17m<br />
from the pump building with both the vacuum and<br />
hydraulic pumps running.<br />
The outdoor measurement with vacuum pump running showed frequency lines at 100 Hz, 120<br />
Hz, 360 Hz and 480 Hz, but none of these appear to correlate with lines from the corresponding<br />
indoor source level measurement. Consequently these lines are attributed to noise produced by<br />
the nearby transmission line components and not the vacuum pump. On the other hand, hydraulic<br />
pump noise tones were measured outside at 540 Hz, 570 Hz, 830 Hz, 1105 Hz, 1380 Hz and<br />
1680 Hz. The strongest line was at 1380 Hz line as apparent in Figure 19. One-third octave band<br />
levels were computed from the outdoor measurements, and the levels in the bands between 500<br />
Hz and 1250 Hz were scaled back to the source position, 25 m away, using a spherical spreading<br />
correction factor. The outdoors third-octave band source levels of the hydraulic pump are given<br />
in Table 4. Broadband source levels were also computed using only the bands containing spectral<br />
lines that correspond with the indoor pump measurements. The omitted bands likely were<br />
dominated by noise from other sources. The broadband outdoors source levels for the hydraulic<br />
pumps were 74.5 dB(F) re 1m and 74.3 dB(A) re 1m. These levels are 15 dB less than the<br />
unshielded source levels, and this emphasizes the importance of housing the pumps in soundinsulating<br />
enclosures.<br />
25
JASCO Research Ltd <strong>BC</strong>TC VITR Project - Atmospheric 2006-03-14<br />
Table 3: 1/3-Octave and broadband levels for the hydraulic and vacuum pumps, computed from measurements<br />
performed inside the pump building at close range.<br />
Hydraulic Pump Source Level<br />
Measurement<br />
Vacuum Pump Source Level<br />
Measurement<br />
Wave file name: C:\Documents and<br />
88.4 88.1 90.7 90.3 80.9 76.6 80.9 76.6<br />
Settings\dave\My Documents\Projects\<strong>BC</strong>TC<br />
2005\Nile Creek Shore Station\Nile Creek<br />
Recorder files\MZ000005_in hydr\MZ000005.WAV<br />
Number of channels: 1<br />
Wave file name: C:\Documents and<br />
Settings\dave\My Documents\Projects\<strong>BC</strong>TC<br />
2005\Nile Creek Shore Station\Nile Creek<br />
Recorder files\MZ000001_in vac<br />
pump\MZ000001.WAV<br />
Sample rate: 48000<br />
Number of channels: 1<br />
Bits per sample: 16<br />
Sample rate: 48000<br />
Number of samples: 11583488<br />
Bits per sample: 16<br />
Duration (min:sec): 0004:01<br />
Number of samples: 14450688<br />
SL range correction: 1.30000m<br />
Duration (min:sec): 0005:01<br />
Start time for analysis: 0 seconds<br />
SL range correction: 1.00000m<br />
Stop time for analysis: 241 seconds<br />
Start time for analysis: 0 seconds<br />
Stop time for analysis: 301 seconds<br />
Frequency dB(F) dB(A) SL(F) SL(A) Frequency dB(F) dB(A) SL(F) SL(A)<br />
--------------------------------------------- ---------------------------------------------<br />
10.0 56.6 -16.0 58.9 -13.7<br />
10.0 47.2 -25.4 47.2 -25.4<br />
12.5 54.9 -10.6 57.2 -8.3<br />
12.5 42.7 -22.8 42.7 -22.8<br />
16.0 50.1 -8.7 52.4 -6.4<br />
16.0 47.0 -11.8 47.0 -11.8<br />
20.0 53.0 2.6 55.3 4.9<br />
20.0 42.3 -8.1 42.3 -8.1<br />
25.0 52.3 7.6 54.6 9.9<br />
25.0 49.8 5.1 49.8 5.1<br />
31.5 58.8 19.4 61.0 21.6<br />
31.5 54.1 14.7 54.1 14.7<br />
40.0 61.9 27.3 64.2 29.6<br />
40.0 53.4 18.8 53.4 18.8<br />
50.0 64.4 34.2 66.7 36.5<br />
50.0 70.2 40.0 70.2 40.0<br />
63.0 50.0 23.8 52.3 26.1<br />
63.0 53.7 27.5 53.7 27.5<br />
80.0 57.1 34.6 59.4 36.9<br />
80.0 56.7 34.2 56.7 34.2<br />
100.0 54.0 34.9 56.3 37.2 100.0 56.2 37.1 56.2 37.1<br />
125.0 67.1 51.0 69.4 53.3 125.0 58.4 42.3 58.4 42.3<br />
160.0 66.5 53.1 68.8 55.4 160.0 66.8 53.4 66.8 53.4<br />
200.0 69.6 58.7 71.9 61.0 200.0 67.4 56.5 67.4 56.5<br />
250.0 76.5 67.9 78.8 70.2 250.0 71.7 63.1 71.7 63.1<br />
315.0 70.9 64.3 73.1 66.5 315.0 75.3 68.7 75.3 68.7<br />
400.0 75.3 70.5 77.6 72.8 400.0 71.3 66.5 71.3 66.5<br />
500.0 76.9 73.7 79.2 76.0 500.0 67.9 64.7 67.9 64.7<br />
630.0 76.6 74.7 78.9 77.0 630.0 69.7 67.8 69.7 67.8<br />
800.0 74.9 74.1 77.2 76.4 800.0 68.6 67.8 68.6 67.8<br />
1000.0 73.5 73.5 75.8 75.8 1000.0 66.6 66.6 66.6 66.6<br />
1250.0 83.1 83.7 85.4 86.0 1250.0 68.1 68.7 68.1 68.7<br />
1600.0 80.0 81.0 82.2 83.2 1600.0 60.7 61.7 60.7 61.7<br />
2000.0 74.3 75.5 76.6 77.8 2000.0 57.1 58.3 57.1 58.3<br />
2500.0 74.6 75.9 76.9 78.2 2500.0 55.4 56.7 55.4 56.7<br />
3150.0 72.1 73.3 74.4 75.6 3150.0 54.8 56.0 54.8 56.0<br />
4000.0 73.9 74.9 76.2 77.2 4000.0 54.2 55.2 54.2 55.2<br />
5000.0 71.7 72.2 73.9 74.4 5000.0 53.6 54.1 53.6 54.1<br />
6300.0 68.3 68.2 70.6 70.5 6300.0 54.4 54.3 54.4 54.3<br />
8000.0 66.7 65.6 69.0 67.9 8000.0 54.6 53.5 54.6 53.5<br />
10000.0 62.7 60.2 65.0 62.5 10000.0 51.1 48.6 51.1 48.6<br />
12500.0 57.4 53.1 59.7 55.4 12500.0 49.4 45.1 49.4 45.1<br />
16000.0 53.3 46.7 55.5 48.9 16000.0 48.7 42.1 48.7 42.1<br />
20000.0 51.2 41.9 53.5 44.2 20000.0 48.6 39.3 48.6 39.3<br />
Broadband levels<br />
Broadband levels<br />
26
JASCO Research Ltd <strong>BC</strong>TC VITR Project - Atmospheric 2006-03-14<br />
Table 4: 1/3-Octave and broadband levels for the ambient noise and outdoor hydraulic pump noise levels.<br />
Measurements were performed outside the pump building.<br />
Ambient Measurement Outside<br />
(Vacuum Pump was running)<br />
Hydraulic Pump Outside<br />
Wave file name: C:\Documents and<br />
66.2 46.9 67.5 47.4 74.5 74.3<br />
Settings\dave\My Documents\Projects\<strong>BC</strong>TC<br />
2005\Nile Creek Shore Station\Nile Creek<br />
Recorder files\MZ000003_out ambient<br />
ball\MZ000003.WAV<br />
Number of channels: 1<br />
Wave file name: C:\Documents and<br />
Settings\dave\My Documents\Projects\<strong>BC</strong>TC<br />
2005\Nile Creek Shore Station\Nile Creek<br />
Recorder files\MZ000004_out hydr<br />
ball\MZ000004.WAV<br />
Number of channels: 1<br />
Sample rate: 48000<br />
Sample rate: 48000<br />
Bits per sample: 16<br />
Bits per sample: 16<br />
Number of samples: 14417920<br />
Number of samples: 23052288<br />
Duration (min:sec): 0005:00<br />
Start time for analysis: 35 seconds<br />
Stop time for analysis: 45 seconds<br />
Duration (min:sec): 0008:00<br />
SL range correction: 25.0000m<br />
Start time for analysis: 10 seconds<br />
Stop time for analysis: 55 seconds<br />
Frequency dB(F) dB(A)<br />
Frequency dB(F) dB(A) SL(F) SL(A)<br />
---------------------------<br />
---------------------------------------------<br />
10.0 57.8 -14.8<br />
10.0 59.3 -13.3<br />
12.5 57.8 -7.7<br />
12.5 59.3 -6.2<br />
16.0 56.9 -1.9<br />
16.0 59.3 0.5<br />
20.0 57.7 7.3<br />
20.0 59.2 8.8<br />
25.0 59.9 15.2<br />
25.0 60.8 16.1<br />
31.5 56.1 16.7<br />
31.5 56.8 17.4<br />
40.0 50.7 16.1<br />
40.0 53.2 18.6<br />
50.0 50.8 20.6<br />
50.0 51.6 21.4<br />
63.0 44.0 17.8<br />
63.0 46.2 20.0<br />
80.0 45.0 22.5<br />
80.0 47.9 25.4<br />
100.0 51.2 32.1<br />
100.0 47.4 28.3<br />
125.0 47.4 31.3<br />
125.0 45.1 29.0<br />
160.0 37.4 24.0<br />
160.0 36.9 23.5<br />
200.0 39.3 28.4<br />
200.0 37.0 26.1<br />
250.0 33.0 24.4<br />
250.0 30.2 21.6<br />
315.0 30.5 23.9<br />
315.0 29.4 22.8<br />
400.0 30.6 25.8<br />
400.0 33.7 28.9<br />
500.0 32.3 29.1<br />
500.0 34.2 31.0 62.1 58.9<br />
630.0 33.7 31.8<br />
630.0 38.6 36.7 66.5 64.6<br />
800.0 36.4 35.6<br />
800.0 40.5 39.7 68.4 67.6<br />
1000.0 37.1 37.1<br />
1000.0 39.4 39.4 67.4 67.4<br />
1250.0 39.6 40.2<br />
1250.0 40.2 40.8 68.1 68.7<br />
1600.0 38.6 39.6<br />
1600.0 37.4 38.4 65.4 66.4<br />
2000.0 36.6 37.8<br />
2000.0 34.6 35.8<br />
2500.0 33.6 34.9<br />
2500.0 31.5 32.8<br />
3150.0 31.3 32.5<br />
3150.0 28.4 29.6<br />
4000.0 27.0 28.0<br />
4000.0 26.1 27.1<br />
5000.0 25.6 26.1<br />
5000.0 25.8 26.3<br />
6300.0 26.3 26.2<br />
6300.0 26.4 26.3<br />
8000.0 25.7 24.6<br />
8000.0 25.8 24.7<br />
10000.0 25.6 23.1<br />
10000.0 25.8 23.3<br />
12500.0 25.4 21.1<br />
12500.0 25.8 21.5<br />
16000.0 24.5 17.9<br />
16000.0 24.6 18.0<br />
20000.0 24.5 15.2<br />
20000.0 24.3 15.0<br />
Broadband levels<br />
Broadband levels<br />
27
JASCO Research Ltd <strong>BC</strong>TC VITR Project - Atmospheric 2006-03-14<br />
6. Potential Effects – Removal, Construction and Operation of<br />
Submarine Cables and Cable Terminals<br />
It is not anticipated that the on-shore and near-shore construction activities associated with the<br />
removal and installation of the submarine cables will cause a significant increase in audible noise<br />
relative to ambient background noise in the communities along the shoreline. Very near to<br />
shore, shallow draft workboats and diver-operated jetting equipment will be used for cable<br />
handling and burial into the sediment. These boats and equipment are not known to generate high<br />
levels of audible atmospheric noise relative to the observed ambient background noise levels in<br />
the communities along the transmission line ROW. The construction activities that are expected<br />
to take place at the cable terminal stations (e.g. installation of new sun shades on cable<br />
chaseways, modifications to existing chaseways etc) are likewise not expected to generate<br />
excessive noise levels as only light construction equipment will be involved. Furthermore, these<br />
activities will be temporary and of short duration. There will be no air-borne audible noise<br />
associated with operation of the submarine cables. It is not expected that the cable terminals will<br />
generate an increase in audible noise, relative to ambient background noise levels, during the<br />
operation of the transmission line due to the lack of noise generating equipment at the cable<br />
terminals. The only expected noise sources at the cable terminals could include the hydraulic<br />
pumps (discussed above) and potential corona discharges. As discussed in Section 4, corona<br />
noise at the terminals is not expected to generate disturbing noise levels relative to ambient<br />
background noise levels.<br />
7. Potential Effects – Cable-laying and Cable-removal Vessels<br />
The underwater section of the transmission line will require the use of specialized marine vessels<br />
for cable-removal and cable-laying. The vessels will operate in water depths as shallow as 5m<br />
and they may approach to within about a hundred meters of the shoreline depending on the local<br />
bathymetry and coastal profile. Airborne noise from the operation of these vessels (mostly from<br />
winches and other deck mounted equipment) will propagate significantly to the shoreline near<br />
the cable terminal stations only while the vessels are at the nearest point of their approach. This<br />
vessel noise will be temporary and of short duration. The exact specifications of the vessels that<br />
will be used for cable laying and removal, and their maneuvering plans, are not known at this<br />
time.<br />
Modeling was performed to determine the disturbance potential of these activities for residences<br />
along the shoreline, near to the anticipated closest point of approach of the cable vessels. A<br />
distance from shore of 100 metres beyond the 5-m bathymetry line, along the cable route, was<br />
used for the nominal vessel location. Making the reasonable generalization that the airborne<br />
noise generated by the cable vessels will be equally distributed in the frequency bands between<br />
200Hz and 1kHz, JASCO’s atmospheric noise model was run to determine the A-weighted,<br />
broadband level of surface ship noise that will generate sound levels of, at most, 65 dBA at the<br />
location of the nearest residences along the shoreline. The 65 dBA limit was chosen to be a<br />
reasonable level to limit potential disturbance as discussed in Section 3.2. Model results are<br />
shown in the following plots for the communities near the Taylor Bay and Maracaibo terminals.<br />
The results at the Maracaibo terminal clearly demonstrate the attenuation of the sound as it<br />
reaches the shore due to terrain relief.<br />
28
JASCO Research Ltd <strong>BC</strong>TC VITR Project - Atmospheric 2006-03-14<br />
To maintain sound levels at the residences along the shoreline near Taylor Cove below 65 dBA,<br />
the broadband source level of airborne ship noise would have to be below 98 dBA. Because<br />
there are not many dwellings in the immediate nearshore area at Maracaibo, a higher ship source<br />
level of 117 dBA would be acceptable to keep sound levels at the residences this region at or<br />
below 65 dBA.<br />
Figure 20: Atmospheric model results for cable laying/removal vessel noise near Taylor Bay. Contours indicate A-<br />
weighted, broadband sound pressure levels in decibels relative to the standard acoustic reference pressure in air of<br />
20 µPa. Solid black lines indicate the transmission line ROW and black squares indicate residences and other<br />
buildings.<br />
29
JASCO Research Ltd <strong>BC</strong>TC VITR Project - Atmospheric 2006-03-14<br />
Figure 21: Atmospheric model results for cable laying/removal vessel noise near Maracaibo. Contours indicate A-<br />
weighted, broadband sound pressure levels in decibels relative to the standard acoustic reference pressure in air of<br />
20 µPa. Solid black lines indicate the transmission line ROW and black squares indicate residences and other<br />
buildings.<br />
8. Conclusion<br />
Ambient atmospheric noise levels were measured at a number of representative locations in<br />
communities near overhead transmission line right of ways and distribution terminals. From<br />
these, based on similarities of demographics and infrastructure, ambient noise levels were<br />
estimated for communities near submarine cable landfalls and terminals. Maximum measured<br />
hourly levels ranged from 44 dBA at the more rural locations to 64 dBA near urban centres and<br />
thoroughfares. Identifiable sources of noise included street traffic, air traffic, household and yard<br />
noises (radios, lawnmowers, chainsaws etc), dogs barking and - at quieter locations and times -<br />
natural noises such as rustling leaves, crickets, and birds chirping.<br />
Advanced numerical modelling of acoustic propagation in air was used to generate reliable<br />
estimates of noise footprints both from planned construction activities at representative sites or<br />
from the future operation of additional components in existing infrastructures. For ground based<br />
construction activities such as trench excavation and removal or installation of poles the<br />
maximum radius for sound attenuation to a criterion level of 65 dBA (generally considered as<br />
unobtrusive background noise) was found to vary between 200 and 350 m depending on the site.<br />
For tower modification activities involving operation of helicopters down to altitudes of 25 to 45<br />
m above ground – depending on the type of tower – the ranges to 65 dBA can be much longer<br />
especially if propagation takes place over water. Thus a SkyCrane helicopter hovering over a<br />
tower near Montague Harbour on Galiano Island may cause noise levels of 65 dBA as far away<br />
as the north-eastern shoreline of Salt Spring Island at nearly 10 km, but at no more than 3 km<br />
inland from the source. The same operation at 25 m altitude above ground in a hilltop area near<br />
30
JASCO Research Ltd <strong>BC</strong>TC VITR Project - Atmospheric 2006-03-14<br />
Maple Bay, North Cowichan would project noise above 65 dBA to ranges from less than 2 km to<br />
more than 6 km in a complex footprint determined by the rugged terrain relief. The model based<br />
estimation of the incremental change in long-term noise levels near existing infrastructures due<br />
to their upgrading showed the footprints to remain essentially unvaried from the current status.<br />
Numerical modelling also enabled the “inverse” estimation of the maximum tolerable source<br />
level (the nominal noise level that would be measured adjacent to the source) from cable laying<br />
and removal vessels operating near shore if received levels of no more than 65 dBA were to be<br />
maintained at the nearest dwellings. In the case of the Taylor Bay area, where houses are located<br />
close to the cable landfall, a vessel noise source level in air as low as 98 dBA would have to be<br />
ensured to allow shore approach to 100 m outside of the 5m bathymetry line. In the Maracaibo<br />
area, that has sparser distribution of houses in the vicinity of the landfall and a more noise<br />
blocking topography, a source level of 117 dBA would be acceptable for vessel approach to the<br />
same distance from shore.<br />
The potential for noise disturbance arising from other construction and operational sources such<br />
as modification of chaseways at cable terminals, operation of workboats and jetting equipment in<br />
shallow water, hydraulic pumps at cable terminals and corona discharge at overhead lines<br />
insulators was assessed on the basis of existing knowledge or comparison to similar activities<br />
elsewhere. None of these were judged to be significant sources of annoyance to neighbouring<br />
population.<br />
31
JASCO Research Ltd <strong>BC</strong>TC VITR Project - Atmospheric 2006-03-14<br />
9. References Cited<br />
Bonneville Power Administration. 2003. Kangley-Echo Lake <strong>Transmission</strong> Line Project<br />
Supplemental Draft Environmental Impact Statement. January.<br />
http://www.efw.bpa.gov/environmental_services/Document_Library/Kangley-<br />
Echo_Lake/SDEISSummary011403.pdf<br />
Chartier, V.L., D.E. Blair, M.D. Easley and R.T. Raczkowski. 1995. Corona Performance of a<br />
Compact 230-kV Line. IEEE Transactions on Power Delivery 10 (1): 410-420.<br />
IEEE Standard 1127-1998. 1998. IEEE Guide for the Design, Construction and Operation of<br />
Electric Power Substations for Community Acceptance and Environmental Compatibility. IEEE:<br />
USA.<br />
Hepworth Acoustics Ltd. 2004. Update of Noise Database for Prediction of Noise on<br />
Construction and Open Sites. Prepared for the Department for Environment, Food and Rural<br />
Affairs, UK.<br />
True, H.C., and E.J. Rickley. 1977. Noise Characteristics of Eight Helicopters. U.S. Department<br />
of Transportation Report No. FAA-RD-77-94.<br />
Vancouver Port Authority. 2005. Environmental Assessment Application for the Deltaport Third<br />
Berth Project. January.<br />
http://www.portvancouver.com/container_expansion/deltaport/index.html<br />
World Health Organization (WHO). 1999. Guidelines for Community Noise. Edited by: B.<br />
Berglund , T. Lindvall, and D. H. Schwela.<br />
32
JASCO Research Ltd <strong>BC</strong>TC VITR Project - Underwater 2006-03-14<br />
Chapter 2: Underwater Noise Assessment<br />
1. Introduction<br />
Construction activities associated with installation of <strong>BC</strong>TC’s new 230 kV HVAC system<br />
between the Lower Mainland and Vancouver Island will generate underwater noise in<br />
Trincomali Channel and the Strait of Georgia that may harass nearby marine wildlife. Existing<br />
commercial and recreational vessel traffic already produces anthropogenic (man made) noise in<br />
both of these water bodies. This background noise may mask and therefore lower the importance<br />
of the new construction-related noise. A measurement study to quantify existing noise levels has<br />
been performed to determine the relative importance of construction noise in the work areas. A<br />
separate modelling study has been performed to predict noise levels caused by construction<br />
activities associated with cable installations. The results of these analyses can be used to<br />
determine the number of animals potentially impacted by construction of the new HVAC system.<br />
The three primary components of this underwater noise study are outlined below:<br />
1. Measurements of background underwater noise levels were made in both<br />
Trincomali Channel and the Strait of Georgia using a seabed mounted autonomous<br />
acoustic recorder. Broadband and spectral analyses of these measurements were<br />
carried out.<br />
2. The types of equipment that generate highest levels of underwater noise were<br />
identified for construction activities and for operation of the new submarine cables.<br />
Noise emission levels (source levels) for these sources were determined from<br />
measurements made on similar types of equipment.<br />
3. Noise levels in the vicinity of construction locations and near cable routes have<br />
been modelled for submarine cable construction activities in both Trincomali Channel<br />
and the Strait of Georgia.<br />
2. Baseline measurements<br />
2.1. Methodology<br />
In order to determine background levels from existing traffic in Trincomali Channel and the<br />
Strait of Georgia, recordings of underwater ambient noise were performed near planned cable<br />
installation sites using a bottom mounted autonomous recorder system. Baseline background<br />
noise levels were measured in both Trincomali Channel and the Strait of Georgia on two separate<br />
dates, at the two recording locations shown in Figure 1. At each location, a visual log of vessel<br />
traffic past the recording site was taken from a shore-based observation post during daylight<br />
hours.<br />
The autonomous acoustic recorder system, shown schematically in Figure 2, employed a single<br />
calibrated Reson TC4032 hydrophone connected to a Marantz PMD660 digital audio recorder.<br />
Approximately 12 hours of acoustic data were recorded at each site at 44.1 kHz sampling rate<br />
33
JASCO Research Ltd <strong>BC</strong>TC VITR Project - Underwater 2006-03-14<br />
with 16-bits resolution. The acoustic recorder was moored at the seabed with concrete weights.<br />
Following each deployment an acoustic release system triggered from the surface detached the<br />
weights from the recorder, allowing the system to return to the surface for retrieval. The<br />
autonomous recorder was deployed and retrieved from a small survey launch operated by<br />
Coastal Geosciences Ltd of Victoria <strong>BC</strong>.<br />
Figure 1: Map showing dates and locations of ambient noise recordings in Trincomali Channel and the Strait of<br />
Georgia.<br />
t o f l oat s<br />
pr essur e<br />
case<br />
hydr ophone<br />
di gi t al<br />
r ecor der<br />
12: 00<br />
bat t er i es<br />
t o anchor<br />
Figure 2: Diagram of autonomous acoustic recorder system used for making acoustic measurements in Trincomali<br />
Channel and the Strait of Georgia.<br />
34
JASCO Research Ltd <strong>BC</strong>TC VITR Project - Underwater 2006-03-14<br />
Following retrieval of the autonomous recorder, acoustic waveform data were downloaded onto<br />
a PC for subsequent analysis. The recorded signals were processed to determine hourly<br />
equivalent sound pressure level (hourly L eq ) and mean 1/3-octave band levels for daytime and<br />
nighttime intervals. Processed ambient noise data for both Trincomali Channel and the Strait of<br />
Georgia are presented in the following sections.<br />
2.2. Trincomali Channel measurements<br />
Underwater ambient noise levels were measured in Trincomali Channel on Wednesday 17<br />
August 2005 from 11:00 hours to 23:00 hours. Figure 3(a) shows hourly averaged sound<br />
pressure levels in Trincomali Channel over the recording duration. Data prior to 14:00 hours are<br />
not presented due to noise contamination in the recording system caused by strong tidal currents<br />
from 11:00 to 14:00 hours. Figure 3(b) shows mean 1/3-octave band sound pressure levels for<br />
daytime (14:00 to 19:00) and nighttime (19:00 to 23:00) hours. Vessel traffic through<br />
Trincomali Channel decreased significantly at night, resulting in a large difference between<br />
measured daytime and nighttime background levels. During the daytime (before 19:00 hours),<br />
broadband hourly averaged sound levels varied from 107 dB to 123 dB, whereas during the<br />
nightime (after 19:00 hours), broadband hourly averaged sound levels varied from 87 dB to 97<br />
dB. The mean difference between daytime and nighttime broadband levels was 22 dB in<br />
Trincomali Channel. The frequency distribution of noise in Trincomali Channel was such that<br />
ambient levels were greater at mid to high frequencies (above 100 Hz), with the loudest levels<br />
observed in the 500 Hz 1/3-octave band.<br />
By comparing recordings with observation logs, the majority of noise sources were identified as<br />
pleasure boats and fishing boats transiting through Trincomali Channel. Although no ferry<br />
routes pass through the channel, noise from <strong>BC</strong> Ferries ships travelling through nearby Active<br />
Pass also contributed to background levels at the recording site. Other noise sources that were<br />
recorded during the observation period were airplanes flying between Victoria and Vancouver<br />
and a solitary tug towing a log-boom. The 21 dB difference between measured daytime and<br />
nightime ambient levels, and the concentration of noise at higher frequencies, was consistent<br />
with observation that the majority of vessel traffic in Trincomali Channel was composed of small<br />
to mid-size recreational boats.<br />
2.3. Strait of Georgia measurements<br />
Underwater background noise levels were measured in the Strait of Georgia on Thursday, 1<br />
September 2005 from 11:00 to 23:00 hours. Figure 4(a) shows hourly averaged sound pressure<br />
levels in the Strait of Georgia over the recording duration. Figure 4(b) shows mean 1/3-octave<br />
band sound pressure levels for daytime (11:00 to 19:00) and nighttime (19:00 to 23:00) hours.<br />
Measured daytime and nighttime background levels in the Strait of Georgia were approximately<br />
the same; the mean difference between mean daytime and nighttime broadband levels was only 1<br />
dB. The frequency distribution of noise in the Strait of Georgia was such that ambient levels<br />
were greater at low frequencies (below 100 Hz), with the loudest levels observed in the 80 Hz<br />
1/3-octave band.<br />
35
JASCO Research Ltd <strong>BC</strong>TC VITR Project - Underwater 2006-03-14<br />
Figure 3: Trincomali Channel baseline noise level measurements, from Wednesday 17 August 2005. (a) Hourly<br />
equivalent sound pressure level (i.e., 1-hour averaged SPL) versus time. (b) Mean daytime and nighttime 1/3-octave<br />
band levels versus frequency.<br />
Figure 4: Strait of Georgia baseline noise level measurements, from Thursday 1 September 2005. (a) Hourly<br />
equivalent sound pressure level (i.e., 1-hour averaged SPL) versus time. (b) Mean daytime and nighttime 1/3-octave<br />
band levels versus frequency.<br />
36
JASCO Research Ltd <strong>BC</strong>TC VITR Project - Underwater 2006-03-14<br />
By comparing recordings with observation logs, the primary noise sources in the Strait of<br />
Georgia acoustic data were identified as commercial shipping (e.g., bulk carriers, container ships<br />
and barge tugs) and ferries heading to and from Tsawwassen terminal. The Strait of Georgia is<br />
the primary route for ships traveling to and from the Port of Vancouver, a facility that operates<br />
on a 24-hour basis. The negligible difference between daytime and nighttime noise levels and<br />
the concentration of noise at low frequencies was consistent with the observation that the<br />
majority of vessel traffic in the Strait of Georgia was composed of large commercial ships.<br />
3. Construction and operation noise<br />
3.1. Cable construction noise<br />
Removal and installation of existing submarine transmission cables through Trincomali Channel<br />
and the Strait of Georgia will be carried out by a dedicated cable lay ship, except for short<br />
segments in the intertidal zone and in shallow waters where a large vessel cannot operate. In<br />
very shallow water small workboats will be used to pull the cables ashore. Diver operated air<br />
lifting or water jetting equipment will be used to bury the submarine cables in the intertidal zone<br />
and in water less than 3 metres deep.<br />
The primary source of underwater noise during the removal and installation operations is<br />
expected to be the cable laying ship. Shallow water workboats are also expected to generate a<br />
limited amount of noise during the shore pull operations. Trenching noise will not be a factor<br />
during the cable laying since the transmission cables will not be buried below the seabed in deep<br />
water. A literature review has found no published measurements of underwater noise from diver<br />
operated air lifting and water jetting equipment; however, small, diver operated dredging<br />
equipment in shallow water is not expected to radiate significant amounts of underwater noise.<br />
Two cable-lay ships have been identified as possible candidates for the removal and installation<br />
phases of the project: the C/S Bourbon Skagerrak, operated by Nexans Norway AS and the C/S<br />
Giulio Verne operated by Pirelli Cables. Both vessels are dynamic positioning cable lay ships<br />
that utilize a tethered ROV at the seabed for touchdown monitoring. Dynamic positioning (DP)<br />
uses a ship’s thrusters to accurately maintain position to fine tolerances; DP systems are<br />
employed by many different kinds of construction vessels, including cable ships. While dynamic<br />
positioning is active, thrusters are the primary source of noise radiated from a ship; thruster noise<br />
is therefore expected to dominate the radiated noise field during the cable removal and cable<br />
installation operations.<br />
37
JASCO Research Ltd <strong>BC</strong>TC VITR Project - Underwater 2006-03-14<br />
3.2. Cable operation noise<br />
The new 230 kV submarine cables are expected to produce 120 Hz tonal vibration noise in the<br />
water, since Coulomb forces between the conductors will cause the high voltage AC lines to<br />
vibrate at twice the frequency of the current (Zabar, 1992). The precise noise levels that would<br />
be generated by the new 230 kV cables cannot be predicted since their electro-acoustic transfer<br />
characteristics are unknown. However, low level tonal noise from the existing 138 kV<br />
transmission lines was measured in Trincomali Channel during a very quiet period of recording:<br />
the sound pressure level at a distance of approximately 100 metres from one of the cables was<br />
just under 80 dB re µPa (see Figure 5). Thus, assuming cylindrical spreading of sound (which is<br />
the appropriate spreading law for a line source) the source level of the existing submarine cables<br />
is approximately 100 dB re µPa@1m. The new 230 kV submarine cables will be operating at a<br />
higher voltage than the existing lines so that, for a comparable electrical power demand, they<br />
will carry proportionately less current. Thus, the 120 Hz vibration in the new cables is expected<br />
to be lower in amplitude because the Coulomb forces that cause the vibration are proportional to<br />
the transmission line current (Zabar, 1992). On the basis of reasonable assumptions, therefore,<br />
the acoustic source level of the new submarine cables will not be higher than that of the existing<br />
cables.<br />
The only other source of noise associated with the operation of the submarine cables is the shore<br />
terminals. The shore terminals operate in air and are not expected to introduce detectable levels<br />
of noise into the underwater environment since the acoustic coupling between air and water is<br />
poor for an inshore based noise source.<br />
Figure 5: Spectrum of 120 Hz tonal noise versus frequency recorded ~100 metres from existing 138 kV submarine<br />
cables.<br />
38
JASCO Research Ltd <strong>BC</strong>TC VITR Project - Underwater 2006-03-14<br />
4. Noise Modelling<br />
4.1. Methodology<br />
Propagation of noise from submarine cable construction activities in Trincomali Channel and the<br />
Strait of Georgia has been modelled using JASCO Research Ltd’s Marine Operations Noise<br />
Model (MONM). MONM computes acoustic propagation for arbitrary 3-D, range-varying<br />
acoustic environments via a wide-angled parabolic equation (PE) solution to the acoustic wave<br />
equation. The parabolic equation code in MONM is based on the U.S. Naval Research<br />
Laboratory’s Range-dependent Acoustic Model (RAM), which has been extensively<br />
benchmarked for accuracy and is widely employed in the underwater acoustics community<br />
(Collins, 1993). MONM computes acoustic fields in 3-D by modelling transmission loss along<br />
evenly spaced radial traverses covering a 360º swath from the source (so-called N×2-D<br />
modelling). MONM makes use of several types of environmental data including bathymetry,<br />
sound speed profiles and geoacoustic profiles. The spatial sampling of the acoustic environment<br />
along model traverses was on a 50 m range step. Frequency dependence of the sound<br />
propagation characteristics was treated by computing acoustic transmission loss at the center<br />
frequencies of all 1/3-octave bands between 10 Hz and 2 kHz. Received sound pressure level in<br />
each band was computed by applying frequency-dependent transmission losses to the<br />
corresponding 1/3-octave band source levels. This approach has been validated against<br />
experimental data and has proven to be highly accurate for predicting noise levels in vicinity of<br />
industrial operations (Hannay and Racca, 2005).<br />
Bathymetry data for Trincomali Channel and the Strait of Georgia were obtained from the<br />
Canadian <strong>Hydro</strong>graphic Service Environmental Dataset for Southern Vancouver Island.<br />
Latitude/longitude point bathymetry data were converted to UTM (zone 10) coordinates and<br />
interpolated onto a regular x/y grid at 200 metres resolution. Figure 6 shows a map rendering of<br />
the resulting bathymetry grid that was used for the acoustic propagation modelling.<br />
Historical temperature/salinity profiles for the Strait of Georgia were analyzed to derive a<br />
representative sound speed profile for the months of August and September. The DFO Institute<br />
of Ocean Sciences (Patricia Bay) Ocean Sciences division provided approximately 200<br />
temperature/salinity casts for the period from 2000 to 2004, on which the analysis was based.<br />
Temperature/salinity data were converted to sound speed in seawater (Coppens, 1981) and then<br />
decomposed in terms of a set of derived variables using the statistical technique of principal<br />
component analysis (PCA) (Davis, 1976). A single representative sound speed profile for the<br />
Strait of Georgia, shown in Figure 7, was then computed from the principal value decomposition<br />
using the most frequently occurring values for the derived variables.<br />
Geoacoustic properties for the seabed in the Strait of Georgia and Trincomali Channel were<br />
derived from published sedimentary geology for the Strait of Georgia (Barrie & Hill, 2004). For<br />
the acoustic modelling, the ocean-bottom was assumed to consist of a thick layer of Holocene<br />
river sediments over a basement of sedimentary rock. The geoacoustic properties of these<br />
materials, including compressional speed (c p ), density (ρ), shear speed (c s ) and attenuation (α p ,<br />
α s ) were estimated based on typical values from the literature (Hamilton, 1980). Table 1 shows<br />
the resulting geoacoustic profiles used by MONM for the acoustic modelling.<br />
39
JASCO Research Ltd <strong>BC</strong>TC VITR Project - Underwater 2006-03-14<br />
Representative acoustic source levels for a cable ship were required in order to model the noise<br />
field generated by the cable removal and installation operations. A review of the available<br />
literature found no published source levels for a cable ship. The most representative among the<br />
available source measurements were 1/3-octave band source levels for a dynamic positioning<br />
rock dumping vessel, the Pompei (Hannay et al. 2004). The Pompei’s dynamic positioning<br />
source levels were therefore used as an analogue for a cable ship’s source level. Acoustic source<br />
levels for cable laying and cable removal were assumed to be the same, since the operation of<br />
ship’s thrusters would be similar during both operations. Figure 8 shows the nominal 1/3-octave<br />
band source levels for the dynamic positioning cable lay vessel that were used for the acoustic<br />
modelling. The nominal broadband acoustic source level for the cable ship was 177.0 dB re<br />
µPa@1m.<br />
To model shore pull operations in shallow water, 1/3-octave band acoustic source levels for a 9-<br />
metre workboat, the Yamaha FC-26 (Hannay et al. 2004), were used as a representative<br />
analogue. Figure 8 shows the nominal 1/3-octave band source levels for the small workboat that<br />
were used for the acoustic modelling. The nominal broadband acoustic source level for the small<br />
workboat was 156.9 dB re µPa@1m.<br />
Figure 6: Contour plot of Southern Vancouver Island bathymetry grid used by MONM for acoustic propagation<br />
modelling.<br />
Table 1: Seabed geoacoustic parameters used for the acoustic modelling in the Strait of Georgia and Trincomali<br />
Channel.<br />
Material Depth (m) c p (m/s) ρ (g/cc) c s (m/s) α p (dB/λ) α s (dB/λ)<br />
Sediments 0 1.511 1.488 0.151 0.111 2.599<br />
Sediments 40 1.563 1.488 0.156 0.292 2.688<br />
Basement 40 2.100 2.095 0.210 0.292 2.688<br />
Basement 500 2.606 2.211 0.261 0.292 2.688<br />
40
JASCO Research Ltd <strong>BC</strong>TC VITR Project - Underwater 2006-03-14<br />
Figure 7: Plot of sound speed versus depth derived from historical temperature/salinity data from the Strait of<br />
Georgia.<br />
Figure 8: Plot of nominal 1/3-octave band source levels versus frequency for a dynamic positioning cable-lay vessel<br />
and a small workboat.<br />
41
JASCO Research Ltd <strong>BC</strong>TC VITR Project - Underwater 2006-03-14<br />
4.2. Construction Noise Modelling Results<br />
4.2.1. Cable ship<br />
Noise propagation from a cable ship performing cable lay and removal activities was modelled at<br />
several locations in the Strait of Georgia and Trincomali Channel along the projected cable route.<br />
The modelling sites for cable lay and removal activities included three locations in the Strait of<br />
Georgia and one location in Trincomali Channel. The source positions for these sites are the<br />
central points of the concentric noise level contours (isopleths) presented in Figure 9 through<br />
Figure 12. The acoustic source was positioned along the planned cable route in all cases. Noise<br />
level contours in 5 dB increments are shown for a receiver at 50 metres depth, or at the seabottom<br />
where the water is shallower than 50 metres. Noise levels are unweighted, broadband<br />
sound pressure levels expressed in decibels referenced to 1 µPa.<br />
Table 2 lists the 95% range to the 130 dB, 120 dB and 110 dB noise level contours for the cable<br />
lay and removal scenarios. The 95% range is defined as the distance from the source that<br />
encompasses 95% of a particular noise contour area and provides a reasonable estimate of the<br />
typical distance from the source at which this noise level will be encountered. The ranges given<br />
in Table 2 are useful for estimating the number of marine animals that may be affected by noise<br />
from submarine cable construction activities. For example, playback studies in the wild have<br />
observed that Gray Whales exposed to continuous noise levels in excess of 120 dB exhibited<br />
50% probability of avoidance (Malme et al. 1988).<br />
4.2.2. Small workboat<br />
Representative noise propagation from a small workboat performing shore pull operations was<br />
modelled at a single shallow water location on Roberts Bank, as shown in Figure 13. The<br />
acoustic source representing this vessel was positioned along the cable route at the 3-metre<br />
isobath. As with the cable ship, unweighted, broadband noise level contours are shown in 5 dB<br />
increments for 50 metres receiver depth (or at the sea-bottom). This source was considerably<br />
quieter than the cable ship: the 95% range to the 110 dB contour was only 110 metres. Thus,<br />
small workboat activities are not expected to be an important consideration with regards to the<br />
effects of construction noise on marine wildlife.<br />
Table 2: Listing of 95% ranges to the 130 dB, 120 dB and 110 dB (re µPa) noise level contours for the cable lay and<br />
removal modelling scenarios (cf., Figures 9–12).<br />
Source Location<br />
95% Range (km)<br />
130 dB 120 dB 110 dB<br />
Cable ship Strait of Georgia (Loc 1) 0.35 2.32 14.78<br />
Cable ship Strait of Georgia (Loc 2) 0.41 3.00 16.65<br />
Cable ship Strait of Georgia (Loc 3) 0.50 3.45 17.84<br />
Cable ship Trincomali Channel 0.26 3.36 6.51<br />
Mean 0.38 3.03 13.95<br />
42
JASCO Research Ltd <strong>BC</strong>TC VITR Project - Underwater 2006-03-14<br />
Figure 9: Underwater noise level contours for a cable ship performing cable lay/cable removal in the Strait of<br />
Georgia. Acoustic source is located approximately 5.4 km from Taylor Bay terminal along the planned cable route.<br />
Noise levels are shown for a receiver at 50 metres depth (or at the sea-bottom where the water is shallower). Noise<br />
levels are unweighted, broadband sound pressure levels given in decibels referenced to 1 µPa.<br />
43
JASCO Research Ltd <strong>BC</strong>TC VITR Project - Underwater 2006-03-14<br />
Figure 10: Underwater noise level contours for a cable ship performing cable lay/cable removal in the Strait of<br />
Georgia. Acoustic source is located in mid-channel along the planned cable route. Noise levels are shown for a<br />
receiver at 50 metres depth (or at the sea-bottom where the water is shallower). Noise levels are unweighted,<br />
broadband sound pressure levels given in decibels referenced to1 µPa.<br />
44
JASCO Research Ltd <strong>BC</strong>TC VITR Project - Underwater 2006-03-14<br />
Figure 11: Underwater noise level contours for a cable ship performing cable lay/cable removal in the Strait of<br />
Georgia. Acoustic source is located approximately 5.6 km from English Bluff terminal along the planned cable<br />
route. Noise levels are shown for a receiver at 50 metres depth (or at the sea-bottom where the water is shallower).<br />
Noise levels are unweighted, broadband sound pressure levels given in decibels referenced to 1 µPa.<br />
45
JASCO Research Ltd <strong>BC</strong>TC VITR Project - Underwater 2006-03-14<br />
Figure 12: Underwater noise level contours for a cable ship performing cable lay/cable removal in Trincomali<br />
Channel. Acoustic source is located in mid-channel along the planned cable route. Noise levels are shown for a<br />
receiver at 50 metres depth (or at the sea-bottom where the water is shallower). Noise levels are unweighted,<br />
broadband sound pressure levels given in decibels referenced to 1 µPa.<br />
46
JASCO Research Ltd <strong>BC</strong>TC VITR Project - Underwater 2006-03-14<br />
Figure 13: Underwater noise level contours for a small workboat performing cable pull on Roberts Bank. Acoustic<br />
source is located along the cable route at the 3 metre isobath approximately 1.3 km from English Bluff terminal.<br />
Noise levels are shown for a receiver at 50 metres depth (or at the sea-bottom where the water is shallower). Noise<br />
levels are unweighted, broadband sound pressure levels given in decibels referenced to 1 µPa.<br />
47
JASCO Research Ltd <strong>BC</strong>TC VITR Project - Underwater 2006-03-14<br />
5. Conclusion<br />
Underwater ambient noise levels were measured near planned cable installation sites in both<br />
Trincomali Channel and the Strait of Georgia. Analysis of the acoustic data confirmed that<br />
ambient levels at both locations were dominated by noise from surface vessels. The character of<br />
the noise field was observed to be quite different at the two locations due to the different kinds of<br />
vessels utilizing the two channels; traffic in the Strait of Georgia was mainly composed of<br />
commercial shipping and ferries, whereas traffic through Trincomali Channel consisted mostly<br />
of small to mid-sized pleasure boats. Average daytime and nighttime ambient levels in<br />
Trincomali Channel were 115 dB and 93 dB, respectively, whereas average daytime and<br />
nighttime ambient levels in the Strait of Georgia were 114 dB and 113 dB, respectively. The<br />
large difference between daytime and nighttime levels in Trincomali Channel was due to the<br />
sharp decrease in the amount of vessel traffic passing through the channel at night. Nighttime<br />
ambient levels remained high in the Strait of Georgia due to a constant rate of shipping traffic to<br />
and from the Port of Vancouver. Ambient levels in Trincomali Channel were greater at mid to<br />
high frequencies, above 100 Hz, whereas ambient levels in the Strait of Georgia were greater at<br />
low frequencies, below 100 Hz. The frequency distribution of noise was consistent with the<br />
primary types of vessel traffic utilizing the two water bodies: pleasure boats in Trincomali<br />
Channel and large commercial shipping in the Strait of Georgia.<br />
The dynamic positioning cable lay vessel was identified as the primary source of noise from<br />
submarine cable removal and installation activities. Underwater noise propagation from a cable<br />
lay vessel was modelled at several locations in both Trincomali Channel and the Strait of<br />
Georgia: average 95% ranges from the cable ship to the 130 dB, 120 dB and 110 dB noise level<br />
contours were 0.38 km, 3.03 km and 13.95 km, respectively. In addition, noise propagation from<br />
a single workboat was modelled on Roberts Bank: the 95% range from the workboat to all noise<br />
level contours >110 dB was less than 110 metres. Underwater noise generated by the<br />
construction vessels will be similar to that of other ships and boats (e.g., pleasure boats, fishing<br />
vessels, tugs and container ships) already operating in these areas. It was also estimated that 120<br />
Hz tonal acoustic noise from operation of the new 230 kV submarine cables will not be<br />
substantially higher than that of the existing cables, which at about 100 dB re 1µPa source level<br />
is not cause for environmental concern.<br />
48
JASCO Research Ltd <strong>BC</strong>TC VITR Project - Underwater 2006-03-14<br />
6. References Cited<br />
Barrie, J.V. and P.R. Hill. 2004. Holocene faulting on a tectonic margin: Georgia Basin, British<br />
Columbia, Canada. Geo-Marine Letters 24: 86-96.<br />
Collins, M.D. 1993. A split-step Pade solution for the parabolic equation method. Journal of the<br />
Acoustical Society of America. 93: 1736–1742.<br />
Coppens, A.B. 1981. Simple equations for the speed of sound in Neptunian waters. Journal of<br />
the Acoustical Society of America. 69: 862-863.<br />
Davis, R.E. 1976. Predictability of sea surface temperature and sea level pressure anomalies over<br />
the North Pacific Ocean. Journal of Physical Oceanography 6: 249-266.<br />
Hamilton, E. 1980. Geoacoustic modeling of the sea floor. Journal of the Acoustical Society of<br />
America 68: 1313-1340.<br />
Hannay, D., A. MacGillivray, M. Laurinolli and R. Racca. 2004. Source Level Measurements<br />
from 2004 Acoustics Program. Prepared by JASCO Research Ltd. for Sakhalin Energy<br />
Investment Company.<br />
Hannay, D. and R. Racca. 2005. Acoustic Model Validation. Prepared by JASCO Research Ltd.<br />
for Sakhalin Energy Investment Company. Document # 0000-S-90-04-P-7058-00.<br />
Malme, C.I., B. Würsig, J.E. Bird and P. Tyack. 1988. Observations of feeding gray whale<br />
responses to controlled industrial noise exposure. pp. 55-73. In: W.M. Sackinger, M.O. Jefferies,<br />
J.L. Imm and S.D. Treacy (eds.) Vol. 2. Port and Ocean Engineering under Arctic Conditions.<br />
University of Alaska, Fairbanks, AK. 111pp.<br />
Zabar, Z., L. Birenbaum, B.R. Cheo, P.N. Joshi and A. Spagnolo. 1992. A detector to identify a<br />
de-energized feeder among a group of live ones. IEEE Transactions on Power Delivery. 7: 1820-<br />
1824.<br />
49