
Understanding customers’ perceptions of your brand or product is important, especially in marketing decisions. Customer surveys will usually give you data on how customers think about your product. However, a perceptual map gives you a visual picture of how your brand compares to competitors. In this article, we will define a perceptual map, provide several perceptual map examples, and explain an easy way of building one yourself. Let's dive in.
What Is a Perceptual Map
A perceptual map is a diagram that businesses use to map out how their customers perceive different products, items, or brands. In this sense, a perceptual map is a diagram that a business uses to illustrate the position of its product or service along with its competitors in specified parameters.
Types of Perceptual Maps
You can display perceptual maps in various ways, ranging from simple representations of two attributes to more complex maps for cross-referencing an array of attributes. Based on how the data is presented, perceptual maps can be classified into 5 main types:
- Two-Dimensional Perceptual Maps– Plots two different dimensions of a product or brand on axes. Two-dimensional perceptual map examples include a clothing brand mapping its perceptions along the lines of “fashion forward” and “expensive” and their opposites in relation to other brands.
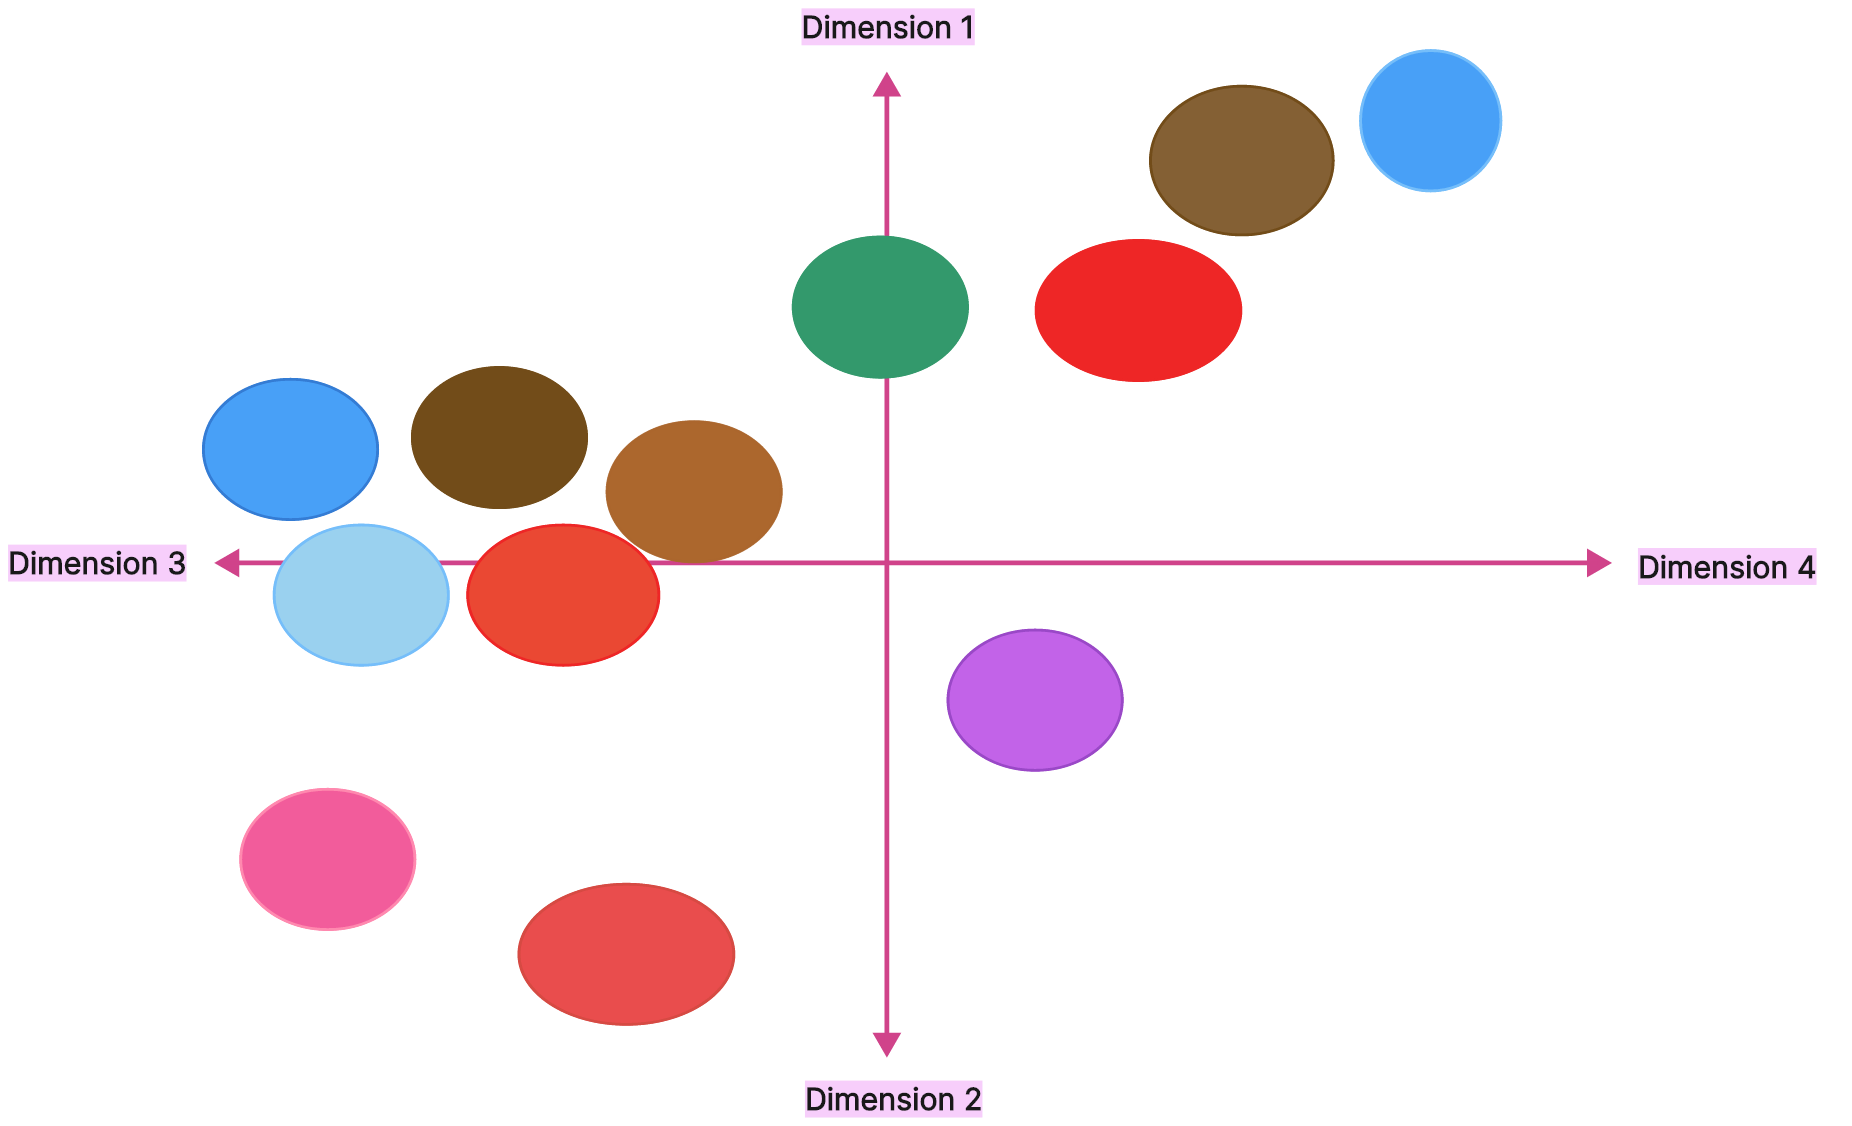
- Multidimensional Perceptual Map– Uses several present dimensions instead of just two, creating a scattered set of dimensions on which the products or brands are placed. Multidimensional perceptual map examples include dinner options where ordering food is fast and convenient but lacks nutritional value while cooking at home is tasty with high nutrition value and fairly affordable.
- Spidergram Perceptual Maps– Considers many dimensions, but it does not imply tradeoffs. In the dinner example, a spidergram considers that each option can have shared qualities.
- Joint Perceptual Maps– These are two-dimensional axes-based maps, which layer on market segments based on available data. Joint perceptual map examples may include alcoholic options for men with demographic layers such as age and gender and preferences such as calories and choice of drink.
- Intuitive Perceptual Maps– Similar to two-dimensional perceptual maps, but they are informed by the map creator’s knowledge of the industry and customer base.
Perceptual Map Examples
Let us now look at some good perceptual map marketing examples, and brand perceptual map examples.
Perceptual Map Example in Marketing – 01
View more perceptual map examples in marketing
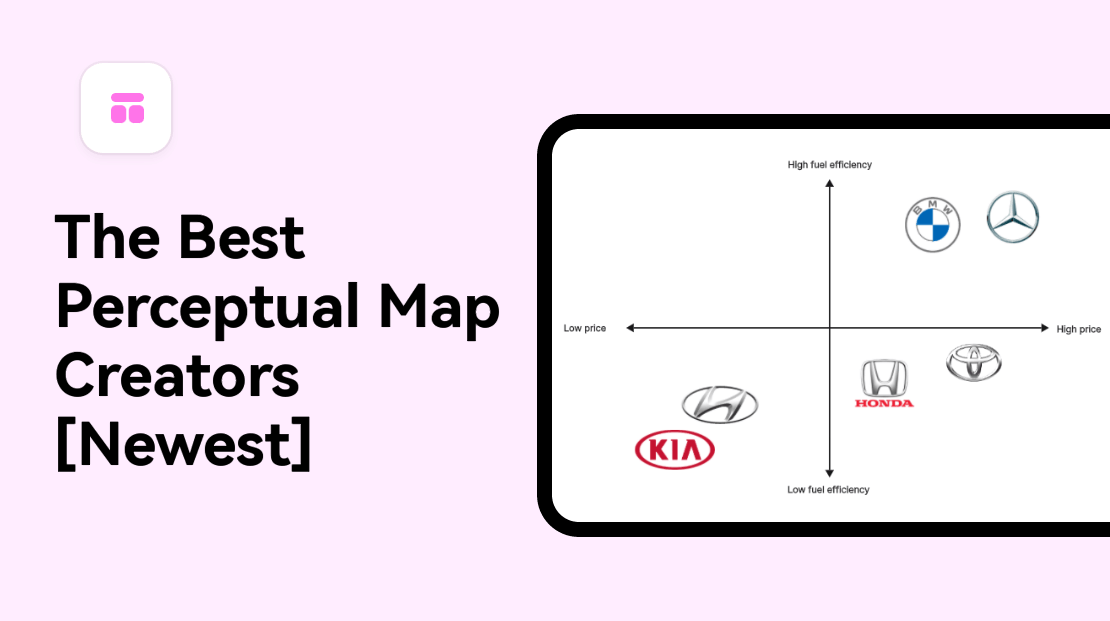
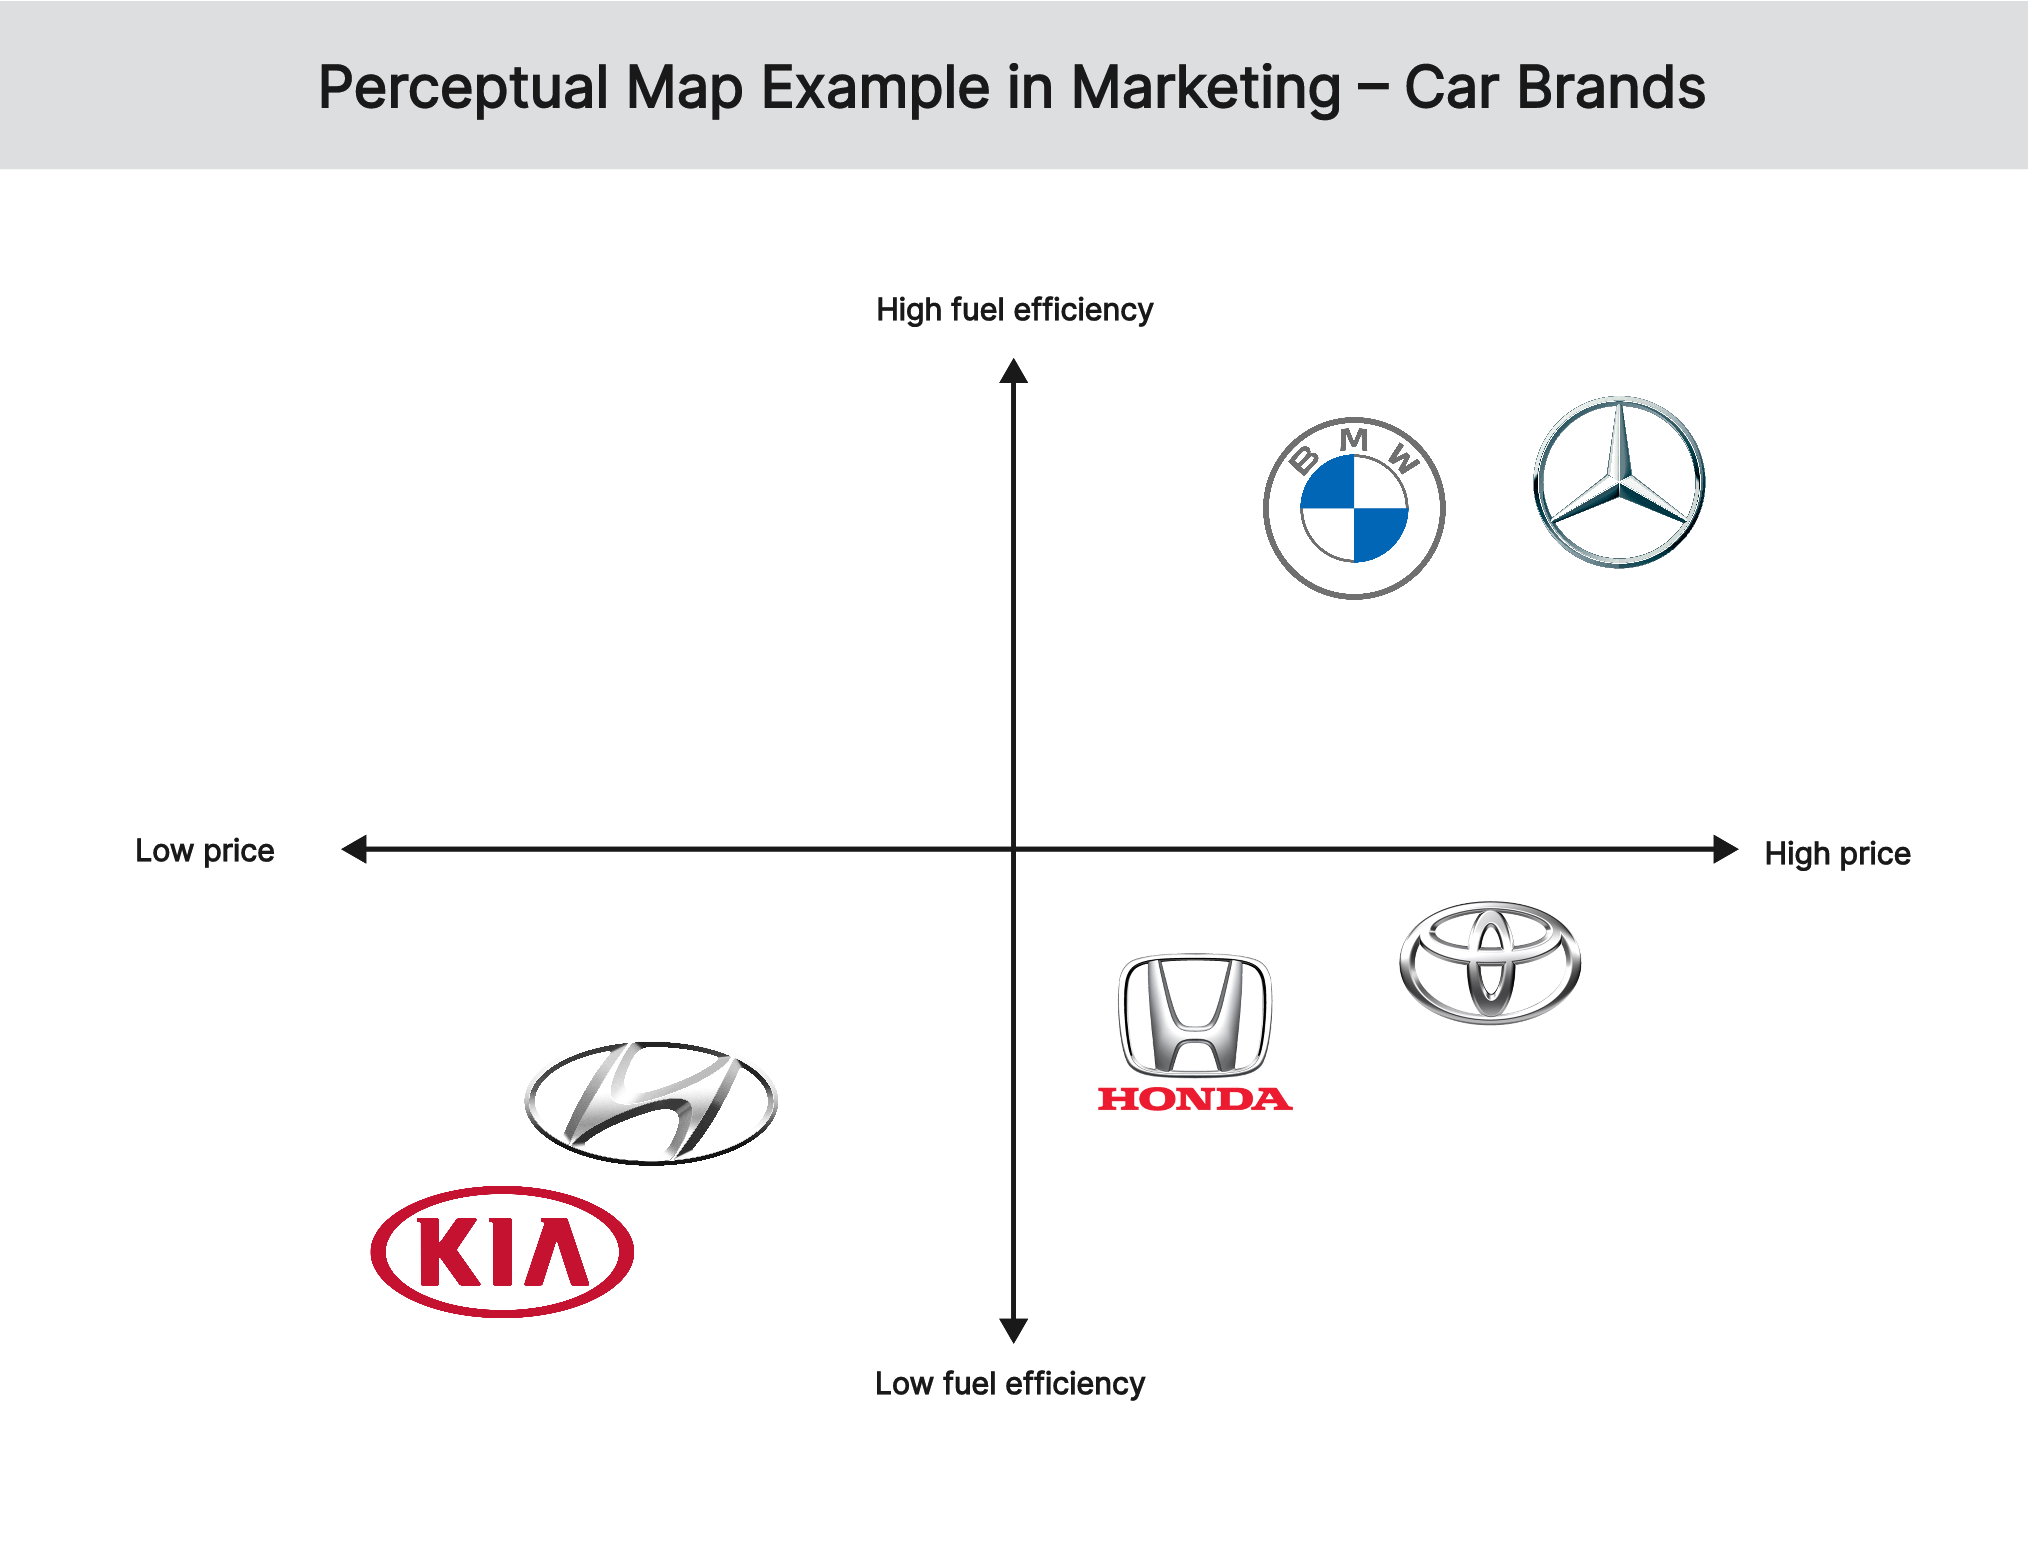
Let’s consider a perception map that shows the positioning of different car brands based on their price and fuel efficiency. In this perceptual map, luxury car brands, such as BMW and Mercedes-Benz are positioned at the top. Most customers perceive such luxury brands as having high prices and high fuel efficiency. On the other hand, budget car brands like Hyundai and Kia are positioned at the bottom of the perceptual map. Customers perceive these to have low prices and low fuel efficiency. For mid-range car brands like Honda and Toyota, they are positioned in the middle to align with the perception of moderate prices and fuel efficiency.
Perceptual Map Example in Marketing – 02
View more perceptual map examples in marketing
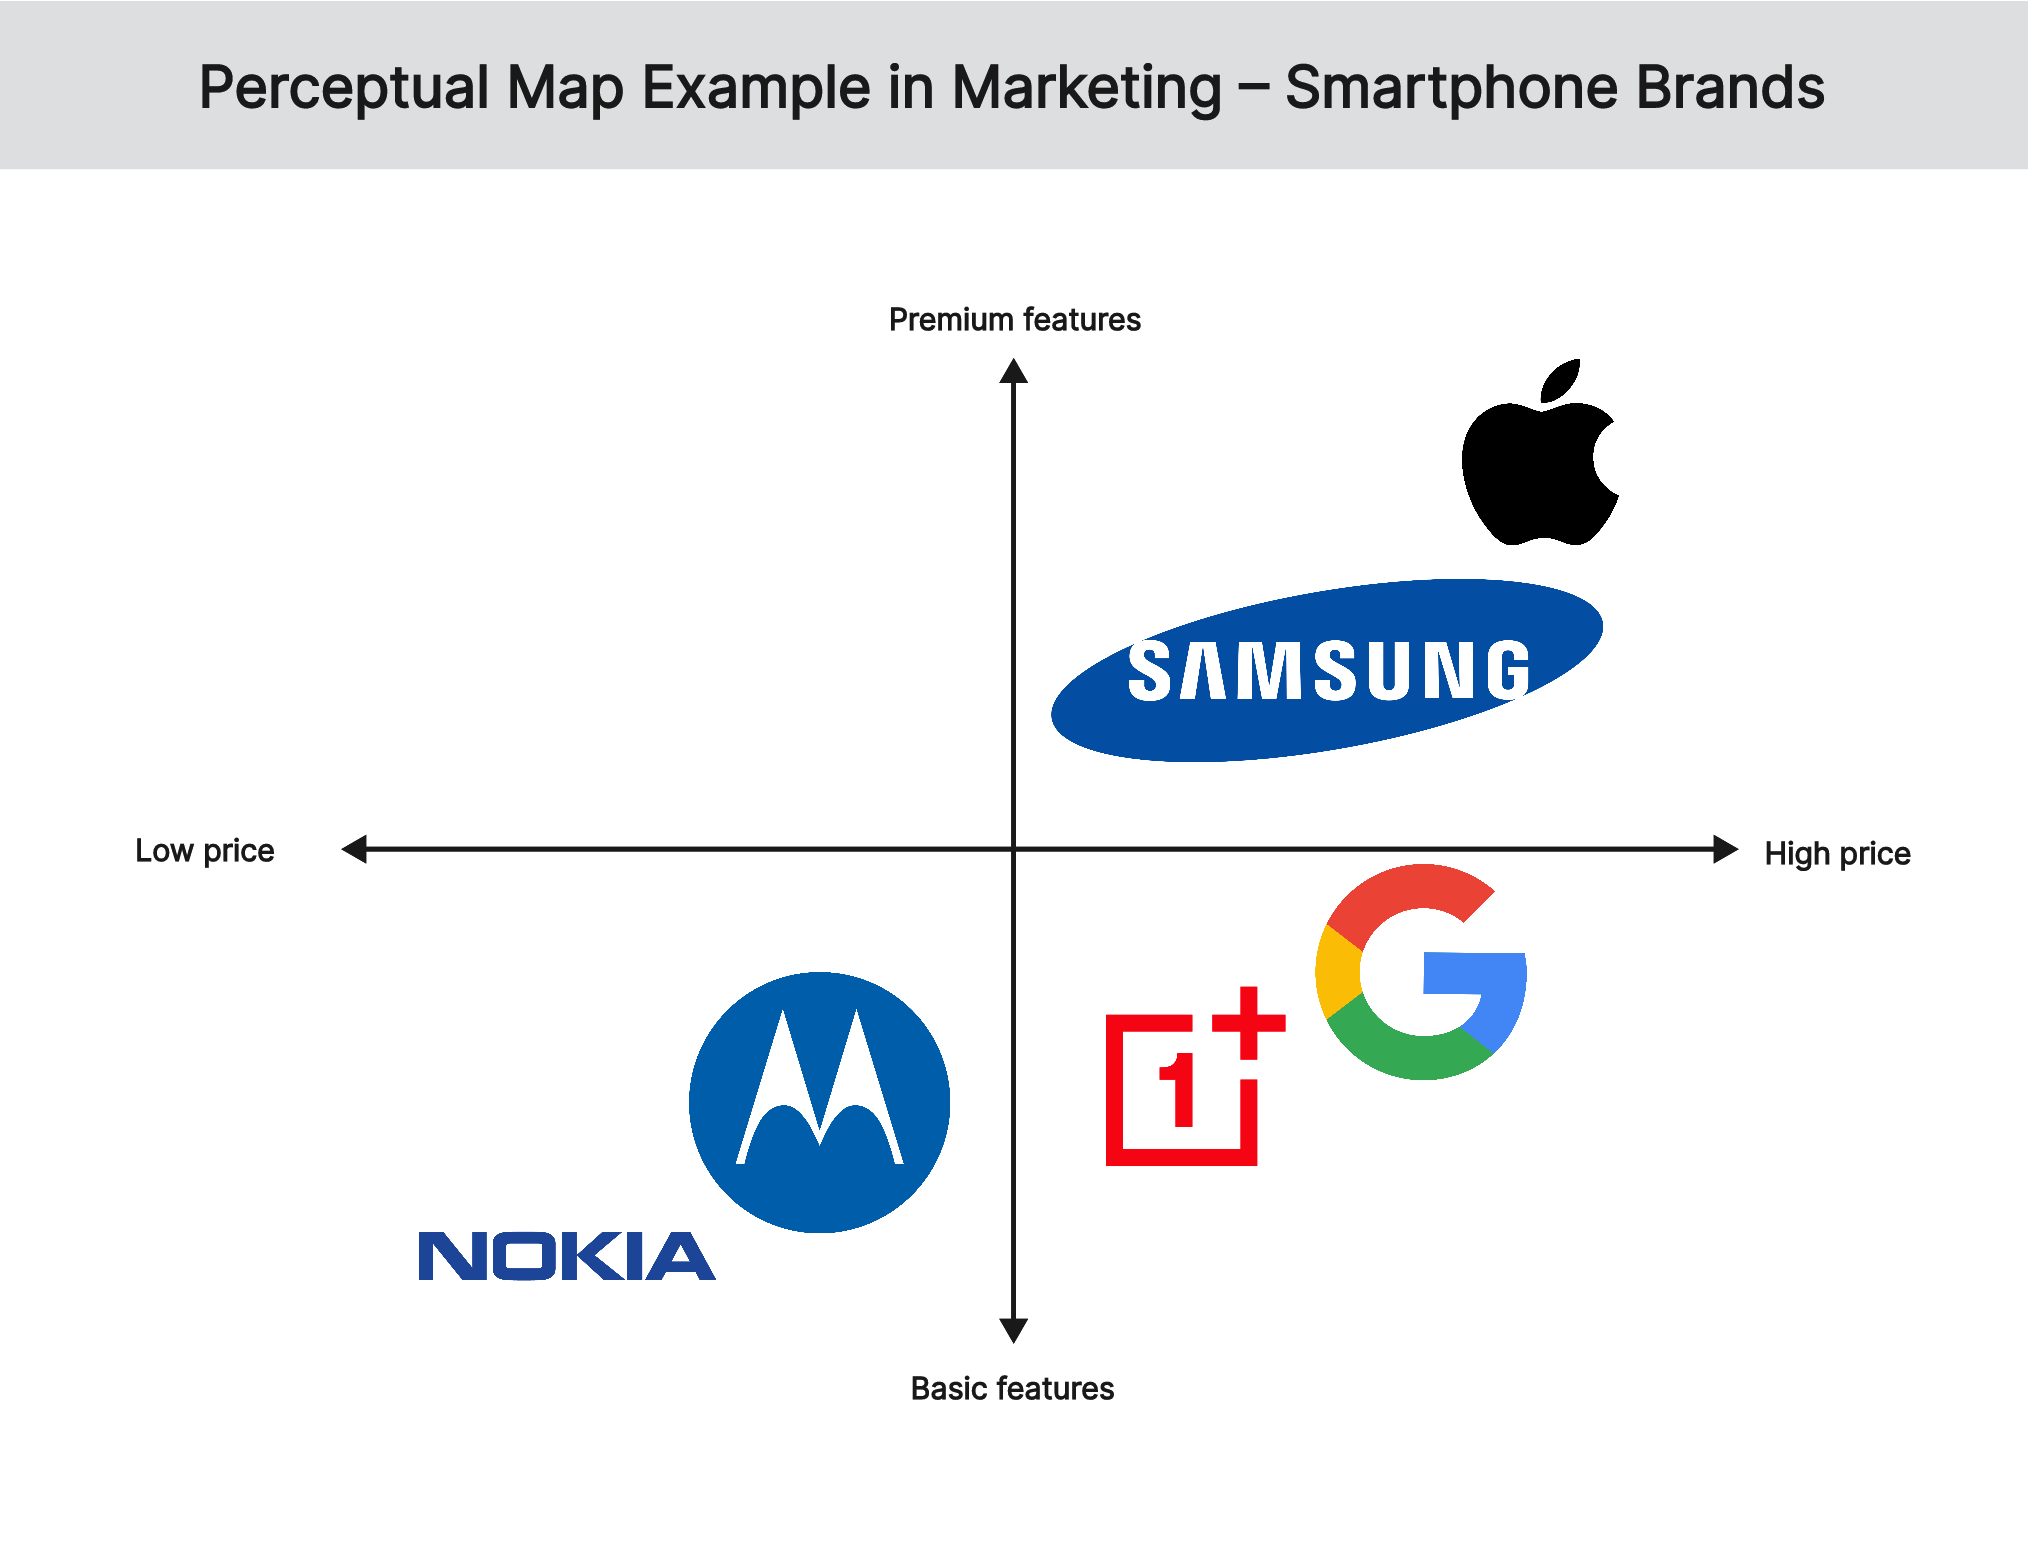
In the second perceptual map marketing example, the positioning of smartphone brands is presented based on their price and features. The Apple iPhone and Samsung Galaxy are positioned at the top of the map to reflect their high prices and premium features, while Nokia and Motorola are at the bottom of the map with their low prices and basic features. The Google Pixel and OnePlus phones are positioned in the middle to reflect their moderate prices and mid-range features.
Perceptual Map Example in Marketing – 03
View more perceptual map examples in marketing
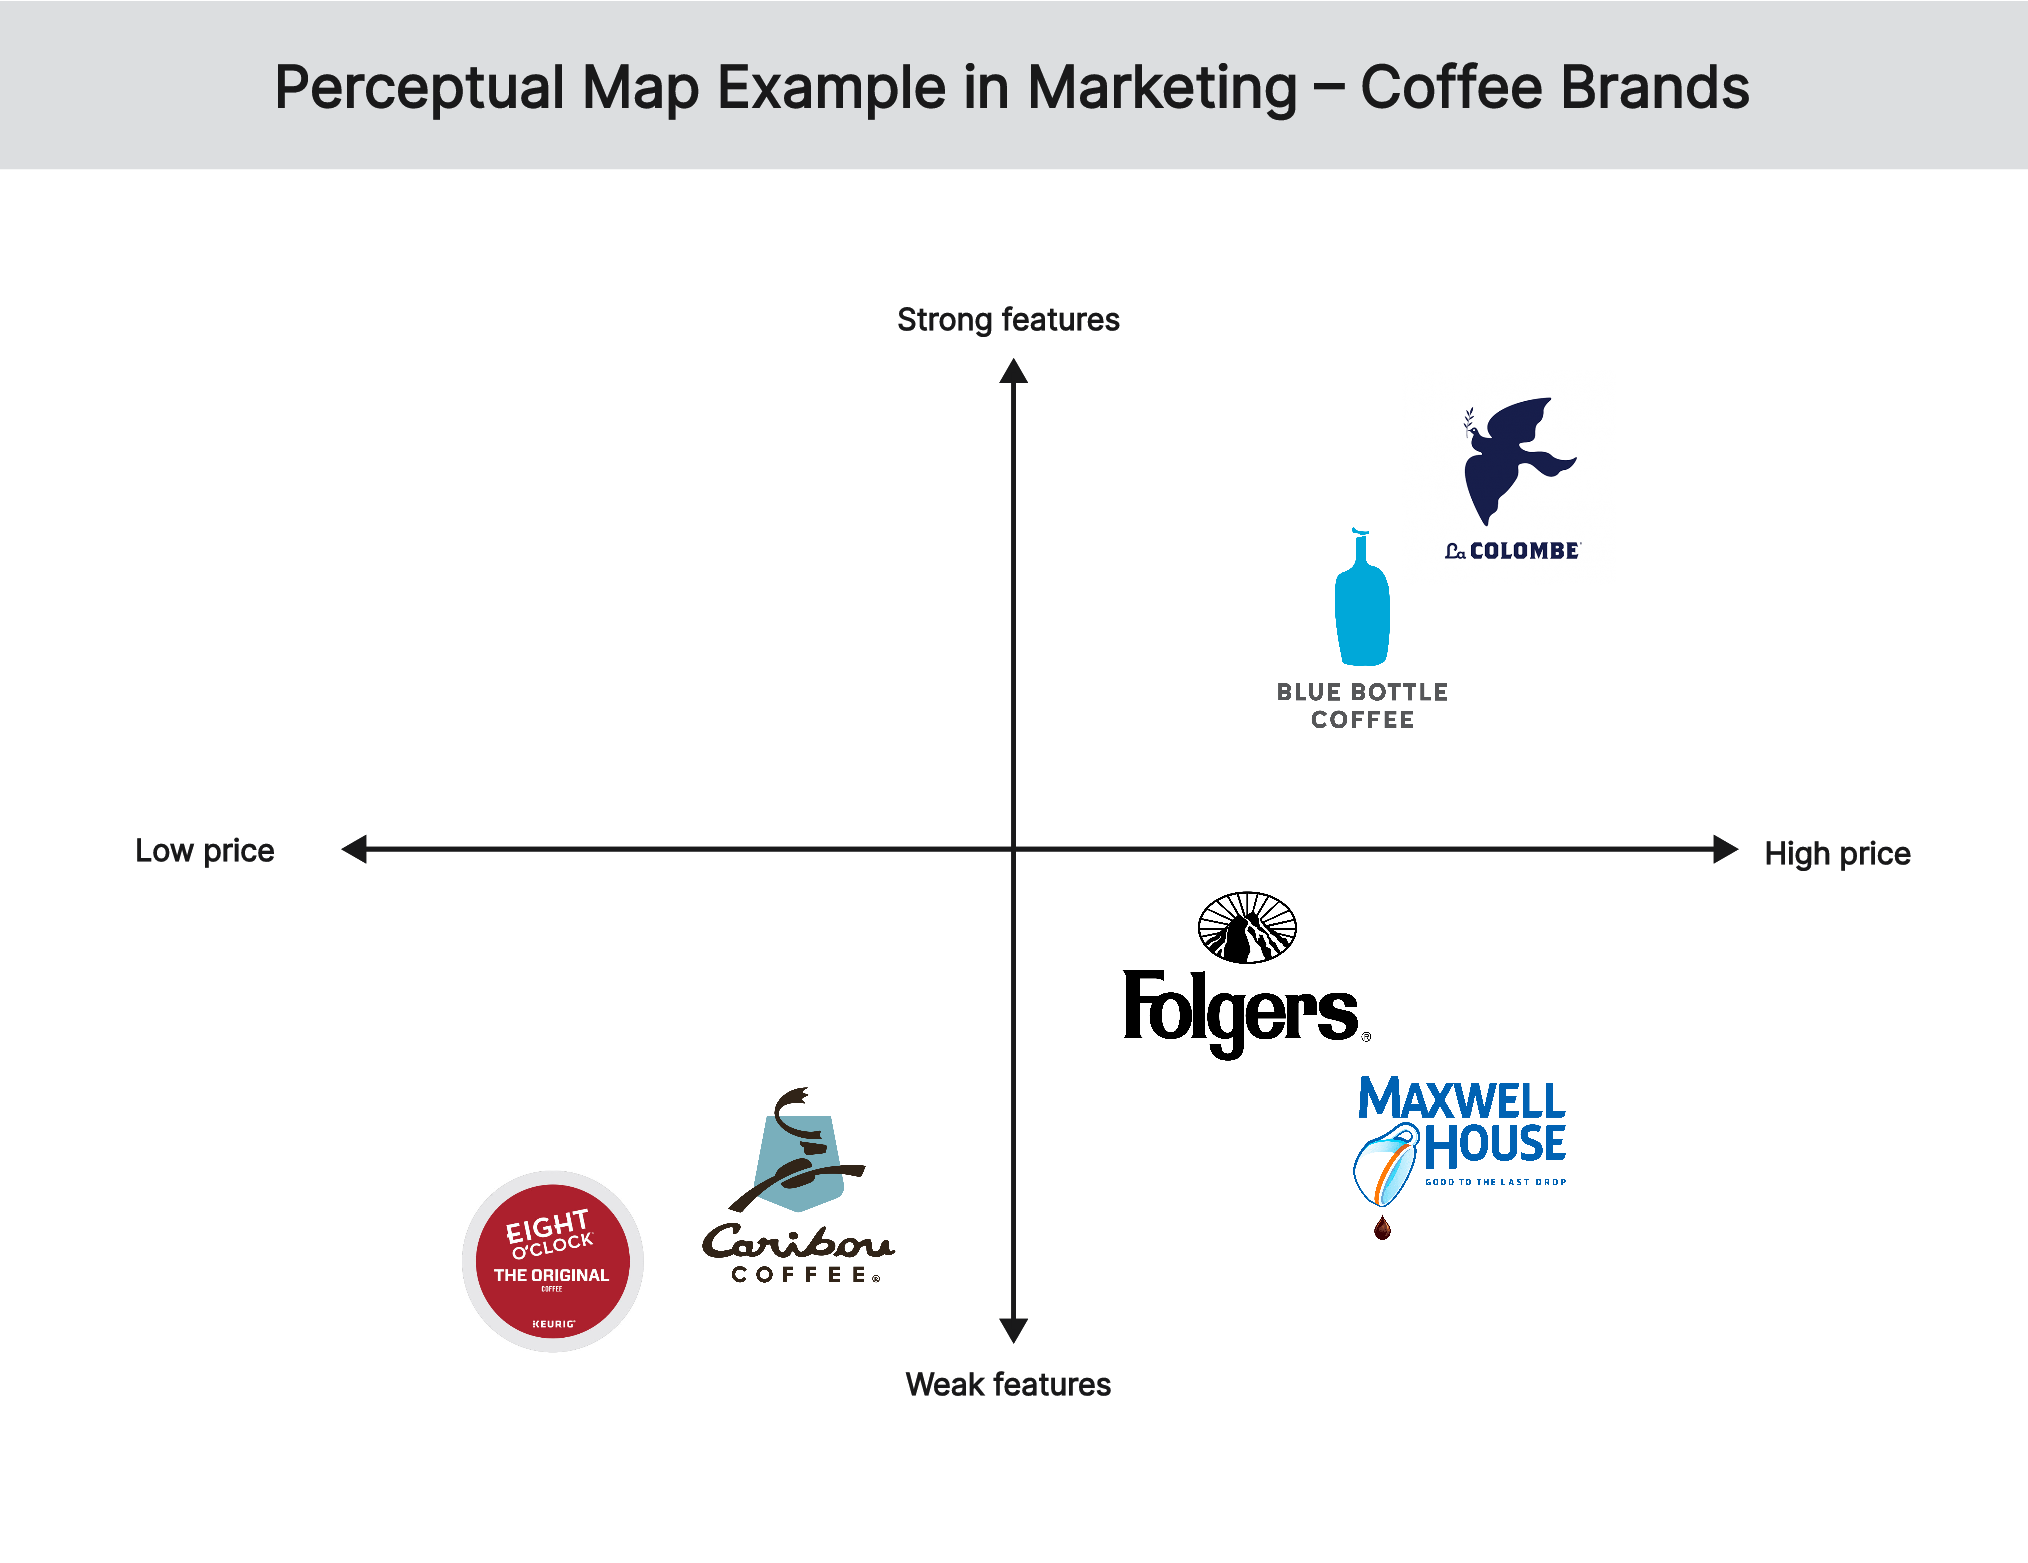
The third perceptual map marketing example represents the position of coffee brands in the market based on their prices and tastes. At the top of the map are La Colombe Single Origin Coffee and Blue Bottle Coffee because of their strong taste and high prices while Caribou Coffee and Eight O’clock Coffee are positioned at the bottom to reflect their weak taste and low prices. At the middle of the map are Folgers and Maxwell House, which are characterized by moderate taste and moderate prices.
Brand Perceptual Map Example – 01
View more brand perceptual map examples
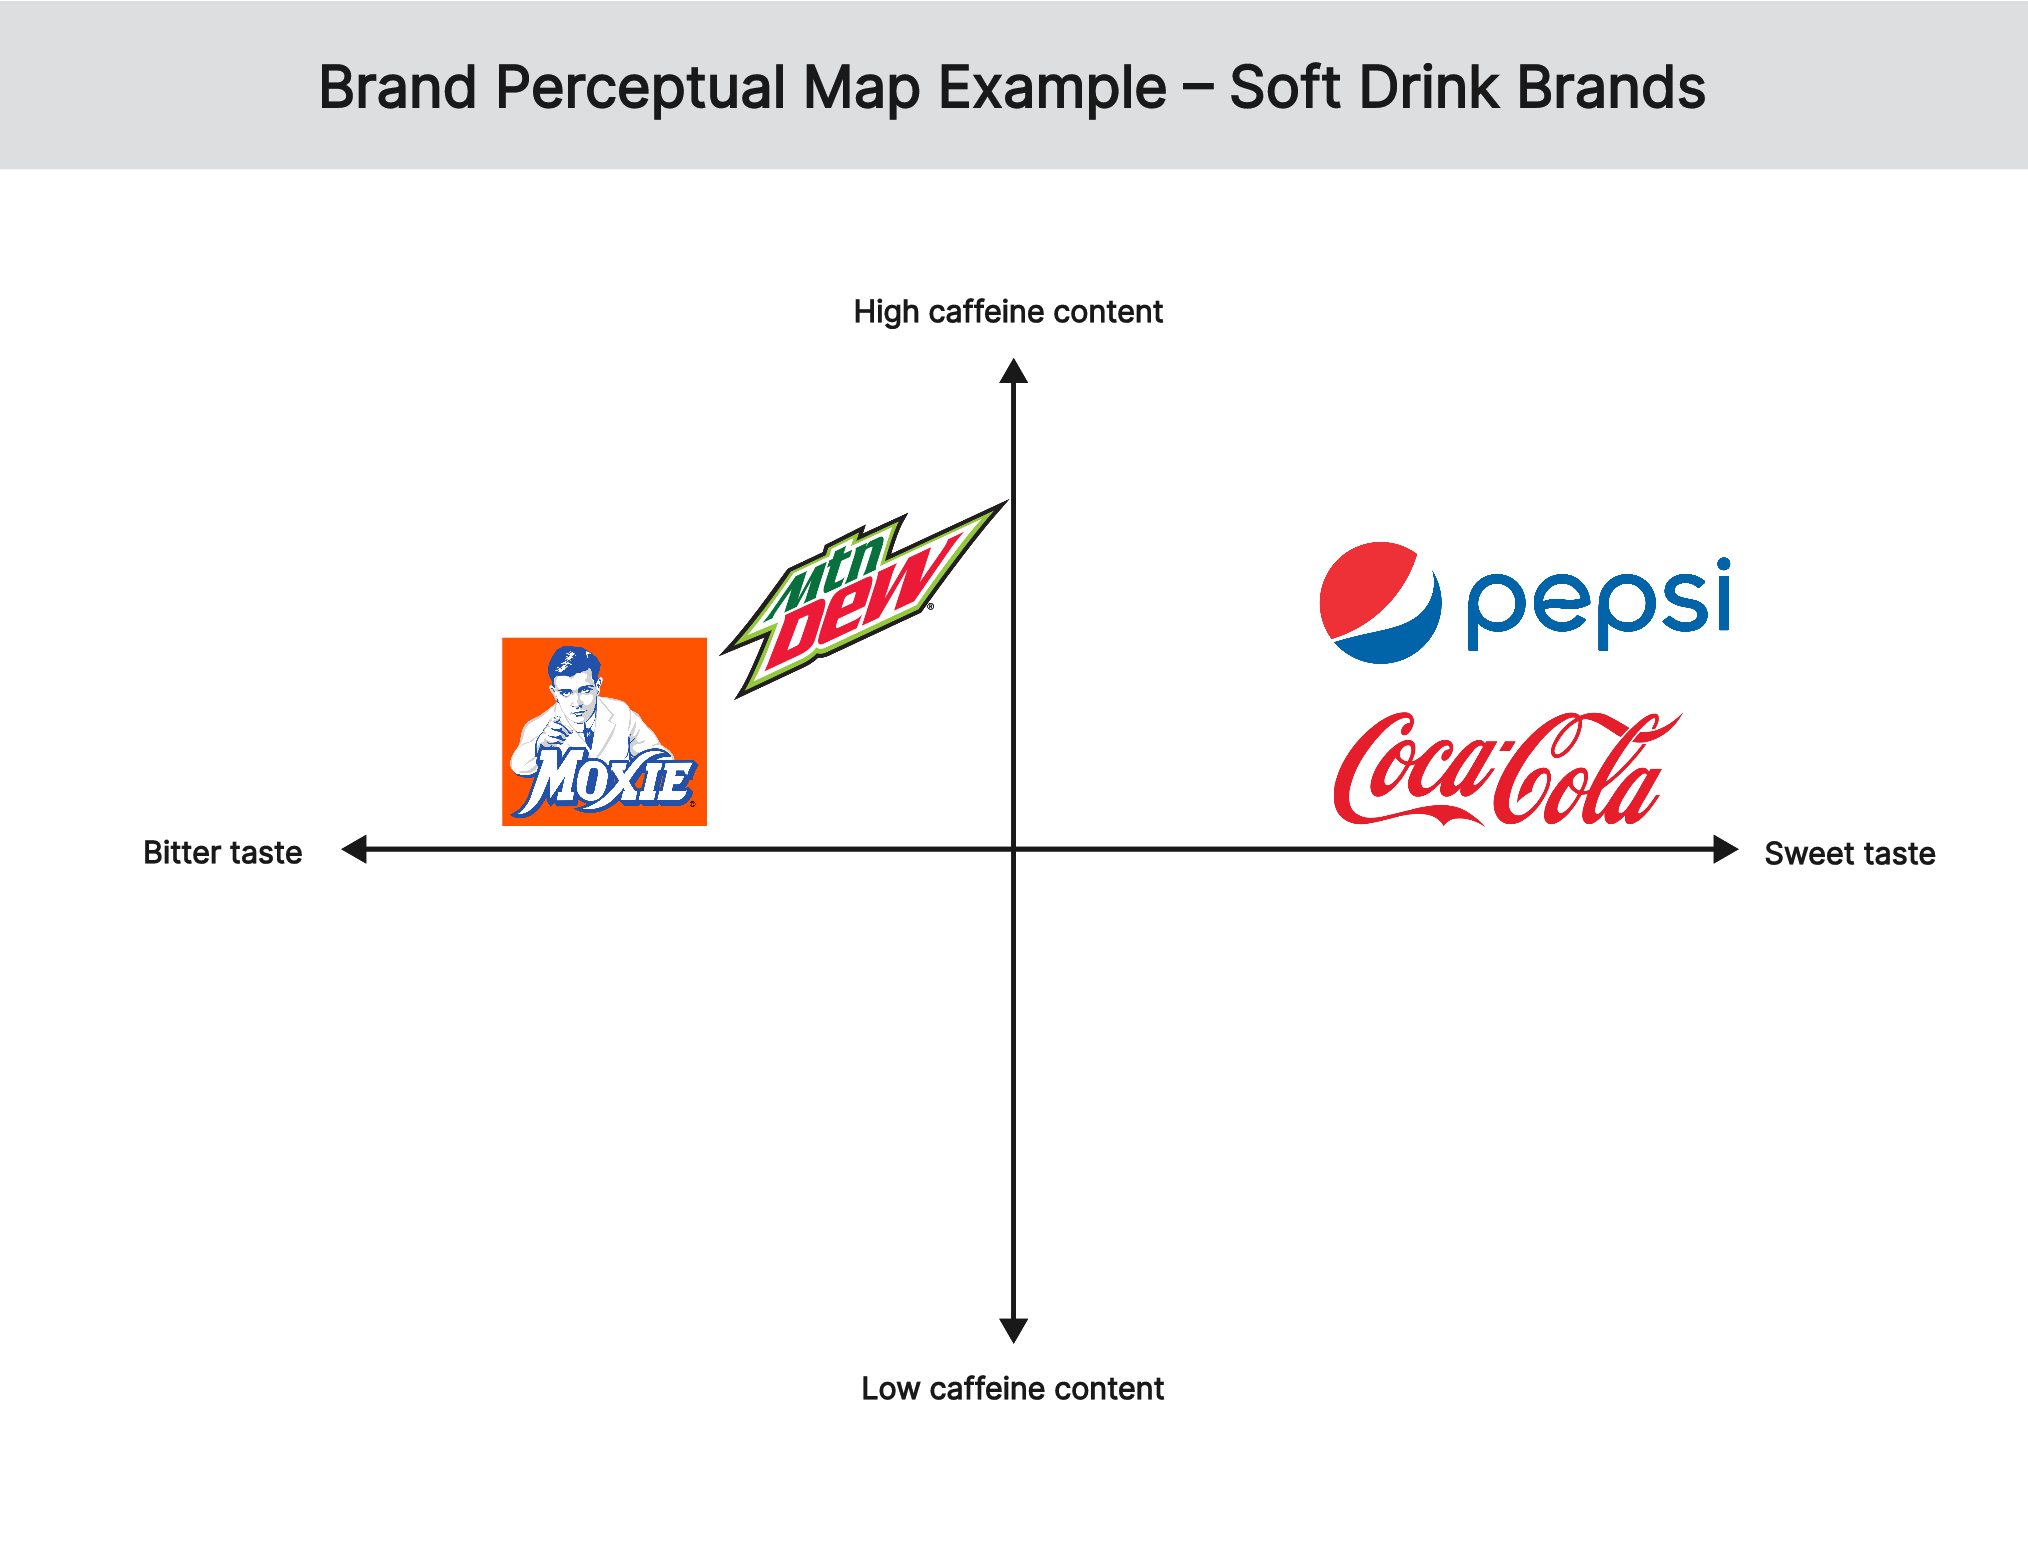
In this brand perceptual map example, 4 soft drink brands are compared based on their taste and caffeine content. Coca-Cola and Pepsi are positioned close to each other because of customer perceptions that they have a sweet taste and a moderate caffeine content. However, customers perceive Coca-Cola to have a stronger taste and a lower caffeine content than Pepsi. On the other hand, Mountain Dew and Moxie are positioned close to each other because of customer perception that they have a bitter taste and a high caffein content. However, customers perceive Mountain Dew to have a stronger taste and a higher caffeine content than Moxie.
Brand Perceptual Map Example – 02
View more brand perceptual map examples
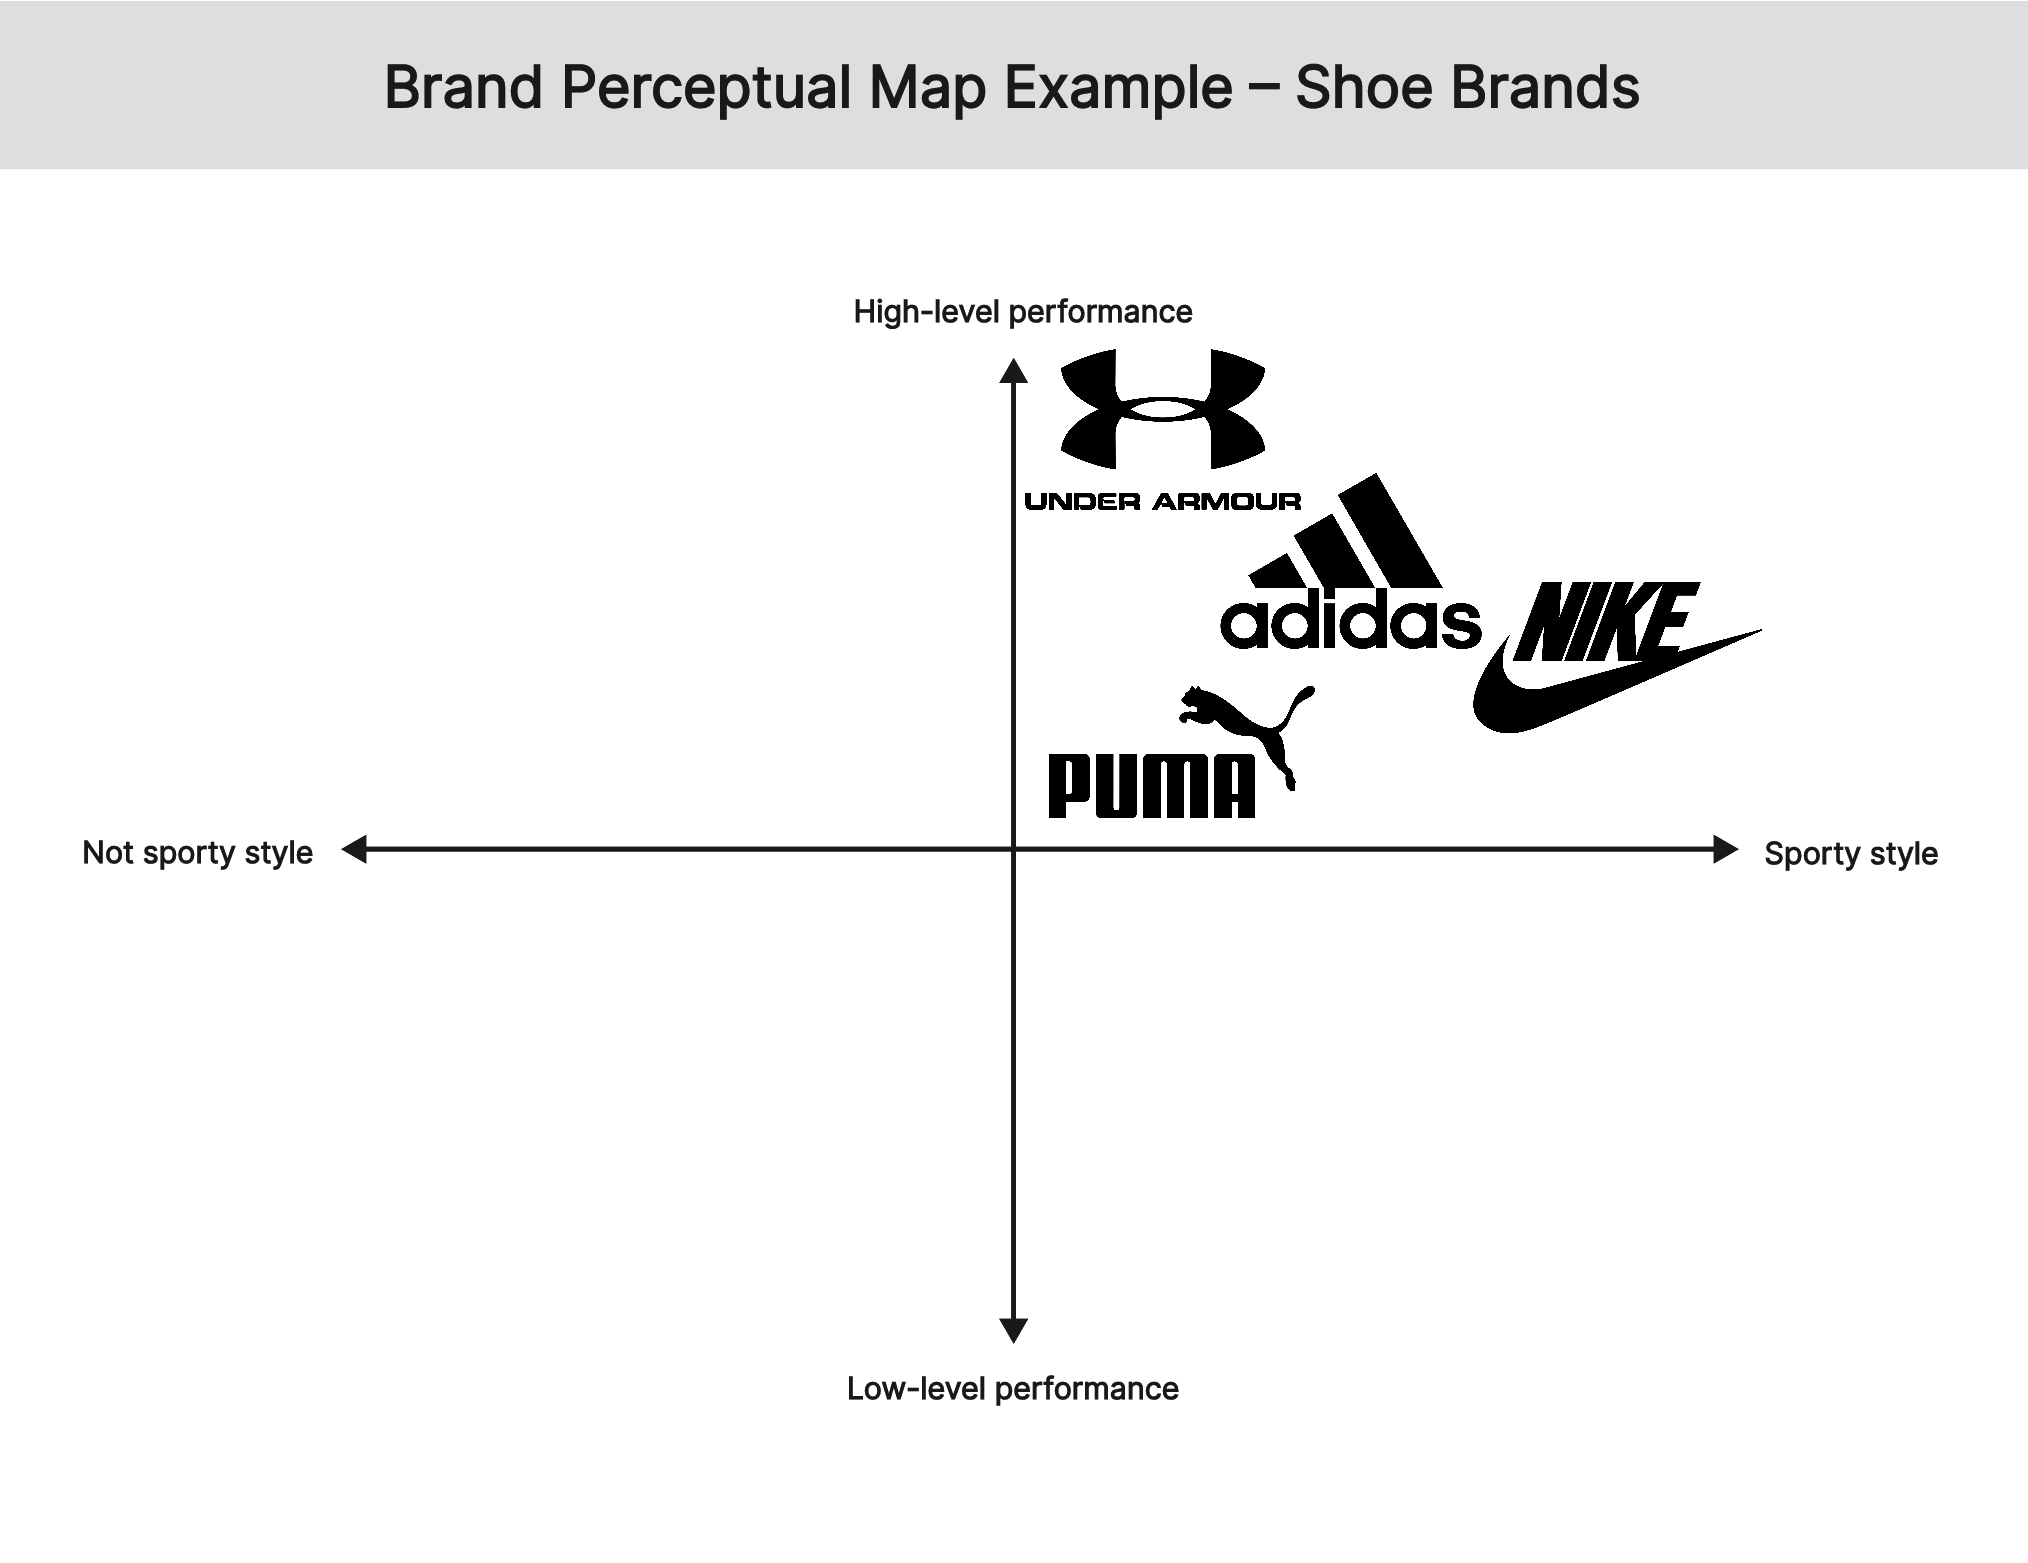
The second brand perceptual map example compares the positioning of 4 shoe brands based on style and performance. Nike and Adidas are positioned close to each other because of the customers' perceptions of a sporty style and high-level performance. However, customers perceive Nike to be more style than Adidas while Adidas is perceived to be more performance-oriented than Nike. On the other hand, Puma and Under Armour are positioned close to each other because of customer’s perception of more sport style and high-level performance. In particular, customers perceive Puma as having the best sporty style and high quality while Under Armour is designed for best performance of athletes.
Brand Perceptual Map Example – 03
View more brand perceptual map examples
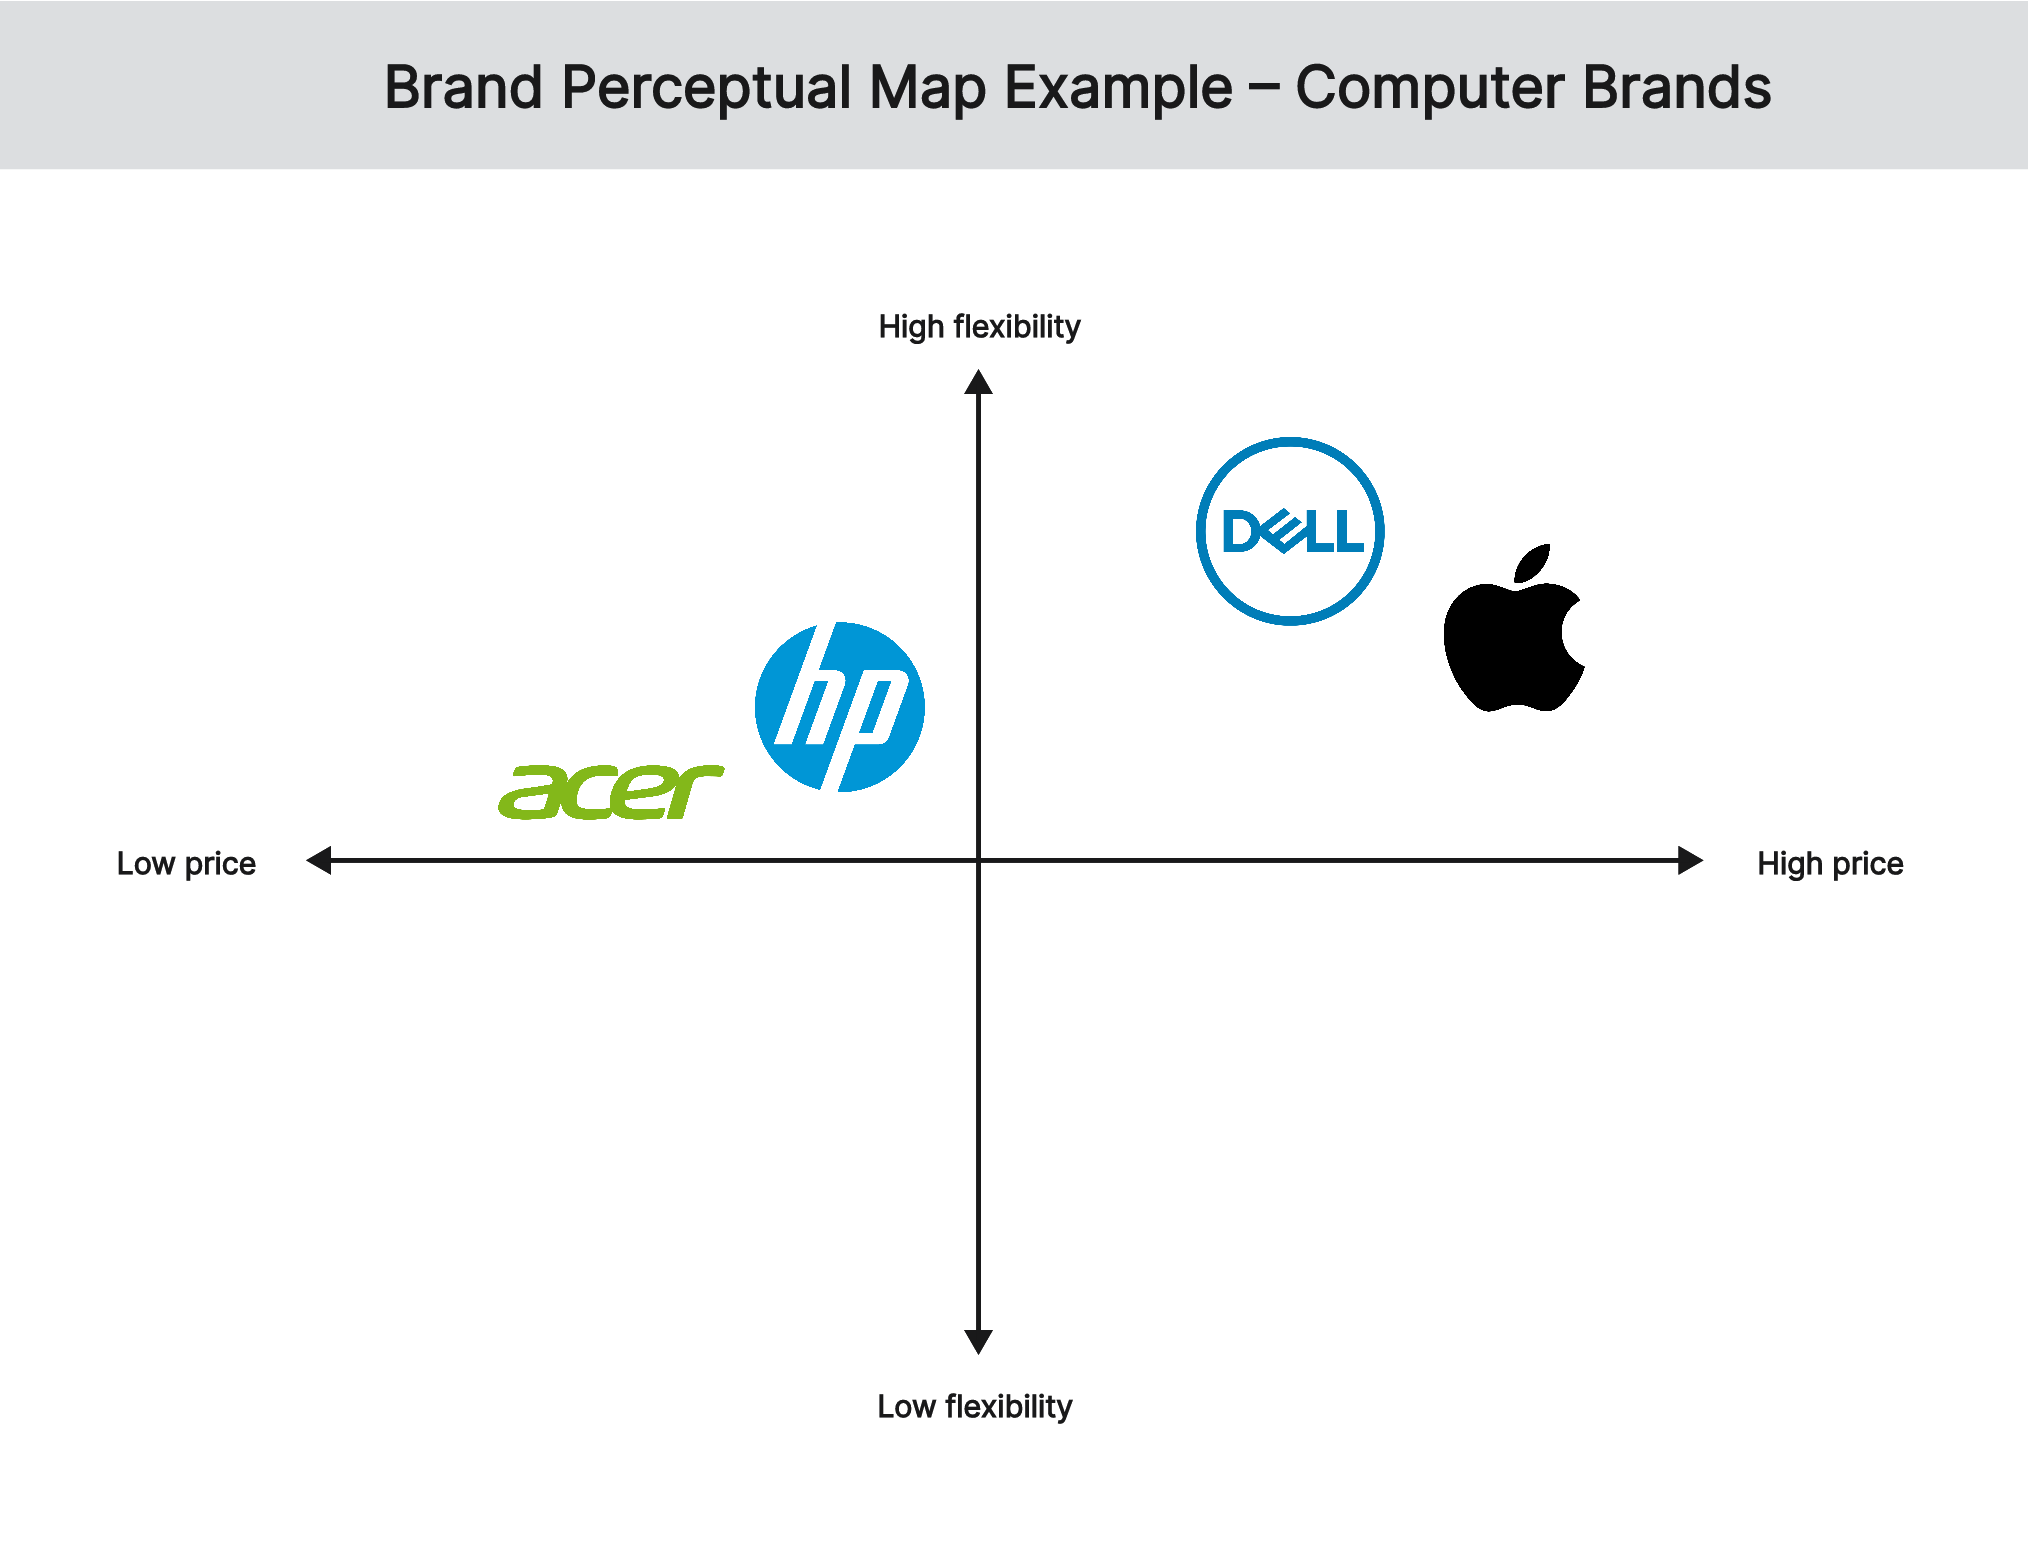
The third brand perceptual map example compares the positioning of computer brands based on price and flexibility. Apple and Dell are positioned close to each other because customers perceive them as high end and with innovative design. However, customers perceive Apple to be more expensive than Dell, while the latter is more innovative in design. On the other hand, Acer and HP are positioned close to each other because of customer’s perception of budget-friendly and range of options. In particular, customers perceive Acer as being more budget friendly than HP, but HP offers a broader range of computers to choose from.
How Do You Create a Perceptual Map
Start by conducting market research to understand your product and competitors in the target market segment. You can administer a customer survey asking for feedback on the specific parameters that you want to analyze. Once you have collected enough data, plot the brands against the selected parameters.
- Choose your parameters– These are the parameters that a customer will consider when buying your product. Examples include price, quality, customer service, design, and convenience.
- Identify your competitors – Come up with several brands or products to plot on the perceptual map along with your product.
- Create the perceptual map – Select the most relevant parameters and start plotting your competitors on a two-dimensional map. Start by placing all the competitors on the map to get a clear landscape of the market, and then put your product on the map last.
- Distribute your perceptual map –Share the map with stakeholders to get their feedback and opinion about the product’s perception among the customers.
Common Tips
- You can collect data for different perceptual maps at once when you’re surveying customers.
- In addition to consumer surveys, focus groups are a great source of information.
- Larger companies may benefit from multi-dimensional perceptual maps, but you will not need to hire a research and data expert to produce these in most cases.
- Review and update your perceptual map regularly, preferably once in three months.
Quick Tip - Boardmix Perceptual Map Template
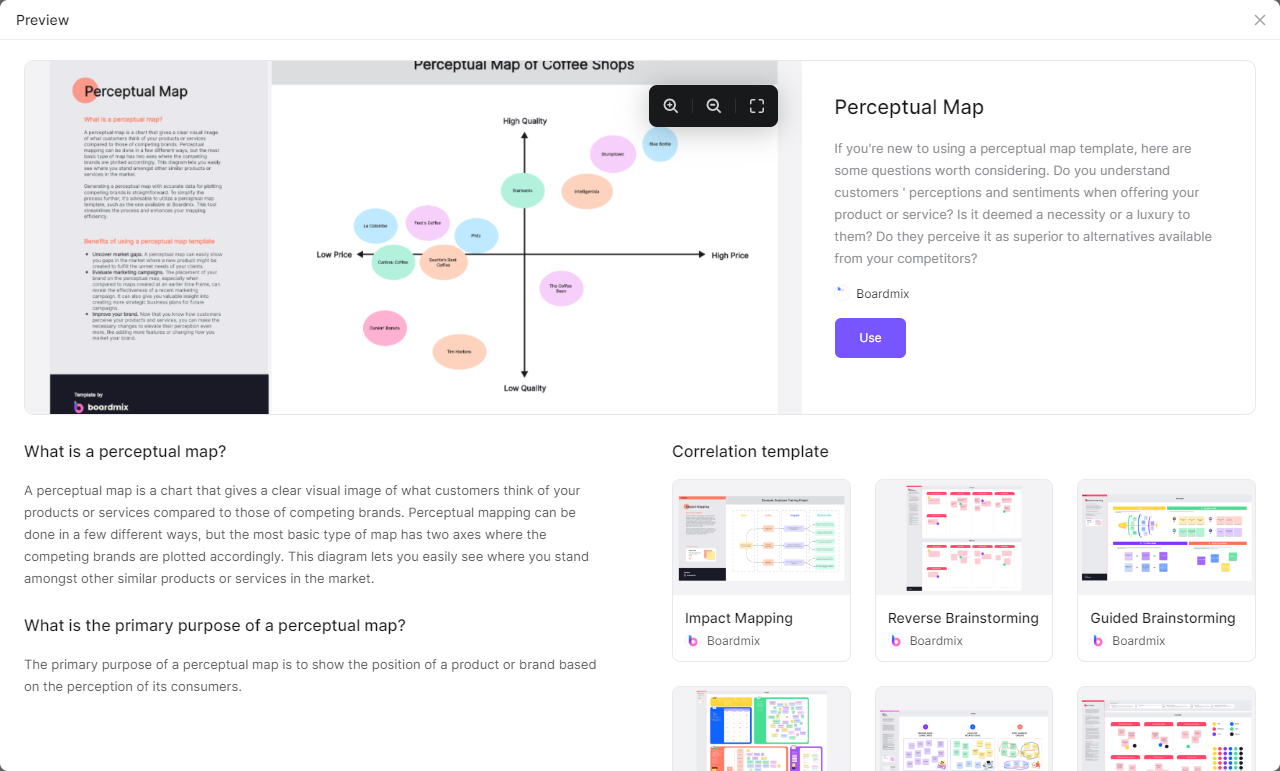
Boardmix provides a ready-made perceptual map template to help you build our map quickly and efficiently. It is a two-dimensional perceptual map with clearly outline steps for generating a perceptual map with your own data. Besides, Boardmix also provides various useful tools like real-time collaborative tools, sticky notes, connection lines, voting features, online meetings and more for you to work quickly, easily, dynamically and collaboratively.
FAQ. Perceptual Map Vs. Positioning Map
1. What are positioning and perceptual mapping?
Perceptual mapping is a graphical representation or a chart that shows the way consumers perceive your product or service within your industry based on selective attributes. It is based on customer surveys and interviews, and usually plots products or brands on two or three dimensions important to customers, such as price and efficiency. On the other hand, a positioning map shows how a company wants its products or brand to be perceived by customer. It is based on the company’s own analysis of the market and competitors, and may be plotted based on multi-dimensions such as price, efficient, image, and so on.
2. Is the positioning map also called a perceptual map?
No, a positioning map is different from a perceptual map. While a perceptual map shows how customers perceive different brands and products in the market, a positioning map shows how a company want customers to perceive its brand or products. Therefore, a perceptual map is drawn from the perceptive of the customers while a positioning map is from the company’s viewpoint.
3. What is the difference between positioning and perception?
The difference between positioning and perception lies in what the map represents. A positioning map represents the brand positioning as determined by the company, while the perception map is based on consumer’s perception of various brands or products in the market.
4. What are the 3 common types of perceptual maps?
The common types of perceptual maps include two-dimensional and multi-dimensional maps. Other types include spidergram, joint, and intuitive perceptual maps.