The usage of big data is expanding in various industries and fields, such as medical, retail, education, and many more.
Big data, for example, in the medical industry has been used to build evidence for the development of new drug as well as to predict demands for a pharma company’s products.
What kind of data is considered as “big data” in the first place?
How does it differ from traditional data?
In this article, we will explain the history and analysis methods of big data, and introduce some cases from big data applications.
With an appropriate use, big data can help the discovery of needs and predict demands that traditional data analysis could only partially assess.
If you are interested in the utilization of big data, please refer to the following information.
What is “Big Data”? “Three V’s” Essential to Understand Big Data
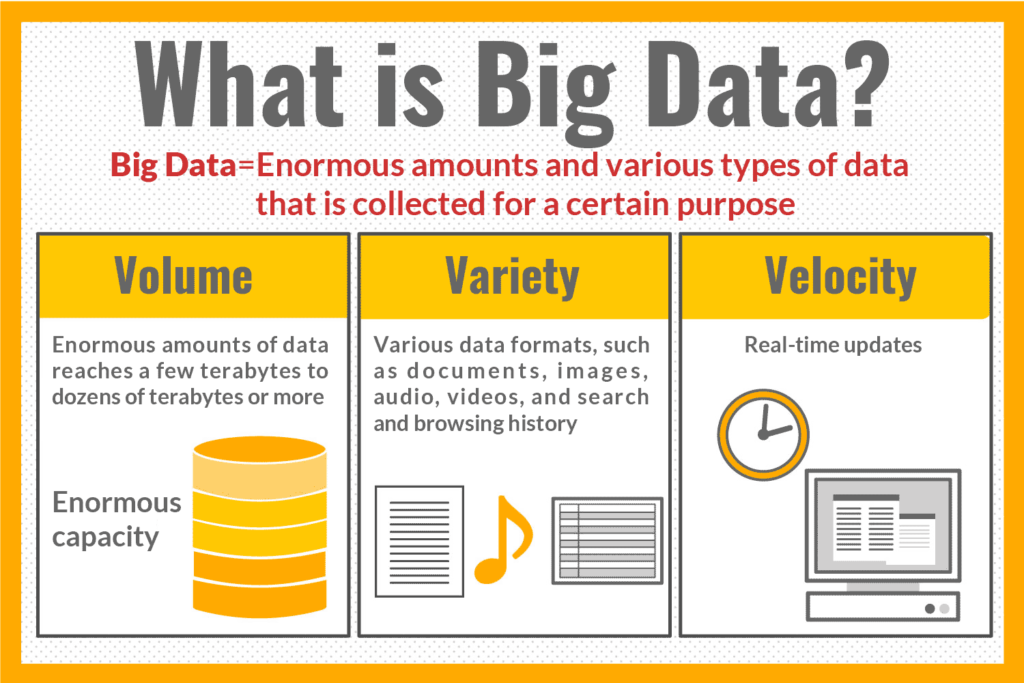
Big data is enormous amounts and various types of data that is collected for a certain purpose.
Big data is defined as “data which can be used to derive knowledge for business” according to “2012 White Paper Information and Communications in Japan,” published by Ministry of Internal Affairs and Communications (MIC). [*1]
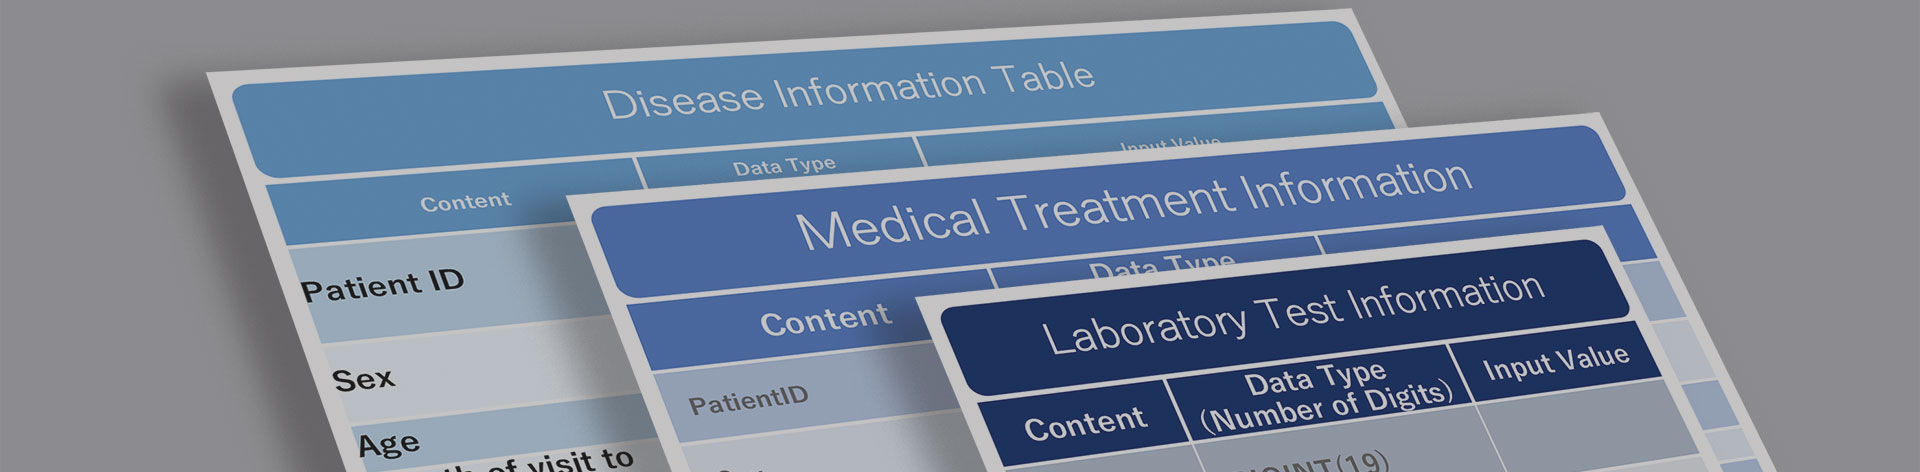
“Medical Big Data,” which is a collection of medical records and receipts from medical institutions across the country, is one example of big data.
Let’s start by looking back to differences between big data and traditional data, and the history of big data.
[*1]“2012 White Paper Information and Communications in Japan”
https://www.soumu.go.jp/johotsusintokei/whitepaper/ja/h24/pdf/24honpen.pdf. Ministry of Internal Affairs and Communications (MIC). 2012.
Three Differences Between Big Data and Traditional Data
The differences between big data and traditional data can be expressed through the “three V’s.”
| Traditional Data | Big Data | |
|---|---|---|
| Volume | The amount of data which can be processed by existing database system without any problems. | The amount of data reaches dozens of terabytes to a few petabytes or more and it cannot be processed by existing database system. |
| Variety | Only structured data that can be represented by tables (“columns” and “row”) in a database system, such as CSV and Excel files. | Includes unstructured data in various data formats, such as documents, images, audio, videos, and even search and browsing history. |
| Velocity | Obtaining and analyzing data is not done in real time. | Data (e.g. traffic and financial information) is updated in real time, so it needs to be obtained and analyzed quickly. |
Data science has developed the usage of data by making full use of information science and statistics in order to process such Voluminous, Various, and real-time (Velocity) big data.
History of Big Data. What Happened till the “First Year of Big Data”?
Early in the 2010’s, the word “Big Data” began to be used in Japanese media.
2011 was called the “first year of big data,” and the utilization of big data progressed significantly from that year.
Back in the years 2000’s, when internet became widespread, the volume and type of data increased dramatically, leading to the emergence of Big Data. In parallel, Japanese companies began to analyze the data flowing through internet to evaluate the trends of their market, domestic and worldwide.
The trend reached a new phase with the introduction of high-performance “in-memory database” in the 2010s. In-memory database made it possible to analyze massive amounts and various types of data more than experienced before, paving the way for utilization of big data as we know it today.
Five Representative Analysis Methods of Big Data
Along with development of data science, it became possible to analyze big data in various methods.
The followings are the five typical methods to analyze big data.
1. Cross Tabulation: sorts big data by attribution and analyzes
Cross tabulation is an analysis method that sorts big data by attributes.
For example, big data that have been collected for marketing purpose on behalf of customers, sorted by attributes such as age, gender, birth place, education, occupation, and etc., makes it easier to analyze and to discover trends and needs for each attribute. This analysis method is widely used in marketing, new drug development, and public opinion surveys.
2. Cluster Analysis: sorts big data into groups and analyzes
Cluster analysis is very similar to cross tabulation, but the difference is which criteria is used to sort big data. In cluster analysis, big data are sorted based on “clusters (groups).”
“Cluster” is a group that is sorted based on its proximity and similarity in terms of data, such as preferences and orientations, rather than attributes such as age, gender, hometown, education, and occupation.
For example, let’s say you analyze the purchase history of your customers and find a cluster that has similarity of “high frequency of purchasing new products.”
Based on the results of the cluster analysis, we know that it would be effective to recommend information about new products to this specific cluster.
As you can see, cluster analysis is an analysis method that is mainly used in marketing and brand promotion.
3. Association Analysis: excellent at analyzing correlations in big data
With data as voluminous and varied as big data, there are many cases that correlations are not apparent to human eyes. Association analysis is an excellent way to analyze correlations in big data.
In marketing field, this is sometimes called as market basket analysis. Association analysis categorizes the data set by variable and extracts those that occur frequently to derive correlations.
Furthermore, in some cases, cluster analysis is performed on the extracted clusters to analyze the characteristics of each cluster.
4. Logistic Regression Analysis: predicting the probability of an event
Logistic regression analysis is an analytical method for determining the probability of occurrence of an event based on the analysis results of various big data and design a prediction model. By performing logistic regression analysis, it is possible to express numerically the level of probability of occurrence of an event between 1 (will occur) to 0 (will not occur).
5. Decision Tree Analysis: tree-like analysis of the causes of events
Unlike logistic regression analysis, decision tree analysis can go back and analyze the causes of events. In decision tree analysis, cross tabulations are performed repeatedly to subdivide events by attributes.
For example, if there is a region with high sales of a certain product, the data is further subdivided by attributes such as age, gender, and occupation.
As a result, we can find out the cause of the high sales of the product, such as “the sales of the product are high because there are many men with a certain occupation in the area where the product is sold.”
The name “decision tree analysis” comes from the fact that the data is organized into tree-like structure as a result of repeatedly performing cross tabulation.
Three Examples of Big Data Utilization
Since the “first year of big data” in 2011, big data have been used in various industries and sectors. Here are three examples of big data utilization.
Medical Industry: Effective for Pharmaceutical Companies to Develop New Drugs
In recent years, usage of big data in medical industry has seen the most remarkable transformation.
Medical industry analyzes “medical big data,” which is a collection of medical records and health claims from medical institutions across the country.
The utilization of big data has rapidly progressed, due to medical records and health claims have unified standards through data such as “DPC Data,” introduced by the Ministry of Health, Labour and Welfare (MHLW).
Normally, clinical trials are conducted for new drug development, but evidence from large-scale epidemiological studies are necessary to confirm safety.
Thus, medical big data are used to discover the effects and side effects that cannot be confirmed only through clinical trials.
In addition, forecasting (demand forecasting) of a company’s product is essential since new drugs take time from R&D (research and development) to sales.
By analyzing big data, it is possible to predict market growth and sales of new drugs, and discover “what kinds of new drugs are expected” at an early stage.
Retail Industry: Contribution to Optimize Marketing Initiatives
In retail industry, big data is helpful to optimize marketing initiatives.
In particular, there have been many cases where big data have been analyzed to segment customers and discover unseen demand.
For example, in the case of a vending machine manufacturer, eye tracking data, which is data of the eye movements of customers, was analyzed to discover the display locations where customers often purchase products.
Even needs that are difficult to identify through traditional data analysis can be discovered through big data.
Education Industry: Aiming Towards Personalized Education matching Students’ Characteristics
In the education industry, there is a growing movement to personalize education based on student’s characteristics.
Analyzing various educational data, particularly in the design of educational materials, is helpful to create learning materials that match the grade level and study progress of students.
In addition, there are cases where children’s learning records are analyzed to derive future growth curves and utilize it in educational research.
Summary
Understand the Definition and Usage of Big Data and Solve Problems
Big data is applied to describe enormous amount and highly diverse types of data that are collected for a certain purpose.
Along with the development of data science, big data can now be analyzed by using methods such as “cross tabulation,” “cluster analysis,” “association analysis,” “logistic regression analysis,” and “decision tree analysis.”
Big data are used in various industries and fields, such as medical, retail, educational, and many more.
Let’s make use of the information through understanding the definition of big data and how it can be used to solve problems.