Misorientation angle distribution
365 vistas
Ir al primer mensaje no leído

Dripta Dutta
1 ago 2018, 6:01:46 a.m.1/8/2018
para MTEX
Hello,
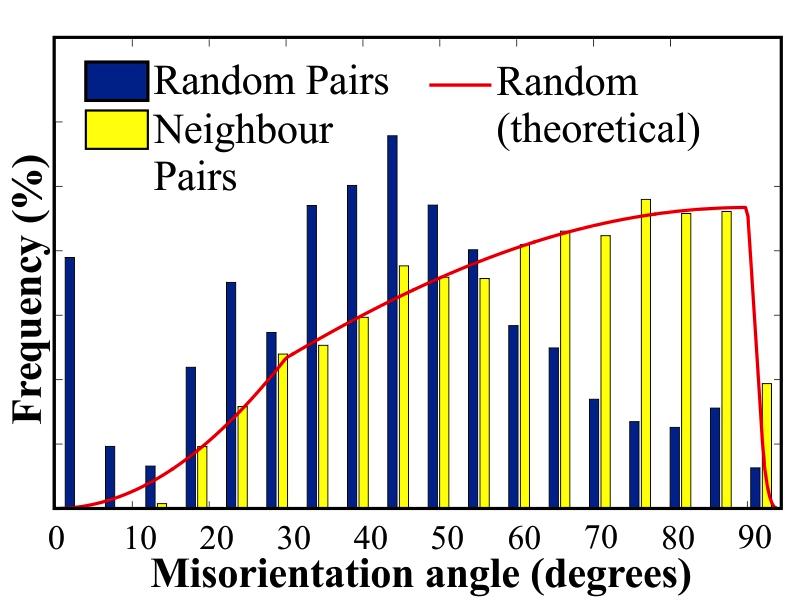
I am working with MTEX 5.0.2 (Matlab 2015a). I would like to plot the misorientation angle distribution for both uncorrelated and correlated pairs as curves (as in the attached figure from Stipp & Kunze, 2008) instead of bars.
I would really appreciate if anyone could share the code for the same.
Thank You !!
Regards,
Dripta

Rüdiger Kilian
1 ago 2018, 9:45:10 a.m.1/8/2018
para mtex...@googlegroups.com
Hi,
have a look at calcAngleDistribution and use the result to make a line plot. On the different types of misorientation angle distributions and from what they can be derived, have a look here: http://mtex-toolbox.github.io/files/doc/GrainMisorientationAnalysis.html
Hope this helps.
Cheers,
Rüdiger
have a look at calcAngleDistribution and use the result to make a line plot. On the different types of misorientation angle distributions and from what they can be derived, have a look here: http://mtex-toolbox.github.io/files/doc/GrainMisorientationAnalysis.html
Hope this helps.
Cheers,
Rüdiger
Dripta Dutta
2 ago 2018, 12:53:51 a.m.2/8/2018
para MTEX
Dear Dr. Kilian,
Thanks a lot. I was able to extract the angles and their distribution.
However, I tried plotting it along with both the uncorrelated and the Mackenzie distribution and the result I got, isn't the same as the one the function plotAngleDistribution was used( both images attached). I guess the Y-axis values for correlated distribution needs to be normalized. But I'm not quite sure how to do that.
ruediger Kilian
2 ago 2018, 11:20:06 a.m.2/8/2018
para mtex...@googlegroups.com
Hi,
yes, the distribution of the uniform calculated from the crystal symmetry or an angle distribution from an mdf is normalised by the mean while the histogram for the correlated angles is normalised to 100%.
If d are your densities, you could normalise all of them either by e.g. sum(d), or the mean(d) or actually by the area (trapz(omega,d)).
Cheers,
Rüdiger
Dripta Dutta
12 ago 2018, 10:44:42 a.m.12/8/2018
para MTEX
Dear Dr. Kilian,
Sorry for the late reply. I'm afraid, but I perhaps couldn't normalise the 'd' values correctly and hence the frequencies for the correlated pairs are coming out to be too low.
Here's what I did,
[d,omega]= calcAngleDistribution(grains.boundary('Quartz','Quartz').misorientation); % after this step sum(d) returns 100 as the answer.
d=d/sum(d); % IS this the correct way to normalise in this case?
plot(omega*180/pi,d);
Secondly,
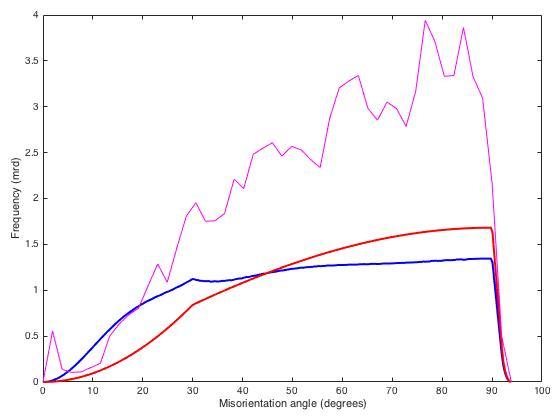
I also plotted the misorientation angle distribution for CPO plot (image attached). Wherein, the distribution for correlated pairs appears to follow the expected curve for random distribution and the uncorrelated shows a different distribution. Usually, its the other way round. Could you please tell me what might possibly have gone wrong?
Regards,
Dripta
Sorry for the late reply. I'm afraid, but I perhaps couldn't normalise the 'd' values correctly and hence the frequencies for the correlated pairs are coming out to be too low.
Here's what I did,
[d,omega]= calcAngleDistribution(grains.boundary('Quartz','Quartz').misorientation); % after this step sum(d) returns 100 as the answer.
d=d/sum(d); % IS this the correct way to normalise in this case?
plot(omega*180/pi,d);
Secondly,
I also plotted the misorientation angle distribution for CPO plot (image attached). Wherein, the distribution for correlated pairs appears to follow the expected curve for random distribution and the uncorrelated shows a different distribution. Usually, its the other way round. Could you please tell me what might possibly have gone wrong?
Regards,
Dripta
Responder a todos
Responder al autor
Reenviar
0 mensajes nuevos