Evaluation : 4 Small Radio Telescope Systems for Hydrogen Line Acquisition

Alex P
Evaluation : 4 Small Radio Telescope Systems for Hydrogen Line Acquisition
Alex Pettit Oct 2023
A Qualitative Comparison of four radio telescope systems was performed
using parabolic reflectors from 1.2 meters to 3.7 meters in diameter .
Two systems used Spectra Cyber 1420 MHz Spectrometers,
Two used Software Defined Radio ( SDR ) ( Receiver / Analog to Digital Converter ) Systems.
The 1.2m SDR and the Spectra Cyber 3.7m system used the same RAS (WD5AGO) Low Noise Amplifier .
The SDR based 3.7m radio telescope used the nooelec SAWbird+ H1 LNA
Data Acquisition
The data sets were from 24 hour drift scans at a Declination of approximately + 40 degrees .
( 1.2m +40⁰, 2.7m +40⁰, 3.7m_SDR +36⁰ , 3.7m_SpecCy +37⁰ ) .
Each scan ( file ) was acquired over a 4 to 5 minute time frame ( 1⁰ to 1.25⁰ drift in RA )
Comparisons
=====================================================
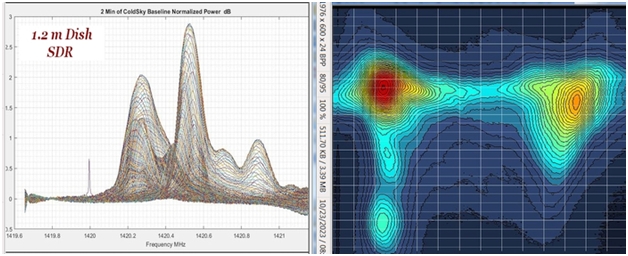
1.2m Dish with SDR Rx/ADC
The 1.2 m dish shows the greatest difference between Cold_Sky and Peak H1 brightness . This probably the result of the deep f/D = 0.27 reflector reducing the 290K ground noise pickup.
The wide beam-width of the 1.2m reflector captures a wide area of the sky but lowers its ability to resolve details.
With a software defined radio (SDR) , all frequency channels are simultaneously acquired . A 300 second scan allows 300 seconds of data to be acquired and averaged for each frequency channel thus providing good statistical convergence (smoothing) of the random data.
Software : Air Spy SDR# Studio with IF_Ave plug-in for acquisition, averaging and file saving.
The dB scale is referenced to Cold_Sky = 0 dB.
Cold_Sky vs Peak H1 brightness ( 2.9 dB ) = 1.95:1 Power Ratio
The plot amplitude calibration was verified using a series of attenuators.
The data file frequency resolution : 2.93 kHz ( 512 ch FFT )
Antenna Beam-Width FWHM 1.2meter dish = 21.1 degrees
=====================================================
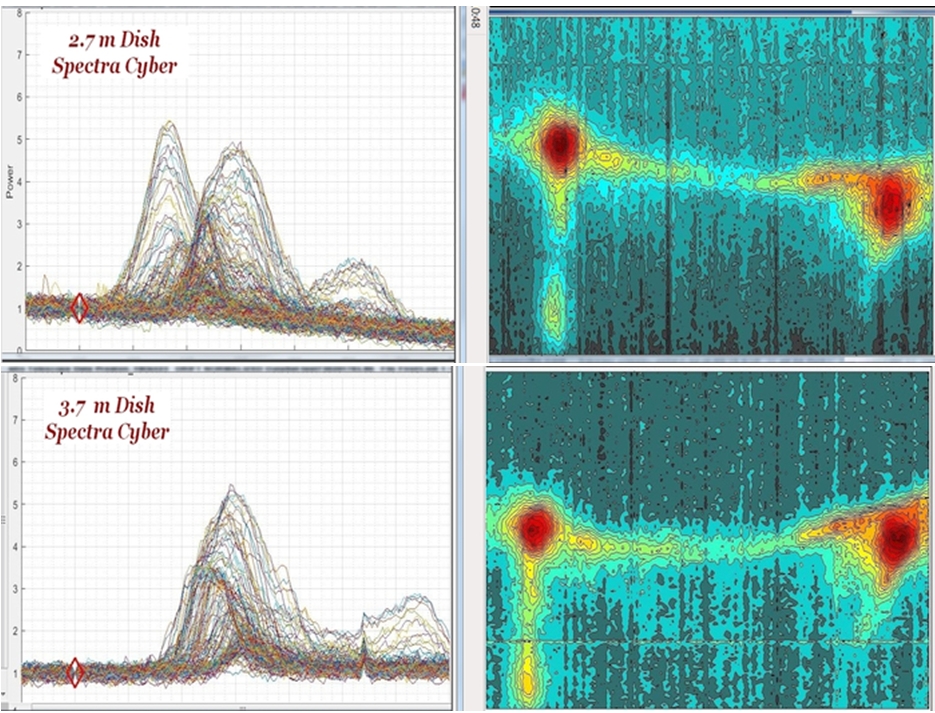
2.7m and 3.7m Dish with Spectra Cyber Spectrometer Analyzer
These systems show the result of using a Spectra Cyber "stepped frequency scanner " Spectrometer.
By setting a Sample and Integration Time of 1 second, each frequency channel takes one second to be acquired.
A full frequency set of 280 channels thus requires 280 seconds, but each frequency channel is averaged over only one second .
The Spectra Cyber displays and saves data scaled in "Volts". It is related to signal power, but this has
not as yet been quantified . The plot amplitude , "Volts" ( power) ; the frequency scale is ' freq channels'
There is more spatial detail being resolved in the 2.7m and 3.7m dishes over the 1.2m, but the lower signal from one second duration per channel acquisition and lessened statistical averaging masks much of that improvement.
The 2.7m and 3.7m systems have similar H1 Peak signal levels relative to Cold_Sky.
There is slightly more spatial resolution shown in the larger 3.7m reflector data.
Software : Spectra Cyber Software for acquisition, averaging and file saving.
The ( uncalibrated) power amplitude is referenced to Cold_Sky = ' 1.0 '
Uncalibrated Cold_Sky vs Peak H1 brightness for each ~ 5.2:1 (Power Ratio ?)
The data file frequency resolution : 5.0 kHz
Antenna Beam-Width FWHM 2.7meter dish = 9.40 degrees
Antenna Beam-Width FWHM 3.7meter dish = 6.85 degrees
=====================================================
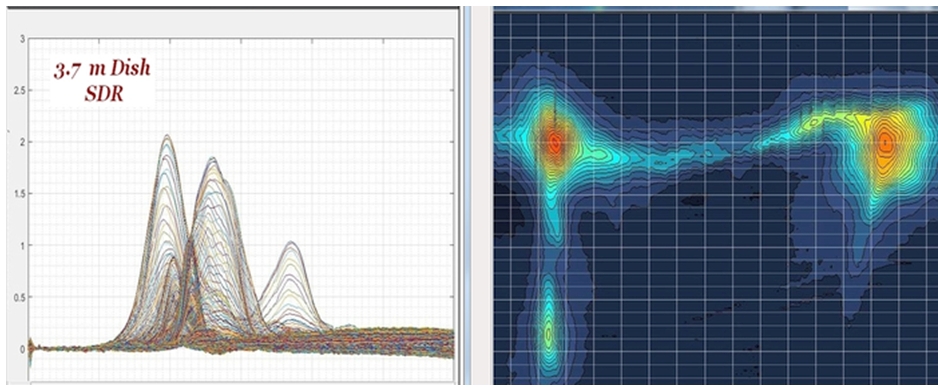
3.7m Dish with SDR Rx/ADC
The 3.7 m dish shows up to 2.1 dB difference between Cold_Sky and Peak H1 brightness .
The more narrow beam width allows this antenna to resolve greater spatial details.
With a software defined radio (SDR) , all frequency channels are simultaneously acquired. A 300 second scan allows 300 seconds of data to be acquired for each frequency channel thus providing good statistical convergence (smoothing) of the random data.
Software : Air Spy SDR# Studio with IF_Ave plug-in for acquisition, averaging and file saving.
The dB scale is referenced to Cold_Sky = 0 dB.
Cold_Sky vs Peak H1 brightness ( 2.1 dB ) = 1.62:1 Power Ratio
The data file frequency resolution : 6.24 kHz ( 512 ch FFT )
Antenna Beam-Width FWHM = 3.7meter dish = 6.85 degrees
====================================================
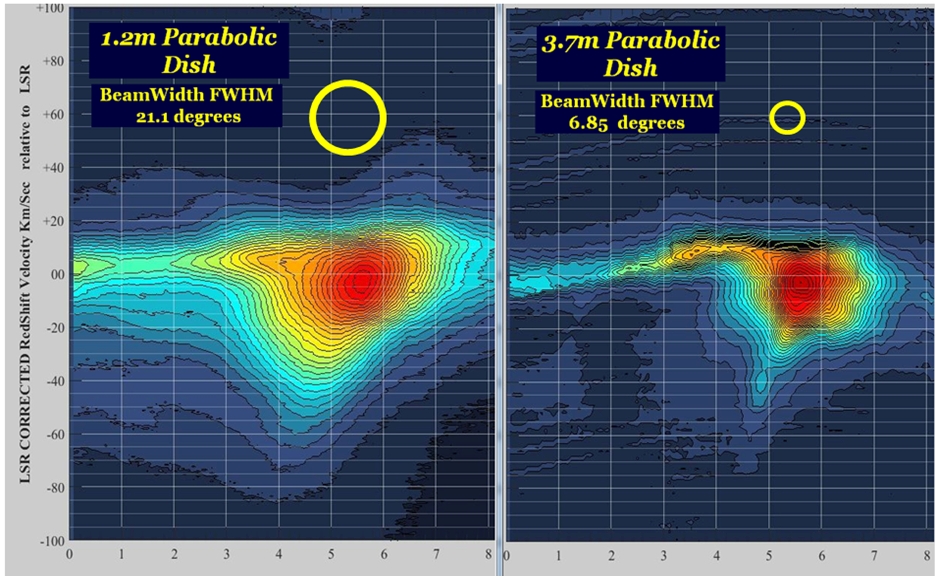
Hydrogen Line Resolution : 1.2m Parabolic Dish vs 3.7m Parabolic Dish
An interesting performance comparison of two parabolic reflectors
Both Spatial Brightness and Doppler Velocity Resolution is correlated to the beam size.
The 1.2m dish captures a larger area of the sky but at a reduced resolution . It creates an overall average in Brightness and Doppler shifted Velocity from its wide 'field of view' of Milky Way neutral hydrogen clouds.
The more narrow beam-width of the 3.7m dish captures a smaller 'slice' of the neutral hydrogen clouds.
This enhances its ability to resolve details in Brightness and Doppler shifted Velocity within its 'field of view'.
Milky Way Drift Scans @ Dec +40 Degrees, RA 00:00 to 08:00 Hrs
Alex KK4VB

bsn...@gmail.com
b alex pettit jr
Alex
b alex pettit jr

b alex pettit jr


andrew....@googlemail.com
To Alex Pettit:
Hi Alex,
Please email me on and...@thornett.net with exactly what data you require from Scope in a Box system and I will collect it and send it to you. Let me know whether you prefer the 1.7GHz mesh dish or 1.4GHz – I could do either.
Andy