1 Introduction to Noninterpretive Skills
Quality: It’s All about Quality Improvement
The NIS primarily concerns itself with core quality and safety.
Quality control (QC), quality assurance (QA), and quality improvement (QI) sound kind of similar, but they are not the same thing. The most up-to-date process is QI. This is the only one of the three that results in an improved system.
Tip: Remember that QI is the current and best iteration because it is the only one with “improvement” in the title.
Quality Control
QC defines the acceptable parameters. For example, the QC of a lumbar puncture includes that “sterile technique must be strictly followed.” The QC won’t tell you the best way to confirm sterile technique, and if infection does occur, the QC won’t give blame or provide fixes. The QC is simply “the rules.”
Quality Assurance
QA is better than QC (although still not as progressive as QI) and is a method of monitoring feedback. For example, telling one of your residents, “Peter, you overcall cardiomegaly on chest X-rays all the time,” is a form of (fairly blunt) quality assurance. Peter may take some solace in knowing that your comment nicely exemplifies key points of QA: reactive, usually retrospective, involves policing (and sometimes punishing) and determines who is at fault. QA is a stable process and, by itself, doesn’t necessarily bring about change.
Quality Improvement
QI is a method to actually change the problematic process. For example, telling Peter the resident, “For the next 10 chest X-ray cases, you need to measure and confirm an enlarged cardiothoracic ratio before concluding that the heart is enlarged,” is a simple form of QI. This method is the best, since it results in change. QI is both retrospective and prospective, avoids attributing blame, creates systems that prevent errors from happening, and is a more recent phenomenon in healthcare.2
A Few Organizations and a Few Acronyms
The Institute of Medicine (IOM) is a nonprofit organization that provides independent and objective analysis and advice to inform public policy decisions related to science, technology, and medicine.3 The IOM has defined six quality aims for medical care, and you have to know this list.
The six quality aims of the IOM are as follows:
- Safe
- Timely
- Equitable
- Effective
- Efficient
- Patient centered
The acronym STEEEP is provided by the institute to remember these quality aims.
Tip: If you find it tough to remember what this acronym stands for, especially with three nonspecific “Es” in a row, try this mnemonic (Fig. 1.1).
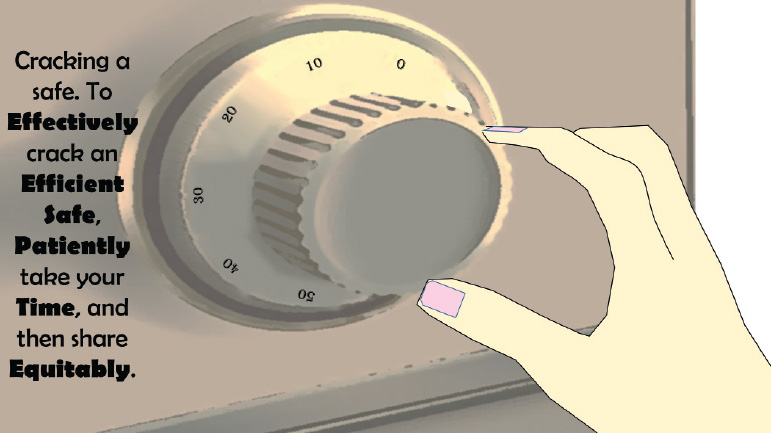
Fig. 1.1 Mnemonic device for the six quality aims of the IOM. Effective, efficient, safe, patient-centered, timely, and equitable.
The Accreditation Council for Graduate Medical Education (ACGME) and the 24 American Board of Medical Specialties (ABMS) agree that a physician must demonstrate the following six core competencies for Graduate Medical Education (GME) and Maintenance of Certification (MOC). Here is the second list you must know.4 (In fact, all board-certified physicians in the United States must know this list.)
The six core competencies of MOC are:
- Patient care
- Medical knowledge
- Interpersonal and communication skills
- Professionalism
- Systems-based practice
- Practice-based learning and improvement
The ABMS provides the mnemonic “Knowledge CLiPS.”
Tip: Try this alternative mnemonic (Fig. 1.2).

Fig. 1.2 Mnemonic device for the six core competencies of MOC. Communication, professionalism, practice (systems-based), knowledge, learning (practice-based), and patient-care.
Adopted from the ABMS website, here is a little more elaboration on these core competencies.
Business Intelligence
The common denominator for these required terms is business intelligence.
Best Practices
Best practice is a method that consistently shows results superior to those achieved with other means, and that method is used as a benchmark.5 “Best practice” has recently become something of a buzzword in business. Best practice examples for employee satisfaction might include creating a culture of engagement, promoting health and well-being, and reducing employee stress.
Tip: A best practice continually evolves.
Dashboards
Dashboards are visual displays of the most important information consolidated into a single screen.6 We might think of this as radiology specific (for example, radiology case list, relative value units [RVUs] completed today, and permitted turnaround time per study), but dashboards have much broader utility for any business. A good dashboard can save a company time and money, if the dashboard is exactly tailored to the required industry specs.
Tip: All quality dashboards have immediacy, intuitiveness, and simplicity.
Benchmarking
Benchmarking is the measurement of the quality of an organization’s policies and strategies and their comparison with standard measurements. One goal of a benchmark is to determine where improvements are needed. Another goal is to analyze how other organizations achieve their success.7
Tip: In radiology, turnaround time, critical findings compliance, and peer review expectations are examples of benchmarks.
Value
Driven by economics, “value” has grown into a popular medical industry term.8 As it relates to healthcare, value is defined as the following:
Value = (service × quality)/cost.
A good value from a patient’s perspective might include interacting with polite radiology staff and receiving quality image interpretation at a reasonable price.
Radiology example
Cash-pay whole-body screening MRI is probably not a good value. The yield is generally low and the cost is generally high.
Real-life example
A $200,000+ European sports car may be of very high quality, but purchasing one is probably not a good value. Top-notch cars like these generally have a low “benefits-to-cost” ratio. Put another way: value = outcomes/cost. For our purposes in radiology, value is directly proportional to optimal appropriateness, good outcomes, improved efficiency, and cost reduction.
It is worth noting that the formerly voluntary physician quality reporting system (PQRS) is now an actual metric used to determine pay.
Tip: Centers for Medicare & Medicaid Services (CMS) is starting to pay for value rather than simply for volume.
Key Performance Indicators
Key performance indicators (KPIs) are business metrics used to evaluate factors that are vital to the success of an organization.9 These include both financial and nonfinancial measures integral to defining an organization’s mission and strategy.
KPIs help us measure how well companies, business units, projects, and individuals are performing compared to their strategic goals and objectives. Well-designed KPIs provide the vital navigation instruments that clearly demonstrate current levels of performance.
Radiology example
KPIs might include customer satisfaction, average call wait time, and call abandonment.
Tip: You can’t manage what you can’t measure.
Business Intelligence in Practice
Your office manager informs you that customers complain about their MRI experiences. She says that patients feel like they aren’t getting a good value. They like the quality of the reads, but think the staff are rude, scheduling takes too long, and the co-pays are too high. These are some of the KPIs.
Fortunately, your manager is immediately aware of all patient issues, since her computer is equipped with a dashboard to easily view daily patient comments, days out for scheduling, and daily co-pays.
Addressing one of these three issues, she tells you that the regional benchmark for getting a patient scanned (from the time the patient makes the call until the actual scan takes place) is 3 days. Since your office is currently operating at 4 days out, she sets “2 days or better” as her goal.
Her bigger picture aim is to have the most satisfied radiology customer base in the region. Improving the three KPIs listed above will help bring her closer to achieving a best practice office for others to emulate.
Useful Approaches to Quality Improvement
A successful program must have the entire organization commit to QI. Although this begins with leadership, good leaders know that involvement of frontline workers in the solutions is key, because no one understands the problems like they do.
As physicians, we are all very familiar with the scientific method and how it leads to logical conclusions. Variations of this theme are used in business and organizational operations.
Plan, Do, Study, Act (PDSA) Cycle
This is the standard cycle for testing changes in QI (and is basically the scientific method). Plan the test or objective, do the test, study the results, and then act (either adopt the change, modify, and try again, or abandon the change). The PDSA cycle, also known as the improvement cycle, is a powerful tool for learning.10
Tip: The ABR advocates using the PDSA cycle for their practice QI (PQI) projects.
You can use PDSA cycles to test an idea by temporarily invoking a change and assessing its impact.
Example: Your patients complain that the information sheet you require them to fill out is too long. You then review the sheet and identify possible unnecessary questions (Plan). Then, you make some modifications to shorten the sheet (Do). Then, you test the new sheet out on a small number of patients. You also make sure that you and the other interpreting radiologists are still satisfied (Study). Then, if the new sheets are satisfactory, you incorporate them into a larger segment of the practice. Finally, if the results of the larger study remain satisfactory, you implement the new sheets practice-wide (Act).
Tip: Start small with the PDSA cycle. Initially, use a limited sample population to make sure your solution works. In the long run, this saves time, money, and risk.
Lean
Lean is the “relentless elimination of waste.” Lean can also be thought of as a method of “making obvious what adds value by reducing everything else.” The Lean principles of process improvement were first described in the manufacturing industry with Toyota automobiles, but translate very well into operations in general. Lean focuses on a smooth workflow and relies on engaging the whole workforce.11 This technique lends itself nicely to radiology, where many people work as a team to produce the final product. Core principles of Lean include eliminating waste, engaging and simplifying, and respecting all people (i.e., customers, employees, and suppliers).
Tip: With Lean, if you respect all people, then you don’t need to remember the “important ones.”
Some specific elements of Lean are discussed below.
“Pull”
This means do the work only when the next step is ready. There should be no work in progress inventory.
Example: Reading a follow-up positron emission tomography/computed tomography (PET/CT) scan without comparison on a patient after his third round of chemotherapy is not optimal. Clearly, there is a comparison around somewhere. Here, the next step is not ready and the comparison should have already been obtained.
“Just in time”
This means to deliver materials only when needed.
Example: Most radiology departments staff the number of radiologists per shift based on historic and usually predictable study volumes. If your CT tech instead batches 15 trauma CT scans, this creates both turnaround time and physician stress problems. Here, the CT tech batched studies rather than delivering them on a regular schedule.
“Kanban”
Kanban means maintaining inventory levels. Processes must have a signal to indicate when supplies need replenishing.
Example: You are scrubbed in the middle of a lumbar puncture on an obese patient and suddenly decide that you need a longer spinal needle. But when you ask for one, the tech explains that there aren’t any and that someone probably used the last one. Here, this preventable problem needed a “Kanban” mechanism to signal low supply.
“Standard work”
This means to reduce unnecessary variation.
Example: If every office in your practice has its own separate policies, then rotating techs and radiologists will probably need more time to acclimate, become more frustrated, and even make more errors. By the way, the suggestion to minimize variation is concordant with current American College of Radiology (ACR) directives. Standardized reporting throughout the country is now gaining momentum.
Six Sigma
Six Sigma is another highly regarded improvement methodology. This was first used at Motorola and then perfected under CEO Jack Welsh at General Electric.
Sigma is the Greek letter often used in statistics and refers to the normal distribution of mathematical outcomes.13
“Six Sigma” targets an extremely low defect rate of 3.4 per million opportunities, which represents six standard deviations (SDs) from the population average. In percentages, this means that 99.99966% of the work is done correctly.
As a reminder, one SD equals 68%, two SDs equal 95%, and three SDs equal 99.7% of the data.
Six Sigma is an extremely lofty goal. The real point is to strive for near perfection.
Tip: Like all QI, Six Sigma work is never completed, because a system is never truly “perfected.”
Define, Measure, Analyze, Improve, and Control (DMAIC) Methodology
This data-driven quality strategy is an integral part of Six Sigma, but can also be a stand-alone process.14
Tip: Lean and Six Sigma share similar methodologies and tools, but there are differences. Lean management is focused on eliminating waste, while Six Sigma management is focused on eliminating defects.
The Eight Wastes in Lean
The standard acronym for these wastes is TIM WOODS.12
Value Added or Non-Value Added
Every activity conducted in a business is either value added (VA) or non-value added (NVA). VA activities are those that physically transform a product or service in the eyes of a customer. NVA activities are those that do not. Although some of these may be essential “behind the scenes” activities, they are still considered NVA and encompass waste. The following section discusses examples of NVA activities (waste).
Transport
Movement of product should be controlled by time and distance.
Example: Waiting for hospital transport to bring the patient to radiology is often the rate-limiting step.
Another example: Placing an ultrasound room physically distant from the radiology reading room wastes both sonographer and patient time.
Inventory
Producing inventory that does not immediately move to the next process is NVA.
Example: An interventional radiology department with inaccurate supply need estimations will waste money on expired products.
Motion
Excessive movement of operator and equipment is waste.
Example: A suboptimal computer interface requiring extra clicks to load your cases is NVA.
Another example: Driving a portable X-ray machine to patients’ homes may be prohibitively slow.
Waiting
Waiting should be minimized.
Example: Your system requires the ultrasound tech to enter information on a shared computer after the scan, but before presenting the case to the radiologist. The ultrasound tech may need to wait until that computer is free, and this NVA activity costs the company money.
Overproduction
Product should not exceed demand.
Example: Opening up a new but poorly conceived office that results in few referrals and scans is an example of overproduction.
Overprocessing
This waste results from poor tool or product design. If you don’t know what your customer wants, how can you possibly create the most desired product?
Example: The referring foot and ankle orthopedic surgeon only wants a “limited bone scan of the feet and ankles.” He specifically does not want a standard whole-body bone scan (because he doesn’t want to deal with the incidental findings often picked up on a whole-body scan). Performing the standard whole-body scan on his patients takes extra time and upsets your customer.
Defects
Errors are waste. It usually takes less time to get it right the first time than it does to correct the errors.
Skills
Failure to optimize skill sets with work duties is non-value added (NVA).
Example: As a physician, using your time to look up and dial referring service offices is NVA. Use an assistant, and stick to the highest and best use of your training.
Another example: Delegating tasks to the unqualified is also NVA. Using low-paid, poorly trained employees to handle interactive patient scheduling (which is often quite complex) is usually not worth the trade-off between perceived “cost savings” and resultant unhappy customers.
Seven Tools of Quality Improvement
There are seven basic tools of QI. These are a fixed set of graphical techniques identified as the most helpful to troubleshoot issues related to quality. These are termed “basic” because they are intended for people with little formal training to find useful.15
Before discussing the seven methodologies of QI, let’s first examine “the five whys.” Most problems have more than one cause and, to really solve the problem, you need to find that underlying cause. You can often identify the source of the problem using the five whys. This begins with the initial question of why something bad happened. This continues with follow-up why questions.
“The Five Whys” in Action
Example: A STAT CT head wasn’t read within the contractually promised 1 hour, and the emergency room (ER) department complains. The simple move is to blame the radiologist on duty, or conclude that the radiology department is understaffed at that time. But maybe there is more to the story.
You ask the radiologist, “Why didn’t you read it?” He responds, “Because the study was incomplete and was missing images.”
You then ask the tech, “Why was the study incomplete?”
The tech at the hospital responds, “Well, I sent it, but I have no way of knowing if all of the images crossed over.”
You then ask the supervising tech, “Why doesn’t the tech have any way of knowing if all of the images crossed over?” The supervising tech responds, “There actually is a way to tell. The tech working tonight is a rotating tech and must not know how to find that information.” Mystery solved. (Here, only three “whys” were needed to get to the root of the problem.)
The supervisor then trains the tech on duty and develops a training plan for subsequent rotating techs.
The seven tools of QI are as follows:
- Flow chart
- Cause-and-effect diagram
Tip: Most quality issues can be solved with these seven basic tools of QI.
- Flow chart: This is the typical algorithm, and is a picture of the separate steps of a process in sequential order (Fig. 1.3).
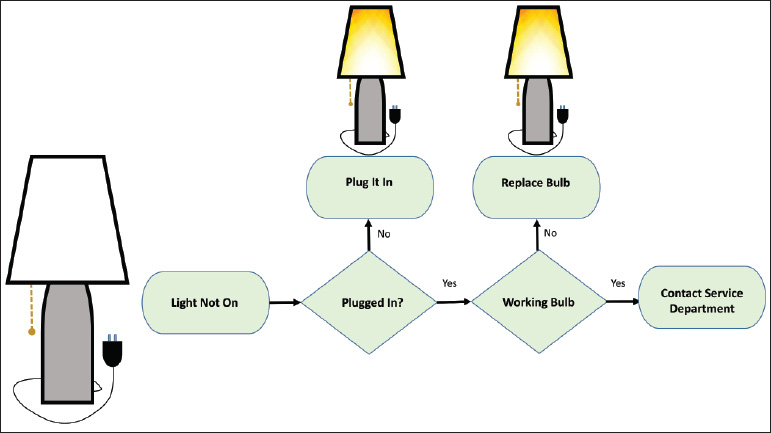
Fig. 1.3 Example of flowchart. Algorithm depicts steps needed to fix a light bulb.
- Cause-and-effect diagram: This is also known as a fishbone or Ishikawa diagram. (Dr. Ishikawa was a professor of engineering at Tokyo University and a pioneer in QI.) The fishbone diagram identifies many possible causes for a problem, helps to structure a brainstorming session, and immediately sorts ideas into useful categories. The five whys are often invoked in a fishbone diagram (Fig. 1.4).
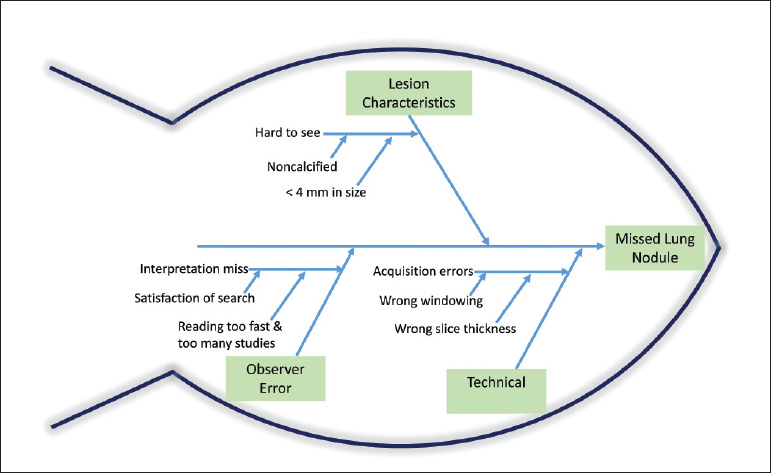
Fig. 1.4 Example of cause-and-effect diagram. Also known as a fishbone, this diagram helps to brainstorm the possible causes of a missed lung nodule.
- Check sheet: This is a structured, prepared form for collecting and analyzing data (Fig. 1.5).
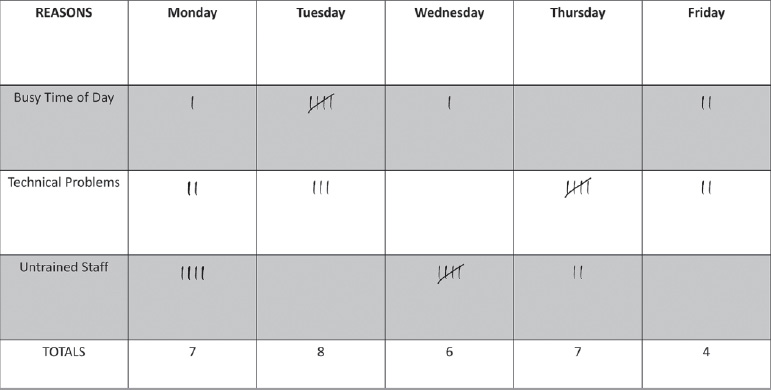
Fig. 1.5 Example of check sheet. This structured form assists in collecting and analyzing data to explain interventional radiology delays.
- Control chart: This is a graph used to study how a process changes over time. The data are plotted in chronological order. Using historical data, a control chart has a central line to illustrate deviations from the average, an upper line for the upper control limit, and a lower line for the lower control limit. This differentiates common causes of variation from special causes for variation (Fig. 1.6).
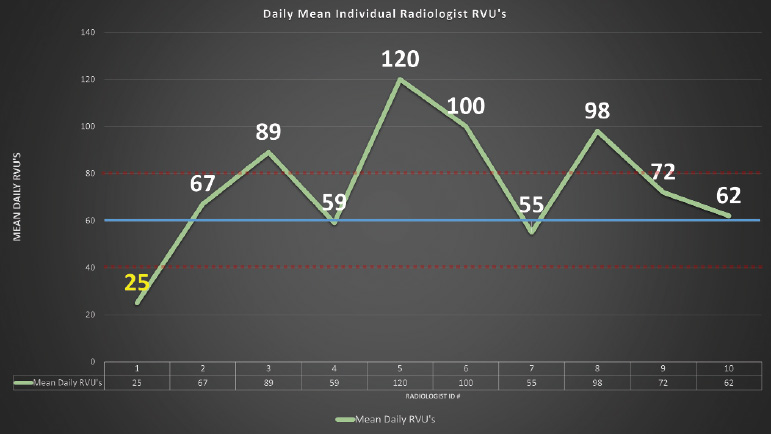
Fig. 1.6 Example of control chart. This chart assesses the average relative value unit (RVU) for members of a radiology group. Radiologist 1 falls below the normal control limit.
- Histogram: This is the most commonly used graph to show frequency distributions in the context of two variables. This represents the distribution by mean. If the histogram is normal, the graph takes the shape of a bell curve. Any variation from the bell curve is abnormal, and may take an array of shapes, such as right-sided skewed, bimodal, or even dog-food shaped (Fig. 1.7).
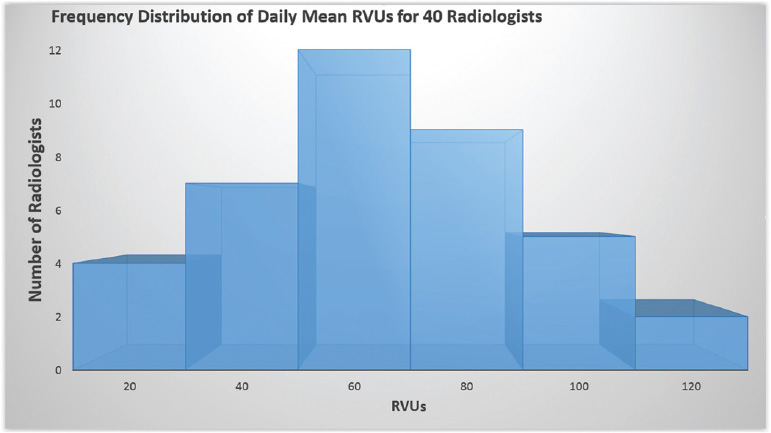
Fig. 1.7 Example of histogram. The graph shows the distribution of daily mean RVUs for 40 radiologists.
- Pareto diagram: A Pareto diagram is a bar graph. The lengths of the bars represent the frequency or cost (i.e., time or money) of each variable and are arranged with the longest bars on the left and the shortest bars on the right. This graph visually depicts which situations are most significant, permitting appropriate channeling of resources to fix the problem (Fig. 1.8).
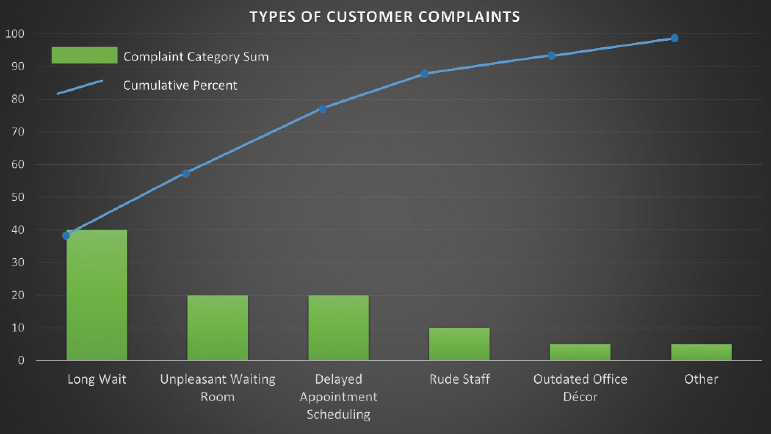
Fig. 1.8 Example of Pareto diagram. This graphically depicts the most significant causes of customer complaints. Types of customer complaints: Long wait (40%), unpleasantwaiting room, delayed appointment scheduling, rude staff, outdated office decor, other. In this example, customer complaints could be decreased by 80% if only the first three problems are addressed.
- Scatter diagram: A scatter diagram graphs pairs of numerical data, with one variable on each axis, to look for a relationship between them. This can be useful when trying to identify potential root causes of problems (Fig. 1.9).
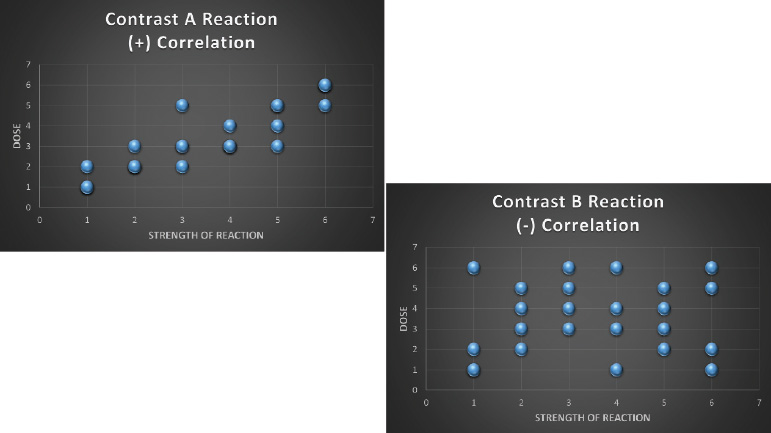
Fig. 1.9 Example of scatter diagrams. They demonstrate a good correlation between the dose of contrast A and reactions, but a poor correlation between the dose of contrast B and reactions.
Safety
The Joint Commission (TJC; formerly JACHO) issues national safety goals in medicine. There are a lot of important boards, but this one is really important, because if your institution is not TJC accredited, you lose funding and cannot run your business.
TJC is independent, not for profit, and accredits 21,000 healthcare facilities in the United States. Its vision statement is, “All people always experience the safest, highest quality, best value healthcare across all settings.”
In general terms, one of the bigger building blocks of the NIS is safety. Although safety concerns certainly didn’t originate in 1998, that year a landmark article was published (by the Institute of Medicine [IOM]), which revealed a shocking number of deaths resulting from medical-related errors. This article, entitled, “To err is human: building a safer health system,” brought about many positive changes in healthcare.17
The article had two key points. First, many deaths per year (44,000-98,000) were attributable to medical errors. For perspective, more people die in a given year as a result of medical errors than from either motor vehicle accidents (43,000) or breast cancer (42,000).
Second, the cause of these errors usually wasn’t bad people working in good healthcare systems, but rather, good people working in bad healthcare systems.
Tip: Most errors are preventable with operational changes.
Safety versus Error
Safety and error are a little bit different. Safety is defined as “freedom from accidental injury.” Error is defined as “failure of a planned action to be completed as intended,” or “use of the wrong plan to achieve an aim.”
The Hidden Troubles with Errors
In addition to potentially harming the patient, errors cost money and injure the public’s trust in the system.
On a more personal level, errors can cause you (as the radiologist) real problems.
Example: Say that you missed a cancer on a CT scan, and that your miss really did lead to the patient’s death. You will probably feel awful. Harboring shame and guilt, you might try to keep it a secret from friends and colleagues, and that adds stress. Plus, there is a decent chance that you will get sued. You are now the “second victim.” Healthcare professionals pay for their mistakes, in part, with psychological discomfort. This is similar to posttraumatic stress disorder, and this type of guilt and stress has been known to cause significant morbidity, including suicide. In these cases, it is important for others who are aware of the situation to console.18
Four Fundamental Factors Leading to Errors
The IOM article concluded that four fundamental factors typically led to errors. The mnemonic SLLaP was provided for these factors, and this stands for system, licensing, liability, and payment.
Tip: You can also remember SLLaP, as in getting slapped across the face for making an error (Fig. 1.10).
Fig. 1.10 Mnemonic SLLaP (System, Licensing, Liability, and Payment) of the four fundamental factors leading to errors.
System
This refers to the lack of a single system. Medicine is unfortunately often fragmented, or a “nonsystem.”
For example, when a patient shops from doctor to doctor, loss of information is commonplace. Non-system loss of information may also result from causes beyond the patient’s control (e.g., a change in the company insurance plan).
Licensing
Licensing exams have historically neglected to actually focus on medical errors. This problem is currently being rectified (as evidenced by our own NIS exam).
Liability
Legal issues frighten us into concealing our mistakes, so as a group, we usually lose the opportunity to learn from our colleague’s errors.
Payment
This refers to the failure of third-party payers to provide incentives (i.e., financial rewards) for safety.
Safe move: Organizations often name a “safety champion.” That individual is responsible for owning the safety processes and overseeing the safety reporting system.
Errors
Adverse Event
This is an injury caused by medical care and does not necessarily imply error or blame.
Examples: Pneumothorax post thoracentesis, headache following lumbar puncture, and anaphylaxis after intravenous contrast are adverse events.
When an adverse effect occurs, the system must undergo analysis to detect potential spots for improvement.
Preventable Adverse Event
This is an avoidable event in a particular set of circumstances.
Tip: Not all errors result in harm. But they are still errors and must be treated as such.
James Reason
James Reason is a human error psychology expert. He notes that human error is a social label that implies that the individual should have acted differently and is therefore responsible. This is the basis of the “shame and blame” culture that has been so common in healthcare. Shame and blame is a roadblock to process improvement.20
If we understand the root causes of these human errors, and there are many, we should be able to improve. Some of these causes include communication failure, lack of effective training, memory lapses, inattention, poorly designed equipment, fatigue, ignorance, and noisy or distracting working conditions.
Example: Reading screening mammograms in a secluded batched format (away from noise and distractions) improves accuracy.
Malpractice
Quiz: You miss a large pneumothorax on a chest X-ray, and this blatant miss is clearly below the standard of care. However, the ER doctor catches it right away, places a chest tube, and cures the patient. Did you commit malpractice?
Answer: No. See below.
Error and malpractice are different. You might make a whopper of an error, but unless the following four criteria are established, that error does not constitute malpractice.19
The four criteria needed for malpractice include:
- A doctor-patient relationship existed.
- The doctor was negligent.
- The doctor’s negligence caused the injury.
- The injury led to specific damages.
In addition, from a legal standpoint, the radiologist is generally obligated to meet the “standard of care,” that is, what would the typical radiologist have done in the same situation?
Errors in detection are the most common cause of radiology malpractice suits. Other causes of malpractice suits include errors in interpretation, errors in communication of results, and errors in follow-up testing suggestions.
Radiology Errors
The two broad categories of error in radiology are perceptual and cognitive.16
Perceptual Error
The most common radiologist error is a perceptual error. This is a missed finding and accounts for 70% of our errors.
Example: A perceptual error is the pulmonary nodule that you see immediately when you are asked to review the case, but for some reason, you didn’t see or dictate it the first time around. These errors are the hardest for us to accept.
Cognitive Error
The next most common radiologist error is a cognitive error. This error is the result of faulty interpretation of information. Secondary errors in the assessment of pretest probability, failure to seriously consider all relevant possibilities, and various forms of bias, may also contribute to cognitive errors.
Example: A cognitive error is the inappropriate further work-up of a clearly lipid-rich adrenal adenoma seen on a noncontrast CT, if you are not familiar with the criteria to definitively make that diagnosis.
Cognitive errors are more amenable to correction than are perceptual errors.
Other types of radiologist error include “treatment errors,” “failure of communication,” and “preventative errors.” A prevention error might include inadequate screening of a patient with marginal renal function prior to administering iodinated contrast.
For any error, the first step in the response is the same, and that is to deal with the immediacy of the situation and the patient. However, the best response after that first step varies, depending upon the type of error.
Active and Sharp, Latent and Blunt
Active and Sharp
Say you read a right knee MRI, but report it as a left knee MRI. You are the final step in the radiology system, and your error is termed an active error. Errors like yours on the front lines occur at the “sharp end” of the process. The sharp end is the last line of defense against an error. This error occurs at points of contact between a human and some aspect of a larger system. Active errors are readily apparent and easy to blame.
Tip: Remember that the sharp end of the process is on the front lines, since a radiologist poking his needle into a patient is clearly working with a sharp end.
Latent and Blunt
Now say you are the MRI tech who delivered the hapless radiologist that same case. You scanned a right knee, but accidentally labeled it as a left knee. You have committed a latent error, and these errors occur at the “blunt end” of the process. The blunt end includes support for frontline workers (e.g., internal operational personnel, policy makers, and leaders). Blunt end staff decisions affect patient care, but less directly than do sharp end staff decisions. Latent errors are the result of decisions made far from the bedside that impact patient care. These decisions may include organizational flaws (e.g., staffing decisions based on fiscal motivations) or equipment errors that make the human and machine interface less than intuitive.21
Example: The referring doctor has trouble with the cumbersome new picture archives and communication system and enters the wrong diagnostic code. The radiologist, uninformed of the correct diagnosis, is not able to specifically address the diagnostic question.
Tip: Latent errors are “accidents waiting to happen.”
Sentinel Event
A sentinel event is an unexpected occurrence involving death, serious injury, or risk thereof. A sentinel event is a big deal and signals the need for an immediate investigation and response. TJC takes these sentinel events very seriously.22
According to TJC, some of the most frequent examples of sentinel events include the following: delay in treatment, unintended retention of foreign body, operative/ postoperative complication, suicide, fall, medication error, and “wrong patient, wrong site, wrong procedure.” This last event is particularly common with interventional radiology.
Authority Gradient
This refers to the steepness of the command hierarchy. In general, a lower-level employee tends to be intimidated to speak up to or against a higher-level employee, even if that higher-level employee is making a mistake.
High authority gradients exist in most medical operations and impact negatively on safety.
Example: You and 10 other radiologists perform hysterosalpingograms (HSGs) at the same clinic, all with the same X-ray tech. You, for some reason, were not taught to close the plastic speculum at the time of removal from the patient’s vagina. All of the other radiologists correctly close the speculum. The tech hears your patients complain about discomfort, but does not hear the other radiologists’ patients complain. She correctly concludes that you are doing it wrong. However, she is intimidated by you and your position and chooses to ignore the problem. The result is that the procedural technique goes uncorrected and your patients continue to suffer.
Tip: High authority gradients undermine the safety culture as a result of underreported safety and quality problems.
SBAR
SBAR stands for “situation, background, assessment, and recommendation” and is a basic suggested communication framework that deals with an authority gradient. SBAR is largely used to help nurses and technologists frame discussions with doctors.23
The SBAR technique has become TJC’s stated industry best practice for standardized communication in healthcare. Nurses or technologists are taught to report in concise narrative form.
Example: “Dr. Carducci, this is Howard, the MRI tech from the Eastern clinic.”
Situation: “Here is the situation. We have patient Raj Agrawal for an MRI with gadolinium.”
Background: “He has a creatinine of 1.8 and an estimated glomerular filtration rate (eGFR) of 39. His labs are stable since a month earlier. He is 67 and takes high blood pressure medication.”
Assessment: “My assessment is that although he is at higher than average risk for developing renal problems, we still should be safe to give him the contrast.”
Recommendation: “I recommend that we proceed with the gadolinium, but give extra hydration and decrease the injected dose. Do you agree?”
Disclosing an Error
What should you do when an error occurs? Over the past decade, it has become clear that the best course of action when an error occurs is to be honest with the patient and family.29 Apologize, take the responsibility, and let them know exactly what steps will be taken to prevent similar events from occurring in the future. The very last thing you want is to appear as if you are trying to cover something up.
Tip: When an error occurs, definitely don’t cover it up or alter the medical record.
Evaluate Risk and Adverse Events
Root Cause Analysis
There is a lot more to optimal safety than simply fixing the immediate problem and blaming the directly involved individual.
When an error occurs, it is necessary to play detective and identify the source of the problem. This process is called “root cause analysis” (RCA).
RCA is a tool used to identify active and latent errors. This creates a narrative of the event with a timeline.24 This is also known as “systems analysis.” The first step in RCA is the quick fix to the actual problem.
The subsequent steps in RCA are to determine what could have caused something as rare as anaphylaxis to gadolinium to occur on consecutive days.
Tip: It is important with RCA to identify the system problems and avoid the trap of focusing on individuals’ mistakes.
“Never Event”
According to the National Quality Forum, this is an easily preventable event of sufficient importance that should never occur in a properly functioning healthcare system. The appearance of a never event is a red flag that the system is likely flawed, and a full investigation is mandated by law.
Example: Arterial embolization performed on the wrong patient, or on the wrong side of the correct patient, is a never event. However, a large pneumothorax following thoracentesis does not qualify for this definition, since this is expected to happen in a very small percentage of patients.
Failure Mode and Effect Analysis (FMEA)
This is the process used to prospectively identify error in a system, assessing each step that can go wrong. This is somewhat subjective and typically used in chemical plants and nuclear power (less so in healthcare). Steps of FMEA include the following: Map out the process. Identify where things can go wrong. Estimate the probability that the failure will be detected. Estimate the consequence and severity. Use the data to produce a “criticality index.”
Skill-Rule-Knowledge
The Skill-Rule-Knowledge classification of human error refers to the degree of the conscious control exercised by the individual over his or her activities.
Knowledge Error
Radiology example: Your ultrasound technologist doesn’t quite understand that the significance between a hypoechoic and an anechoic breast lesion may be dramatic.
Real-life example: You are looking for a specific apartment building while driving. Since it is nighttime and raining, and because you are in an unfamiliar and crowded city, you get lost.
These examples are both “knowledge errors.” They don’t happen because someone is interrupted or working too fast. These mistakes occur because the unskilled users simply don’t understand the process. Knowledge errors respond well to extra training.
Skill Error
Radiology example: A patient has a PET/CT that you report as negative. The patient then has a brain CT showing a metastatic lesion in the cerebellum. If you had changed the intensity of the brain on the PET images (which you usually do in your typical search pattern, but for some reason skipped this time), you would have noticed this metastatic focus on the PET.
Real-life example: You are driving on a freeway that you have taken 100 times. You always get off at the same exit, but this time you are deep into an important phone conversation and suddenly notice that you have missed your exit. This is a slip or a lapse and the type of error you make while on autopilot.
As noted previously, most errors in radiology fall into this category. Unlike a knowledge error, this type of error does not respond to more training. You already know everything you need to know about brain metastases, and you definitely know where that highway exit is located. This error is often caused by strong intrusions. Preventing intrusions, adding workflow checklists, creating redundancy, and having auto alerts can all help to minimize this source of error.
Rule Error
This error falls in between the other two.
Radiology example: You have developed standard reporting templates for a CT head and know exactly what verbiage is required to justify insurer reimbursement. However, the insurance company decides to change the rules, and now denies, “Altered level of consciousness” as a reimbursable code. “Altered mental status” is now the accepted verbiage. However, you are certain that the old way works, and you don’t know about the new rules. With your “strong but wrong” mentality, you wind up with a bunch of nonreimbursed scans.
Tip: The assumption that “more training” is the right fix for all errors is not true. One key in preventing future error is choosing the right corrective method.
High-Reliability Organization
“High-reliability organizations” can and must operate in a high-stress, high-risk environment.25 For example, aircraft carrier operators, firefighters, and the military fall into this category. Lucky us—so does medicine! When a code is called or when you are simply reading a PET/CT, lives are at stake. You can’t afford to let the ultrasound tech asking you a question or both telephones on your desk ringing distract you from successfully completing your top priorities. Those of us working in this type of high-reliability organization must be at the top of our game, even when the stakes are raised and the emotions are flying.
Five high-reliability organization characteristics are as follows:
- Preoccupation with failure (in a good way): This guarantees high vigilance and a low trigger to explore red flags. This also commits resources.
- Avoidance of oversimplification: The battalion chief of the firefighters or the CEO of a hospital might tend to oversimplify problems, but the staff working on the front lines (who vividly experience those problems) won’t permit that oversimplification. Frontline workers have the unique perspective to be able to explain the details to their superiors, so it is crucial to listen to them.
- Sensitivity to operations: Everyone from bottom to top in the chain of command needs a voice in operations. Collaboration across the ranks must be encouraged.
- Respect of expertise: The best person for the job must be permitted to do that job. Authority gradient challenges should be overcome.
- Dedication to resilience: A great system understands that errors will happen and is ready for them when they do. Acknowledge high risk, commit to safety, and create a blame-free environment. When mistakes happen, take them seriously, but learn to roll with the punches.
Human Reliability Curve
Scholars note (and then plot on curves) that as system factors improve, human performance increases, but will never reach 100%. Errors are inevitable.
Culture
Safety Culture
A critical step in organizational improvement is adopting a safety culture.
This is a blame-free environment where individuals are free to report errors or near misses, without fear of reprimand or punishment.26 This begins with the leadership but includes all employees. Communication is key and safety is always the top priority. In a safety culture, people pursue safety on a daily basis and take action when needed. This can sometimes be difficult, since pointing out blame to coworkers is often uncomfortable.
The Agency for Healthcare Research and Quality (AHRQ) has developed a patient safety culture survey to objectively measure the success of an organization’s safety culture.
Just Culture
A safety culture is also complemented by a just culture. A just culture maintains individual accountability by establishing zero tolerance for reckless behavior.27 A just culture distinguishes between human errors/slips, at-risk behavior, and reckless behavior.
Human Error/Slips
This is an inadvertent action, and often the result of current system design and individual behavioral choices.
Example: The portable intensive care unit X-ray just shot didn’t get recorded because the inexperienced X-ray tech pushed the wrong button. This tech shouldn’t be punished as if an intentional or reckless error had been committed. In fact, if the punishment is too severe for the “crime,” the tech may feel the undeserved pangs of the “second victim syndrome.” Human errors and slips should be managed through changes in design, procedures, and training. Action: console.
At-risk Behavior/Taking Shortcuts
This is an action where the person committing the error believes that the risk is justified. At-risk behavior is choosing to do something in a way that unintentionally imposes a chance for harm to occur.
Radiology example: Choosing to read mammograms on a non-Mammography Quality Standards Act and Program (MQSA)-approved monitor because all of the approved monitors are occupied is at-risk behavior.
Real life example: Driving above the speed limit is at-risk behavior.
At-risk behavior should be managed through removal of incentives for the behavior, creating better incentives, and improving situation awareness. Action: coach.
Reckless Behavior/Ignoring Required Safety steps
This is an action that knowingly puts someone in harm’s way. The risk is identified but ignored.
Example: You are a teleradiologist and receive payment per case read. The only cases on the list are PETCTs, for which you have no training. You know you should not read these cancer patients’ scans, but since you want to make money, you slug through them anyway. This is a conscious disregard for a substantial and unjustifiable risk. This should be managed through punitive action. Action: punish.
Tip: Console, coach, or punish based on the crime, not the outcome. Even if nothing bad resulted, reckless behavior deserves consequences.
Human Factors Engineering
Is it really safer to make a hands-free phone call while driving than to make a call with a handheld device? Psychologists in the field of human factors engineering analyze this type of question. These researchers consider human strengths and limitations when designing interactive systems and tools for people.
Forcing Function
The most effective solution to human error is a forcing function. A forcing function is a human factors engineering design that prevents the wrong thing from happening. It basically “idiot proofs” the system component in question. Many problems are fixable with automation types of forcing function.
Medical example: Say a ward in the hospital needs complete quarantine because of a possible contagion. You could hang up a bunch of warning signs, but that doesn’t guarantee that foolish people won’t still wander in. However, physically locking the ward entrance does guarantee a successful quarantine.
Real-life example: Microwave ovens use a forcing function. The oven won’t turn on until the door is closed.
Practice Communication
The ACR has developed practice guideline standards for the communication of diagnostic imaging findings.28 Consider the following questions.
- What should you do if you can’t reach the referring doctor, but there is a critical finding? For example, what if an outpatient brain MRI for headache shows an unexpected intracranial mass, and you conclude that the patient shouldn’t be driving?
- Should curbside consults be documented?
- Are all of the following satisfactory methods of nonroutine communication: text, instant message, email, and voice message?
- Can your tech give the referring service a nonroutine communication on your behalf?
- Is the ACR guideline for the communication of diagnostic imaging findings a legally binding document?
Answers to all of these, along with key points of the ACR document, are discussed below.
The ACR Guidelines
This ACR practice parameter is not a legally binding document. But if you deviate significantly, you should probably document why.
An effective method of communication should promote patient care, support the ordering physician/healthcare provider, minimize the risk of communication errors, and be timely.
The Other Guys
There is a reciprocal duty of information exchange, which includes the referring service. Communication is not simply a one-way street.
An imaging request should contain relevant clinical information, a working diagnosis, pertinent clinical signs and symptoms, and ideally a specific question to be answered. All of this is up to them, and this may be out of your hands.
Your Report
First, a physician (not a tech, physician assistant, or registered physician assistant) must generate the report. The report should include patient demographics and relevant clinical information. Any significant patient reaction should be documented, follow-up or additional diagnostic studies should be suggested (when appropriate), and, unless very brief, the report should contain an “impression.” The final report should be proofread, and abbreviations and acronyms limited, to avoid ambiguity. The report is a definitive document, in compliance with the appropriate regulations, transmitted to the ordering provider, and archived according to state and federal regulations.
Preliminary Reports
These may be either written or verbal and should become a part of the permanent record. Significant variation between preliminary and final reports should be promptly reported and documented.
Standard Communication
The interpreting physician should expedite delivery of the report in reasonable timeliness. This is usually delivered to the ordering physician and/or designees.
Informal Communication
We all encounter these sometimes challenging situations.
Example: Say the oncologist knows and trusts you and wants you to review a CT scan that your colleague read. This patient has a history of lung cancer, in remission, with a reported new renal mass. The oncologist wants to know if the mass is new, and if it is more likely metastatic or a separate new primary. To complicate matters, the only comparison he gives you is an outside report that did not describe a renal mass. This form of curbside consult, often in suboptimal conditions, carries inherent risk.
Tip: The key recommendation for informal interpretations is twofold: radiologists should document these interpretations and radiology groups should develop a formalized system for reporting outside studies.
Nonroutine Communication
Sometimes nonroutine communication is warranted. Indications may include the following:
- Findings needing immediate or urgent intervention (e.g., significantly misplaced lines, pneumothorax, or other deviations from the institution’s critical value conditions)
- Findings discrepant with a preceding same patient interpretation, where failure to act may lead to an adverse outcome
- Findings serious enough that, if not acted on, may worsen over time and result in an adverse outcome (e.g., infectious process, malignant lesion)
Methods of Nonroutine Communication
Use a method that will most effectively reach the treating service, avoid a potential break in continuity of care, and maximally benefit the patient.
This communication should be made by telephone or in person. Other methods (text, fax, voice message, instant messaging, email) may not guarantee timely receipt, may not be Health Insurance Portability and Accountability Act of 1996 (HIPAA) compliant, and are not recommended.
This communication may be accomplished directly by the interpreting physician or, when judged appropriate, by the interpreting physician’s designee. Your tech may give a result at your request.
When the referring service is unavailable, it may be appropriate to convey results directly to the patient.
Nonroutine Communication Documentation
This documentation is best placed in the patient’s medical record or report. Another option is to document in a departmental log and/or personal journal.
The documentation should include the time, method of communication, and name of the person to whom the communication was delivered.
Tip: Document all nonroutine communications. If you didn’t document, you didn’t do it (at least legally).
Self-referred Patient
A self-referred patient establishes a doctor-patient relationship with the radiologist, and with that comes the responsibility for the radiologist to communicate findings directly to the patient.
Third-party Referrals
When patients are referred by third parties (insurance companies, employers, federal benefit programs, and lawyers), findings should be communicated to the third party, as the referrer. In certain situations, the radiologist may deem it appropriate and ethically correct to also communicate the findings directly to the patient.
Final ACR Points
The ACR advises radiology departments to develop written communication policies, which must be shared and followed. The ACR also recommends that all imaging reports be made readily available to the patient. This can be accomplished in various ways, including the posting of imaging reports through a web-based portal.
Swiss Cheese
Safety expert James Reason described the Swiss cheese model of accident causation. Organizations have many layers of defense, but none are foolproof, and all have holes. Sometimes these holes align, allowing the errors to result in patient harm.
Take the following fictional scenario and the “Swiss cheese” type steps that transpired to result in a bad outcome.
Example Overview
A radiologist misses a small cavernous sinus meningioma on a CT head. This leads to a delay in diagnosis. When the mass is finally detected, the patient has lost vision in one eye. What went wrong?
First problem
The radiologist was slightly distracted. At the same time he was reading the study, he received an anxious call from the ER doctor needing him to quickly open up a “rule-out extravasation” trauma CT abdomen. The radiologist asked the ER doctor to hold on for just a second, while he “quickly finished up a head CT.” The radiologist isn’t usually asked to immediately look at an emergency case, but he was this time.
Second problem
The patient changed the order. The study was ordered with contrast. Although the patient had no contraindication, she decided to decline the contrast. The technologist later noted that the patient was somewhat rude and difficult to deal with. On the noncontrast study, the meningioma was isodense to brain (and difficult to see). Months later on the post contrast follow-up study, the meningioma was enhancing/hyperdense and easily detectable. A patient doesn’t usually change the referring service order, but she did this time.
Third problem
Poor doctor-patient communication. The follow-up recommendations were not clearly conveyed during the ER doctor and patient discussion. The patient claims the ER did not specifically tell her to get a contrast study or MRI, if the symptoms persisted. The ER service usually is very careful to provide and document follow-up recommendations, but perhaps because this patient was somewhat difficult to deal with, either the conversation or at least the documentation was neglected.
These Swiss cheese-type error layers unfortunately coordinated to permit the delay in diagnosis (Fig. 1.11).
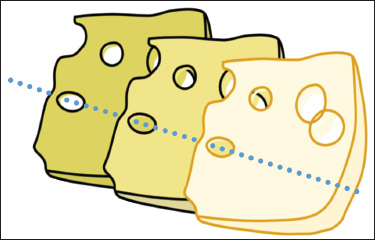
Fig. 1.11 Swiss-cheese-type error layers. Compound buildup of small errors leading to a large complication.
Key Safety Goals
Key patient safety goals, per TJC.30
Use at Least Two Patient Identifiers Before Any Procedure
Satisfactory identifiers include the patient’s name, date of birth, phone number, patient ID number, government-issued photo ID, and last four of the social security number. The patient’s location or room number cannot be used.
Report Critical Results of Tests on a Timely Basis
Label all medications. In radiology, this includes medicines in syringes. Do this in the area where medicines and supplies are set up (Fig. 1.12).
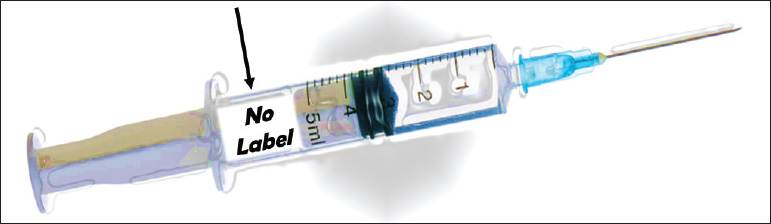
Fig. 1.12 Label all medications, including medicine in syringes.
Communicate Accurate Patient Information
Take extra care with patients who use blood thinners. Record and pass along correct information about a patient’s medicine.
Prevent Infection
Use the hand-cleaning guidelines from the Center for Disease Control and Prevention (CDC) or the World Health Organization (WHO).
Prevent central line-associated bloodstream infections.
The Procedural Radiologist
The procedural radiologist, a qualified assistant (nurse practitioner or physician assistant), or the referring provider, should perform a specific patient assessment. The assessment should include the history and physical, risk assessment for sedation (if needed), and relevant preprocedure lab tests or other diagnostic tests.
Consent
Informed consent is required for all invasive and some noninvasive medical procedures.31 Patients have the right to be informed about the procedures and may request to speak with the radiologist, even when local policy doesn’t require the radiologist to actually obtain the informed consent.
Who Can Obtain the Consent?
This can be obtained by the healthcare provider performing the procedure or by another qualified person assisting the provider. Your tech or aid can obtain the consent. Note that the physician or other provider performing the procedure remains ultimately responsible for answering patient questions/concerns.
Who Can Give the Consent?
The patient should give consent (unless mentally incapable or has not reached the locally recognized age of majority). In those instances, or if the patient is otherwise not able to give consent, permission may alternatively be given by a relative, guardian/legal representative, domestic partner, or healthcare provider who knows the patient.
What Must the Consent Include?
This informed consent must include a discussion of benefits, potential risks, reasonable alternatives to the procedure, and risks of refusing the procedure. Note that it is probably not reasonable to discuss every conceivable risk. This risk disclosure is a balance between reasonable consent and unreasonable alarmist information. For example, discussing the risk of death as a result of anaphylactic reaction from intravenous contrast is probably not necessary.
What About in an Emergency?
In an emergency situation, the medical staff may provide treatment without consent to “prevent serious disability or death or to alleviate great pain or suffering.”
The Easiest Settlement
A friend of mine outside of work happens to be a malpractice attorney (…”Keep your friends close…”…right?) He told me the story of “the easiest settlement he ever had.” Something went wrong during a medical procedure, and during the preliminary discovery it was noted that nobody had ever obtained the consent for the procedure. The doctors and staff had simply forgotten. Open and shut case for the plaintiff.
Tip: Trust no one and assume nothing. Double-check the consent.
Universal Preprocedural Verification Process
The three keys (Fig. 1.13)
- Confirm correct surgery on correct patient at correct body part. Attempt to involve the patient in this confirmation. Additionally, identify the items needed for the procedure. Use a standard list to verify availability of the needed items, and then match these items to the patient.
- Mark the procedure site. Use an unambiguous mark, which is preferably standardized throughout the organization. Only the person performing the exam, or a specific designee, should make the mark. The mark should be at or near the correct site and remain visible after prep and draping. The use of adhesive markers is not permitted. On occasion, a mark is not possible (i.e., on a mucosal surface), or advised (i.e., on the skin of an infant, who may be at risk for permanent stain/tattoo). In those cases, adhere to local policies.
- Perform a “time-out.” Time-out procedures are mandatory for all invasive procedures and for some noninvasive procedures. A time-out should be standardized and documented, and should occur just prior to the procedure. A designated team member should start the time-out, and all members of the team must share involvement and ultimately communicate and agree. The patient should be involved in the process, if he or she is able. If multiple procedures are planned for a given patient, multiple time-outs are required.

Fig. 1.13 Keys to universal preprocedural verification.
Medication reconciliation
This is the process of reviewing the patient’s complete medication regimen at a point of transition and comparing it with the regimen being considered for the new setting of care. This should be done on admission, transfer, and discharge.
Six “rights”
Any time medication is administered, six elements must occur. The right medicine should be given to the right patient, via the right route, with the right dose, at the right time, and with the right documentation. This alliterative phrase constitutes the six “rights” of medication administration.
Simulation-Based Training
Simulation is a learning technique that replaces (or amplifies) real-life experiences with guided ones that replicate substantial aspects of the real world. This often takes place in an “immersive” fashion. In medicine, simulation-based learning can help develop healthcare professionals’ skills, while protecting patients from unnecessary risks.32
Tip: “I hear and forget. I see and remember. I do and I understand.”—Confucius (551-479 BC)
For example, we have all used simulation with training models associated with Advanced Cardiovascular Life Support (ACLS) and Basic Life Support (BLS) courses. There are a lot more examples in medicine. In addition to technical and functional training, simulation-based learning is useful for problem-solving, decision-making skills, and interpersonal skills. Some uses in radiology include virtual procedural stations (to practice image-guided biopsies), simulated clinical environments (to practice codes or contrast reaction scenarios), and electronic medical records (for staff to practice system integration or patient scheduling).
Not all simulation works or is optimally devised. Some considerations when assessing a simulation’s effectiveness include: Are the simulated objects accurate reproductions? Is this particular subject amenable to simulation training? Does the simulation successfully teach what is required? Is there a better way to teach this subject instead of simulation? Does this simulation predict real-life performance?
Tip: Listen to Confucius. Incorporating simulation training in your practice—drilling code procedures, for example— adds another layer of understanding and safety.
Appropriateness Criteria
The ACR has developed appropriateness criteria and decision support. The purpose is to assist physicians in making good imaging decisions for various patient clinical situations.33
These criteria rely on the best evidence available, employ the input of radiologists and other medical specialists, and are posted on the National Guidelines Clearinghouse (NGC), a subset of the AHRQ. Topics include diagnostic radiology, interventional radiology, and radiation oncology.
Ten ACR appropriateness imaging criteria topics include breast, cardiac, gastrointestinal, musculoskeletal, neuro, pediatrics, thoracic, urologic, vascular, and women’s imaging. Expert panels comprised of radiologists and clinical specialists outside of radiology maintain the topics, each of which contains various clinical conditions.
Each variant is scored on a 1-9 scale (1 = low, 9 = high).
- 1-3: test usually not appropriate.
- 4-6: test may be appropriate.
- 7-9: test usually appropriate.
Additionally, relative radiation risk is included for decision support.
Tip: Decision support use will be mandated by CMS for reimbursement in 2017.
Practice Parameters and Technical Standards
The ACR practice parameters and technical standards define principles and technical parameters and describe a range of acceptable approaches for diagnosis and treatment. These are reviewed at least every 5 years and allow for differences in training, experiences, and local conditions. Technical standards are quantitative or measureable and focus on physics and nuclear medicine.
Peer Review
Peer review is required by the ACR to ensure that ongoing quality review processes are in place. There is no punitive aspect, the process is anonymous, and peer review data are immune to legal action or discovery. A variety of biases may hamper the peer review process, and these should be avoided as much as possible.
TJC checks that a peer review process is ongoing but does not review the actual data.
RadPeeR
RadPeeR is a program that many radiology departments use for their peer review. Radiologists typically sample 5 to 10% of each other’s cases. Specialists usually only rate other specialists, and the samples are random.
RadPeeR data is often conveniently linked to ongoing professional practice evaluation (OPPE) and focused provider practice evaluation (FPPE).
RadPeeR data are scored as follows:
- Concur.
- Discrepancy, but not ordinarily expected to be made. An understandable miss.
- Discrepancy, and diagnosis should be made most of the time.
- Discrepancy, and diagnosis should be made almost every time. A clear misinterpretation of the study.
Additionally, RadPeeR data 2, 3, and 4 are further subdivided into the following:
- Unlikely to be clinically significant.
- Likely to be clinically significant.
Tip: QI data are not discoverable in a court of law.
Miscellaneous Organizations Contributing to Quality and Safety
ACR: RadPeeR, modality certification, practice guidelines, and technical standards, BI-RADS (LI-RADS, PI-RADS, etc.), and appropriateness criteria.
Radiologic Society of North America (RSNA): quality storyboards, PQI projects.
Agency for Healthcare Research and Quality (AHRQ): government agency, part of Health and Human Services.
Institute for Healthcare Improvement (IHI): organization dedicated to improve healthcare worldwide.
National Quality Forum (NQF): reported on “Never Events.”
The Joint Commission (TJC): required for licensure. May audit without warning.
Nuclear Regulatory Commission (NRC): licenses and radiation safety.
Magnetic Resonance Imaging Safety
Quiz: If a patient codes while in the scanner, should you press the quench button (which turns off the magnet) so that you can safely initiate BLS in the scanner room?
Answer: No. If there is a cardiac arrest in the MR suite, immediately move the patient to a magnetically safe location (Zone 3 or lower), and then initiate BLS.
Why Not Press Quench?
Every MR suite has a red button on the wall for quenching (and a quench turns off the magnet). However, a quench also causes dangerous room heating and release of noxious gases. In addition, a completed quench is not instantaneous. It might take a couple of minutes, and seconds count in a code situation.
When Should You Press Quench?
If there is a metal-related dangerous situation (e.g., an oxygen tank has smashed into the gantry and injured a patient), then quenching is the correct option. During a quench, make sure to evacuate the room because of the dangers described above.
To minimize the significant ferromagnetic safety risks of the MR scanner magnet, special mandated precautions exist for every MRI department.34 There are four zones and they are all color-coded. Zone 1 (green) is the safest and most removed from the magnet. Zone 4 (red) is actually in the MRI room.
The four MR safety zones are as follows:
- Zone 1: outside (green)
- Zone 2: nearby, but no door to MRI suite (blue)
- Zone 3: nearby, with door to MRI suite (yellow)
- Zone 4: room housing the MRI (red)
Contrast Allergies and Reactions
The two main challenges associated with iodinated contrast administration are contrast-related allergies and contrast-induced nephropathy (CIN).35
Incidence
The incidence of any contrast reaction is 0.2 to 0.7%. The incidence of a severe reaction with low osmolality contrast is 0.01 to 0.02%. The greatest risk factor for a reaction is a history of a prior contrast reaction. This increases the risk of subsequent reaction fivefold. However, even in a patient with a history of prior reaction, and without the addition of a pretreatment regimen, the risk of subsequent reaction is still less than 10%.
Shellfish, Asthma, and Atopic Patients
Atopic patients have a twofold to threefold increased risk of reaction. Asthmatic patients may also have a slightly increased risk. Shellfish allergy patients have an equivocal increased risk of contrast reaction.
Premedication
Prednisone: 50 mg PO 13 hours, 7 hours, and 1 hour prior. Diphenhydramine (Benadryl): 25 to 50 mg intravenous (IV)/ intramuscular (IM) or PO 1 hour prior.
Tip: Note that IV steroids are not effective when administered less than 4 to 6 hours prior to contrast.
What can premedication accomplish?
Premedication is proven to reduce the incidence of minor reactions. Premedication is not proven to protect against severe life-threatening injuries, although the rarity of severe reactions makes it difficult to study this question. For practical purposes, if a patient has a history of a severe reaction (and if after careful risk-benefit assessment, the decision is made to administer contrast), a premedication regimen is recommended.
Breakthrough reactions
Some patients will exhibit breakthrough reactions despite premedication. These reactions are most often similar to the index reaction. If these patients are subsequently premedicated, the large majority won’t have another breakthrough reaction. Patients with a mild index reaction have an extremely low risk of subsequently developing a severe breakthrough reaction. Severe allergies to any other substance are associated with a somewhat higher risk of developing a moderate or severe breakthrough reaction.
Tip: Anaphylactic reactions are unpredictable and life-threatening.
Treating the Radiology Patient with a Contrast Reaction
Mild reaction
If a patient develops urticaria from contrast, no specific treatment is usually indicated. (Discontinue the injection if not already completed.) Benadryl improves the urticaria but also causes mild sedation.
More-Serious Reactions (Fig. 1.14)
Bronchospasm
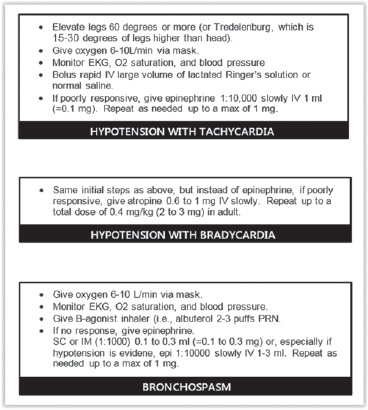
Fig. 1.14 Treating patients with contrast reactions.
Give oxygen 6 to 10 L/min via mask. Monitor electrocardiogram (EKG), oxygen saturation, and blood pressure. Give β-agonist inhaler (i.e., albuterol 2-3 puffs, when necessary). If there is no response, give epinephrine.
Give epinephrine subcutaneous (SC) or intramuscular (IM) (1:1,000) 0.1 to 0.3 mL (0.1-0.3 mg) or, especially if hypotension is evident, epinephrine 1:10,000 slowly intravenous (IV) 1-3 mL. Repeat as needed up to a maximum of 1 mg.
Hypotension with tachycardia
Elevate legs 60 degrees or more (or Trendelenburg, which is 15-30 degrees of legs higher than the head). Give oxygen 6 to 10 L/min via mask. Monitor EKG, oxygen saturation, and blood pressure. Bolus rapid IV large volume of lactated Ringer’s or normal saline. If the response is poor, give epinephrine 1:10,000 slowly IV 1 mL (0.1 mg). Repeat as needed up to a maximum of 1 mg.
Hypotension with bradycardia (vagal)
Same initial steps as above, but instead of epinephrine, if poorly responsive, give atropine 0.6 to 1 mg IV slowly. Repeat up to a total dose of 0.4 mg/kg (2-3 mg) in an adult.
Physiologic but Undesirable Effects
These include arrhythmias, depressed myocardial contractility, cardiogenic pulmonary edema, functional hypocalcemia, and even seizures. Contrast problems are often dose and concentration dependent. It is reasonable to consider slightly lowering the dose in a higher-risk patient.
Contrast Nephropathy
This is defined as the impairment of renal function attributable to recent contrast administration. There is some debate on the standard criteria, but many make this diagnosis when there is a 25% increase in serum creatinine from baseline, or a 0.5 mg/dL increase in absolute value, within 48 to 72 hours of intravenous contrast administration. Creatinine levels typically peak within 2 to 5 days and revert to normal within 7 to 10 days. The development of permanent renal dysfunction is rare, but there does appear to be a (complex) relationship between CIN, additional morbidity, and even mortality.
Risk Factors
Age, chronic kidney disease (CKD), diabetes, hypertension (HTN), metabolic syndrome, anemia, multiple myeloma, hypoalbuminemia, renal transplant, hypovolemia, and decreased left ventricular ejection fraction (LVEF) are all risk factors. Low osmolality contrast is less nephrotoxic than high osmolality contrast. Cardiac procedures result in a much higher incidence of CIN than do diagnostic radiology procedures.
Prevention
Giving IV fluids before contrast administration is the most proven method of reducing risk. One suggestion is to begin hydration 6 hours prior to contrast and continue for 6-24 hours afterward. Congestive heart failure and other fluid-intolerant patients pose a special challenge.
A variety of other pretreatment regimens, including mannitol, lasix, theophylline, endothelin-1, and fenoldopam, are less proven, and use of these agents for the prevention of CIN is not recommended.
Using a lower dose of contrast may be helpful. Most authors agree to keep the contrast dose less than 100 mL, since studies have shown that the need for subsequent dialysis when contrast is kept to that dose or lower is very rare.
For a patient with a moderate to severe risk of CIN, the estimated glomerular filtration rate (eGFR) should be estimated precontrast and then remeasured 24 to 48 hours postcontrast. If CIN develops, hydration is the cornerstone of therapy.
Tip: The best treatment for CIN is prevention. Screen appropriately, use the lowest dose of contrast possible, and ensure IV hydration.
Quiz: Is taking metformin a risk factor for developing CIN?
The Story with Metformin
This oral diabetes medicine can result in a dangerous buildup of lactic acid, but only if the contrast medium causes renal dysfunction and the patient continues to take the metformin. The safest way to approach these patients is to have them withhold their metformin for 48 hours after contrast administration. (They will likely need to contact their referring physician to make alternative glucose management plans during this time.) If normal and stable creatinine is subsequently confirmed at 48 hours, the metformin may then be safely restarted.
MRI and Gadolinium
A true allergy to MR contrast agents is very rare (reported incidence 0.004-0.7%). Life-threatening reactions are even more rare (0.001-0.01%). Despite the rarity, problems do occur, and on-site staffing to monitor MR contrast is always mandated.
Gadolinium and Nephrogenic Systemic Fibrosis
Use of gadolinium-based contrast medium in patients with moderate chronic kidney disease (CKD) and an eGFR of less than 30 mL/min has been implicated in the development of nephrogenic systemic fibrosis (NSF), a chronic debilitating illness with no cure.
The major risk factor for developing NSF is end-stage CKD (Stage 5, eGFR < 15 mL/min) or severe CKD (Stage 4, eGFR between 15 and 29 mL/min). Stage 4 patients have a 1 to 7% chance of developing NSF after one or more exposures. Most patients who develop NSF are already on dialysis.
There has only been one published report of a patient with an eGFR > 30 mL/min developing NSF.
Other risk factors for NSF include the use of higher doses and multiple doses of gadolinium, currently receiving dialysis, and acute kidney injury.
Recommendation
If the eGFR < 30 mL/min, do not administer gadolinium. If the eGFR is between 30 and 45 mL/min, it is probably safe to administer, but use the following to shape your final decision. Is the eGFR stable or falling? Is the patient on dialysis? Has there been a recent renal insult? If the answer to all three questions is no, it is likely safe to administer contrast.
Tip: To prevent NSF, screen appropriately. Use the lowest dose of contrast possible and ensure hydration.
What About the Fetus?
No adverse effects to the fetus have been documented after a pregnant woman has received gadolinium. However, there is the theoretical risk of potential dissociation of gadolinium. (This is also the proposed mechanism for the formation of NSF.) So, gadolinium is relatively contraindicated in the pregnant patient.
Quiz: Should a patient discontinue breastfeeding after receiving gadolinium? How about for iodinated contrast?
Answer: No for both. While it is true that very small amounts of both contrast agents have been detected in breast milk, this extremely small volume is considered safe.
Extravasation
The tech enters the reading room with the bad news that there has been a contrast extravasation. Despite shrinking down into your comfortable chair, trying to go unnoticed, the tech selects you for help. What do you do?
Quiz: Which is more effective in treating contrast extravasation: warm compresses or cold compresses?
Answer: Trick question. There is no clear evidence to favor the superiority of either. Both are reasonable options.
Risk Factors
These are risk factors for both contrast extravasation and for increasing volume of extravasated contrast: inability of the patient to communicate, severe illness, abnormal limb circulation, distally positioned venous access site, multiple punctures in the same vein, and the use of an indwelling line for greater than 24 hours.
Tip: Although the frequency of extravasation is probably not related to the injection flow rate, the severity of the extravasation is likely greater with a power injector.
Most patients have no significant sequelae from extravasation. However, each patient needs assessment, since prompt medical attention is mandated if complications do occur.
Complications
Compartment syndrome and skin necrosis are the main two potential complications of extravasation. The risk of compartment syndrome increases as the volume of contrast increases. Tissue necrosis may occur since extravasated contrast is toxic to skin and the surrounding soft tissues. This risk of necrosis increases in patients with arterial compromise, poor venous drainage, or poor lymphatic drainage.
Treatment of Contrast Extravasation
Elevate the extremity. Either warm or cold compresses are reasonable treatments. There is no clear evidence to support attempting aspiration of the contrast.
Contrast Warming
Contrast media viscosity decreases with increasing temperature. Warming contrast media from room temperature to body temperature decreases viscosity and decreases resistance during the injection. Both of these are desirable effects and may result in improved vascular opacification. This is especially apparent and/or important in the following circumstances: with higher flow rate injections, when utilizing higher viscosity contrast agents, for direct arterial injections through small caliber catheters, and when timing of the bolus and peak enhancement are critical.
To warm the contrast, most institutions use an external incubator kept at or near 37°C. In addition to these warming devices, warming sleeves are used to keep prewarmed bottles, or syringes from prewarmed bottles, warm for about an hour.
Since contrast media are considered to be medications, TJC has jurisdiction and mandates keeping a daily log and documenting regular maintenance for each warming device. This has proven to be a deterrent for some institutions to warm their contrast.
Studies have raised the possibility that warming iodinated contrast may reduce the incidence of mild contrast reactions or extravasation, but this has not been conclusively demonstrated.
Note that gadolinium is given at room temperature and should not be externally warmed.
Tip: For CT, warm the iodinated contrast. For MRI, do not warm the gadolinium contrast.
Radiation Safety
We have come a long way with radiation safety since Mrs. Roentgen first put her hand in front of a cathode ray tube. There are now a number of thoughtful radiation safety programs.36
Radiation Programs
Image Gently
This was initially produced by the Society of Pediatric Radiology, with the goal of raising awareness and minimizing radiation doses in pediatrics. The first focus was on children and their CT scans.
Step Lightly
This was initially introduced by pediatric interventional radiologists, who provided educational resources to further the goal of decreasing fluoroscopic doses. There are three phases with this program: Phase 1 educates the radiologists, technologists, and physicists. Phase 2 educates the referring services. Phase 3 educates the parents and public.
Image Wisely
This is the adult counterpart of Image Gently and was formed by the RSNA and the ACR. The focus is twofold: one, optimizing protocols and appropriate use of imaging, and two, communicating with patients, the public, and the medical community. The primary focus thus far has been with CT scans.
Patients are now able to track their exams and cumulative radiation doses with individual “patient medical imaging records.”
Considerations When Explaining Radiation Risks to Patients
First of all, it is important to ensure that the exam is appropriate. It is also important to place context in the patient’s diagnosis. Discussion of risk of the exam should also include the risk of not performing the exam. It is often a good idea to compare radiation risk to other radiation risk exposures (e.g., the radiation exposure for traveling in an airplane at 30,000 feet compared to the radiation exposure for the radiology test in question). Try to explain to the patient that risks are discussed in terms of populations and that individual risk, although obviously desired, is very difficult to determine.
CT Dose Index
This is a standardized measure of radiation dose output of a given CT scanner. This permits comparison with the radiation output from other CT scanners. Note that the CT dose index is a dose estimate and does not give the actual dose received by the patient. (The dose received depends on multiple factors including the CT scanner, technical parameters, scan protocol, number of phases, pitch, and tissue composition, size, and frequency. Medical physicists can calculate an estimated dose based on parameters of the study and specific patient factors.)
There are two main parameters calculated and reported by CT scanners:
- CTDI vol: Volume-based CT dose index (units: mGy).
- DLP: Dose-length product (units: mGy-cm). Note that DLP = CTDI vol × scan length (for helical scanning).
American College of Radiology: Dose Index Registry
Data of CTDI vol and DLP for CT scans performed are tracked and compared to those of other institutions. Facilities may use this data to track their own performance and adjust protocols.
The ACR has provided several reference CTDl vol values. These values let practices know whether their numbers are at least “in the ballpark”:
- 75 mGy for a head CT
- 25 mGy for an adult abdomen CT
- 20 mGy for a pediatric abdomen CT
ALARA
Most of us are familiar with ALARA (as low as reasonably achievable).
Some key elements of ALARA include the following:
- Perform an exam only when it is indicated. If possible, consider ultrasound (USN) or MRI as nonionizing radiation imaging alternatives.
- Use the lowest dose techniques to obtain images. Modify current (mA) and tube potential (kV) for patient size.
- Use a lower kV for smaller patients when using iodinated contrast.
- Minimize multiphase protocols.
- Limit the length of long axis scanning.
- Document the dose in the medical record (for fluoroscopy and CT).
Five Test Indications that Should Be Questioned
According to the ACR, when “Choosing Wisely,” the following test indications should be questioned and probably not performed:
- No imaging for uncomplicated headache.
- No imaging for low pretest probability of pulmonary embolism. This would include a negative D-dimer.
- No pre-op CXR for a patient with an unremarkable history and physical exam. (CXR is probably reasonable if the patient has acute cardiopulmonary disease, or is older than 70 years, has chronic stable cardiopulmonary disease, and has had no CXR within the past 6 months.)
- No CT for suspected appendicitis in a child without first at least considering USN.
- No follow-up ultrasound for inconsequential adnexal cysts (e.g., classic corpus luteum cyst measuring less than 5 cm, 1 cm or smaller simple cyst in a postmenopausal woman).
Professionalism and Ethics
The Health Insurance Portability and Accountability Act of 1996 (HIPPA) required the U.S. Department of Health and Human Services (HHS) to adopt national standards for electronic healthcare transactions and code sets, unique health identifiers, and security. Congress subsequently mandated the adoption of federal privacy protections for individually identifiable health information.
Authorization not required. The following are situations for which individual authorization is “not” required for transfer of data: fraud or abuse detection, domestic violence or neglect, payment, quality of competency assurance, compliance activities, oversight agencies, judicial and administrative proceedings, law enforcement purposes, and worker’s compensation cases.
Statistics
Sensitivity
The proportion of people who have the disease and test positive for it.37
A test with a high sensitivity is most useful for ruling out disease.
You can remember this by SNOUT: Use the test of SeNsitivity to rule OUT disease (Fig. 1.15).

Fig. 1.15 Sensitivity testing. Use the test of SeNsitivity to rule OUT disease (SNOUT).
For example, a chest CT has a very high sensitivity for the detection of a pulmonary nodule. If no nodule is detected, it is very unlikely that the patient has a pulmonary nodule.
Specificity
The proportion of people who do not have the disease and test negative for it.
A test with a high specificity is most useful for ruling in the disease.
You can remember this by SPIN: Use the test of SPecificity to rule IN disease (Fig. 1.16).

Fig. 1.16 Specificity testing. Use the test of SPecificity to rule IN disease (SPIN).
For example, a lower extremity Doppler ultrasound has a very high specificity for the detection of a blood clot. If a clot is detected, it is very likely that the patient indeed has a clot.
Positive Predictive Value (PPV)
The proportion of people with positive test results who actually have the disease (TP = true positive; FP = false positive):
PPV = TP/(TP + FP).
Negative Predictive Value (NPV)
The proportion of people with negative test results who do not have the disease (TN = true negative; FN = false negative):
NPV = TN/(TN+ FN).
One way to avoid confusing PPV and NPV is to imagine that you are a patient and have just received a positive test result. What is the probability that you really have the disease (i.e., how worried should you be)? If the positive predictive value is high, then you should be worried. The converse thinking is used with NPV.
Accuracy
The sum of TP and TN divided by the total number of subjects studied.
Precision versus Accuracy
Accuracy is how close a measured value is to the actual (true) value. Precision is how close the measured values are to each other (i.e., how much variation exists with repeated measurements).
One example of precision and accuracy is the utility of camera-based scintigraphy in nuclear medicine to determine the GFR. This method is considered precise but not accurate. Here, determining the absolute GFR is difficult. Since the scan has good precision, however, serial scanning is effective in assessing whether the unknown GFR is getting better or worse.
Tip: Something that is precise could be precisely wrong every time.
Memory tip:
- aCcurate is Correct.
- pRecise is Repeatable.
Receiver Operating Characteristic Curves
These curves plot the “sensitivity” versus “1-specificity.” The “sensitivity” is the y-axis and is also known as the true-positive rate. “1-specificity” is the x-axis and is also known as the false-positive rate. The closer the receiver operating characteristic (ROC) curve is to the upper left-hand corner, the higher the overall accuracy of the test. A test with perfect discrimination (no overlap in the two distributions) has a right angle ROC curve that actually passes through the upper left corner (100% specificity and sensitivity). A straight 45-degree positive slope diagonal line represents a 50:50 test. The flip of a coin would yield the same results.
Quiz: How does prevalence of disease affect these numbers?
Answer: A critical concept is that the sensitivity, specificity, and the ROC curve (which is a graphical representation of the sensitivity and specificity) are intrinsic properties of a test and do not depend on the population being tested.
However, PPV, NPV, and accuracy are all affected by disease prevalence. The more rare the condition, the more likely a negative test is truly negative, and the less likely a positive test is truly positive.
Memory tip: If a statistic is affected by disease prevalence, you will constantly need to recalculate the results. That makes you very tired, so you will need a NAP (NPV, Accuracy, and PPV).
Radiology Error and Bias
Satisfaction of Search
This source of error occurs when the radiologist identifies a finding and then stops searching, even though another important abnormality is also present. This term is used in other fields but was actually first described for radiology.
Other Sources of Bias
There are many potential sources of error in statistical analysis, and a variety of biases contribute to these errors.38
- Selection bias occurs when data for analysis are compiled in such a manner that proper randomization is not achieved.
- Spectrum bias, a subtype of selection bias, occurs when the sample is missing important subgroups.
- Verification bias occurs when the results of a diagnostic test affect whether the gold standard procedure will be used to verify the test result.
- Sampling bias occurs if some members of the population are either more or less likely to be included in the study.
- Measurement bias occurs when methods of measurement are dissimilar between different groups of patients.
- Review bias, a subtype of measurement bias, occurs when tests are performed or interpreted without proper blinding.
- Confounding bias occurs when two factors are associated and the effect of one is distorted or confused by the effect of the other.
- Lead-time bias occurs when a new test merely identifies the disease earlier than did the previous test, thus giving the impression that the survival is longer. (An appropriate way to avoid lead-time bias is to compare age-specific mortality rates, rather than survival rates from the time of diagnosis.)
- Length-time bias occurs when screening tests falsely appear to improve survival, since they often detect more slowly growing diseases, which tend to have a better prognosis.
- Screening bias occurs because patients who volunteer for screening studies tend to be healthier and have better outcomes than nonvolunteers.
- Overdiagnosis bias occurs when screening identifies an illness that would not have shown clinical signs before a person’s death from other causes.
- Pygmalion effect bias occurs when higher expectations lead to an increase in performance.
- Measurement bias occurs when methods of measurement are dissimilar between different groups of patients.
Tip: Consider the methodology validity, or flaws, when critically analyzing any scientific result. As radiologists, we are better equipped than the mainstream population to assess researchers’ conclusions that reach the media.
Example: Much of the controversy regarding the best age to begin screening women with mammography involves various statistical biases.
Special Effects: Hawthorne and Weber
Hawthorne Effect
You are driving on an open highway when a police car pulls up behind you. What do you do? If you are like most people, you reflexively step on the brake a little while you quickly check your speed.
This is the Hawthorne effect. Simple awareness that you are being observed changes your behavior.
The Hawthorne effect was first described in the work-place.39 A series of experiments was performed at the Chicago AT&T Hawthorne factory in the 1920s. Initially, workers were told that they would be exposed to greater light and that their subsequent productivity would be observed. Indeed, their productivity improved—briefly. But the change in productivity wasn’t the result of better lighting. In fact, the experimenters found that any variable change in the workplace, including break schedules, working hours, or self-selection of nearby coworkers (as long as the workers knew they were being observed) resulted in improved productivity. These effects were all temporary. Further, researchers found that social factors (e.g., working as a team, choosing one’s own coworkers, and perceived interest that the manager had in a project) were at least as important as physical improvements in working conditions on improving productivity.
Knowledge of these effects has had great applications in management. For research, the Hawthorne effect is one of the hardest biases to eliminate from an experiment.
Weber Effect
Adverse event reporting tends to increase in the first two years after introduction of a new agent or use for a new indication, peaks at the end of the second year, and then declines.40 This pattern was first described in 1984 in the United Kingdom for a single drug and is known as the Weber effect. The Food and Drug Administration and other agencies have made concerted efforts to improve methods and reporting. Today, this effect is probably not as common. The Weber effect explains why in a PDSA cycle the incidence of an adverse event may initially rise.
Now turn to the next chapter for additional new material and to begin the question and answer format.
References
1. CMS.gov. https://www.cms.gov/research-statistics-data-and-sys-tems/statistics-trends-and-reports/nationalhealthexpenddata/nhe-fact-sheet.html. Published 2015. Accessed May 6, 2016
2. HRSA.gov. http://www.hrsa.gov/quality/toolbox/methodology/qualityimprovement/. Published 2015. Accessed May 6, 2016
3. National Academies. http://www.nationalacademies.org/hmd/. Published 2016. Accessed May 6, 2016
4. American Board of Medical Specialties. http://www.abms.org/board-certification/a-trusted-credential/based-on-core-compe-tencies/. Published 2016. Accessed May 6, 2016
5. Techtarget. http://searchsoftwarequality.techtarget.com/definition/best-practice. Published 2016. Accessed May 6, 2016
6. Techtarget.http://searchbusinessanalytics.techtarget.com/definition/business-intelligence-dashboard. Published 2016. Accessed May 6, 2016
7. Ettorchi-Tardy A, Levif M, Michel P. Benchmarking: a method for continuous quality improvement in health. Health Policy 2012;7(4):e101-e119
8. Porter ME. What is value in healthcare? N Engl J Med 2010;363(26):2477-2481
9. Klipfolio. https://www.klipfolio.com/resources/kpi-examples. Published 2015. Accessed May 6, 2016
10. Institute for Healthcare Improvement. http://www.ihi.org/resources/Pages/HowtoImprove/default.aspx. Published 2016. Accessed May 6, 2016
11. Lawal AK, Rotter T, Kinsman L, et al. Lean management in healthcare: definition, concepts, methodology and effects reported (systematic review protocol). Syst Rev 2014;3:103
12. Six Sigma Online. http://www.sixsigmaonline.org/six-sigma-training-certification-information/lean-six-sigma-wastes-and-principles/. Published 2015. Accessed May 6, 2016
13. American Society for Quality. http://asq.org/learn-about-quality/six-sigma/overview/overview.html. Published 2015. Accessed May 6, 2016
14. American Society for Quality. http://asq.org/learn-about-quality/six-sigma/overview/dmaic.html. Published 2015. Accessed May 6, 2016
15. American Society for Quality. http://asq.org/learn-about-quality/seven-basic-quality-tools/overview/overview.html. Published 2015. Accessed May 6, 2016
16. Sabih DE, Sabih A, Sabih Q, Khan AN. Image perception and interpretation of abnormalities; can we believe our eyes? Can we do something about it? Insights Imaging 2011;2(1):47-55
17. The National Academies of Sciences Engineering and Medicine. https://www.nationalacademies.org/hmd/Reports/1999/To-Err-is-Human-Building-A-Safer-Health-System.aspx. Published 2016. Accessed May 6, 2016
18. Grissinger M. Too many abandon the “second victims” of medical errors. P T 2014;39(9):591-592
19. Bal BS. An introduction to medical malpractice in the United States. Clin Orthop Relat Res 2009;467(2):339-347
20. Reason J. Human error: models and management. BMJ 2000;320(7237):768-770
21. Agency for Healthcare Research and Quality. https://psnet.ahrq.gov/primers/primer/21/systems-approach. Published 2015. Accessed May 6, 2016
22. The Joint Commission. http://www.jointcommission.org/senti-nel_event.aspx. Published 2016. Accessed May 6, 2016
23. Safer Healthcare. http://www.saferhealthcare.com/sbar/what-is-sbar/. Published 2015. Accessed May 6, 2016
24. American Society for Quality. http://asq.org/learn-about-quality/root-cause-analysis/overview/overview.html. Published 2015. Accessed May 6, 2016
25. The Joint Commission. http://www.jointcommission.org/assets/1/6/chassin_and_loeb_0913_final.pdf. Published 2016. Accessed May 6, 2016
26. United States Department of Labor. https://www.osha.gov/SLTC/etools/safetyhealth/mod4_factsheets_culture.html. Published 2016. Accessed May 6, 2016
27. Boysen PG II. Just culture: a foundation for balanced accountability and patient safety. Ochsner J 2013;13(3):400-406
28. American College of Radiology. http://www.acr.org/Quali-ty-Safety/Standards-Guidelines. Published 2016. Accessed May 6, 2016
29. Agency for Healthcare Research and Quality. https://psnet.ahrq.gov/primers/primer/2/error-disclosur3. Published 2015. Accessed May 6, 2016
30. The Joint Commission. http://www.jointcommission.org/standards_information/npsgs.aspx. Published 2016. Accessed May 6, 2016
31. The Joint Commission. http://www.jointcommission.org/assets/1/23/Quick_Safety_Issue_Twenty-One_February_2016.pdf. Published 2016. Accessed May 6, 2016
32. Al-Elq AH, Al-Elk. Simulation-based medical teaching and learning. J Family Community Med 2010;17(1):35-40
33. American College of Radiology. http://www.acr.org/Quality-Safety/Appropriateness-Criteria. Published 2016. Accessed May 6, 2016
34. American College of Radiology. http://www.acr.org/quality-safety/radiology-safety/mr-safety. Published 2016. Accessed May 6, 2016
35. American College of Radiology. http://www.acr.org/quali-ty-safety/resources/contrast-manual. Published 2016. Accessed May 6, 2016
36. American College of Radiology. http://www.acr.org/quality-safety/radiology-safety/radiation-safety. Published 2016. Accessed May 6, 2016
37. Parikh R, Mathai A, Parikh S, Chandra Sekhar G, Thomas R. Understanding and using sensitivity, specificity and predictive values. Indian J Ophthalmol 2008;56(1):45-50
38. Sica GT. Bias in research studies. Radiology 2006;238(3):780-789
39. McCambridge J, Witton J, Elbourne DR. Systematic review of the Hawthorne effect: new concepts are needed to study research participation effects. J Clin Epidemiol 2014;67(3):267-277
40. Hoffman KB, Dimbil M, Erdman CB, Tatonetti NP, Overstreet BM. The Weber effect and the United States Food and Drug Administration’s Adverse Event Reporting System (FAERS): analysis of sixty-two drugs approved from 2006 to 2010. Drug Saf 2014;37(4):283-294
Related posts:
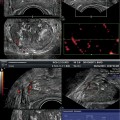
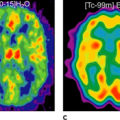
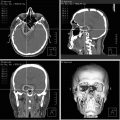
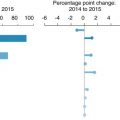
Stay updated, free articles. Join our Telegram channel

Full access? Get Clinical Tree


