Deep Genomic Divergence and Phenotypic Admixture of the Treefrog Dendropsophus elegans (Hylidae: Amphibia) Coincide With Riverine Boundaries at the Brazilian Atlantic Forest
 Renata M. Pirani1*†
  João F. R. Tonini2,3
  Andréa T. Thomaz4
  Marcelo F. Napoli5,6
  Lais C. Encarnação6
  L. Lacey Knowles7
  Fernanda P. Werneck1,8
- 1Programa de Pós-Graduação em Genética, Conservação e Biologia Evolutiva, Instituto Nacional de Pesquisas da Amazônia (INPA), Manaus, Brazil
- 2Department of Organismic and Evolutionary Biology, Harvard University, Cambridge, MA, United States
- 3Museum of Comparative Biology, Harvard University, Cambridge, MA, United States
- 4Facultad de Ciencias Naturales, Universidad del Rosario, Bogotá, Colombia
- 5Museu de História Natural (Museu de Zoologia), Instituto de Biologia, Universidade Federal da Bahia (UFBA), Campus Universitário de Ondina, Salvador, Brazil
- 6Programa de Pós-Graduação em Biodiversidade e Evolução, Instituto de Biologia, Universidade Federal da Bahia, Campus Universitário de Ondina, Salvador, Brazil
- 7Department of Ecology and Evolutionary Biology, University of Michigan, Ann Arbor, MI, United States
- 8Coordenação de Biodiversidade, Programa de Coleções Científicas Biológicas, Instituto Nacional de Pesquisas da Amazônia (INPA), Manaus, Brazil
The Atlantic Forest (AF) domain is one of the Earth’s biodiversity hotspots, known for its high levels of species diversity and endemism. Factors related to palaeoenvironmental dynamics, such as the establishment of vegetational refugia and river basins, have different impacts on biological communities and biodiversity patterns in this domain. Here, we sample genome-wide RADseq data from a widespread treefrog (Dendropsophus elegans), inhabiting natural and human-impacted ecosystems at the Brazilian AF to test the impact of riverine boundaries and climatic refugia on population structure and diversification. We estimate divergence times and migration rate across identified genetic breaks related to the rivers Doce, Paraíba do Sul, Ribeira de Iguape, and Paraguaçu, known to represent barriers to gene flow for other AF endemic species, and test the role of climatic refugia. Finally, we investigate the impact of spatio-temporal population history on morphological variation in this species. We recovered a phylogeographic history supporting three distinct clades separated into two geographically structured populations, corresponding to the north and south of AF. In addition, we identified an admixture zone between north and south populations in the latitude close to the Doce River. Our findings support a pattern of isolation-by-distance and the existence of a secondary contact zone between populations, which might have been promoted by gene flow during population expansion. Further, we found support for models considering migration parameters for all the tested rivers with different population divergence times. Based on the species history and the AF palaeoenvironmental dynamics, we corroborate the role of forest refugia impacting population structure for this species through recent range expansion after the Last Glacial Maximum (LGM). The Doce and Paraíba do Sul Rivers coincide with the main genetic breaks, suggesting they might also have played a role in the diversification processes. Finally, despite finding subtle correlations for phenotypic data among different populations, variation is not strongly detectable and does not seem associated with speciation-level processes that could warrant taxonomic changes. Such results can be explained by phenotypic plasticity of the evaluated traits and by recent divergence times, where there has been insufficient time and weak selective pressures to accumulate enough phenotypic differences.
Introduction
Spatial patterns of biodiversity are arranged according to species’ evolutionary history, such as its responses to environmental variation. Current patterns of spatial genetic structure and gene flow among populations have been affected by past climatic fluctuations and the establishment of biogeographic boundaries, all modulated by species’ ecology (Antonelli et al., 2018; Pirani et al., 2019; Sheu et al., 2020). In the Neotropics, climatic oscillations during the Quaternary have impacted species distribution and genetic patterns – a major process accounting for several species’ current distributions (Carnaval et al., 2009; Cheng et al., 2013; Rull and Carnaval, 2020). It is long proposed that, during interglacial periods, the extension of Neotropical forested areas has been larger relative to open ecosystems (Vanzolini and Willians, 1970; Leite and Rogers, 2013). In contrast, during the Pleistocene glacial periods, biota experienced increased aridification and concentrations of CO2, which likely resulted in retraction of forests and expansion of open areas (e.g., Antonelli et al., 2010). Consequently, populations of plants and animals associated with forested habitats that were unable to disperse across open areas could have been isolated for thousands of years, accumulating genetic differences that could potentially result in allopatric speciation (e.g., Resende et al., 2010; Damasceno et al., 2021).
In particular, a great number of studies have increased the understanding of the palaeoenvironmental dynamics effects on biological communities and biodiversity patterns of the Brazilian Atlantic Forest (AF) (Rosauer et al., 2009; Carnaval et al., 2014; Peres et al., 2020). Located along the eastern coast of Brazil, the AF is known for its high levels of species diversity and endemism (Peres et al., 2020), and it is considered one of the Earth’s biodiversity hotspots (e.g., Martins, 2011; Moura et al., 2017). Historical forest refugia models of the AF (Carnaval and Moritz, 2008) are predicted to comprise higher phylogenetic diversity, suggesting that forest persistence influenced the biodiversity patterns of several taxa (e.g., Carnaval et al., 2009; Thomé et al., 2010; Martins, 2011; Peres et al., 2020). Furthermore, the Pleistocene climatic dynamics and forest refugia affected biota differently along with the broad latitudinal extension of the AF. At the north of the Doce River, larger forested areas persisted due to stable climates (e.g., Thomé et al., 2010; Carnaval et al., 2014), whereas in the south, smaller patches of forest occurred due to unstable climates and were likely colonized after the Last Glacial Maximum (LGM) (Carnaval et al., 2009). The presence of these different refugia along the domain might be explained by AF topographic complexity, large latitudinal range, and strong seasonality. The north and central regions are warmer and more humid than southern latitudes, which are colder and drier (Ab’Saber, 1977). However, contrasting this classic refugia hypothesis view, Leite et al. (2016) detected an expansion of suitable climatic conditions onto the exposed continental shelf during the LGM, which would have allowed forest and associated taxa to expand and not contract as previously proposed. A signal of population expansion during the LGM and the Last Interglacial (LIG) for small mammals supports such scenario.
In addition to climatic and vegetational refugia, the biodiversity of the AF is structured by topography – the domain comprises mountain ranges up to 2,500 m.a.s.l. (above sea level), lowland areas at sea level, and several river basins (e.g., Doce, Paraíba do Sul, and Mucuri Rivers – Pellegrino et al., 2005; Resende et al., 2010). These topographic features coincide with species-pairs genetic breaks recovered for several taxa (e.g., Thomé et al., 2012, 2014; Rodríguez et al., 2015; Cazé et al., 2016; Sabbag et al., 2018; Menezes et al., 2020). Furthermore, the AF rivers also play an important role in promoting species diversification and structuring populations of dry adapted taxa (e.g., São Francisco River; Werneck et al., 2015). One of the AF rivers that seems to be a congruent dispersal barrier across several taxa is the Doce River (Costa, 2003; Pellegrino et al., 2005; Martins, 2011; review Peres et al., 2020), including our focal species, Dendropsophus elegans, even though it is role as a primary driver of divergence is still unclear (Tonini et al., 2013). In addition, the Doce basin is also a region of significant species turnover, highlighting that the climate differences between the north and south of AF could be responsible for this division, rather than the river itself (Fiaschi and Pirani, 2009; Saiter et al., 2016; Peres et al., 2020; Rezende et al., 2020).
For a complete association between geography and genetic divergence, it is important to consider the persistence of populations’ isolation and the timing of isolation events. Likely, populations remained isolated long enough to accumulate genetic and phenotypic differences (e.g., the timing of divergence across margins of the Doce River varies among taxa; Cabanne et al., 2008). As a result, several phylogenetic studies in amphibians (e.g., Wynn and Heyer, 2001; Gehara et al., 2014) highlighted the existence of cryptic lineages into nominally widespread tropical species (e.g., Pellegrino et al., 2005; Cabanne et al., 2008).
Here we explore the impact of river basins and Quaternary climatic oscillations on the population structure of an AF endemic treefrog species. The focal species of our study, D. elegans (Hylidae, Amphibia), is a common treefrog that usually inhabits native herbaceous vegetation in wetlands near open areas but also human-impacted regions at the AF (Izecksohn and Carvalho-e-Silva, 2001). Its distribution ranges from the northern state of Pernambuco to the southern state of Rio Grande do Sul in Brazil, spanning most of the AF environmental gradient (see Figure 1). The species is part of the clown treefrog Dendropsophus leucophyllatus group, associated with South American rainforests (Amazonia and AF – Duellman et al., 2016). In this group, most of the species’ diversity occurs in the Amazonia (11 lineages – Pirani et al., 2020) and only D. elegans and Dendropsophus nekronastes in the AF (Dias et al., 2017), with distinguishable morphological features that set them apart from close relatives (Orrico et al., 2021).
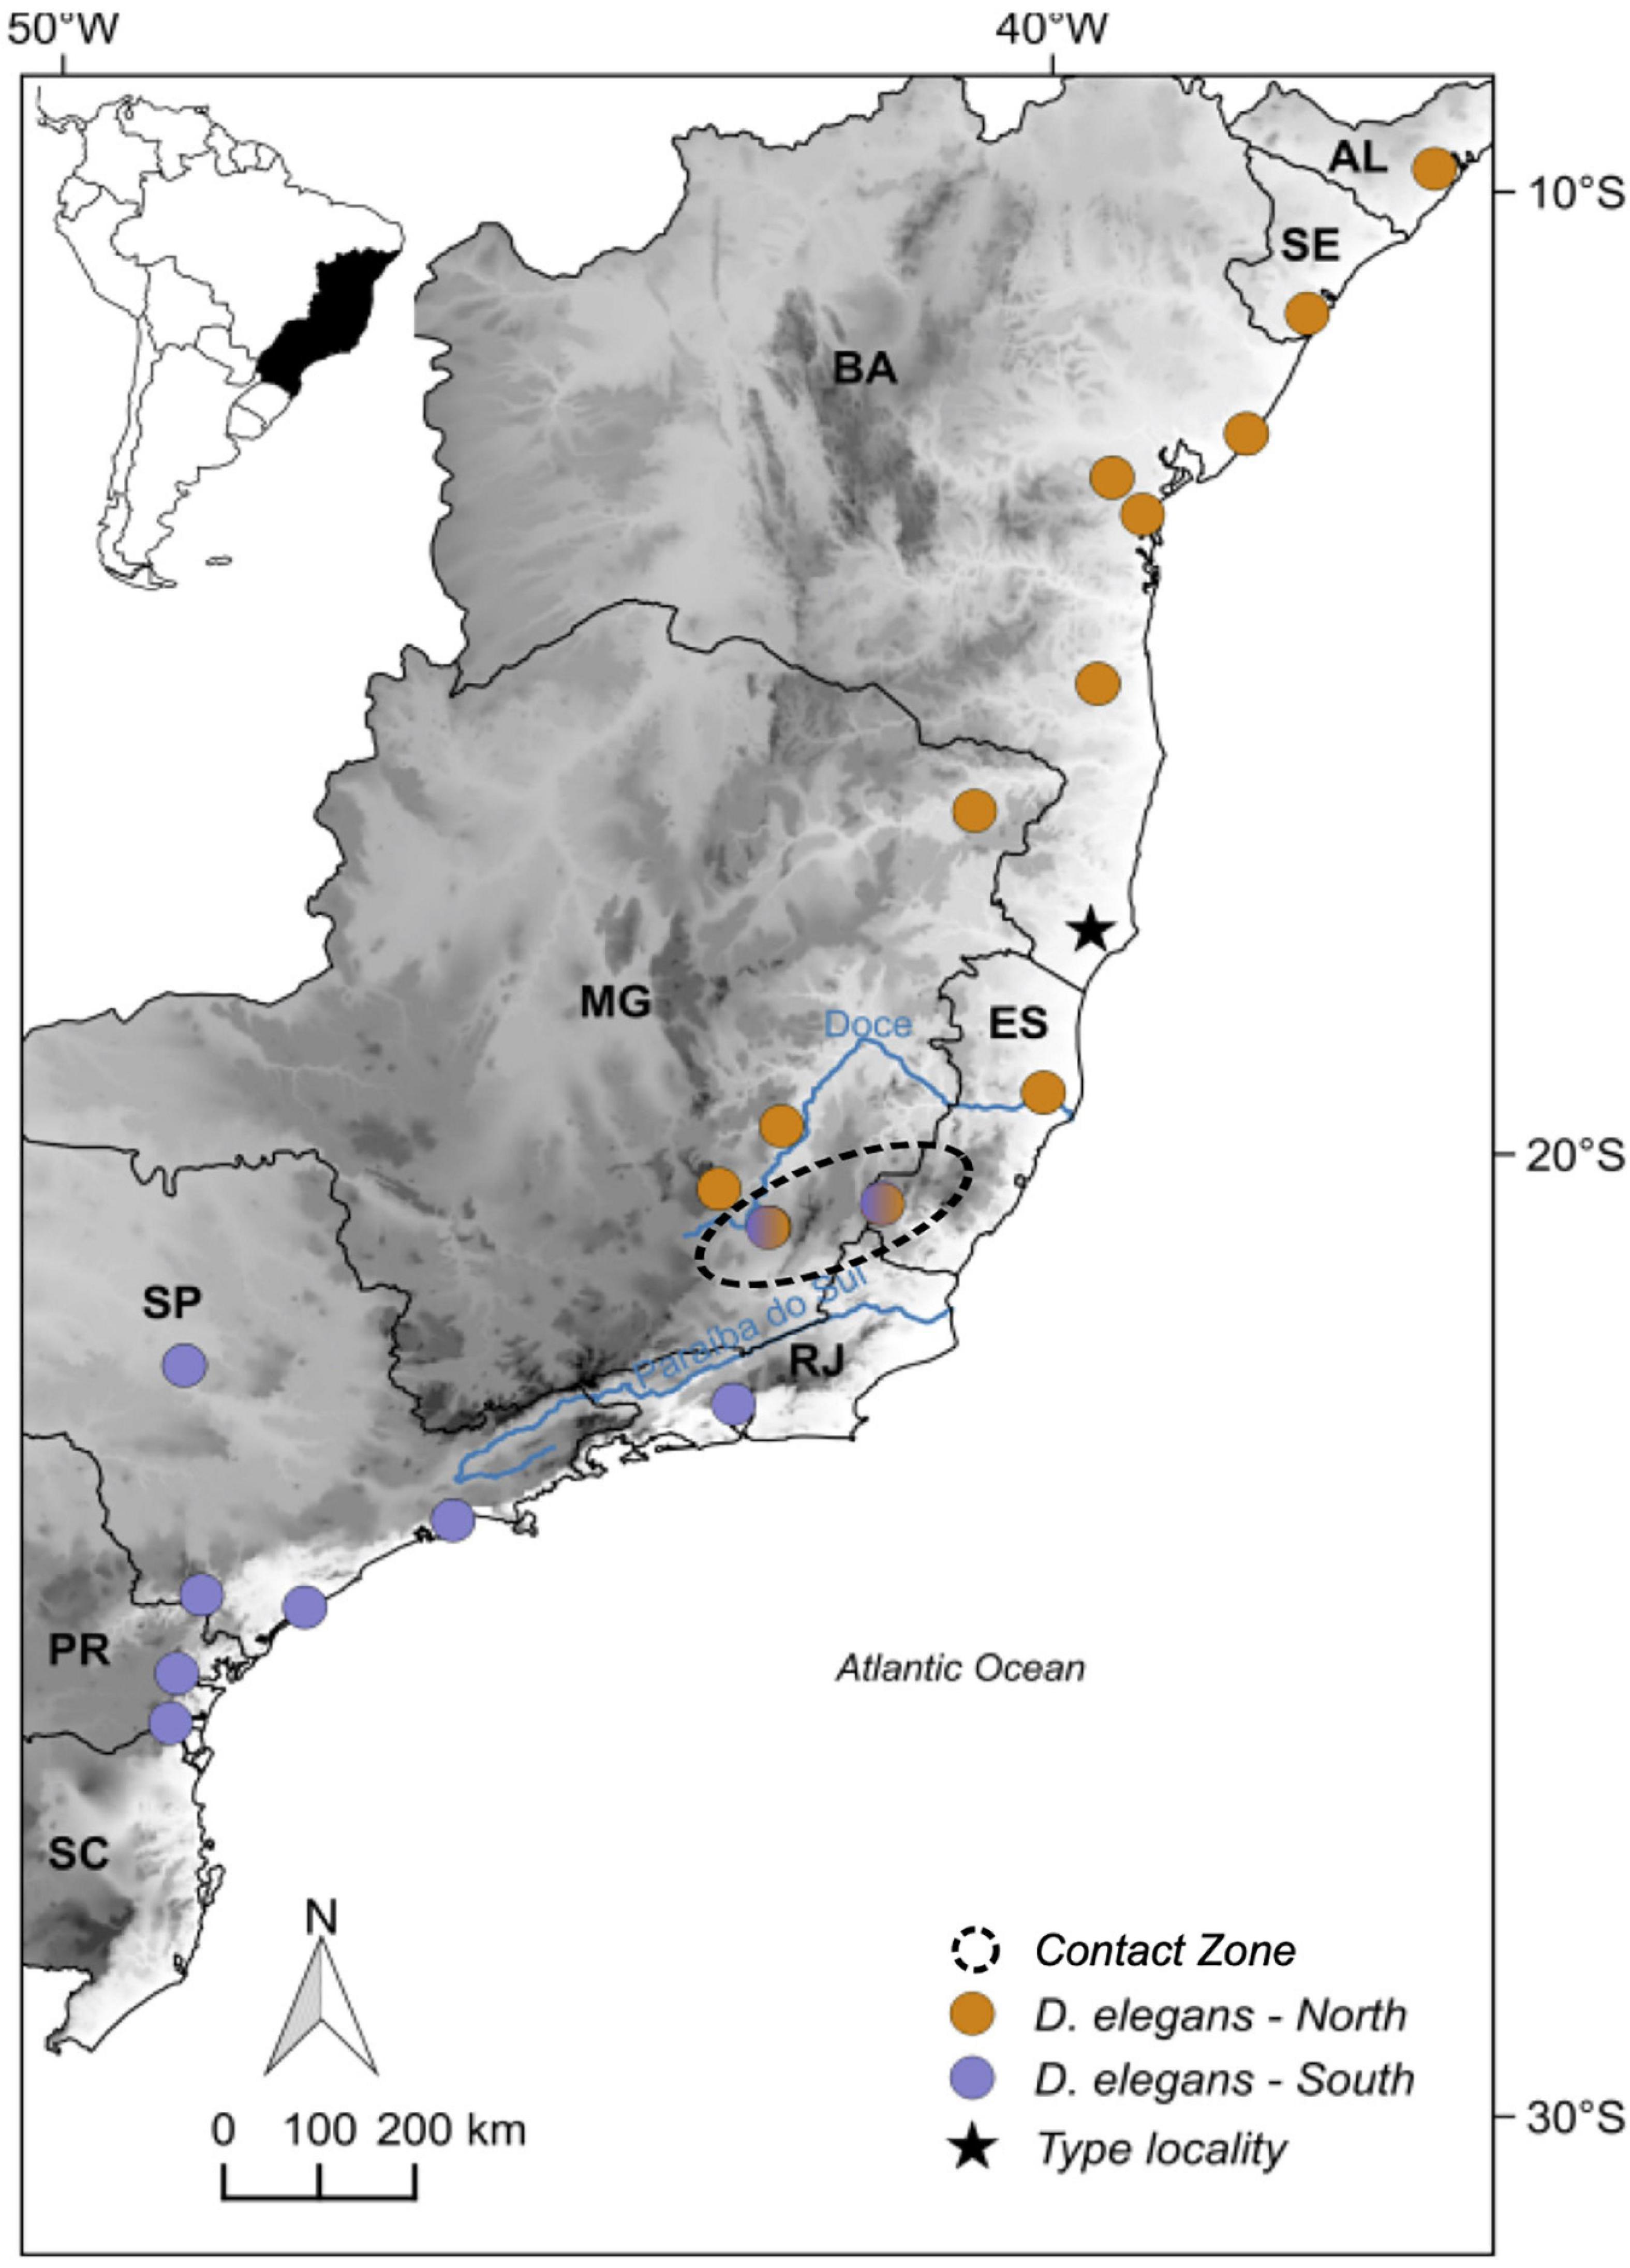
Figure 1. Distribution of the genomic sampled localities of Dendropsophus elegans from the Atlantic Forest across each population with different colors: north (orange), contact zone (black dashed circle), and south (purple); also the type locality (start). Elevation is shown in gray scale ranging from white (0–50 m above the sea level) to black (3,900–3,950 m above sea level). Brazilian states: Alagoas (AL), Sergipe (SE), Bahia (BA), Espírito Santo (ES), Minas Gerais (MG), Rio de Janeiro (RJ), São Paulo (SP), Paraná (PR), and Santa Catarina (SC).
Previous molecular assessment for D. elegans based on mitochondrial DNA (mtDNA) revealed a clear phylogeographical structure with three main clusters along the latitudinal gradient of the AF (north, central, and south clades; see Tonini et al., 2013). These clusters intersected with inferred paleoclimatic models that generally agree with the Late Quaternary climatic stability scenario proposed for the AF by Carnaval and Moritz (2008) and Carnaval et al. (2009). Another study recovered the divergence time between D. elegans and its sister group in the D. leucophyllatus species group to 3-2 million years ago (Mya) on the Plio-Pleistocene (Pirani et al., 2020). Although the genetic structure and past geographic distribution of D. elegans fit well with the refuge hypothesis, geographic barriers, such as the Doce and Paraíba do Sul Rivers, also coincide with the main mtDNA phylogeographic breaks (Tonini et al., 2013) and their role in this species diversification history was never properly explored. In addition, it is important to emphasize that ecological patterns of advertisement call variation among individuals do not correlate with the species’ proposed phylogeographic history (Forti et al., 2017). The apparent mismatch between genetic and phenotypic variation can help uncover processes involved in species evolutionary histories (Zamudio et al., 2016) and raises the question of whether other mechanisms are likely to be related to the observed diversification pattern. For example, geographical barriers and persistence of gene flow among populations could be responsible for ecological uniformity (Zamudio et al., 2016) at a given period (e.g., Leite et al., 2016).
Here we use genome-wide data and model-based phylogeographic analyses to untangle the history of population genomics and morphological differentiation in this treefrog species. We estimate the time of populations’ diversification, demography, and gene flow between genetic breaks (which coincide with the Doce, Paraíba do Sul, Ribeira de Iguape, and Paraguaçu Rivers) to test whether the genetic structure is related to geographic barriers and/or climatic refugia. We also evaluate whether observed patterns of genetic diversity and phylogenetic structure are related to phenotypic variation for D. elegans populations.
Materials and Methods
Sampling and RADseq Genomic Data Generation
Genomic data were collected from 44 samples (36 D. elegans samples, plus four samples of Dendropsophus anceps from AF, two samples from Dendropsophus minutus, and two from D. leucophyllatus from the Amazonian rainforest as outgroups; representing a total of 25 localities; see Supplementary Table 1 in Supplementary Material 1).
The DNA was extracted from the muscle or liver of each individual using the Qiagen DNeasy Blood and Tissue Kit following the manufacturer’s protocol. Our sampling of D. elegans individuals is a subsampling of two double digest Restriction-site Associated DNA (ddRAD) libraries sequenced for a larger scale sampling of the D. leucophyllatus species complex (which included ten described species and four new lineages). For a complete description of the genomic library preparation and DNA sequencing process, see Pirani et al. (2020). A complete list of voucher information used in this study is provided in Supplementary Table 1 in Supplementary Material 1.
Data Processing
To infer interspecific relationships of D. elegans and close relatives, raw data was processed using the ipyRAD v.0.7.17 pipeline1 (Eaton, 2014; Eaton and Overcast, 2020) using de novo assemble from the fastQ files obtained from the Illumina sequencing run. All the 44 samples were processed together with the following parameter specifications. First, sequences were demultiplexed using the program step 1, where the restriction sites and barcodes were trimmed from approximately 544 million reads. Because the number of reads stabilizes above 500,000 per sample, we eliminated seven D. elegans samples below this threshold before conducting the next steps in the remaining 37 samples. The number of reads per individual ranged between 551,291 and 2,395,613 (Supplementary Table 2 in Supplementary Material 1). After that, sequences with more than five base-calling errors were discarded. Heterozygosity and error-rate were estimated from the base counts at each site across all clusters, and the averages were used to establish consensus sequences. We excluded clusters with less coverage than a minimum depth of five to ensure accurate base calls. Consensus sequences from all samples were clustered by sequence similarity, with their input order randomized, using the same similarity threshold as the within-sample clustering (90%). Note that the parameter values were in line with other recent studies focusing on within-genus divergences (e.g., Huang, 2016). All the fragments were trimmed to a minimum length of 110 bp. Any cluster appearing heterozygous at the same site across more than four samples was discarded. A cluster with sequence success of fewer than 15 individuals was also excluded from the output. The remaining clusters were treated as RAD loci, i.e., multiple alignments of putatively orthologous sequences assembled into phylogenetic data matrices. We achieved the final dataset after running all the ipyrad steps and excluding excessive variation arising from clustering errors. We also exported only one random SNP per cluster, so our data comprised only potentially unlinked SNPs. The complete dataset with D. elegans samples plus outgroups had a total of 29,579 potentially unlinked SNPs for 37 individuals (29 from D. elegans and eight outgroups). This dataset presented 63% of missing data, and it was only used to infer phylogenetic relationships. Because of the higher missing data frequency present among the outgroup samples, a secondary dataset including only the 29 individuals of D. elegans was generated. This dataset contained 19,151 potentially unlinked SNPs with only 5% missing data. It was used to calculate summary statistics and perform all the other analyses, including STRUCTURE and X-origin (see methods below for details). See Supplementary Table 2 in Supplementary Material 1 for the number of loci used for each downstream analysis. All the ipyRAD steps were run under parallel execution with eight threads in the University of Michigan flux computing cluster.
Inferring Species Tree/Population Tree
The final potentially unlinked SNP dataset resulting from ipyRAD for D. elegans species and outgroups was used to infer the species phylogeny and contrast patterns of divergence between lineages. To access the evolutionary relationships among individuals, we manually converted the output from ipyRAD to nexus format and performed a species tree reconstruction using the coalescent-based program SVDquartets (Chifman and Kubatko, 2014), implemented in PAUP* v. 4.0d147 (Swofford, 2002). We evaluated all possible quartets, selected trees using the QFM quartet assembly and performed bootstrapping with 100 replicates to calculate branches’ support. The tree was rooted in D. minutus (Pirani et al., 2020). We also used RAxML v. 8.2.8 (Stamatakis, 2014) to infer branch lengths for the total concatenated dataset of 3,852,884 loci (all fragments including invariant sites), using the GTRCAT model and a bootstrapping of 100 replicates. All the analyses above ran under parallel execution with 16 threads in the University of Michigan flux computing cluster.
Characterizing Population Structure and Genetic Diversity Across Rivers
To evaluate the population structure within D. elegans, we used a Bayesian approach implemented in STRUCTURE version 2.3.4 (Pritchard et al., 2000) using 5,000 potentially unlinked SNPs randomly selected with no outgroups (total of 27 individuals). This subset allowed us to avoid the exceptionally time-consuming computations typical of large datasets while still covering our complete sampling range. We ran 10 replicated analyses over a range of K from 1 to 4, based on the results from a previous study that recovered three genetic clades based on a phylogenetic inference (Tonini et al., 2013). Further, a hierarchical genetic structure was performed within each initial cluster identified by STRUCTURE (i.e., Thomaz et al., 2017). The hierarchical subset of individuals contained within genetic clusters were run with K-values ranging from 1 to 4, where individuals were assigned probabilistically to each genetic cluster. Each STRUCTURE analysis was run for 500,000 generations following a burn-in of 200,000 generations, with the possibility of mixed ancestry. We compared the analyses using the ΔK of Evanno et al. (2005) implemented in STRUCTURE HARVESTER (Earl and vonHoldt, 2011) to identify the K number of genetic clusters that best fit the data and plotted results with individuals in the geographical order of their appearance using the CLUMPAK pipeline (Kopelman et al., 2015). In addition, to avoid any bias, we also plot the results using Structure Selector (Li and Liu, 2018), using Puechmaille’s method (Puechmaille, 2016).
Genetic diversity was measured within populations as informed by results obtained from population structure analysis. A third clade was identified in the phylogenetic analyses corresponding to the region between Doce and Paraíba do Sul Rivers. The same was recovered from our population structure analysis as an admixture zone (see Results below). Thus, we separated this contact zone as a different “population” (see section “Results”; Figure 2) with the intention to test if this admixture event was established by primary or secondary contact demonstrated by genetic diversity levels (that is, higher diversity if the contact was established posteriorly). For that, we calculated the average nucleotide diversity (π) in Arlequin 3.5.2.2 (Excoffier and Lischer, 2010) based on polymorphic sites.
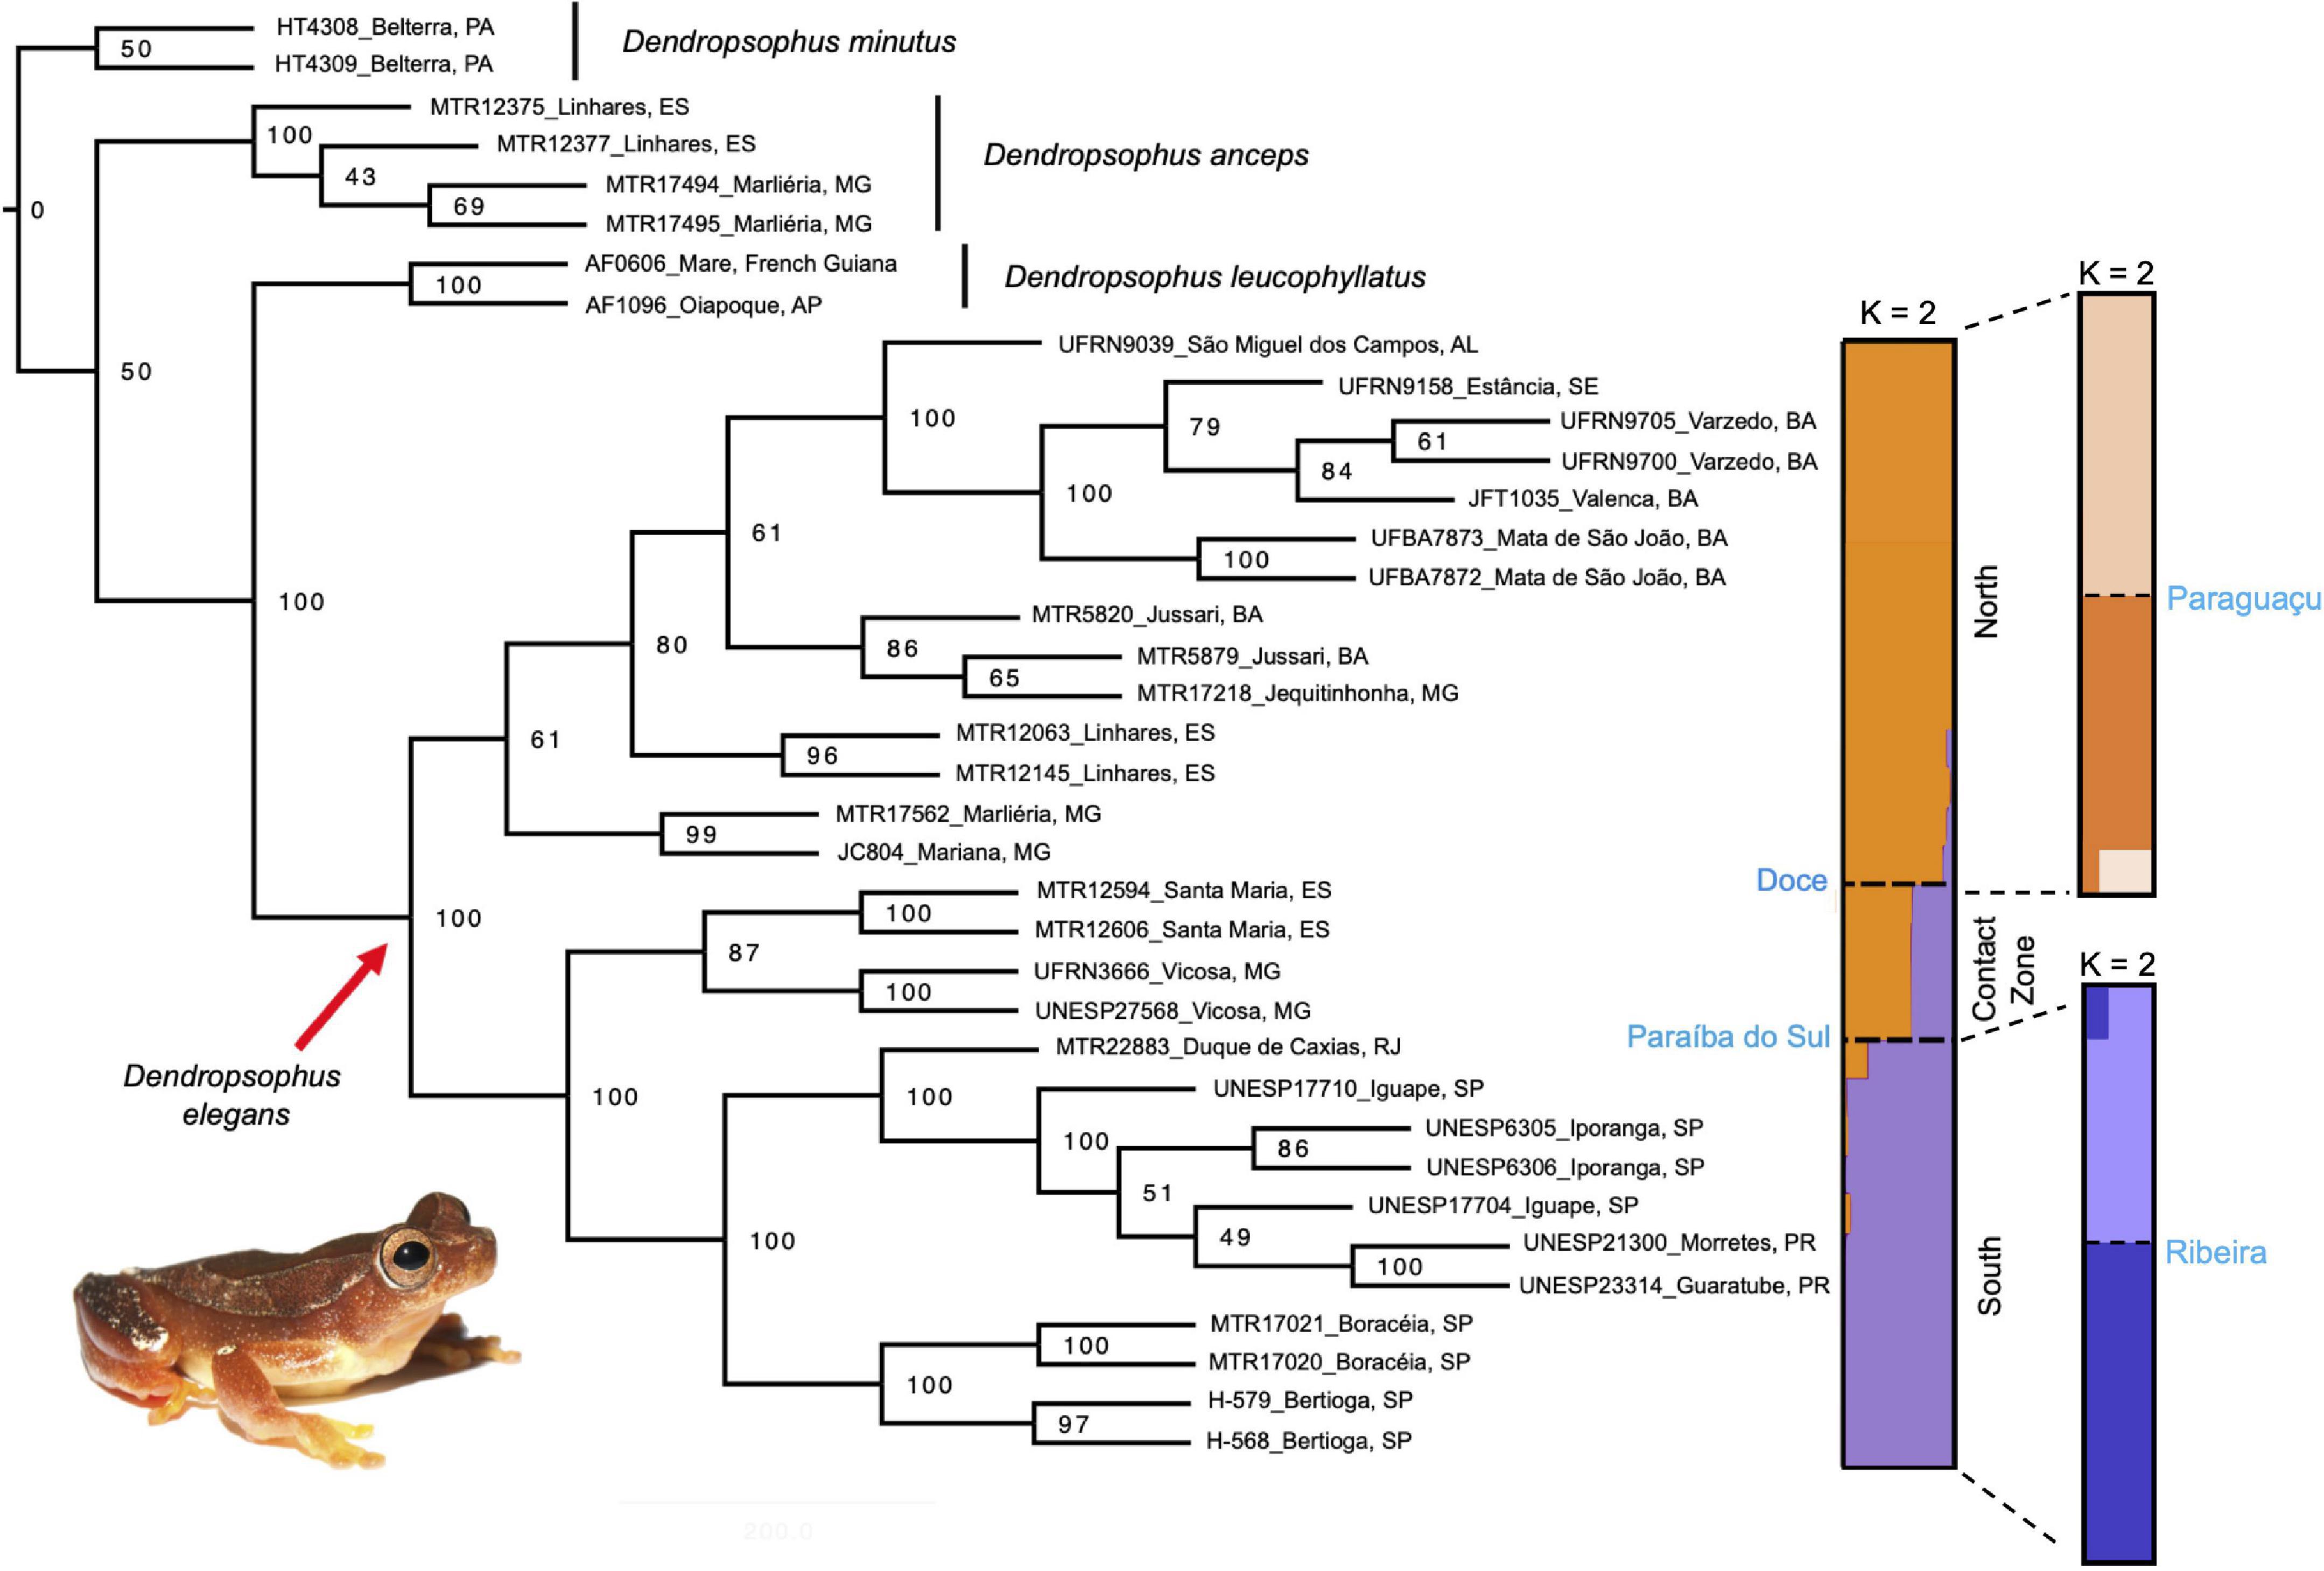
Figure 2. Phylogeny of Dendropsophus elegans species recovered by SVDquartets on the potentially unlinked SNPs dataset. Bootstrap values for the nodes are presented for the complete tree. The right bars represent the population structure inferred by STRUCTURE analysis showing the most probable number of groups (K = 2) as different colors along a latitudinal scale, whereas populations are labeled and separated by the black dashed line (corresponded to Doce, Paraíba do Sul, Paraguaçu, and Ribeira do Iguape Rivers). North population (orange), south population (purple), and the contact zone. Photograph: Rodrigo Tinoco.
Genetic differentiation across populations (considering the contact zone as a different population; see Figure 2) was measured by pairwise FST-values, with their significances assessed from 10,000 bootstrap replicates with a Bonferroni correction for multiple comparisons, calculated in Arlequin 3.5.2.2 (Excoffier and Lischer, 2010). Additionally, the hypothesis of isolation-by-distance among localities was calculated in Arlequin 3.5.2.2 (Excoffier and Lischer, 2010) using the Mantel test to compare the genomic and geographic distance matrices. Geodesic distances between populations were estimated with the function gDistance in the R package shapefiles (Bivand, 2006).
We used the Estimated Effective Migration Surfaces (EEMS) method to evaluate geographic barriers and gene flow patterns (Petkova et al., 2016). This method estimates gene flow from geo-referenced genetic samples and identifies potential barriers separating areas where the decay of genomic differences across geographical distances is higher than expectations under a model of isolation-by-distance. For this approach, a triangular grid from −34° to −51° of longitude and −27° to −8° of latitude was built, spanning the entire geographic range of sampling in the Brazilian AF for D. elegans with 600 demes used as a parameter. In this analysis, the migration parameter m is estimated by Bayesian inference for every edge of the grid by Markov chain Monte Carlo (MCMC) sampling, with each individual being assigned to the nearest vertex of the grid based on observed genetic dissimilarities on the potentially unlinked SNPs dataset. When viewed graphically across the species distributions, areas of reduced gene flow can be visualized based on estimates of the posterior probabilities of m. We performed eight independent runs to assess convergence, with 10 million MCMC iterations, with 2 million burn-in and a thinning of 9,999 used for each run. Convergence among runs was accessed with the R package rEEMSplots, available with the EEMS pipeline.
Divergence History and Migration Across River Barriers
We estimated divergence models with and without migration between genetic breaks of D. elegans following the empirical results obtained from our genomic analyses, where the rivers Doce, Paraíba do Sul, Paraguaçu, and Ribeira de Iguape demonstrated to have an impact on population structure (see section “Results”). For this analysis, we used the method based on the joint site frequency spectrum (SFS) implemented in FASTSIMCOAL2.6 (Excoffier et al., 2013). We estimated the divergence times TDIV, population size NPOP, ancestral size NANCSIZE, and migration MMIG (for the models including migration) across each genetic break. We intended to test if these rivers act as barriers reducing gene flow between populations in different margins and to estimate diversification time across each genetic break. Thereby, we could correlate the results with an older diversification scenario; or if more recent events were more likely to affect populations diversification and consequently the formation of the contact zone.
For the input dataset, ipyRAD was run to generate a dataset with 0% of missing data (total of 2,797 SNPs) (following the program requirements; see Excoffier et al., 2013). The vcf file with potentially unlinked SNPs was converted to Arlequin format using PDGSpider (Lischer and Excoffier, 2012). We calculated the folded joint SFS (i.e., minor allele) using Arlequin 3.5.2.2 (Excoffier and Lischer, 2010). The effective population size of one side of each river (NPOP0) was fixed to improve the accuracy of parameter estimates from the SFS – following the recommendations of the program (Excoffier and Foll, 2011). The other parameters were estimated from the SFS using uniform priors (see Table 2 for details). To calculate the NPOP0 directly from the empirical dataset, we based our calculation on the nucleotide diversity (π) of variant and invariant sites, where π = 4Nμ, assuming a mutation rate of 3.46 × 10⁻⁸. We used the regression formula for cellular organisms to estimate the mutation rate (Lynch, 2010), based on genome sizes estimated in related species (i.e., Dendropsophus microcephalus for D. elegans2), and considering one generation per year (Duellman, 1974). A total of 40 runs were conducted for each model, and we present the point estimate of the highest likelihood across runs, as well as 95% confidence intervals on the parameter estimates calculated using a parametric bootstrap of 100 simulated datasets. The analysis was based on 100,000 to 250,000 simulations for likelihood estimation with a stopping criterion of 0.001 and 10–40 expectation-conditional cycles (ECM). All the models were performed with eight threads in the Smithsonian Tropical Research Institute computing cluster.
Recent Range Expansion
To understand the historical demography of D. elegans, we also tested if north and south populations had signals of range expansion after the LGM using the X-ORIGIN pipeline (He et al., 2017). The program is designed to estimate origins by applying the pairwise spatial statistics Ψ that estimate expansion origin from derived SNPs data. It is best suited for estimating refugia for species that experienced distributional shifts during LGM (see He et al., 2017), which is our hypothesis for D. elegans.
For the input dataset, we used the vcf file with 0% missing dataset generated for FASTSIMCOAL2.6 (see methods above). We converted it to nexus format as input (program requirement format for the precheck.R script) at PDGSpider (Lischer and Excoffier, 2012). Further, to assign individuals to populations, we separated them by geographic localities using a buffer of 50 km. After applying the buffer, localities represented by only one sample, and the contact zone samples, were removed from this analysis. For details, see Supplementary Table 3 in Supplementary Material 1.
Correlation Between Phenotypes and Genomic Divergence
Morphometric and morphological data were collected from 1,020 individuals of D. elegans (867 males, 126 females) from 109 localities (for details, see Supplementary Tables 1, 2 in Supplementary Material 2). To test if differences in body shape are correlated with genetic divergence among D. elegans populations, we measured 18 morphometric distances for all the analyzed specimens: SVL (snout-vent length), HL (head length), HW (head width), ED (eye diameter), END (eye nostril distance), TD (tympanum diameter), UEW (upper eyelid width), IOD (interorbital distance), IND (internarial distance), NSD (tip of snout nostril distance), HU (humerus length), RUL (radius-ulna length), HAL (hand length), THL (thigh length), TL (tibia length), FL (foot length, including tarsus), 3FD (third finger disc diameter), and 4TD (fourth toe disc diameter). All measurements are in millimeters (mm) using a digital caliper under a stereo dissecting microscope; measurements follow Napoli (2005). To further characterize morphometric data clustering, we performed a principal component analysis (PCA) using the “prcomp” function in R (R Core Team, 2020) and coloring the samples according to the inferred genomic structure. The complete list of visited Herpetological Collections in Brazil is presented in Supplementary Table 2 in Supplementary Material 2.
We did a series of standards on outline drawings for color patterns (general dorsal pattern, upper surface of shank, and upper surface of forearm) and for a dorsal outline of the snout (following Heyer et al., 1990) to assess phenotypic variation across the study area (Figure 1) and to test for correlation among dorsal coloration and outline of snout patterns against genetic divergence. The dorsal body surface was characterized by a rectangle or hourglass of brown color, framed by a yellowish-white band; D1 (full rectangle frame); D2 (incomplete rectangle frame close to the eye and/or sacral region); and D3 (fragmented rectangle frame) (see Figure 5 for dorsal color variation drawings). The upper shank surface was characterized by a longitudinal white-yellowish longitudinal strip covering almost the entire dorsal surface of brown background color: T1 (single and extensive white-yellowish band); T2 (three rounded white-yellow spots); and T3 (two yellow-white spots). The upper forearm surface was characterized by yellowish-white crossbones on brown background color: UA1 (immaculate); UA2 (a yellowish-white spot on the elbow); and UA3 (two yellowish-white patches, one on the elbow and one in the anterior region of the forearm). Further, we also registered three muzzle formats in dorsal view for the D. elegans specimens: S1 (rounded); S2 (pointy); and S3 (truncated) (see Supplementary Table 3 in Supplementary Material 2). For specimens in which the design was partially discolored or damaged were removed from the analyses – we only recorded pattern states that were clearly visible. This type of “by eye” phenotypic categorization has been shown to be highly supported by quantitative analyses of standardized color photographs (Dugas et al., 2015).
To determine whether color phenotypes (the dorsal surface, the upper surface of the shank, staining the upper surface of the forearm, and muzzle formats in dorsal view) correlate with geography, we performed a permutational multivariate analysis of variance (PERMANOVA) on each trait, with sampling site nested within populations. All analyses were performed on normal-quantile-transformed data. We performed all transformations and statistical tests in R (R Core Team, 2020).
Results
Species Tree and Intraspecific Diversity
The SVDquartets analysis inferred a highly supported topology recovering D. elegans as a monophyletic species sister to D. leucophyllatus (100% bootstrap; see Figure 2), both from the same species group. Dendropsophus anceps appears as a sister to the D. elegans and D. leucophyllatus clade, but with low node support (50%, Figure 2) (see also Figure 2 in Pirani et al., 2020).
At the intraspecific-level relationships, D. elegans is represented by three main geographically distinct clades (Figure 2): the north clade (61% bootstrap) that is distributed northern of Doce River, at Minas Gerais state to the Alagoas state (see Figure 1); the south clade (100% bootstrap), with the northern limit of the distribution corresponding to the Paraíba do Sul River extending southern into Paraná state; and the central clade (87% bootstrap), with a narrow distribution between the Doce River to the north of the Paraíba do Sul River, including Espírito Santo and Minas Gerais states (Figure 1). All these results are also supported by the RAxML tree (see Supplementary Figure 2 in Supplementary Material 1).
Population Structure and Genetic Diversity Across Rivers
Population structure analyses identified two main genetic clusters (K = 2; Figure 2 and Supplementary Figures 3, 4 in Supplementary Material 1) across the geographic range of D. elegans, being congruent with the north and south clades from the phylogenies, geographically separated by the Doce and Paraíba do Sul Rivers (Figure 1). Within each main cluster, probabilistic assignment of individuals to the respective genetic clusters revealed evidence of a substructure corresponding to the position of the rivers Paraguaçu, within the north cluster, and Ribeira de Iguape in the south cluster (K = 2 for both cases; Figure 2). Moreover, we found evidence of haplotype admixture between north and south clades in samples positioned in the central clade in the phylogenetic inferences, which we identified as a contact zone (see Figures 1, 2).
Pairwise genetic differentiation (FST) was high across north and south clades (FST = 0.408, Table 1), and the samples from the contact zone demonstrated to be genetically closer to the north than to the south clade (FST = 0.246 and 0.325, respectively; Table 1), which differs from the genealogical results. Furthermore, D. elegans localities had overall genomic distances positively correlated with geographic distances (r = 0.68; P-value < 0.01; Table 1). For the genetic diversity analyses, the central clade that corresponds to the contact zone showed one order of magnitude higher values of genetic diversity (π = 0.014; Table 1), in comparison with the north (π = 0.003) and the south clades (π = 0.006, Table 1).
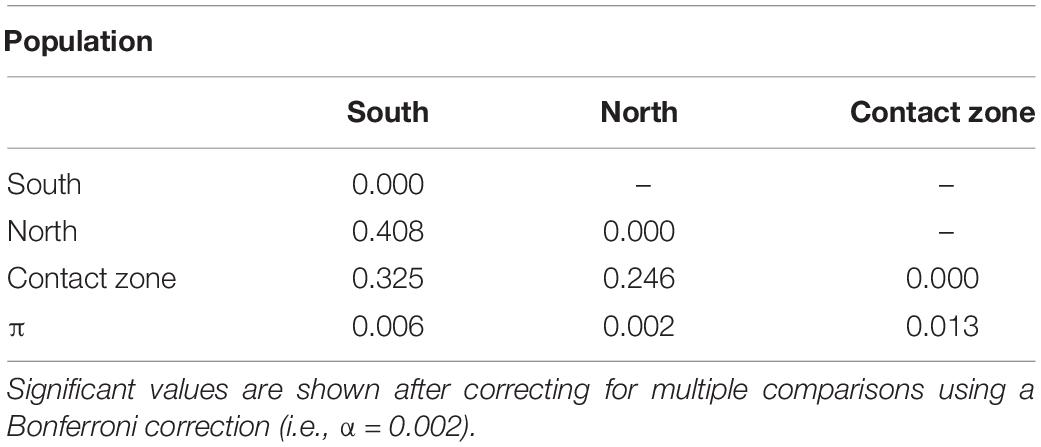
Table 1. Pairwise FST-values between population pairs and nucleotide diversity (π) for each population.
Population genetic structure was supported by the EEMS analysis, which detected reduced gene flow corresponding to the major AF rivers (Figure 3). For instance, the Doce River was inferred as a low migration zone (e.g., potential barrier) between the north and south populations. Reduced migration was inferred within the north population in areas that corresponded to the Paraguaçu and São Francisco Rivers. For the south population, we did not find any strong restriction of gene flow that corresponds to the Paraíba do Sul River. In contrast, a reduced migration was inferred between the samples in the area between Tietê and Ribeira de Iguape Rivers (Figure 3).
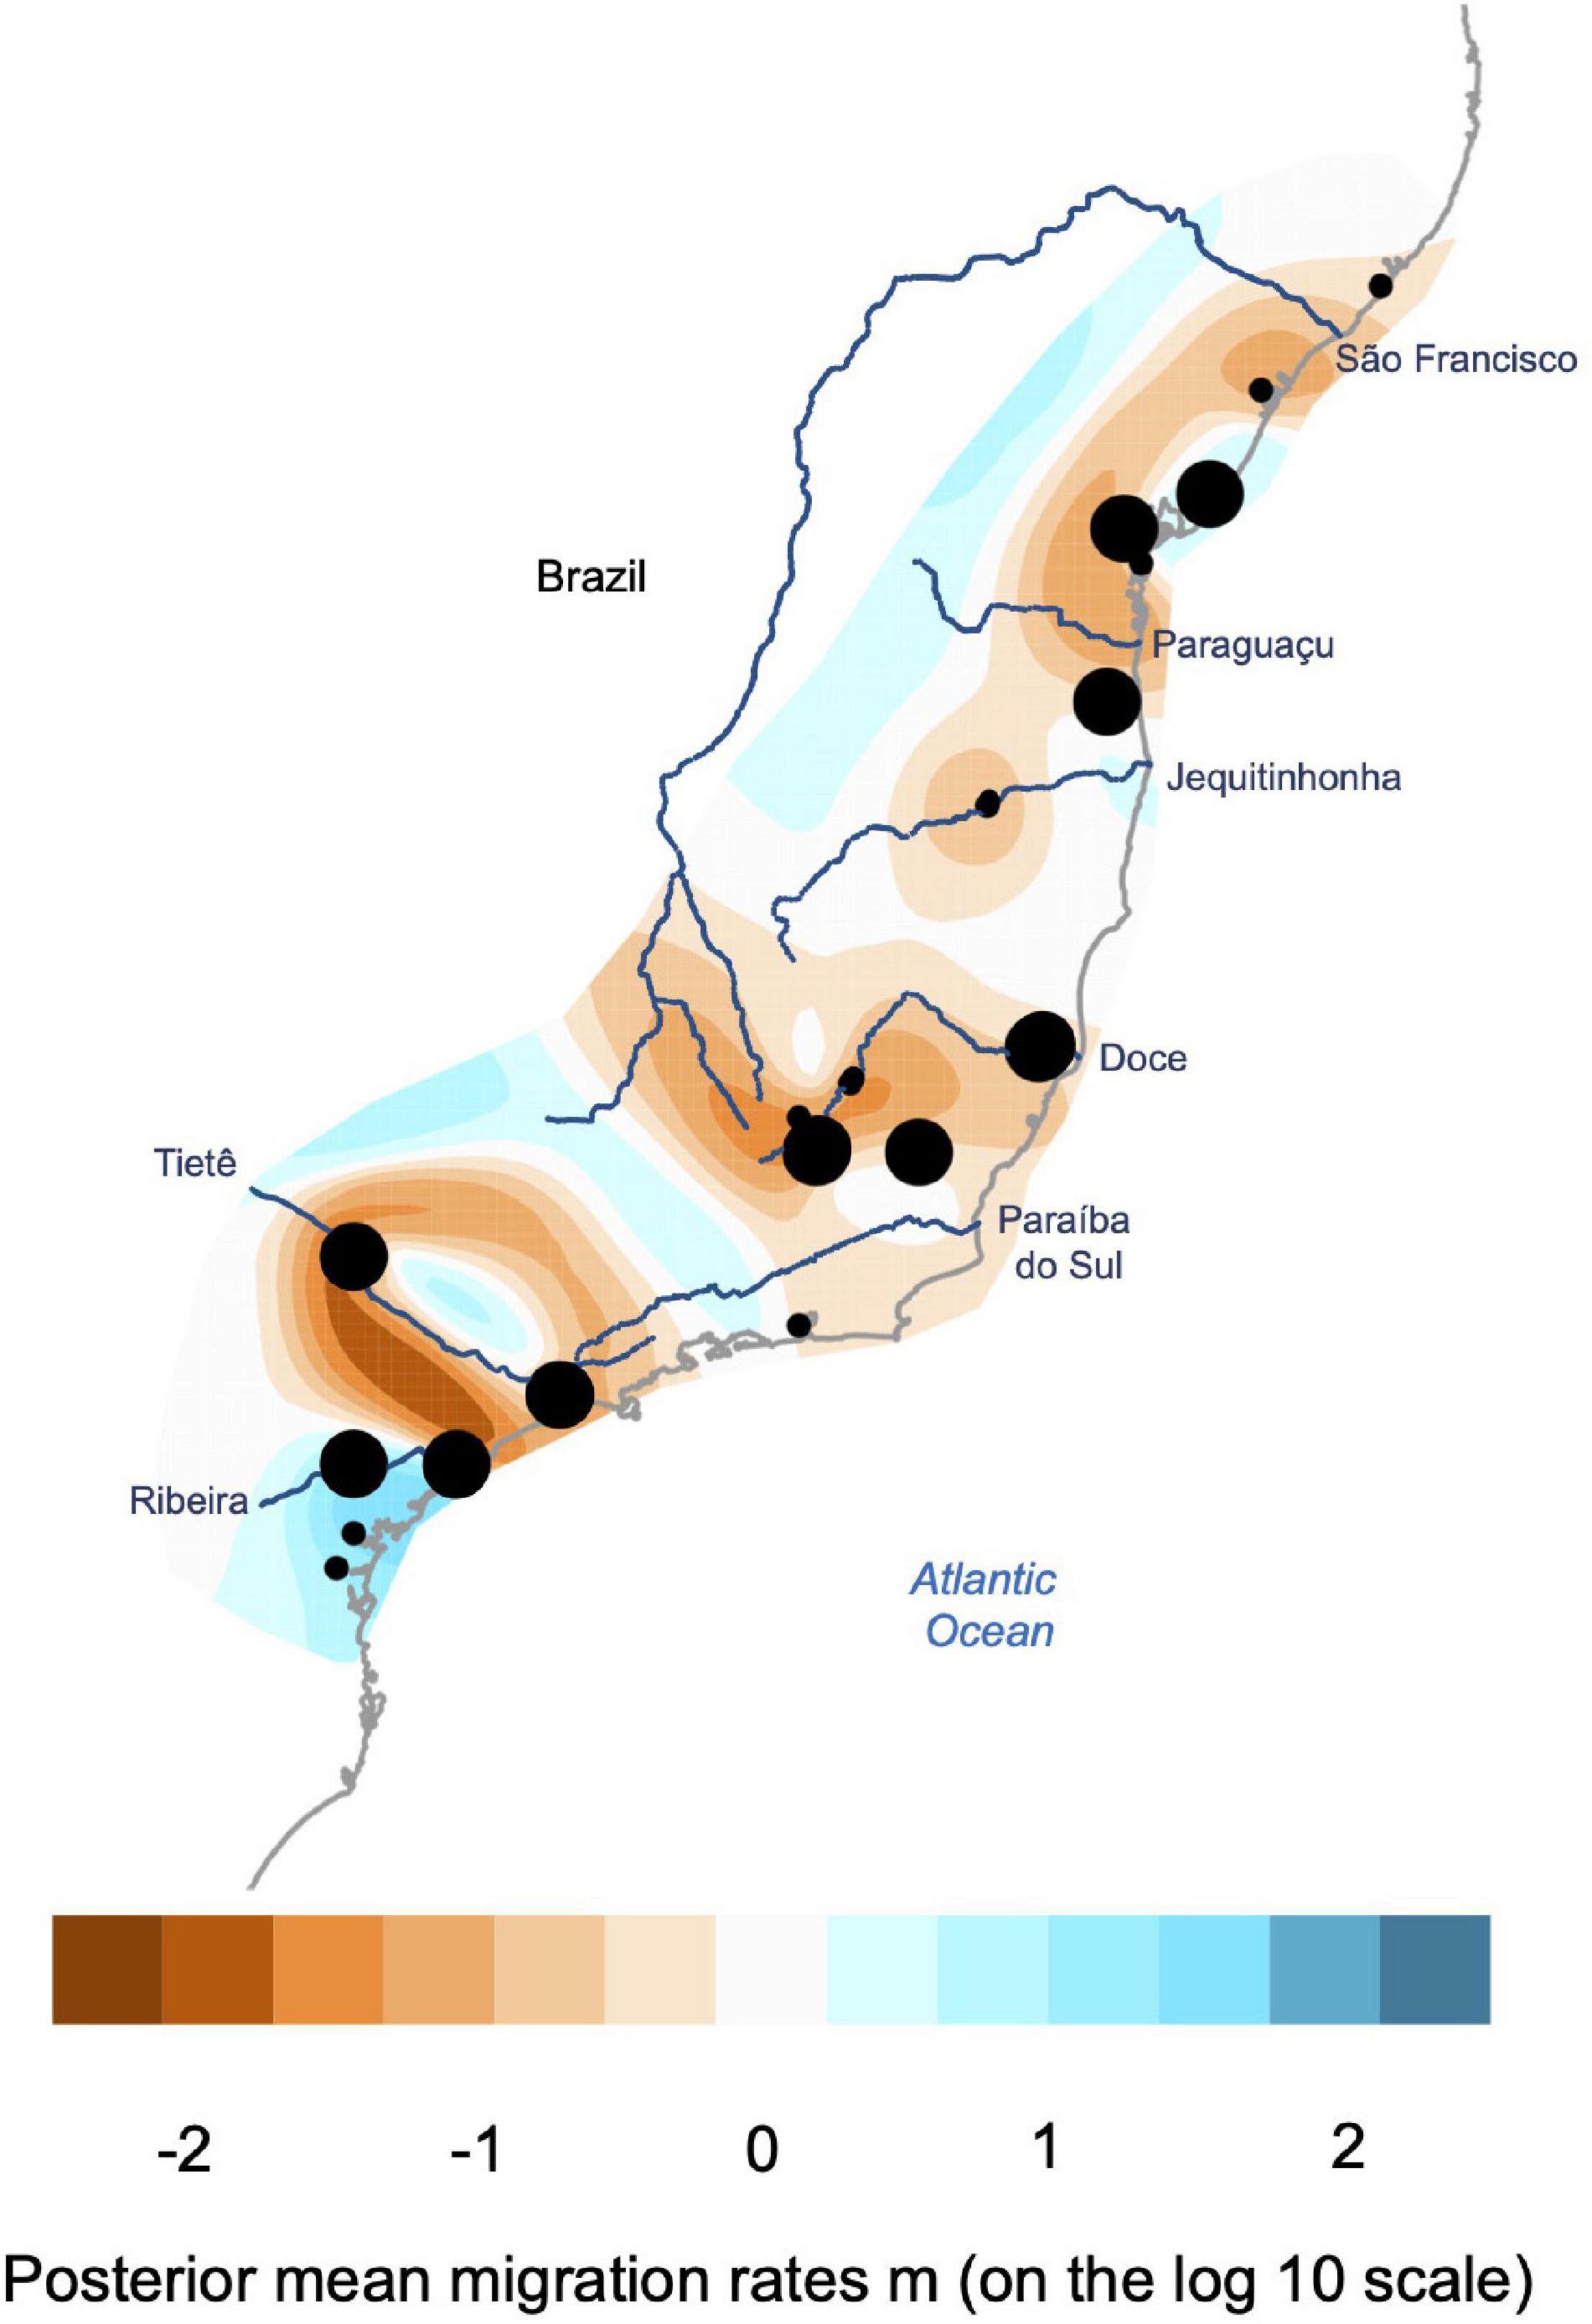
Figure 3. Estimated effective migration surfaces (EEMS) plot showing the effective migration rates (m) on a log10 scale for Dendropsophus elegans averaged across eight independent runs. Geographic regions of low migration are presented in orange-brown, representing hypothesized migration barriers. Areas in blue represent geographic regions where samples are connected by migration rates higher than that expected under isolation by distance. Dots represent the sampled localities, with dots sizes proportional to sample sizes.
Divergence History and Migration Across River Barriers
FASTSIMCOAL26 results indicated divergence with migration as the best-fit models for all the tested rivers (Paraguaçu, Doce, Paraíba do Sul, and Ribeira de Iguape Rivers), even though migration estimates vary between them (see Table 2). The highest migration estimate was across the Paraíba do Sul River, which coincides with the oldest divergence time among populations (3 Mya ago). The migration estimated per generation over this river from the southern population to the contact zone is almost two migrants per generation (∼1.91 from south 1 to central and 0.42 migrants per generation in the opposite direction). The lowest migration rates were found across the Ribeira de Iguape River, within the south population, with less than one migrant per generation (0.01 for south 1 to south 2 and 0.04 in the opposite direction). Although the divergence time between the Ribeira de Iguape River margins is recent (0.36 Mya) in comparison to the Paraíba do Sul, this estimate is closer to the divergence times between populations separated by the Doce and Paraguaçu Rivers (0.24 and 0.16 Mya, respectively). Migration rates across the Doce River, between the contact zone and the north population, indicates almost one migrant per generation (0.29 for north 2 to central and 0.99 in the opposite direction). Across the Paraguaçu River, within the north population, the results present less than one migrant per generation (∼0.13 for north 1 to north 2 and 0.48 in the opposite direction). All the parameter estimates are represented in Table 2.
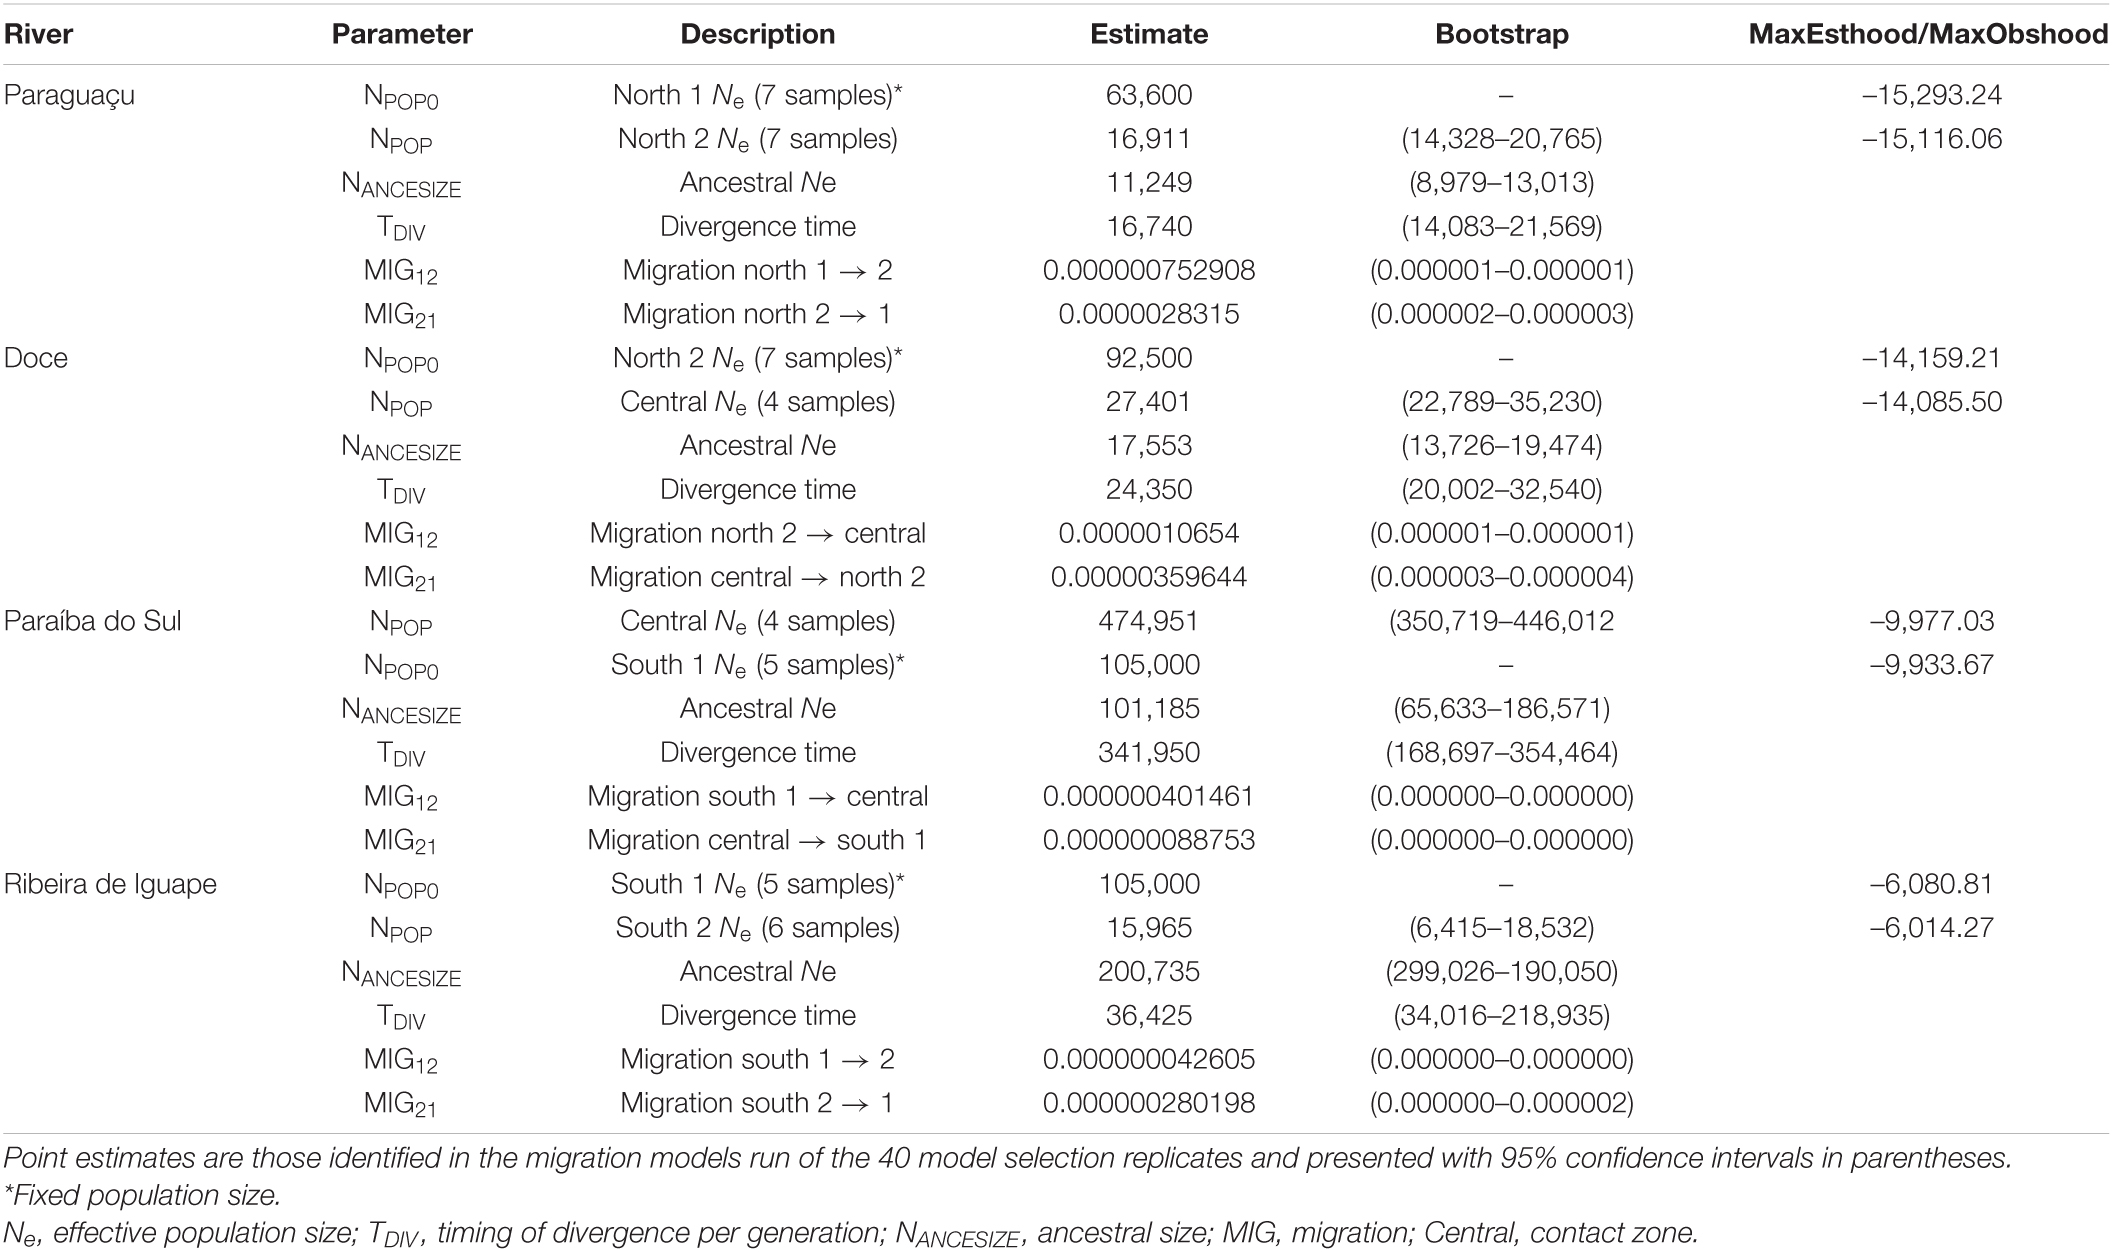
Table 2. Parameter estimates for the Dendropsophus elegans divergence time along different rivers.
The X-ORIGIN analysis indicated a significant recent range expansion signature after the LGM for the north population in the southern direction (P-value = 0.00117). However, expansion was not detected for the south population (P-value = 0.72753). Further, samples located in southern Bahia and Minas Gerais state (included into the north population) presented higher pairwise Ψ statistics in comparison to the other localities (see Supplementary Table 3 in Supplementary Material 1), meaning that there is an expansion signature left in the data.
Correlation Between Phenotypic and Genomic Divergence
Variation of morphometric measures among D. elegans specimens did not evidence any specific pattern between north and south populations and the contact zone (see Supplementary Table 4 in Supplementary Material 2). The PCA visualizes the overlap of individual measurements between these two populations (PCA), where the first principal component (PC1) explained 63.83% of all morphometric variance, followed by PC2 and PC3 that explained 7.96% and 5.50%, respectively (Figure 4). The most important variable explaining the morphometric overlap between populations along PC1 is the SVL; in the PC2, the head length (HL) was the most relevant variable, followed by the HW in the PC3. In general, body sizes are similar among sampled localities, but there is emphasis on larger body size for individuals in a narrow coastal strip that extends from southern Bahia, south of Jequitinhonha River (18°S, 39°W), to the southwest of Espírito Santo state (19°S, 40°W).
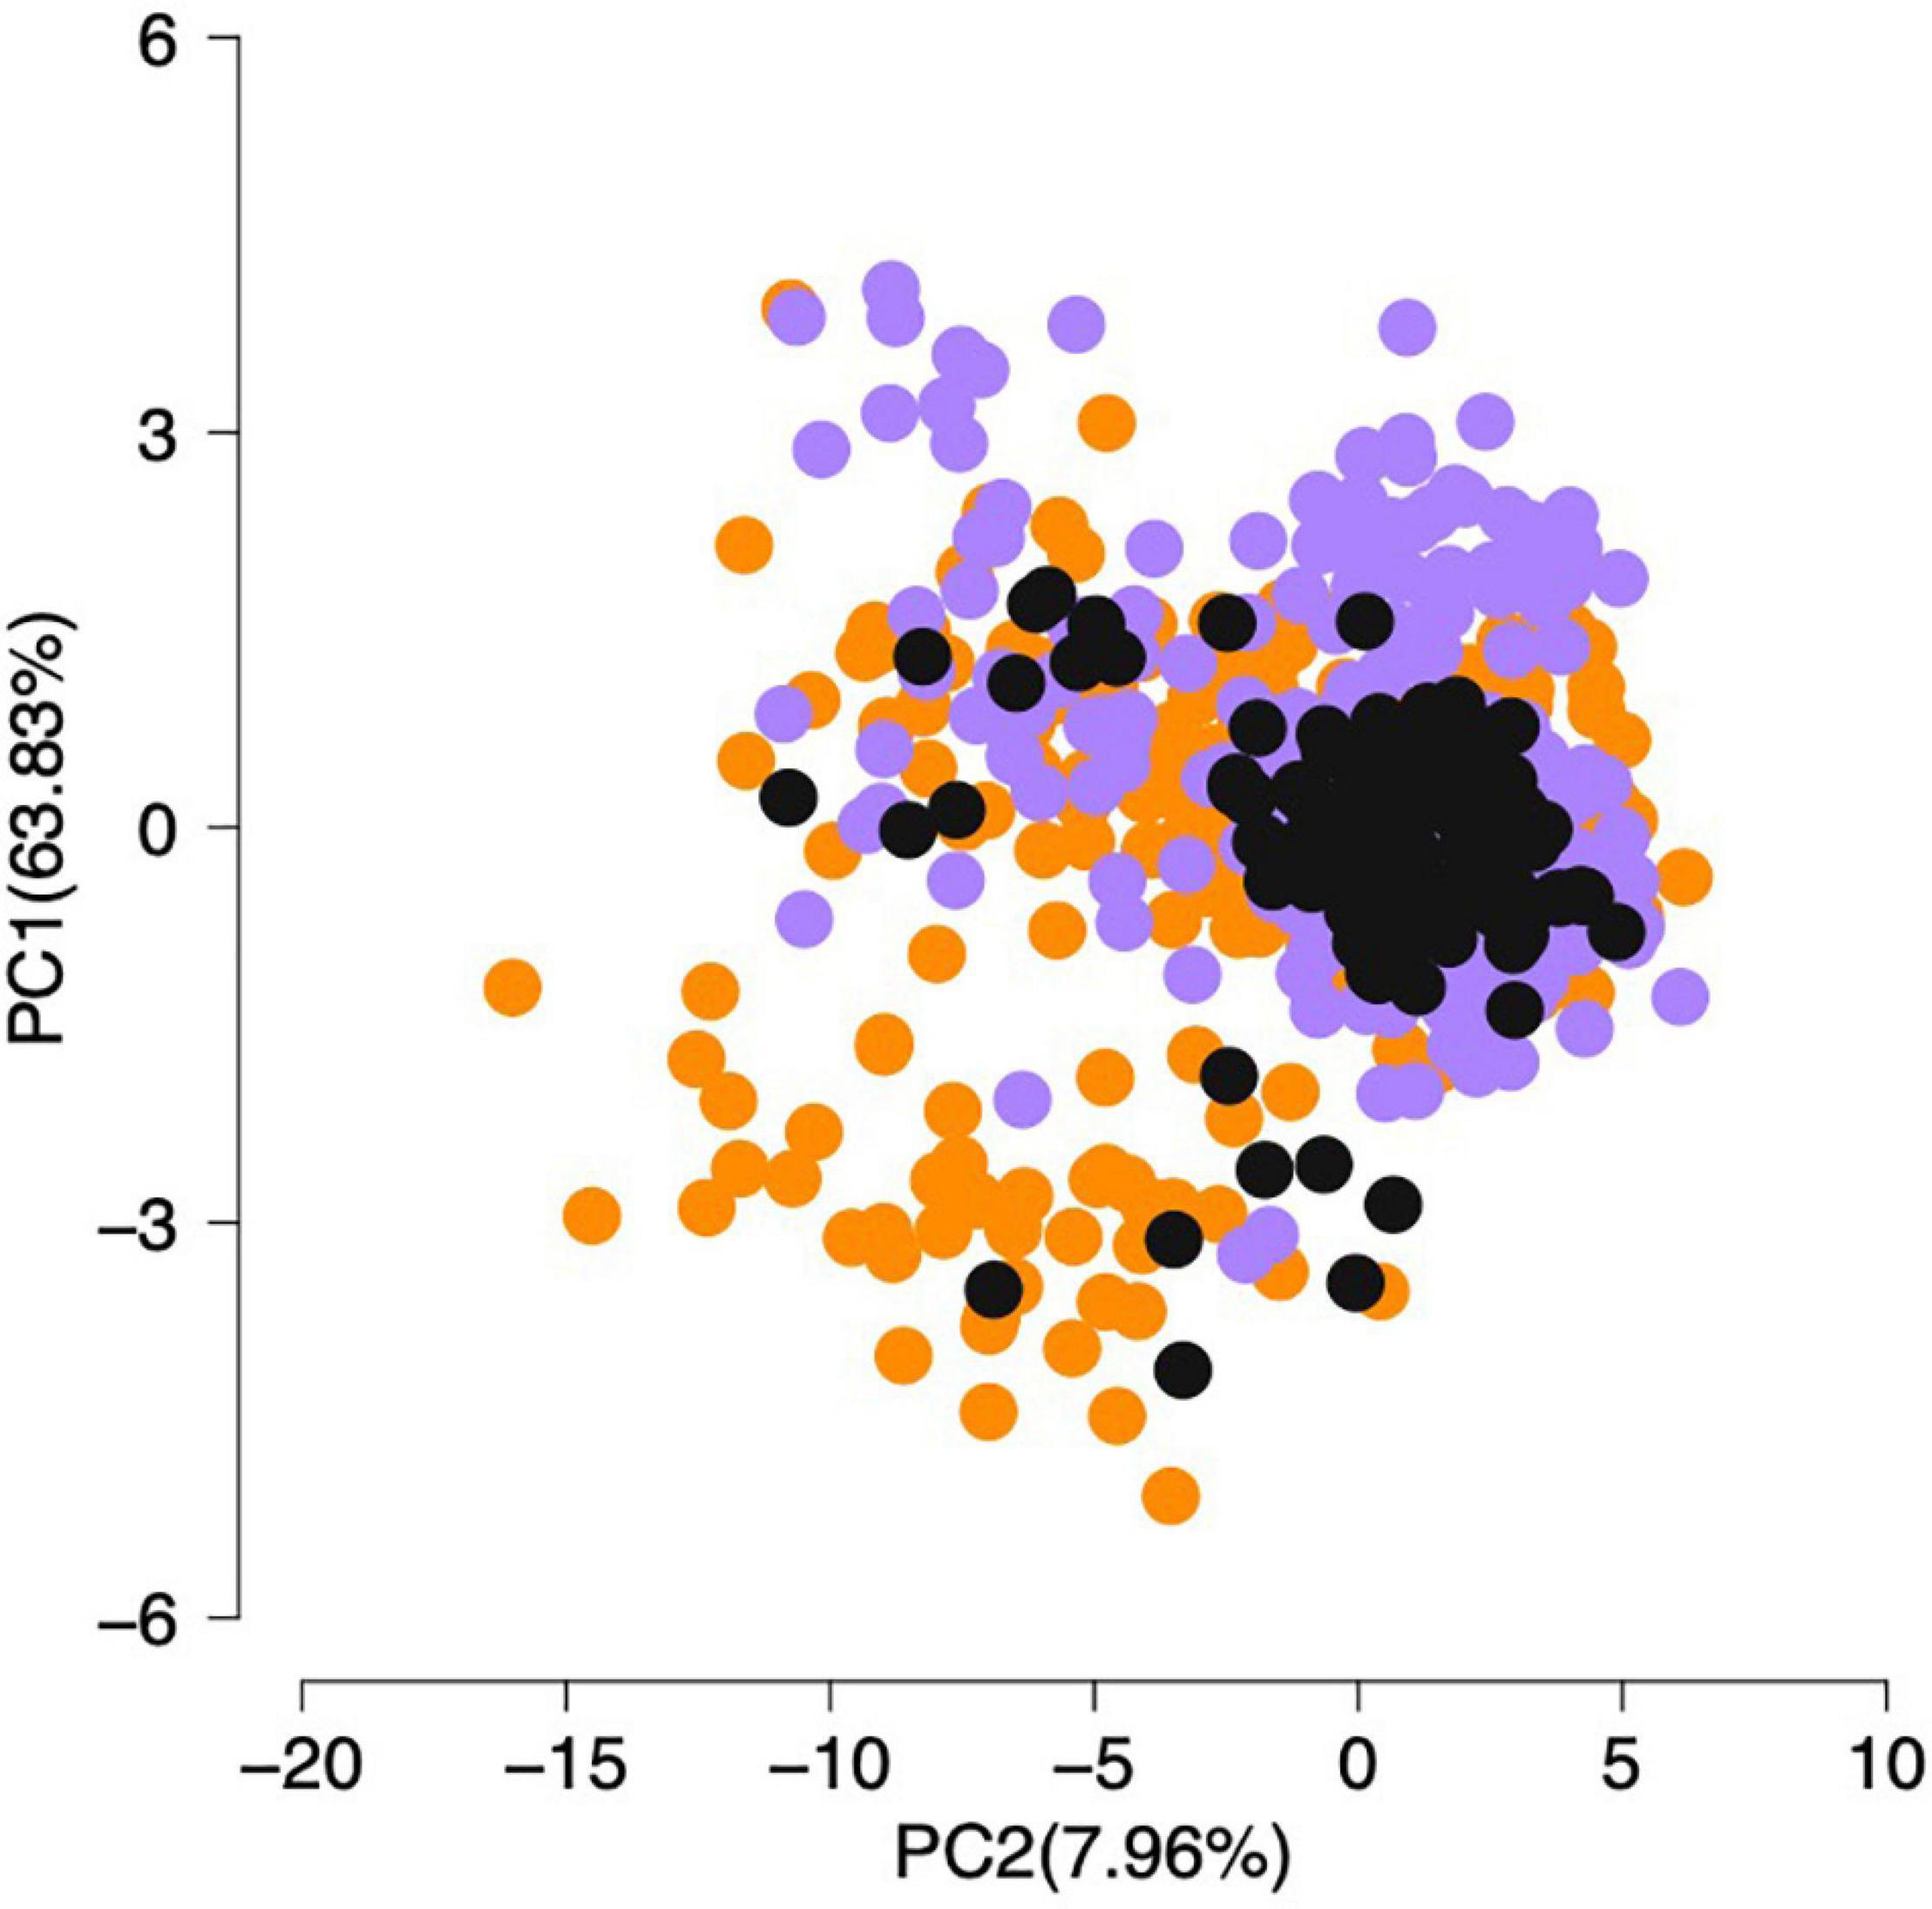
Figure 4. Principal component analysis (PCA) from morphometric data of Dendropsophus elegans samples. Colors are following the genomic population structure: north (orange), contact zone (dark gray), and south (purple).
For the dorsal pattern coloration results, no correlation was recovered for the upper surface of the forearm and the muzzle formats in dorsal view (P-value = 0.156 and 0.713, respectively). While we recognized spatial variation along with localities for the dorsal and upper shank surface patterns (see Figure 5), no correlation was found for the dorsal surface analysis (P-value = 0.06), and only the shank surface had a significant variation (P-value = 0.001) on the PERMANOVA analyses. The D1 body pattern was the most frequent (80% of the individuals) distributed along the species range. The D2 pattern occurred in almost all the localities but was infrequent (18.2% of the individuals) and tended to decrease or disappear on the extremes of the species distribution. The D3 pattern was the most uncommon (1.2% of the individuals), only occurring in the contact zone region, concentrated at Minas Gerais and Espírito Santo states, located in the region of the Doce River valley. The T1 upper shank surface pattern occurred in most localities (69.8% of the individuals) and was more frequent along the southern localities, decreasing considerably northwards. The opposite situation happened for the T2 pattern, which decreases in frequency southwards. The pattern T3 only appeared in the center of the species distribution, with a very low frequency (5.8% of the individuals) (for details, see Figure 5 and Supplementary Table 3 in Supplementary Material 2).
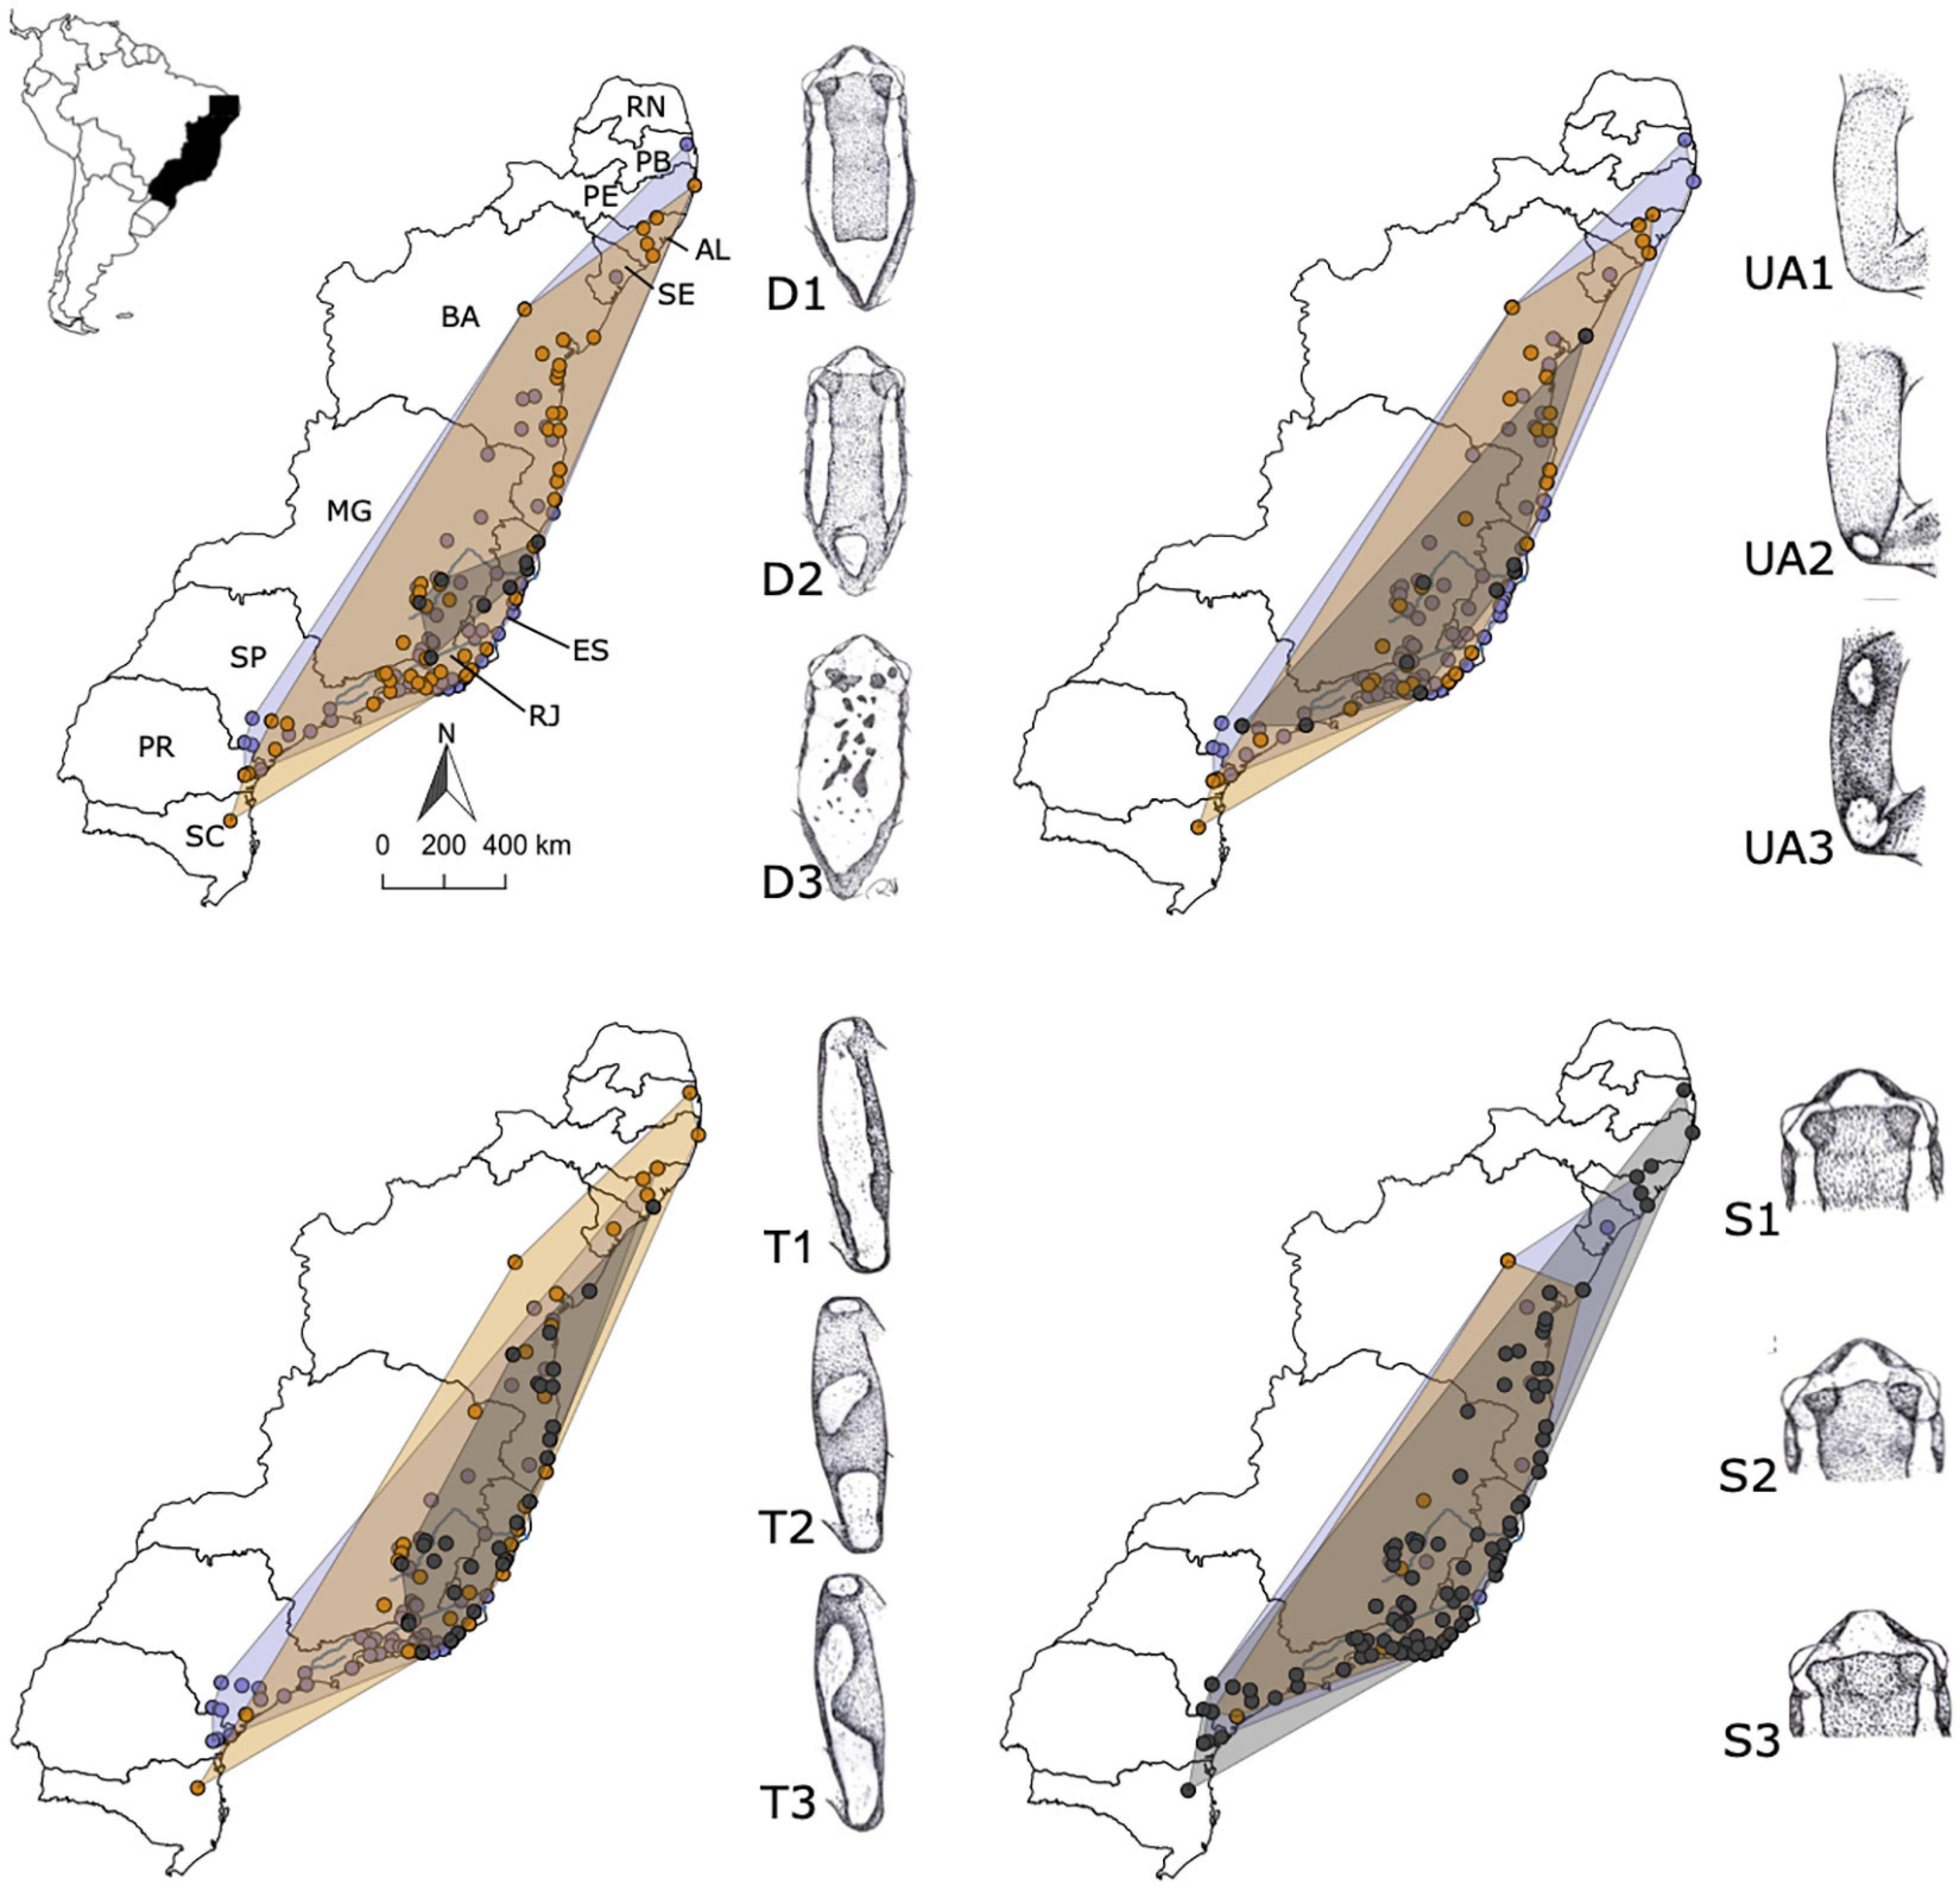
Figure 5. Distribution maps and illustration of the dorsal coloration patterns found within sampled individuals of Dendropsophus elegans, with range shapes colored by genomic populations: south (purple: patterns D1, UA1, T1, and S1); north (orange: D2, UA2, T2, and S2); and contact zone (dark gray: D3, UA3, T3, and S3). Brazilian states: Rio Grande do Norte (RN), Paraíba (PB), Alagoas (AL), Sergipe (SE), Bahia (BA), Espírito Santo (ES), Minas Gerais (MG), Rio de Janeiro (RJ), São Paulo (SP), Paraná (PR), and Santa Catarina (SC).
Discussion
By analyzing genome-wide SNPs of D. elegans populations, our study revealed a strongly resolved phylogeny with three main clades distributed along a latitudinal gradient, consistent with the mitochondrial pattern previously recovered (Tonini et al., 2013). A recent genomic study at the species group level also demonstrated an initial separation of D. elegans into three lineages dated for the Plio-Pleistocene delimited by the Paraguaçu and Doce Rivers (3-2 Mya; see Pirani et al., 2020). Here we show that, following a relatively long period of low divergence (e.g., long-branches on Pirani et al., 2020), population history of D. elegans became very dynamic over short time intervals, probably associated with climatic fluctuations and riverine barriers in the AF. We found support for the riverine barrier hypothesis structuring population along a north–south gradient in different time periods but also allowing gene flow between rivers margins. It is also likely that a recent range expansion in the north population after the LGM (∼21 Kya) had caused an admixture event between the north and south populations by secondary contact. This result was also supported by Tonini et al. (2013) for the clades from southern Bahia, causing admixture at the central portion of the environmental gradient. During the LGM, cold temperatures supposedly promoted forest reduction into a large forest refugium to the north of the Doce River (Bahia refuge) and scattered refugia to the south. This colder and drier period was subsequently followed by warmer temperatures and expansion of the AF areas (Carnaval and Moritz, 2008), which could have facilitated secondary contact and gene flow between D. elegans in central AF (see also Peres et al., 2020).
We found support for three main intraspecific clades as a result of tree-building methods (see Figure 2 and Supplementary Figure 3 in Supplementary Material 1) with a high pairwise genetic differentiation between them (see Table 1). In contrast, the population structure analysis recovered two populations, north and south, with admixture between them along a contact zone – in which samples correspond to the central clade on the genealogical analyses (see Figure 2). The lack of evidence for the contact zone as a third unit in the population genetics analysis might be expected since the other analyses performed recovered a recent admixture event. Despite a known bias that introduces a problem of selecting the optimal number of clusters, where the ΔK method tends to frequently identify K = 2, even when more subpopulations are present (Janes et al., 2017), it is unlikely that our recovered K = 2 was an artifact of an analytical problem, but rather the pattern resultant from biological events, such as admixture. Another interesting fact resulting from our tree-building methods is that the phylogenetic splits do not follow the exact divergence times for each river (see Table 2). This result could be explained by gene flow among populations over time across river margins or changes in the river course, allowing gene flow in different time periods. The reconstruction of the phylogenetic method used for this study is exploratory and does not consider population parameters and migration among individuals and clades.
Our results have been consistent in terms of the relative impact of rivers in the species genetic structure and diversification, where all the major AF rivers coincide with species genetic breaks, though with different divergence times, and also allow varying degrees of migration between margins, acting as “soft” barriers. Although we find gene flow and secondary contact between populations, these events seem restricted to the Pleistocene (see Table 2). Our results make a compelling case for the association of Doce and Paraíba do Sul Rivers separating populations, and their relative role in the species diversification process (Tonini et al., 2013; review Peres et al., 2020). For instance, the Doce River has been consistently recovered as a geographic barrier by different analyses for D. elegans. At the same time, the Paraíba do Sul River was not detected as a barrier by the EEMS analysis (see Figure 3). Such results demonstrate the different impacts of gene flow on species population structure, which could also be responsible for the ecological and phenotypic uniformity of D. elegans (e.g., Zamudio et al., 2016). Other geographic barriers recovered in this study seem to restrict gene flow across D. elegans populations and not only the Paraguaçu River (Figures 2, 3) as discussed in a large study for the species group, where D. elegans belongs to (see Pirani et al., 2020). Beyond rivers, the fact that an area of reduced gene flow inferred by EEMS does not precisely match the location of the Riberia de Iguape River raises the question that other environmental or geomorphologic barriers may be responsible for the D. elegans divergence process. This location presents a species turnover due to the different AF ecoregions, where the north geographic distribution of Araucaria mixed forest (north distribution between Tietê and Ribeira Rivers) could be responsible for the highest restriction of gene flow detected for the EEMS analysis (Figure 3; see also Thomé et al., 2014; Peres et al., 2020).
Despite physical barriers restricting species movements and affecting genetic variation (e.g., Pellegrino et al., 2005; Damasceno et al., 2021), organismal dispersal ability is also potentially correlated to species ecology and environmental variation. Yet, it is not surprising that the region between Doce and Paraíba do Sul was a contact region for D. elegans populations. This region is known as a turnover from the northeast and southeast of AF community composition (plants and animals – Fiaschi and Pirani, 2009; Peres et al., 2020), which have accumulated significant species differences to produce such pattern (see Brown et al., 2020), and it could also explain the oldest divergence time recovered for the Paraíba do Sul River (see Table 2; Rezende et al., 2020). Thomé et al. (2012) highlighted this region as a contact zone between a north range species – Rhinella crucifer and a south range species – Rhinella ornata, resulting in the hybrid species – Rhinella pombali. The support for this congruence comes from the marked environmental differences accumulated between north and south of AF due to climatic and refugia dynamism (Carnaval et al., 2014), added to a complex topography, where past landscape changes driven by climatic fluctuations from old periods, not only Pleistocene, could have different effects on species diversification (Thomé et al., 2010, 2012, 2014; Leite et al., 2016). Even though D. elegans is a common species that occupies natural and human-impacted ecosystems, environmental differences along the AF and the cold temperatures during different periods could also have caused a reduction of gene flow between north and south populations, helping drive the genetic differences present in this study (see Paz et al., 2020).
We found a latitudinal variation on the species phenotypic pattern that contrasts with the genetic pattern. Individuals from the north and south extremes have more phenotypic similarities than individuals from the contact zone. Such result recognizes differences, even if not significant for most of the characteristics, in the frequency of species dorsal pattern (one of the diagnostic characters of the species group; Figure 5) related to geography, highlighting less phenotypic disparity between individuals from the north and south ranges than from the contact zone. In the north, individuals’ dorsal pattern is mostly a continuous white line around the dorsal side, legs and arms. In contrast, individuals from the south have the same pattern but discontinued lines (Figure 5). Individuals in the contact zone show both dorsal patterns associated with north and south populations, in addition to the appearance of other phenotypes, the D3 pattern. As demonstrated by our results, these phenotypes are not associated with species differences, where the contact zone pattern is shared with the north and south clades. The increased diversity of D. elegans phenotypes in the contact zone could have resulted from the recent admixture events between north and south populations. This uncoupling between genetic and phenotypic variation can be caused by several evolutionary processes (Zamudio et al., 2016). For example, phylogeographic structure with little or non-detectable phenotypic variation or when variation patterns are not geographically cohesive, such as seem to be the case of D. elegans, it can be maintained through evolutionary processes such as retention of ancestral polymorphism, parallel adaptation to locally variable conditions or phenotypic plasticity (Zamudio et al., 2016). Understanding the adaptive value of the phenotypic variation along the AF environmental gradients is key to sorting out these processes, and our results can help target sampling to test them.
A hypothesis to explain why geographically distant populations of D. elegans would have less phenotypic disparity but higher genetic differences, is that since these populations are isolated by distance there are reduced opportunities for character displacement and reinforcement, and environment and species pressures in the ancestral range would be the same as in the derived range of genetic clusters (Pyron et al., 2015). Suppose past environmental conditions are similar and there is no selection on character displacement on the latitudinal extremes of D. elegans range due to isolation by distance. In that case, disjunct populations might tend to retain ancestral phenotypic conditions (Zamudio et al., 2016). In contrast, secondary contact with admixture between north and south populations along the contact zone would lead to higher rates of character displacement away from the phenotypes observed in north and south, resulting in higher phenotypic diversity (e.g., Barrera-Guzman et al., 2018). Thus, the unique existence of a dorsal color phenotype at the contact zone could indicate early stages of character displacement, but more in-depth phenotypic analyses are needed to confirm or refute this hypothesis.
Even though mitochondrial and genomic distance between north and south clades are high – 9.3% (Tonini et al., 2013) and FST = 0.40 (Table 1) indicating them as evolutionarily independent genomic lineages (see also Pirani et al., 2020), gene flow was recovered along genetic breaks (see section “Results”). Estimated divergence analysis demonstrated that different clades of D. elegans have not had enough time since isolation to accumulate phenotypic differences (see Supplementary Table 4 in Supplementary Material 2 and Figure 5), not confirming the taxonomic hypothesis of multiple species. For instance, the effort by Forti et al. (2017) analyzing acoustic traits of D. elegans for these three clades did not find consistent differences in advertisement calls among individuals correlated with the species phylogeography. Instead, males from distant sites were grouped together without any population congruence.
Conclusion
The phylogeographic history of D. elegans supports three main distinct clades separated into two geographically structured populations distributed at the AF northern and southern ranges, with a contact zone. Genomic breaks coincided with the main AF rivers (Ribeira de Iguape, Paraíba do Sul, Doce, and Paraguaçu), suggesting their strong role in the species diversification process even though allowing gene flow in certain periods. Moreover, based on the species’ natural history and the AF palaeoenvironmental dynamic, we corroborate the role of forest refugia during the Pleistocene impacting population structure for this species by a recent range expansion in the north population after the LGM, allowing a secondary contact between north and south lineages (see Table 1). Our results also confirm the pattern of isolation by distance for D. elegans. Finally, the latitudinal variation on D. elegans phenotypic pattern contrasts with the genetic pattern, with north and south presenting more phenotypic similarities than the contact zone. Such a pattern can be explained by phenotypic plasticity of the evaluated traits and by the recent times of divergence, where there has been insufficient time to accumulate enough phenotypic differences to support the taxonomic hypothesis of multiple species.
Data Availability Statement
Supplementary Material for the analyses performed here can be found online at the GitHub repository (https://github.com/renatapirani/Deep_genomic_divergence_and_phenotypic_admixture_of_the_treefrog_Dendropsophus_elegans). The raw data and accession number(s) can be found below: NCBI SRA BioProject, accession number PRJNA773141.
Ethics Statement
Ethical review and approval was not required for this study in accordance with the local legislation and institutional requirements.
Author Contributions
RP, FW, and JT designed the study. RP, FW, and LK contributed with funding and resources. MN and LE contributed with the phenotypic data. RP carried out the molecular lab work and data analysis, with help from AT and JT. RP, AT, FW, and JT drafted the manuscript. All authors reviewed and approved the manuscript.
Funding
RP received a Doctoral Fellowship from Conselho Nacional de Desenvolvimento Científico e Tecnológico (CNPq: 140088/20180) and a Fellowship for Internship abroad (CNPq: Science without Borders: 2014/22444-0). JT thanks the Science without Borders/CAPES (BEX 1187-13-9), Lemann Foundation and David Rockefeller Center for Latin American Studies, Harvard University for funding support and postdoctoral fellowship. MN thanks CNPq for research productivity grants (302542/2008-6 and 310490/2018-9). LE thanks the Programa de Pós-Graduação em Diversidade Animal, Universidade Federal da Bahia, for financial support, and the Coordenação de Aperfeiçoamento de Ensino Superior (CAPES) for granting her Master’s Scholarship. FW thanks CNPq (projects 475559/2013-4 and 425571/2018-1; productivity fellowship 305535/2017-0 and 311504/2020-5), Fundação de Amparo à Pesquisa do Estado do Amazonas (FAPEAM; projects 062.00665/2015, 062.01110/2017, and 062.00962/2018), Partnerships for Enhanced Engagement in Research from the U.S. National Academy of Sciences and U.S. Agency of International Development-PEER NAS/USAID (project AID-OAA-A-11-00012), and the L’Oreal-UNESCO For Women In Science Program (Brazil 2016 and IRT 2017) for financial support. This study was financed in part by the Coordenação de Aprefeiçoamento de Pessoal de Nível Superior – Brasil (CAPES) – Finance Code 001.
Conflict of Interest
The authors declare that the research was conducted in the absence of any commercial or financial relationships that could be construed as a potential conflict of interest.
Publisher’s Note
All claims expressed in this article are solely those of the authors and do not necessarily represent those of their affiliated organizations, or those of the publisher, the editors and the reviewers. Any product that may be evaluated in this article, or claim that may be made by its manufacturer, is not guaranteed or endorsed by the publisher.
Acknowledgments
We thank Instituto Chico Mendes de Conservação da Biodiversidade for issuing collecting permits. We are grateful to the following researchers and institutions (complete acronyms on the Supplementary Material) that generously granted us tissues samples and/or specimens under their care: Adrian A. Garda (UFRN), Ana Lúcia C. Prudente (MPEG), Antoine Fouquet (CNRS), Antônio J. S. Argôlo (UESC), Camila C. Ribas (INPA), Célio F. B. Haddad (UNESP), Eliza M. X. Freire (UFRN), Flora A. Juncá (UEFS), Gilda V. Andrade (UFM), Gláucia Pontes (PUCRS), Guarino R. Colli (CHUNB), Hussam Zaher (USP), José P. Pombal Jr. (MNRJ), Julio C. M. Leite (MHNCI), Leonora P. Costa (UFES), Miguel T. Rodrigues (USP), Renato N. Feio (UFV), Richard G. Vogt (INPA), Sérgio P. Carvalho e Silva (UFRJ), Teresa C. S. Ávila-Pires (MPEG), Ulisses Galatti (MPEG), and Ulisses Caramaschi (MNRJ). LE thanks Luiz N. Weber (UFSB) for donation of specimens of D. elegans from the state of Rio de Janeiro, Brazil, and Rafael O. Abreu (UFBA) for line drawings of D. elegans. RP thanks all the members of my Doctoral Program, Knowles and Werneck Labs for the discussions and feedback, especially Joyce Prado. RP thanks Rodrigo Tinoco for the species picture. We thank Eduardo Prata, Pedro Peloso, Antoine Fouquet, Igor Kaefer, and Albertina Lima for helpful comments in early versions of the manuscript. We thank Smithsonian Tropical Research Institute for the computing cluster. We also thank the INPA/GCBEV and POSGRAD 2021/FAPEAM for the financial support with the publication, and the four reviewers for comments on the manuscript.
Supplementary Material
The Supplementary Material for this article can be found online at: https://www.frontiersin.org/articles/10.3389/fevo.2022.765977/full#supplementary-material
Footnotes
References
Ab’Saber, A. N. (1977). Espaços ocupados pela expansão dos climas secos na América do Sul, por ocasião dos períodos glaciais quaternários. São Paulo: Universidade de São Paulo, 1–19.
Antonelli, A., Ariza, M., Albert, J., Andermann, T., Azevedo, J., Bacon, C., et al. (2018). Conceptual and empirical advances in Neotropical biodiversity research. PeerJ 6:e5644.
Antonelli, A., Quijada-Mascareñas, A., Crawford, A. J., Bates, J. M., Velazco, P. M., and Wüster, W. (2010). “Molecular studies and phylogeography of Amazonian tetrapods and their relation to geological and climatic models,” in Amazonia, Landscape and Species Evolution: A Look Into the Past, eds C. Hoorn and F. P. Wesselingh (Chichester: John Wiley & Sons).
Barrera-Guzman, A. O., Aleixo, A., Shawkey, M. D., and Weir, J. T. (2018). Hybrid speciation leads to novel male secondary sexual ornamentation of an Amazonian bird. Proc. Natl. Acad. Sci. U. S. A. 115, E218–E225. doi: 10.1073/pnas.1717319115
Bivand, R. (2006). Implementing spatial data analysis software tools in R. Geogr. Anal. 38, 23–40. doi: 10.1111/j.0016-7363.2005.00672.x
Brown, J. L., Paz, A., Reginato, M., Renata, C. A., Assis, A., Lyra, M., et al. (2020). Seeing the forest through many trees: multi-taxon patterns of phylogenetic diversity in the Atlantic Forest hotspot. Divers. Distrib. 26, 1160–1176.
Cabanne, G. S., d’Horta, F. M., Sari, E. H., Santos, F. R., and Miyaki, C. Y. (2008). Nuclear and mitochondrial phylogeography of the Atlantic forest endemic Xiphorhynchus fuscus (Aves: Dendrocolaptidae): biogeography and systematics implications. Mol. Phylogenet. Evol. 49, 760–773. doi: 10.1016/j.ympev.2008.09.013
Carnaval, A. C., Hickerson, M. J., Haddad, C. F., Rodrigues, M. T., and Moritz, C. (2009). Stability predicts genetic diversity in the Brazilian Atlantic forest hotspot. Science 323, 785–789. doi: 10.1126/science.1166955
Carnaval, A. C., and Moritz, C. (2008). Historical climate modelling predicts patterns of current biodiversity in the Brazilian Atlantic forest. J. Biogeogr. 35, 1187–1201. doi: 10.1111/j.1365-2699.2007.01870.x
Carnaval, A. C., Waltari, E., Rodrigues, M. T., Rosauer, D., VanDerWal, J., Damasceno, R., et al. (2014). Prediction of phylogeographic endemism in an environmentally complex biome. Proc. Biol. Sci. 281:20141461. doi: 10.1098/rspb.2014.1461
Cazé, A. L. R., Mader, G., Nunes, T. S., Queiroz, L. P., Oliveira, G., Diniz-Filho, J. A. F., et al. (2016). Could refuge theory and rivers acting as barriers explain the genetic variability distribution in the Atlantic Forest? Mol. Phylogenet. Evol. 101, 242–251. doi: 10.1016/j.ympev.2016.05.013
Cheng, H., Sinha, A., Cruz, F. W., Wang, X., Edwards, R. L., d’Horta, F. M., et al. (2013). Climate change patterns in Amazonia and biodiversity. Nat. Commun. 4:1411. doi: 10.1038/ncomms2415
Chifman, J., and Kubatko, L. (2014). Quartet inference from SNP data under the coalescent model. Bioinformatics 30, 3317–3324. doi: 10.1093/bioinformatics/btu530
Costa, L. P. (2003). The historical bridge between the Amazon and the Atlantic forest of Brazil a study of molecular phylogeography with small mammals. J. Biogeogr. 30, 71–86. doi: 10.1046/j.1365-2699.2003.00792.x
Damasceno, R. P., Carnaval, A. C., Sass, C., Recober, R. S., Moritz, C., and Rodrigues, M. T. (2021). Geographic restriction, genetic divergence, and morphological disparity in the Brazilian Atlantic Forests: insights from Leposoma lizards (Gymnophthalmidae, Squamata). Mol. Phylogenet. Evol. 154:106993. doi: 10.1016/j.ympev.2020.106993
Dias, I. R., Haddad, C. F., Argolo, A. J., and Orrico, V. G. (2017). The 100th: an appealing new species of Dendropsophus (Amphibia: Anura: Hylidae) from northeastern Brazil. PLoS One 12:e0171678. doi: 10.1371/journal.pone.0171678
Duellman, W. E. (1974). A reassessment of the taxonomic status of some neotropical hylid frogs. Occas. Pap. Mus. Nat. Hist. Univ. Kansas 27, 1–27.
Duellman, W. E., Marion, A. B., and Hedges, S. B. (2016). Phylogenetics, classification, and biogeography of the treefrogs (Amphibia: Anura: Arboranae). Zootaxa 4104, 1–109. doi: 10.11646/zootaxa.4104.1.1
Dugas, M. B., Halbrook, S. R., Killius, A. M., del Sol, J. F., and Richards-Zawacki, C. L. (2015). Colour and Escape Behaviour in Polymorphic Population of an Aposematic Poison Frog. Ethology 121, 813–822. doi: 10.1111/eth.12396
Earl, D. A., and vonHoldt, B. M. (2011). STRUCTURE HARVESTER: a website and program for visualizing STRUCTURE output and implementing the Evanno method. Conserv. Genet. Resour. 4, 359–361. doi: 10.1007/s12686-011-9548-7
Eaton, D. A. (2014). PyRAD: assembly of de novo RADseq loci for phylogenetic analyses. Bioinformatics 30, 1844–1849. doi: 10.1093/bioinformatics/btu121
Eaton, D. A. R., and Overcast, I. (2020). ipyrad: interactive assembly and analysis of RADseq datasets. Bioinformatics 36, 2592–2594. doi: 10.1093/bioinformatics/btz966
Evanno, G., Regnaut, S., and Goudet, J. (2005). Detecting the number of clusters of individuals using the software STRUCTURE: a simulation study. Mol. Ecol. 14, 2611–2620. doi: 10.1111/j.1365-294X.2005.02553.x
Excoffier, L., Dupanloup, I., Huerta-Sanchez, E., Sousa, V. C., and Foll, M. (2013). Robust demographic inference from genomic and SNP data. PLoS Genet. 9:e1003905. doi: 10.1371/journal.pgen.1003905
Excoffier, L., and Foll, M. (2011). Fastsimcoal: a continuous-time coalescent simulator of genomic diversity under arbitrarily complex evolutionary scenarios. Bioinformatics 27, 1332–1334. doi: 10.1093/bioinformatics/btr124
Excoffier, L., and Lischer, H. E. (2010). Arlequin suite ver 3.5: a new series of programs to perform population genetics analyses under Linux and Windows. Mol. Ecol. Resour. 10, 564–567. doi: 10.1111/j.1755-0998.2010.02847.x
Fiaschi, P., and Pirani, J. R. (2009). Review of plant biogeographic studies in Brazil. J. Syst. Evol. 47, 477–496.
Forti, L. R., Lingnau, R., Encarnacao, L. C., Bertoluci, J., and Toledo, L. F. (2017). Can treefrog phylogeographical clades and species’ phylogenetic topologies be recovered by bioacoustical analyses? PLoS One 12:e0169911. doi: 10.1371/journal.pone.0169911
Gehara, M., Crawford, A. J., Orrico, V. G., Rodriguez, A., Lotters, S., Fouquet, A., et al. (2014). High levels of diversity uncovered in a widespread nominal taxon: continental phylogeography of the neotropical tree frog Dendropsophus minutus. PLoS One 9:e103958. doi: 10.1371/journal.pone.0103958
He, Q., Prado, J. R., and Knowles, L. L. (2017). Inferring the geographic origin of a range expansion: latitudinal and longitudinal coordinates inferred from genomic data in an ABC framework with the program XORIGIN. Mol. Ecol. 26, 6908–6920. doi: 10.1111/mec.14380
Heyer, W. R., Rand, A. S., Cruz, C. A. G., Peixoto, O. L., and Nelson, C. E. (1990). Frogs of Boracéia. Arq. Zool. 31, 231–410.
Huang, J. P. (2016). Parapatric genetic introgression and phenotypic assimilation: testing conditions for introgression between Hercules beetles (Dynastes. Dynastinae). Mol. Ecol. 25, 5513–5526. doi: 10.1111/mec.13849
Izecksohn, E., and Carvalho-e-Silva, S. P. (2001). Anfiíbios do municiípio do Rio de Janeiro. Rio de Janeiro: UFRJ.
Janes, J. K., Miller, J. M., Dupuis, J. R., Malenfant, R. M., Gorrell, J. C., Cullingham, C. I., et al. (2017). The K = 2 conundrum. Mol. Ecol. 26, 3594–3602. doi: 10.1111/mec.14187
Kopelman, N. M., Mayzel, J., Jakobsson, M., Rosenberg, N. A., and Mayrose, I. (2015). Clumpak: a program for identifying clustering modes and packaging population structure inferences across K. Mol. Ecol. Resour. 15, 1179–1191. doi: 10.1111/1755-0998.12387
Leite, Y. L., Costa, L. P., Loss, A. C., Rocha, R. G., Batalha-Filho, H., Bastos, A. C., et al. (2016). Neotropical forest expansion during the last glacial period challenges refuge hypothesis. Proc. Natl. Acad. Sci. U. S. A. 113, 1008–1013. doi: 10.1073/pnas.1513062113
Leite, R. N., and Rogers, D. S. (2013). Revisiting Amazonian phylogeography: insights into diversification hypotheses and novel perspectives. Organ. Divers. Evol. 13, 639–664. doi: 10.1007/s13127-013-0140-8
Li, Y. L., and Liu, J. X. (2018). StructureSelector: a web based software to select and visualize the optimal number of clusters using multiple methods. Mol. Ecol. Resour. 18, 176–177. doi: 10.1111/1755-0998.12719
Lischer, H. E., and Excoffier, L. (2012). PGDSpider: an automated data conversion tool for connecting population genetics and genomics programs. Bioinformatics 28, 298–299. doi: 10.1093/bioinformatics/btr642
Lynch, M. (2010). Evolution of the mutation rate. Trends Genet. 26, 345–352. doi: 10.1016/j.tig.2010.05.003
Martins, F. M. (2011). Historical biogeography of the Brazilian Atlantic forest and the Carnaval–Moritz model of Pleistocene refugia: what do phylogeographical studies tell us? Biol. J. Linn. Soc. 104, 499–509. doi: 10.1111/j.1095-8312.2011.01745.x
Menezes, L., Batalha-Filho, H., Garda, A. A., and Napoli, M. F. (2020). Tiny treefrogs in the Pleistocene: phylogeography of Dendropsophus oliveirai in the Atlantic Forest and associated enclaves in northeastern Brazil. J. Zool. Syst. Evol. Res. 59, 179–194. doi: 10.1111/jzs.12422
Moura, M. R., Argôlo, A. J., and Costa, H. C. (2017). Historical and contemporary correlates of snake biogeographical subregions in the Atlantic Forest hotspot. J. Biogeogr. 44, 640–650. doi: 10.1111/jbi.12900
Napoli, M. F. (2005). A new species allied to Hyla circumdata (Anura: Hylidae) from Serra da Mantiqueira, southeastern Brazil. Herpetologica 61, 63–69. doi: 10.1655/03-41
Orrico, V. G. D., Grant, T., Faivovich, J., Rivera-Correa, M., Rada, M., Lyra, M. L., et al. (2021). The phylogeny of Dendropsophini (Anura: Hylidae: Hylinae). Cladistics 37, 73–106. doi: 10.1111/cla.12429
Paz, A., Brown, J. L., Cordeiro, C. L., Aguirre-Santoro, J., Assis, C., Amaro, R. C., et al. (2020). Environmental correlates of taxonomic and phylogenetic diversity in the Atlantic Forest. J Biogeogr. 48, 1377–1391. doi: 10.1111/jbi.14083
Pellegrino, K. C. M., Rodrigues, M. I., Waite, A. N., Morando, M., Yassuda, Y. Y., and Sites, J. W. (2005). Phylogeography and species limits in the Gymnodactylus darwinii complex (Gekkonidae, Squamata): genetic structure coincides with river systems in the Brazilian Atlantic Forest. Biol. J. Linn. Soc. 85, 13–26. doi: 10.1111/j.1095-8312.2005.00472.x
Peres, E. A., Pinto-da-Rocha, R., Lohmann, L. G., Michelangelo, F. A., Miyaki, C. Y., and Carnaval, A. C. (2020). “Patterns of Species and Lineage Diversity in the Atlantic Rainforest of Brazil,” in Fascinating Life Science, eds V. Rull and A. C. Carnaval (Switzerland: Springer), 415–447. doi: 10.1007/978-3-030-31167-4_16
Petkova, D., Novembre, J., and Stephens, M. (2016). Visualizing spatial population structure with estimated effective migration surfaces. Nat. Genet. 48, 94–100. doi: 10.1038/ng.3464
Pirani, R. M., Peloso, P. L. V., Prado, J. R., Polo, E., Knowles, L. L., Ron, S. R., et al. (2020). Diversification History of Clown Tree Frogs in Neotropical rainforests (Anura, Hylidae, Dendropsophus leucophyllatus group). Mol. Phylogenet. Evol. 150:106877.
Pirani, R. M., Werneck, F. P., Thomaz, A. T., Kenney, M. L., Sturaro, M. J., Avila-Pires, T. C. S., et al. (2019). Testing main Amazonian rivers as barriers across time and space within widespread taxa. J. Biogeogr. 46, 2444–2456.
Pritchard, J. K., Stephens, M., and Donnelly, P. (2000). Inference of population structure using multilocus genotype data. Genetics 155, 945–959.
Puechmaille, S. J. (2016). The program structure does not reliably recover the correct population structure when sampling is uneven: subsampling and new estimators alleviate the problem. Mol. Ecol. Resour. 16, 608–627. doi: 10.1111/1755-0998.12512
Pyron, R. A., Costa, G. C., Patten, M. A., and Burbrink, F. T. (2015). Phylogenetic niche conservatism and the evolutionary basis of ecological speciation. Biol. Rev. Camb. Philos. Soc. 90, 1248–1262. doi: 10.1111/brv.12154
R Core Team (2020). R: A Language and Environment for Statistical Computing. Vienna: R Foundation for Statistical Computing.
Resende, H. C., Yotoko, K. S. C., Delabie, J. H. C., Costa, M. A., Campiolo, S., Tavares, M., et al. (2010). Pliocene and Pleistocene events shaping the genetic diversity within the central corridor of the Brazilian Atlantic Forest. Biol. J. Linn. Soc. 101, 949–960. doi: 10.1111/j.1095-8312.2010.01534.x
Rezende, V. L., Pontara, V., Bueno, M. L., Berg, E. V. D., Miranda, P. L. S., Oliveira-Filho, A. T., et al. (2020). Phylogenetic regionalization of tree assemblages reveals novel patterns of evolutionary affinities in the Atlantic Forest. J. Biogeogr. 48, 798–810. doi: 10.1111/jbi.14038
Rivera-Correa, M., and Orrico, V. G. D. (2013). Description and phylogenetic relationships of a new species of treefrog of the Dendropsophus leucophyllatus group (Anura: Hylidae) from the Amazon basin of Colombia and with an exceptional color pattern. Zootaxa 3686:447. doi: 10.11646/zootaxa.3686.4.3
Rodríguez, A., Börner, M., Pabijan, M., Gehara, M., Haddad, C. F. B., and Vences, M. (2015). Genetic divergence in tropical anurans: deeper phylogeographic structure in forest specialists and in topographically complex regions. Evol. Ecol. 29, 765–785. doi: 10.1007/s10682-015-9774-7
Rull, V., and Carnaval, A. C. (2020). “Neotropical Diversification: Patterns and Processes,” in Fascinating Life Science, eds V. Rull and A. C. Carnaval (Switzerland: Springer), 51–70.
Rosauer, D., Laffan, S. W., Crisp, M. D., Donnellan, S. C., and Cook, L. G. (2009). Phylogenetic endemism: a new approach for identifying geographical concentrations of evolutionary history. Mol. Ecol. 18, 4061–4072. doi: 10.1111/j.1365-294X.2009.04311.x
Sabbag, A. F., Lyra, M. L., Zamudio, K. R., Haddad, C. F. B., Feio, R. N., Leite, F. S. F., et al. (2018). Molecular phylogeny of Neotropical rock frogs reveals a long history of vicariant diversification in the Atlantic forest. Mol. Phylogenet. Evol. 122, 142–156. doi: 10.1016/j.ympev.2018.01.017
Saiter, F. Z., Brown, J. L., Thomas, W. W., Oliveira-Filho, A. T., and Carnaval, A. C. (2016). Environmental correlates of floristic regions and plant turnover in the Atlantic forest hotspot. J. Biogeogr. 43, 2322–2331.
Sheu, Y., Zurano, J. P., Ribeiro-Junior, M. A., Ávila-Pires, T. C., Rodrigues, M. T., Colli, G. R., et al. (2020). The combined role of dispersal and niche evolution in the diversification of Neotropical lizards. Ecol. Evol. 10, 2608–2625. doi: 10.1002/ece3.6091
Stamatakis, A. (2014). RAxML version 8: a tool for phylogenetic analysis and post-analysis of large phylogenies. Bioinformatics 30, 1312–1313. doi: 10.1093/bioinformatics/btu033
Swofford, D. L. (2002). PAUP*. Phylogenetic Analysis Using Parsimony (*and Other Methods). Version 4. Sunderland: Sinauer Associates.
Thomaz, A. T., Malabarba, L. R., and Knowles, L. L. (2017). Genomic signatures of paleodrainages in a freshwater fish along the southeastern coast of Brazil: genetic structure reflects past riverine properties. Heredity 119, 287–294. doi: 10.1038/hdy.2017.46
Thomé, M. T. C., Zamudio, K. R., Giovanelli, J. G., Haddad, C. F., Baldissera, F. A., and Alexandrino, J. (2010). Phylogeography of endemic toads and post-Pliocene persistence of the Brazilian Atlantic Forest. Mol. Phylogenet. Evol. 55, 1018–1031. doi: 10.1016/j.ympev.2010.02.003
Thomé, M. T. C., Zamudio, K. R., Haddad, C. F., and Alexandrino, J. (2012). Delimiting genetic units in Neotropical toads under incomplete lineage sorting and hybridization. Evol. Biol. 12:242. doi: 10.1186/1471-2148-12-242
Thomé, M. T. C., Zamudio, K. R., Haddad, C. F., and Alexandrino, J. (2014). Barriers, rather than refugia, underlie the origin of diversity in toads endemic to the Brazilian Atlantic Forest. Mol. Ecol. 23, 6152–6164. doi: 10.1111/mec.12986
Tonini, J. F. R., Costa, L. P., and Carnaval, A. C. (2013). Phylogeographic structure is strong in the Atlantic Forest; predictive power of correlative paleodistribution models, not always. J. Zool. Syst. Evol. Res. 51, 114–121. doi: 10.1111/jzs.12014
Vanzolini, P. E., and Willians, E. E. (1970). South american anoles: the geographic differentiation and evolution of the anolis Chrysolepis species group (Sauria, Iguanidae). Arq. Zool. 19, 125–298. doi: 10.11606/issn.2176-7793.v19i3-4p125-298
Werneck, F. P., Leite, R. N., Geurgas, S. R., and Rodrigues, M. T. (2015). Biogeographic history and cryptic diversity of saxicolous Tropiduridae lizards endemic to the semiarid Caatinga. BMC Evol. Biol. 15:94. doi: 10.1186/s12862-015-0368-3
Wynn, A., and Heyer, W. R. (2001). Do geographically widespread species of tropical amphibians exist? An estimate of genetic relatedness within the neotropical frog Leptodactylus fuscus (Schneider 1799) (Anura Leptodactylidae). Trop. Zool. 14, 255–285. doi: 10.1080/03946975.2001.10531157
Keywords: phylogeography, ddRADSeq, refuge hypothesis, population structure, phenotypes, Neotropic, riverine barriers
Citation: Pirani RM, Tonini JFR, Thomaz AT, Napoli MF, Encarnação LC, Knowles LL and Werneck FP (2022) Deep Genomic Divergence and Phenotypic Admixture of the Treefrog Dendropsophus elegans (Hylidae: Amphibia) Coincide With Riverine Boundaries at the Brazilian Atlantic Forest. Front. Ecol. Evol. 10:765977. doi: 10.3389/fevo.2022.765977
Received: 28 August 2021; Accepted: 24 January 2022;
Published: 04 March 2022.
Edited by:
Rosane Garcia Collevatti, Universidade Federal de Goiás, BrazilReviewed by:
Xiaolei Huang, Fujian Agriculture and Forestry University, ChinaJiufeng Wei, Shanxi Agricultural University, China
Lucas Barrientos, Universidad del Rosario, Colombia
Cornelya Klutsch, Norwegian Genetic Resource Centre, Norwegian Institute of Bioeconomy Research (NIBIO), Norway
Copyright © 2022 Pirani, Tonini, Thomaz, Napoli, Encarnação, Knowles and Werneck. This is an open-access article distributed under the terms of the Creative Commons Attribution License (CC BY). The use, distribution or reproduction in other forums is permitted, provided the original author(s) and the copyright owner(s) are credited and that the original publication in this journal is cited, in accordance with accepted academic practice. No use, distribution or reproduction is permitted which does not comply with these terms.
*Correspondence: Renata M. Pirani, renatampirani@gmail.com
†Present address: Renata M. Pirani, Biology Department, University of Nevada, Reno, Reno, NV, United States